
Earnings Less Risk-Free Interest Charge (ERIC) and Stock Returns—A Value-Based Management Perspective on ERIC’s Relative and Incremental Information Content


Abstract
:1. Introduction
2. Theoretical Background and Hypotheses
2.1. The Association of Shareholder Value Metrics with Stock Returns
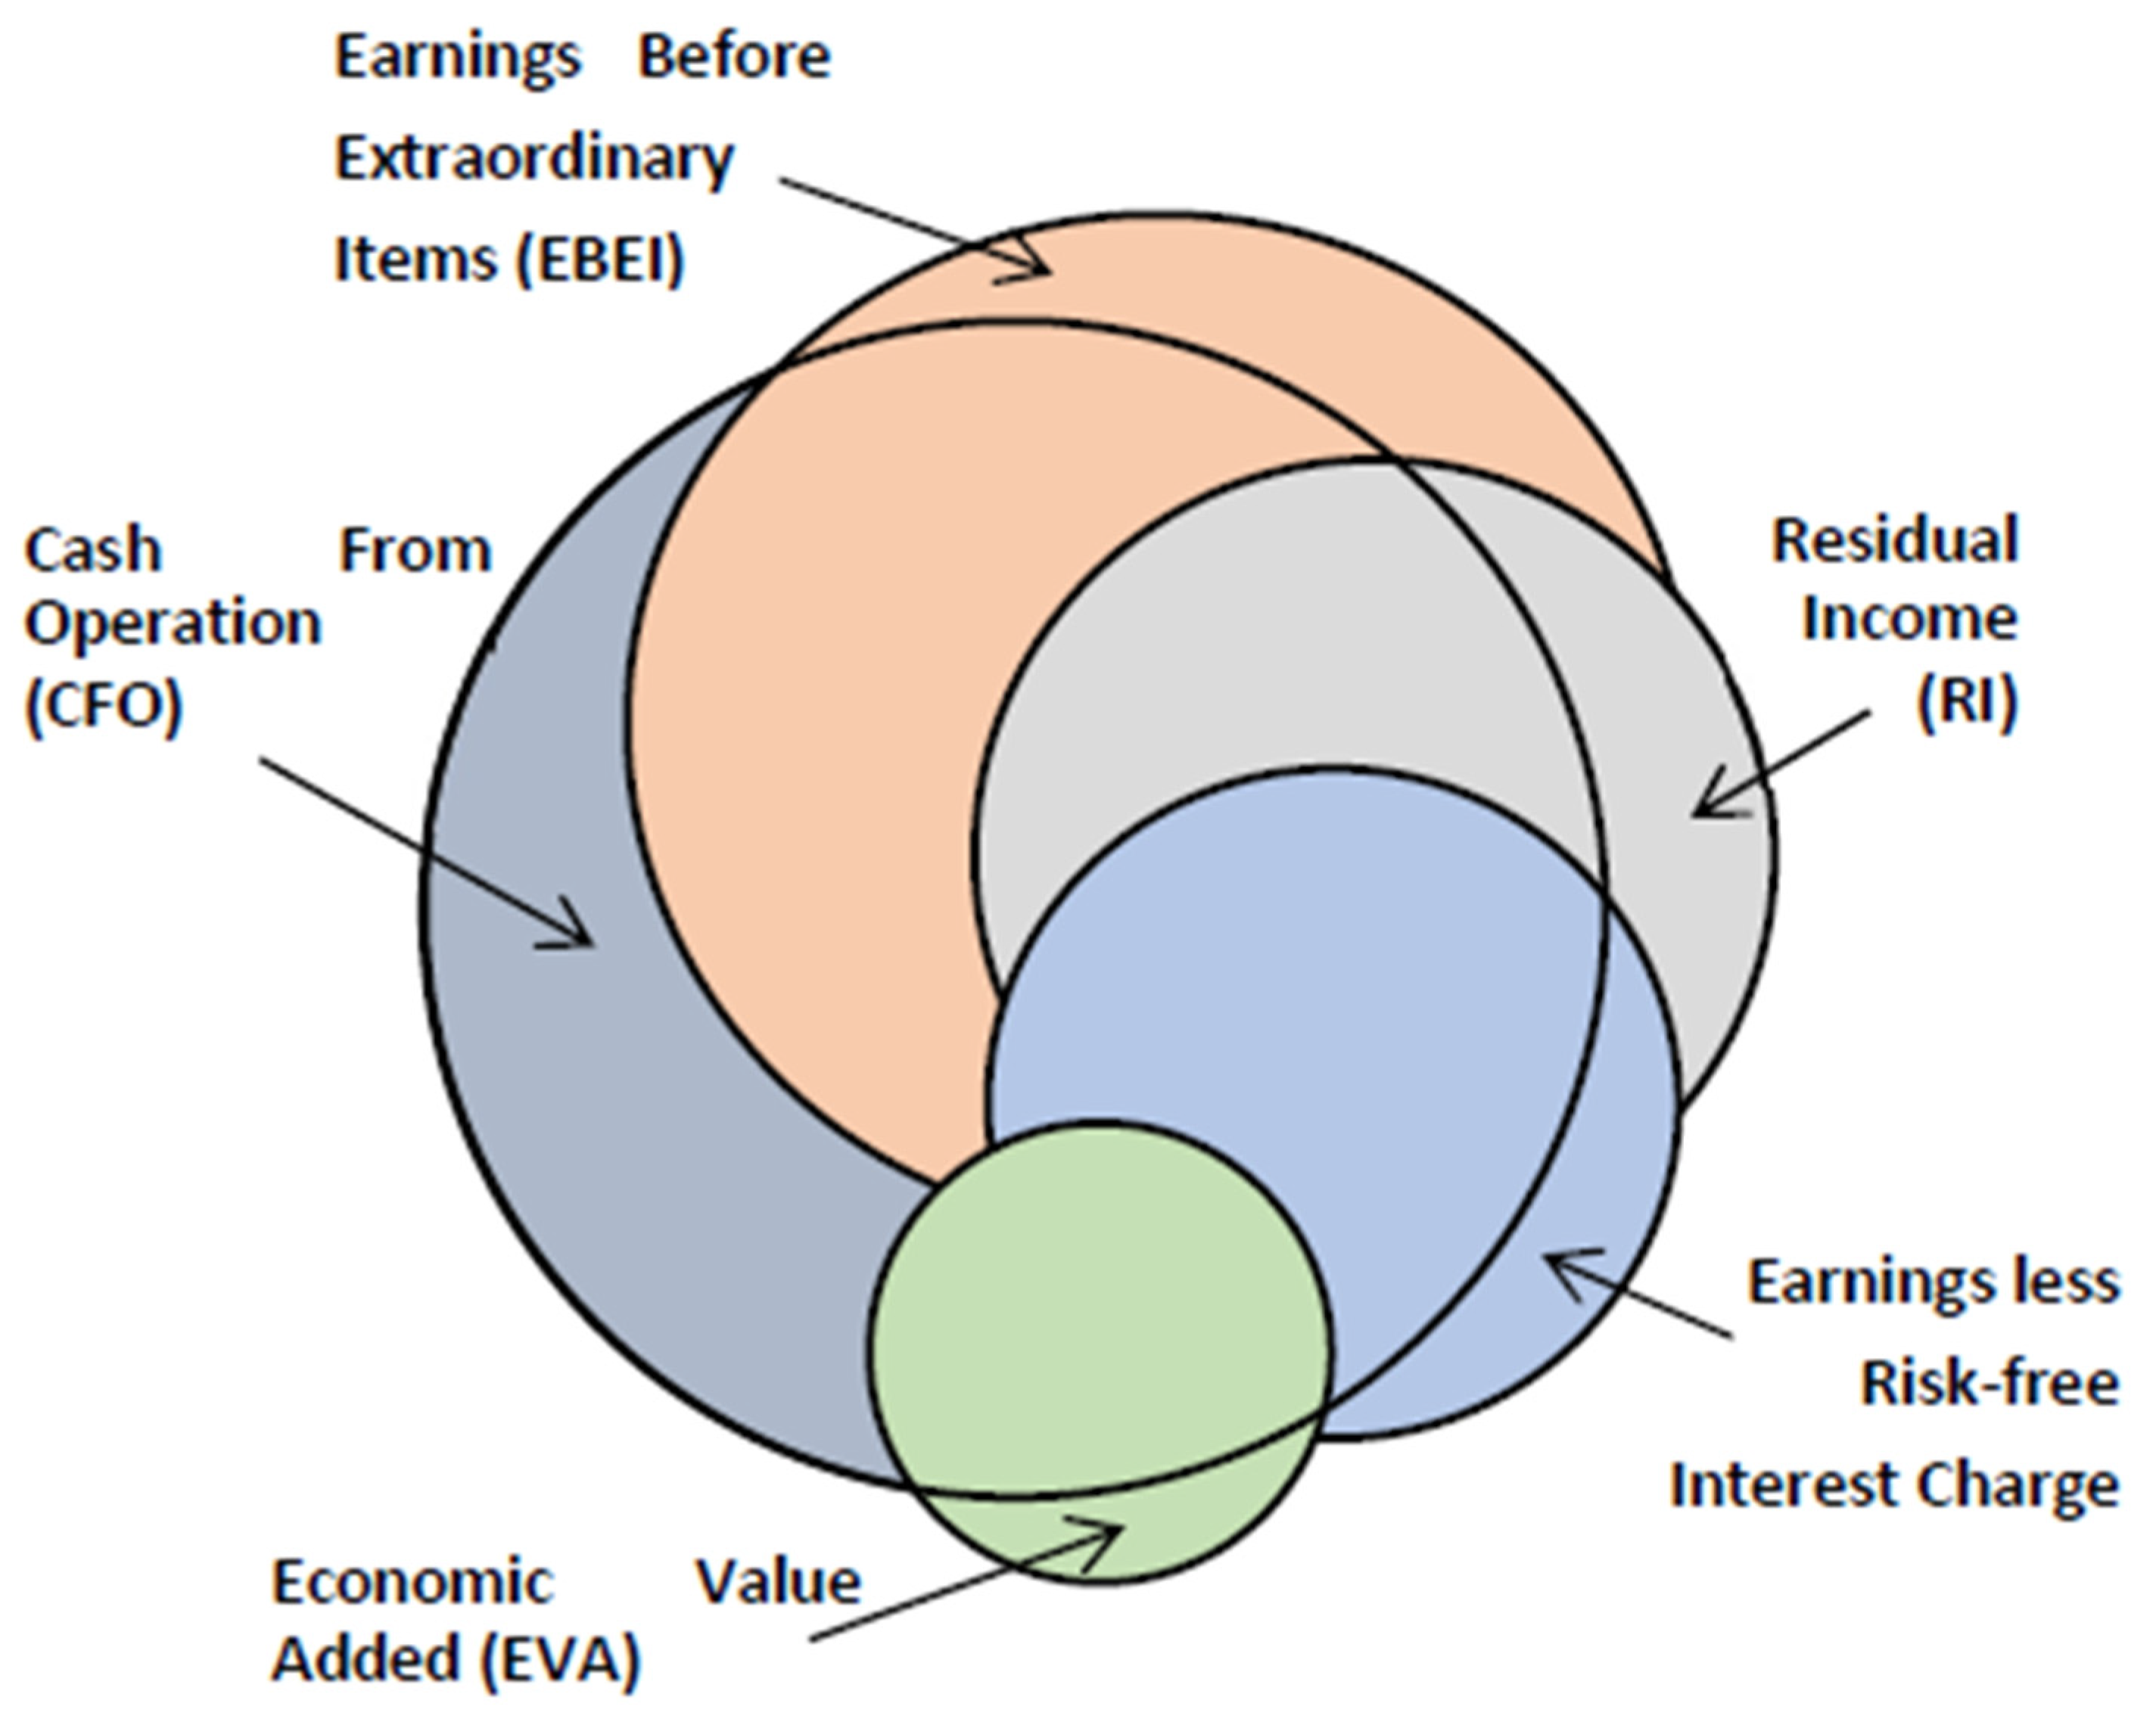
2.2. Linkages between Shareholder Value Metrics
2.2.1. From Accounting Metrics to Residual Income
- = Cash flow from operations;
- = Total accruals related to the operating activities. Accruals could be depreciation, amortization, changes in non-cash current assets, changes in current liabilities, and changes in deferred taxes.
- = After tax interest expenses.
- = weighted average cost of capital (WACC);
- = Capital employed at the beginning of the period .
2.2.2. EVA
- Stern Stewart offered over 160 adjustments to NOPAT, but generally limited the actual number to a handful (Stewart 1994). We made common adjustments to EVA based on Young (1999) and Ray (2012), i.e., for amortization.
- : Stern Stewart also offered many adjustments to the capital employed, but also recommended only employing the most relevant capital (Stewart 1994). We made common adjustments to EVA based on Young (1999) and Ray (2012), i.e., the elimination of current liabilities.
- CapChgt−1 = k * (CEt−1);
- AcctAdjt−1 = AcctAdjop − (k * AcctAdjc).
2.2.3. ERIC
- = (NOPAT + ExtraOrd) − CEQAdjt;
- = risk-free rate of return for the specific firm;
- see above.
where = αt [[(1 + k)t − (1 + rf)t]/(1 + k)t]
2.3. Hypotheses Development
2.4. Statistical Tests
3. Sample Selection, Variable Definitions, and Descriptive Statistics
3.1. Dependent Variable
3.2. Independent Variables and Descriptive Data: Relative Information Content Tests
3.3. Independent Variables and Descriptive Data: Incremental Information Content Tests
4. Empirical Results
4.1. Relative Information Content Tests
4.2. Incremental Information Content Tests
5. Sensitivity Analyses and Extensions
5.1. Differences across Subperiods
5.2. Do adopters of VBM Metrics React More Strongly?
5.3. Five-Year Returns as the Dependent Variable
5.4. Two-Year (Contemporaneous and One-Year Ahead) Returns as the Dependent Variable
6. Discussion
6.1. Synthesis of the Findings

| # | Reference | Test | Obs. | Findings | ||||
|---|---|---|---|---|---|---|---|---|
| Best | Worst | |||||||
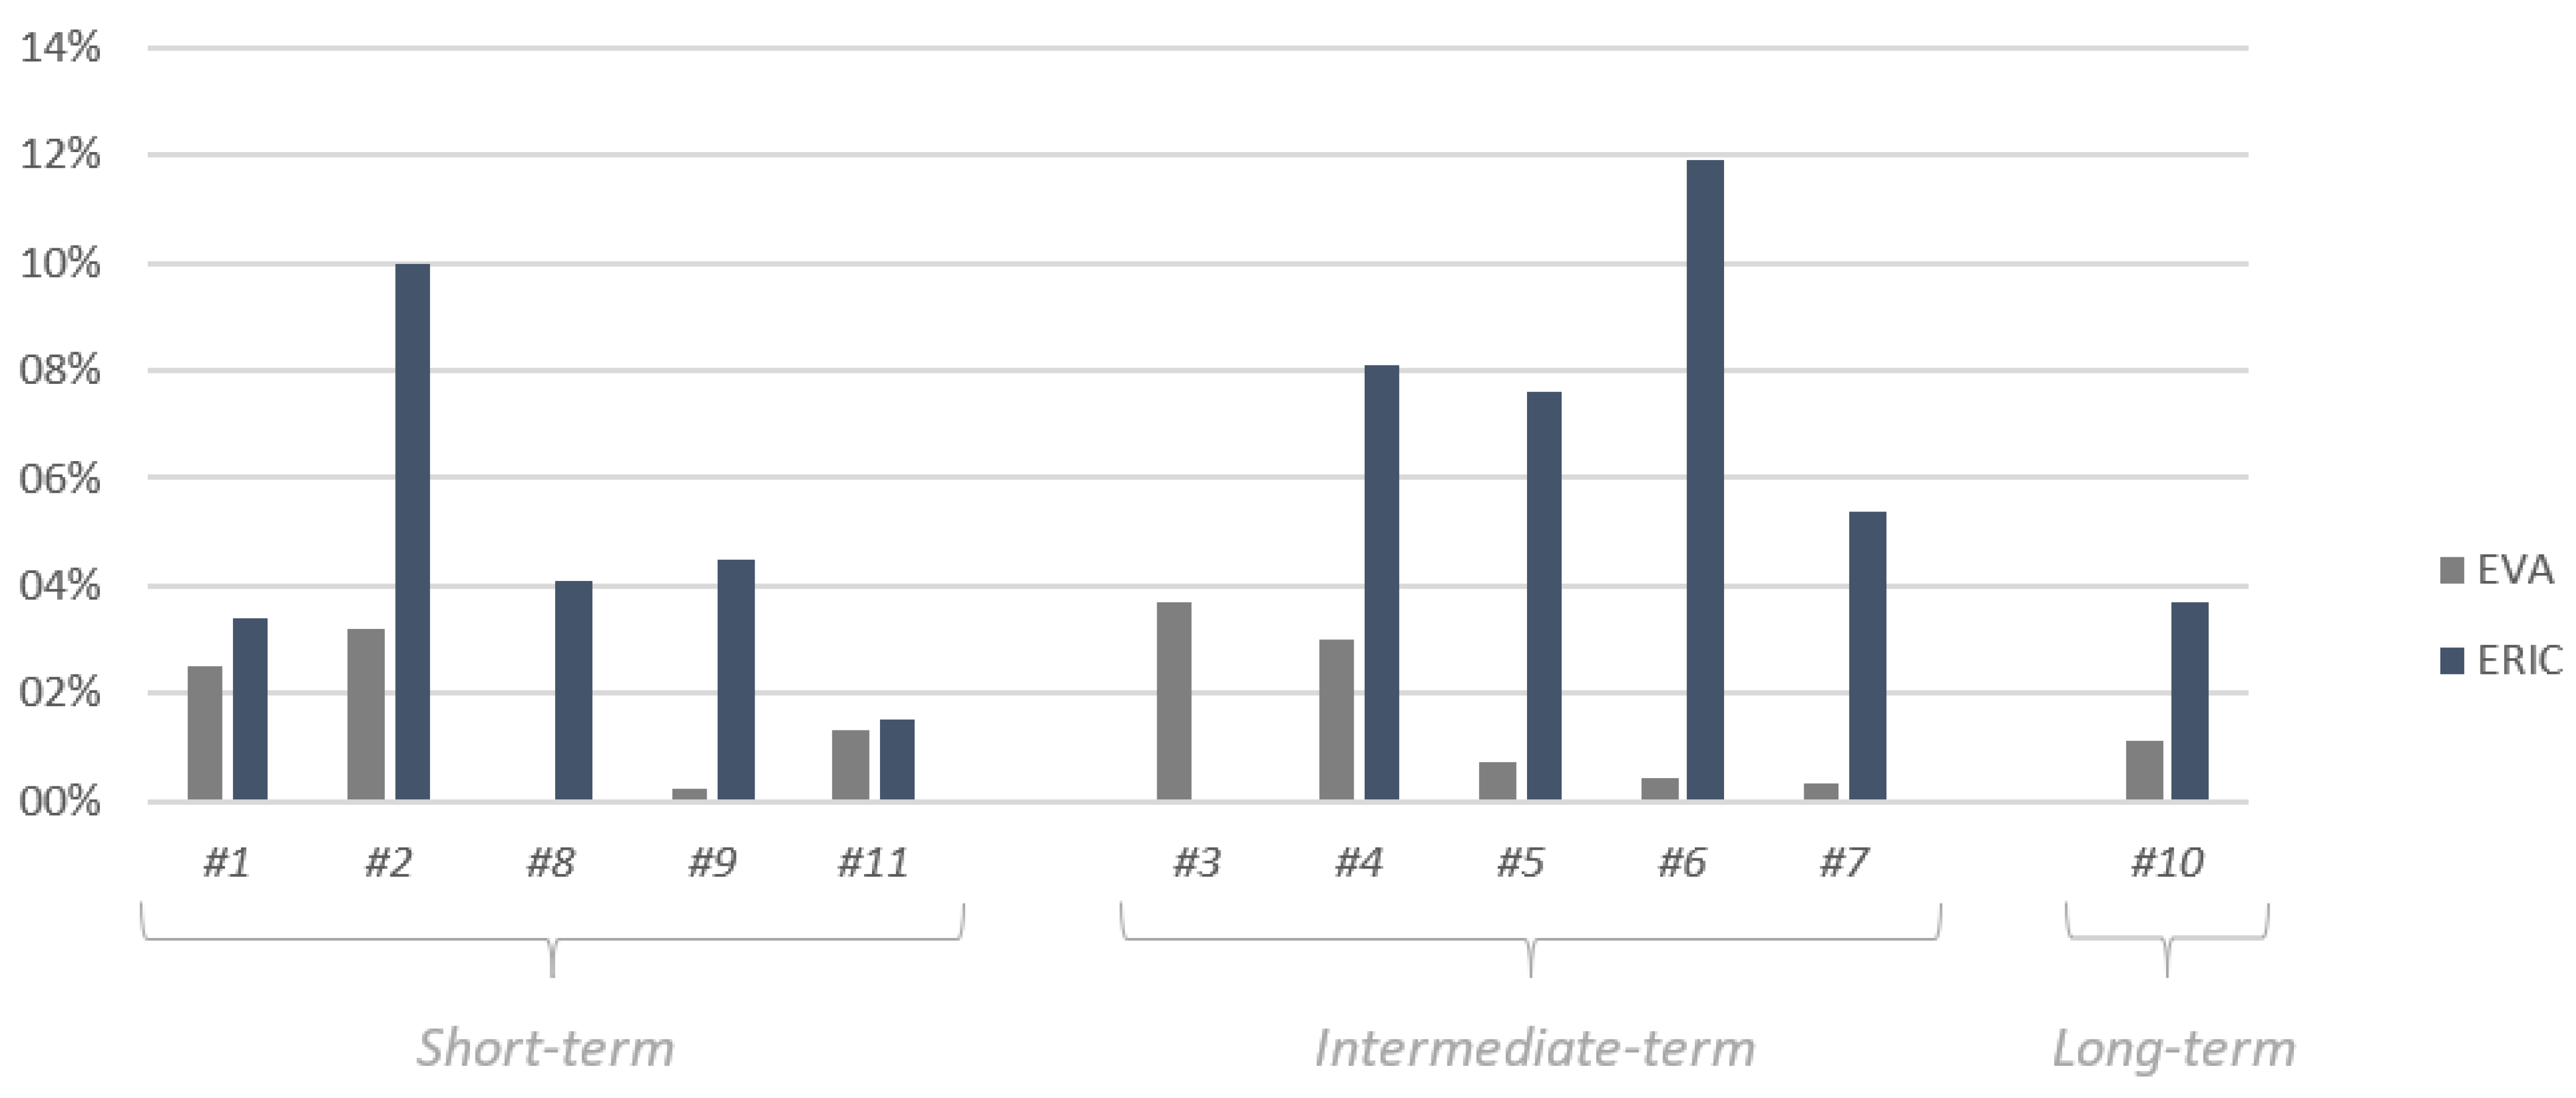
| 1 | Table 2 Panel A | One-year return | 2140 | CFO | EBEI | RI | ERIC | EVA |
| 0.079 | 0.046 | 0.046 | 0.034 | 0.025 | ||||
| 2 | Table 2 Panel B | One-year return—Positive and Negative values differ | 2140 | EBEI | ERIC | CFO | RI | EVA |
| 0.107 | 0.100 | 0.097 | 0.058 | 0.032 | ||||
| 3 | Section 5.1 | Two-year sub-period 2003–2004 | 214 | CFO | EBEI | EVA | RI | ERIC |
| 0.063 | 0.039 | 0.037 | 0.019 | 0.000 | ||||
| 4 | Section 5.1 | Two-year sub-period 2005–2006 | 214 | RI | ERIC | EBEI | CFO | EVA |
| 0.149 | 0.081 | 0.078 | 0.052 | 0.030 | ||||
| 5 | Section 5.1 | Two-year sub-period 2007–2008 | 214 | EBEI | CFO | ERIC | RI | EVA |
| 0.124 | 0.098 | 0.076 | 0.056 | 0.007 | ||||
| 6 | Section 5.1 | Two-year sub-period 2009–2010 | 214 | ERIC | RI | CFO | EBEI | EVA |
| 0.119 | 0.100 | 0.098 | 0.051 | 0.004 | ||||
| 7 | Section 5.1 | Two-year sub-period 2011–2012 | 214 | EBEI | ERIC | RI | CFO | EVA |
| 0.162 | 0.054 | 0.050 | 0.006 | 0.003 | ||||
| 8 | Table 4 | ‘Any’ | 1460 | CFO | EBEI | ERIC | RI | EVA |
| 0.114 | 0.048 | 0.041 | 0.040 | 0.000 | ||||
| 9 | Table 4 | ‘Comp Year’ | 1170 | CFO | RI | EBEI | ERIC | EVA |
| 0.136 | 0.052 | 0.047 | 0.045 | 0.002 | ||||
| 10 | Table 6 | Five-year returns | 214 | EBEI | ERIC | RI | EVA | CFO |
| 0.075 | 0.037 | 0.033 | 0.011 | 0.003 | ||||
| 11 | Section 5.4 | Contemporaneous and one-year ahead | 1926 | CFO | RI | ERIC | EBEI | EVA |
| 0.037 | 0.043 | 0.015 | 0.015 | 0.013 | ||||
| Overall | Best | Worst | ||||||
| CFO | 5 | 1 | 2 | 2 | 1 | |||
| EBEI | 4 | 3 | 2 | 2 | 0 | |||
| RI | 1 | 3 | 3 | 4 | 0 | |||
| EVA | 0 | 0 | 1 | 1 | 9 | |||
| ERIC | 1 | 4 | 3 | 2 | 1 | |||
6.2. Contributions to Theory and Practice
7. Conclusion and Future Research
7.1. Conclusion and Comparison to Previous Studies
7.2. Limitations and Future Research
Author Contributions
Funding
Institutional Review Board Statement
Informed Consent Statement
Data Availability Statement
Conflicts of Interest
References
- Andersen, Christian Vium, and Rainer Lueg. 2017. Management Control Systems, culture and upper echelons—A systematic literature review on their interactions. Corporate Ownership & Control 14: 312–25. [Google Scholar]
- Bacidore, J. M., J. A. Boquist, T. T. Milbourn, and A. V. Thakor. 1997. The search for the best financial performance measure. Financial Analysts Journal 53: 11–20. [Google Scholar] [CrossRef]
- Biddle, Gary, Robert Bowen, and James Wallace. 1997. Does EVA beat earnings? Evidence on associations with stock returns and firm values. Journal of Accounting & Economics 24: 301–36. [Google Scholar]
- Bromwich, Michael, and Martin Walker. 1998. Residual income past and future. Management Accounting Research 9: 391–419. [Google Scholar] [CrossRef]
- Brück, Christian, Thorsten Knauer, and Anja Schwering. 2022. Disclosure of value-based performance measures: Evidence from German listed firms. Accounting and Business Research, 1–28. [Google Scholar] [CrossRef]
- Michael, Burkerta, and Rainer Lueg. 2013. Differences in the sophistication of Value-based Management—The role of top executives. Management Accounting Research 24: 3–22. [Google Scholar]
- Chen, Shimin, and James L. Dodd. 2001. Operating income, residual income and EVA: Which metric is more value relevant? Journal of Managerial Issues 13: 65–86. [Google Scholar]
- Clinton, B. Douglas, and Shimin Chen. 1998. Do new performance measures measure up? Management Accounting 80: 38–43. [Google Scholar]
- Copeland, Tom, Aaron Dolgoff, and Alberto Moel. 2004. The Role of Expectations in Explaining the Cross-section of Stock Returns. Review of Accounting Studies 9: 149–88. [Google Scholar] [CrossRef]
- Easton, Peter D., and Trevor S. Harris. 1991. Earnings as an explanatory variable for returns. Journal of Accounting Research 29: 19–36. [Google Scholar] [CrossRef]
- Feltham, Gerald A., and James A. Ohlson. 1999. Residual earnings valuation with risk and stochastic interest rates. The Accounting Review 74: 165–83. [Google Scholar] [CrossRef]
- Feltham, Glenn D., Grant E. Issac, Chima Mbagwu, and Ganesh Vaidyanathan. 2004. Perhaps EVA does beat earnings—Revisiting previous evidence. Journal of Applied Corporate Finance 16: 83–88. [Google Scholar] [CrossRef]
- Firk, Sebastian, Sebastian Schrapp, and Michael Wolff. 2016. Drivers of value creation—The role of value-based management and underlying institutions. Management Accounting Research 33: 42–60. [Google Scholar] [CrossRef]
- Firk, Sebastian, Torben Schmidt, and Michael Wolff. 2019. Exploring Value-Based Management sophistication: The role of potential economic benefits and institutional influence. Contemporary Accounting Research 36: 418–50. [Google Scholar] [CrossRef]
- Friis, J., R. Lueg, R. Mayanja, Simon Tind Salling, and Kasper Aalund Møller Sørensen. 2015. Business model or strategy: Which comes first? A lifecycle perspective in the Scandinavian software industry. Problems and Perspectives in Management 13: 161–69. [Google Scholar]
- Graham, John R., Campbell R. Harvey, and Shiva Rajgopal. 2006. Value destruction and financial reporting decisions. Financial Analysts Journal 62: 27–39. [Google Scholar] [CrossRef]
- Hair, Joseph F., Barry J. Babin, Rolph E. Anderson, and William C. Black. 2018. Multivariate Data Analysis, 8th ed. Upper Saddle River: Pearson. [Google Scholar]
- Haubro, Anders P., Henrik A. Lomholt, Rainer Lueg, Sverre V. Nielsen, and Ulrik Knudsen. 2015. Tactical and strategic choices in business models: Evidence from a Danish fashion outlet. Journal of Fashion Marketing and Management 19. [Google Scholar] [CrossRef]
- Holler, Annette. 2008. Have earnings lost value-relevance? Revisiting latest evidence on EVA. The Business Review 10: 245–54. [Google Scholar]
- Ismail, Ahmad. 2006. Is Economic Value Added more associated with stock return than accounting earnings? The UK evidence. International Journal of Managerial Finance 2: 343–53. [Google Scholar] [CrossRef]
- Kaur, Mandeep, and Sweety Narang. 2009. Does EVA dominate earnings? Empirical evidence from Indian market. Asia Pacific Business Review 5: 75–90. [Google Scholar] [CrossRef]
- Knapik, Magdalena, and Rainer Lueg. 2016. Risk management with management control systems: A pragmatic constructivist perspective. Corporate Ownership & Control 13: 71–80. [Google Scholar]
- Koller, Tim, Marc Goedhart, and David Wessels. 2015. Valuation: Measuring and Managing the Value of Companies, 6th ed. Hoboken: Wiley. [Google Scholar]
- Korinth, Fabio, and Rainer Lueg. 2022. Corporate sustainability and risk management—The u-shaped relationships of disaggregated esg rating scores and risk in the German capital market. Sustainability 14: 5735. [Google Scholar] [CrossRef]
- KPMG, and L. J. Velthuis. 2004. Value Based Management—ERIC-Management and Incentive Concept. Frankfurt am Main: KPMG. [Google Scholar]
- Kumar, Satish, and Anil K. Sharma. 2011. Association of EVA and accounting earnings with market value: Evidence from India. Asia-Pacific Journal of Business Administration 3: 83–96. [Google Scholar] [CrossRef]
- Kyriazis, Dimitris, and Christos Anastassis. 2007. The validity of the Economic Value Added approach: An empirical application. European Financial Management 13: 71–100. [Google Scholar] [CrossRef]
- Liao, Lin, Helen Kang, and Richard D. Morris. 2021. The value relevance of fair value and historical cost measurements during the financial crisis. Accounting & Finance 61: 2069–107. [Google Scholar]
- Lueg, Rainer. 2008. Value-Based Management: Empirical Evidence on Its Determinants and Performance Effects. Vallendar: WHU Otto Beisheim School of Management. [Google Scholar]
- Lueg, Rainer. 2009. Führt der Einsatz externer Berater zur Überimplementierung innovativer Steuerungsinstrumente? Zeitschrift der Unternehmensberatung 4: 249–53. [Google Scholar]
- Lueg, Rainer. 2010a. Shareholder Value und Value Based Management—Wie steuern die HDAX-Konzerne? Zeitschrift für Controlling 22: 337–44. [Google Scholar] [CrossRef]
- Lueg, Rainer. 2010b. Value-based Management—Antecedents and performance effects. In Summa Cum Laude 2008: Wirtschaftswissenschaften. Edited by Katinka Pantz. Darmstadt: Roter Fleck Verlag, pp. 284–85. [Google Scholar]
- Lueg, Rainer. 2022. Constructs for assessing integrated reports—Testing the predictive validity of a taxonomy for organization size, industry, and performance. Sustainability 14: 7206. [Google Scholar] [CrossRef]
- Lueg, Rainer, and Radina Pesheva. 2021. Corporate sustainability in the Nordic countries—The curvilinear effects on shareholder returns. Journal of Cleaner Production 315: 127962. [Google Scholar] [CrossRef]
- Lueg, Rainer, and Utz Schäffer. 2010. Assessing empirical research on Value-based Management: Guidelines for improved hypothesis testing. Journal für Betriebswirtschaft 60: 1–47. [Google Scholar] [CrossRef]
- Lueg, Klarissa, Boris Krastevb, and Rainer Luegb. 2019. Bidirectional effects between sustainability disclosure and risk—A disaggregate analysis of listed companies in South Africa. Journal of Cleaner Production 229: 268–77. [Google Scholar] [CrossRef]
- Lueg, Rainer, Christian Schmaltz, and Modestas Tomkus. 2019. Business models in banking: A cluster analysis using archival data. Trames: A Journal of the Humanities and Social Sciences 23: 79–107. [Google Scholar] [CrossRef]
- Maditinos, Dimitrios, Zeljko Sevic, and Nikolaos Theriou. 2009. Modelling traditional accounting and modern value-based performance measures to explain stock market returns in the Athens Stock Exchange (ASE). Journal of Modelling in Management 4: 182–201. [Google Scholar] [CrossRef]
- Mavropulo, Olena, Marc Steffen Rapp, and Iuliia A. Udoieva. 2021. Value-based management control systems and the dynamics of working capital: Empirical evidence. Management Accounting Research 52: 100740. [Google Scholar] [CrossRef]
- Muheki, Mark, Klarissa Lueg, Rainer Lueg, and Christian Schmaltz. 2014. How business reporting changed during the financial crisis: A comparative case study of two large U.S. banks. Problems and Perspectives in Management 12: 191–208. [Google Scholar]
- Myers, R. 1996. Metric wars. CFO 12: 41–50. [Google Scholar]
- O’Byrne, Stephen F. 1999. EVA and its critics. Journal of Applied Corporate Finance 12: 92–96. [Google Scholar] [CrossRef]
- Palliam, Ralph. 2006. Further evidence on the information content of economic value added. Review of Accounting and Finance 5: 204–15. [Google Scholar] [CrossRef]
- Parvaei, Akbar, and Soran Farhadi. 2013. The ability of explaining and predicting of Economic Value Added (EVA) versus net income (NI), residual income (RI) & free cash flow (FCF) in Tehran stock exchange (TSE). International Journal of Economics & Finance 5: 67–77. [Google Scholar]
- Pfeiffer, Thomas, and Louis Velthuis. 2009. Incentive System Design Based on Accrual Accounting: A Summary and Analysis. Journal of Management Accounting Research 21: 19–53. [Google Scholar] [CrossRef]
- Profitlich, Mirko, Yassin Denis Bouzzine, and Rainer Lueg. 2021. The relationship between CFO compensation and corporate sustainability: An empirical examination of German listed firms. Sustainability 13: 12299. [Google Scholar] [CrossRef]
- Ray, S. 2012. Efficacy of Economic Value Added concept in business performance measurement. Advances in Information Technology and Management 2: 260–67. [Google Scholar]
- Robichek, Alexander A., and Stewart C. Myers. 1966. Conceptual problems in the use of risk-adjusted discount rates. The Journal of Finance 21: 727–30. [Google Scholar]
- Schmaltz, Christian, Rainer Lueg, Jesper Agerholm, and Kasper Wittrup. 2019. Value-based management in banking: The effects on shareholder returns. International Journal of Business Science and Applied Management 14: 35–50. [Google Scholar]
- Stewart, G. Bennett. 1991. The Quest for Value: A Guide for Senior Managers. New York: Harper Business. [Google Scholar]
- Stewart, G. Bennett. 1994. EVA: Facts and fantasy. Journal of Applied Corporate Finance 7: 71–84. [Google Scholar] [CrossRef]
- Toft, Jon, and Rainer Lueg. 2015a. A screening model for corporate bond picking. The International Journal of Finance 27: 437–53. [Google Scholar]
- Toft, Jon, and Rainer Lueg. 2015b. Does EVA beat earnings? A literature review of the evidence since Biddle et al. (1997). Corporate Ownership and Control 12: 8–18. [Google Scholar] [CrossRef]
- Velthuis, Louis John, and Peter Wesner. 2005. Value Based Management. Bewertung, Performancemessung und Managemententlohnung mit ERIC, 1st ed. Stuttgart: Schäffer-Poeschel. [Google Scholar]
- Venanzi, Daniela. 2012. Financial Performance Measures and Value Creation: The State of the Art. Berlin: Springer. [Google Scholar]
- Wooldridge, Jeffrey M. 2017. Introductory Econometrics: A Modern Approach. Boston: South-Western College Publishers. [Google Scholar]
- Worthington, Andrew, and Tracey West. 2004. Australian evidence concerning the information content of Economic Value Added. Australian Journal of Management 29: 201–23. [Google Scholar] [CrossRef]
- Young, David. S. 1999. Some reflections on accounting adjustments and Economic Value Added. Journal of Financial Statement Analysis 4: 7–13. [Google Scholar]
- Young, S. David, and Stephen F. O’Byrne. 2001. EVA and Value Based Management: A Practical Guide to Implementation. New York: McGraw-Hill. [Google Scholar]


| Panel A: Descriptive Statistics of the Dependent and Independent Variables in Relative Information Content Tests a | |||||||
| Dependent Variable | Independent Variables | ||||||
| MktAdjRett | CFOt | EBEIt | RIt | EVAt | ERICt | ||
| Descriptive statistics | |||||||
| Mean | 0.076 | 0.129 | 0.057 | −0.236 | −0.069 | 0.015 | |
| Median | 0.027 | 0.104 | 0.061 | −0.029 | −0.010 | 0.039 | |
| Std. Dev. | 0.338 | 0.100 | 0.062 | 0.566 | 0.250 | 0.136 | |
| Correlations b | |||||||
| MktAdjRett | 1.000 | ||||||
| CFOt | 0.280 ** | 1.000 | |||||
| EBEIt | 0.092 ** | 0.244 ** | 1.000 | ||||
| RIt | −0.215 ** | −0.167 ** | 0.157 ** | 1.000 | |||
| EVAt | −0.115 ** | −0.143 ** | 0.290 ** | 0.489 ** | 1.000 | ||
| ERICt | −0.133 ** | −0.127 ** | 0.471 ** | 0.486 ** | 0.751 ** | 1.000 | |
| Panel B: Descriptive Statistics of the Dependent and Independent Variables in Incremental Information Content Tests a | |||||||
| Dependent Variable | Independent Variables | ||||||
| MktAdjRett | CFOt | Accrualt | ATIntt | ExOrdItemst | CEQAdjt | CapChgt | |
| Descriptive statistics | |||||||
| Mean | 0.076 | 0.129 | −0.073 | 0.012 | 0.000 | 0.002 | 0.048 |
| Median | 0.027 | 0.104 | −0.042 | 0.007 | 0.000 | 0.002 | 0.025 |
| Std. Dev. | 0.338 | 0.100 | 0.107 | 0.017 | 0.002 | 0.049 | 0.085 |
| Correlations b | |||||||
| MktAdjRett | 1.000 | ||||||
| CFOt | 0.280 ** | 1.000 | |||||
| Accrualt | −0.209 ** | −0.788 ** | 1.000 | ||||
| ATIntt | 0.131 ** | 0.510 ** | −0.441 ** | 1.000 | |||
| ExOrdItemst | −0.016 | 0.089 ** | −0.071 ** | 0.143 ** | 1.000 | ||
| CEQAdjt | 0.019 | 0.086 ** | −0.116 ** | 0.093 ** | 0.026 | 1.000 | |
| CapChgt | 0.175 ** | 0.323 ** | −0.301 ** | 0.234 ** | 0.034 | 0.049 * | 1.000 |
| Ranked Order of R2 | Observations | Relative Information Content | ||||||||
|---|---|---|---|---|---|---|---|---|---|---|
| (1) | (2) | (3) | (4) | (5) | ||||||
| Panel A: Coefficient of Positive and Negative Values of Each Performance Metric Constrained to Be Equal a | ||||||||||
| All firms | 2140 | CFO | > | EBEI | > | RI | ERIC | > | EVA | |
| Adj. R2 | 0.079 | 0.046 | 0.046 | 0.034 | 0.025 | |||||
| p-value b | (0.000) | (0.000) | (0.000) | (0.000) | ||||||
| (0.000) | (0.000) | (0.000) | ||||||||
| (0.000) | (0.000) | |||||||||
| (0.000) | ||||||||||
| Panel B: Coefficient of Positive and Negative Values of Each Performance Metric Allowed to Differ c | ||||||||||
| All firms | 2140 | EBEI | > | ERIC | > | CFO | > | RI | > | EVA |
| Adj. R2 | 0.107 | 0.100 | 0.097 | 0.058 | 0.032 | |||||
| p-value b | (0.000) | (0.000) | (0.000) | (0.000) | ||||||
| (0.000) | (0.000) | (0.000) | ||||||||
| (0.000) | (0.000) | |||||||||
| (0.000) | ||||||||||
| Variables a | Predicted Signs | Coefficients | p-Value b | F-Stat. | p-Value |
|---|---|---|---|---|---|
| Constant | −0.004 | 0.365 | |||
| CFOt | + | 1.140 | 0.000 | 92.127 | 0.000 |
| CFOt−1 | − | −0.851 | 0.000 | ||
| Accrualt | + | 0.316 | 0.002 | 89.648 | 0.000 |
| Accrualt−1 | − | −0.711 | 0.000 | ||
| ATIntt | − | −1.195 | 0.150 | 18.707 | 0.000 |
| ATIntt−1 | + | 0.764 | 0.252 | ||
| ExtraOrdt | + | −5.284 | 0.041 | 0.527 | 0.295 |
| ExtraOrdt−1 | − | −0.534 | 0.274 | ||
| CEQAdjt | − | −0.200 | 0.078 | 13.385 | 0.000 |
| CEQAdjt−1 | + | 0.034 | 0.150 | ||
| CapChgt | − | 2.155 | 0.000 | 65.364 | 0.000 |
| CapChgt−1 | + | −2.010 | 0.000 | ||
| Obs. | 2140 | ||||
| Adj. R2 | 0.127 |
| Ranked Order of R2 | Observations | Relative Information Content b,c | ||||||||
|---|---|---|---|---|---|---|---|---|---|---|
| (1) | (2) | (3) | (4) | (5) | ||||||
| Panel A: Coefficient of Positive and Negative Values of Each Performance Metric Constrained to Be Equal | ||||||||||
| “VBM adoption” a | 1460 | CFO | > | EBEI | > | RI | > | ERIC | > | EVA |
| Adj. R2 | 0.026 | 0.014 | 0.003 | 0.000 | 0.000 | |||||
| p-value | (0.000) | (0.000) | (0.121) | (0.344) | ||||||
| (0.000) | (0.000) | (0.158) | ||||||||
| (0.000) | (0.000) | |||||||||
| (0.000) | ||||||||||
| “VBM compensation” a | 1170 | CFO | > | EBEI | > | RI | > | ERIC | > | EVA |
| Adj. R2 | 0.022 | 0.014 | 0.004 | 0.000 | 0.000 | |||||
| p-value | (0.000) | (0.000) | (0.095) | (0.563) | ||||||
| (0.000) | (0.000) | (0.117) | ||||||||
| (0.000) | (0.000) | |||||||||
| (0.000) | ||||||||||
| “VBM Adoption” a | Predicted Signs | Coefficients b | p-Value c | F-Stat. | p-Value |
|---|---|---|---|---|---|
| Constant | 0.006 | 0.015 | |||
| CFOt | + | 1.276 | 0.153 | 87.893 | 0.000 |
| CFOt−1 | − | −0.807 | 0.147 | ||
| Accrualt | + | 0.426 | 0.122 | 67.355 | 0.000 |
| Accrualt−1 | − | −0.564 | 0.099 | ||
| ATIntt | − | 0.620 | 1.326 | 36.216 | 0.000 |
| ATIntt−1 | + | 0.533 | 1.346 | ||
| CEQAdjt | − | −0.027 | 0.162 | 7.574 | 0.001 |
| CEQAdjt−1 | + | 0.002 | 0.033 | ||
| CapChgt | − | 2.176 | 0.232 | 55.152 | 0.000 |
| CapChgt−1 | + | −2.092 | 0.262 | ||
| Obs. | 1460 | ||||
| Adj. R2 | 0.153 | ||||
| “VBM Compensation” a | Predicted Signs | Coefficients | p-Value c | F-Stat. | p-Value |
| Constant | −0.004 | 0.017 | |||
| CFOt | + | 1.286 | 0.169 | 86.262 | 0.000 |
| CFOt−1 | − | −0.757 | 0.160 | ||
| Accrualt | + | 0.423 | 0.133 | 62.879 | 0.000 |
| Accrualt−1 | − | −0.511 | 0.108 | ||
| ATIntt | − | 1.635 | 1.623 | 44.267 | 0.000 |
| ATIntt−1 | + | 0.347 | 1.622 | ||
| CEQAdjt | − | −0.003 | 0.170 | 5.223 | 0.006 |
| CEQAdjt−1 | + | −0.004 | 0.035 | ||
| CapChgt | − | 2.235 | 0.250 | 51.395 | 0.000 |
| CapChgt−1 | + | −2.135 | 0.284 | ||
| Obs. | 1170 | ||||
| Adj. R2 | 0.173 |
| Ranked Order of R2 | Observations | Relative Information Content a | ||||||||
|---|---|---|---|---|---|---|---|---|---|---|
| (1) | (2) | (3) | (4) | (5) | ||||||
| 5-Year Stock Returns | ||||||||||
| 214 | EBEI | > | ERIC | > | RI | > | EVA | > | CFO | |
| Adj. R2 | 0.075 | 0.037 | 0.033 | 0.011 | 0.003 | |||||
| p-value b | (0.001) | (0.005) | (0.045) | (0.260) | ||||||
| (0.000) | (0.007) | (0.022) | ||||||||
| (0.001) | (0.035) | |||||||||
| (0.001) | ||||||||||
Publisher’s Note: MDPI stays neutral with regard to jurisdictional claims in published maps and institutional affiliations. |
© 2022 by the authors. Licensee MDPI, Basel, Switzerland. This article is an open access article distributed under the terms and conditions of the Creative Commons Attribution (CC BY) license (https://creativecommons.org/licenses/by/4.0/).
Share and Cite
Lueg, R.; Toft, J.S. Earnings Less Risk-Free Interest Charge (ERIC) and Stock Returns—A Value-Based Management Perspective on ERIC’s Relative and Incremental Information Content. J. Risk Financial Manag. 2022, 15, 368. https://doi.org/10.3390/jrfm15080368
Lueg R, Toft JS. Earnings Less Risk-Free Interest Charge (ERIC) and Stock Returns—A Value-Based Management Perspective on ERIC’s Relative and Incremental Information Content. Journal of Risk and Financial Management. 2022; 15(8):368. https://doi.org/10.3390/jrfm15080368
Chicago/Turabian StyleLueg, Rainer, and Jon Svennesen Toft. 2022. "Earnings Less Risk-Free Interest Charge (ERIC) and Stock Returns—A Value-Based Management Perspective on ERIC’s Relative and Incremental Information Content" Journal of Risk and Financial Management 15, no. 8: 368. https://doi.org/10.3390/jrfm15080368
APA StyleLueg, R., & Toft, J. S. (2022). Earnings Less Risk-Free Interest Charge (ERIC) and Stock Returns—A Value-Based Management Perspective on ERIC’s Relative and Incremental Information Content. Journal of Risk and Financial Management, 15(8), 368. https://doi.org/10.3390/jrfm15080368