Article

Is Bitcoin a Safe Haven for Indian Investors? A GARCH Volatility Analysis

1
Department of Economics, CHRIST (Deemed to be University), Bangalore 560029, India
2
Accounting, Economics and Finance Area, T A Pai Management Institute, Manipal Academy of Higher Education, Manipal 576104, India
3
Institute of Agricultural and Food Economics, Hungarian University of Agriculture and Life Sciences, 2100 Godollo, Hungary
*
Author to whom correspondence should be addressed.
J. Risk Financial Manag. 2022, 15(7), 317; https://doi.org/10.3390/jrfm15070317
Submission received: 8 June 2022 / Revised: 5 July 2022 / Accepted: 13 July 2022 / Published: 21 July 2022

Abstract

:
This paper attempts to understand the dynamic interrelationships and financial asset capabilities of Bitcoin by analysing several aspects of its volatility vis-a-vis other asset classes. This study aims to analyse the volatility dynamics of the returns of Bitcoin. An asymmetric GARCH model (EGARCH) is used to investigate whether Bitcoin may be useful in risk management and ideal for risk-averse investors in anticipation of negative shocks to the market (leverage effect). This paper also examines Bitcoin as an investment and hedge alternative to gold as well as NSE NIFTY using a multivariate DCC GARCH model. DCC GARCH models are also used to check whether correlation (co-movement) between the markets is time-varying, examine returns and volatility spillovers between markets and the effect of the outbreak of COVID-19 in India on the investigated markets. The results show that given the supply of Bitcoin is fixed, low returns realisation is equivalent to excess supply over demand wherein investors are selling off Bitcoin during bad times. The positive co-movement between Bitcoin and gold during the COVID-19 outbreak shows that investors perceived Bitcoin as a relatively safe investment. However, overall analysis shows that Bitcoin was not considered a safe hedge and an investment option by Indian investors during the study period.

1. Introduction

Bitcoin burst into public consciousness in 2009. In 2008, a paper called Bitcoin—A Peer-to-Peer Electronic Cash System was posted by an individual or group calling themselves Satoshi Nakamoto to a mailing list discussing cryptography. Bitcoin is the world’s biggest cryptocurrency. Cryptocurrencies are based on an algorithm rather than “third-party trust” and facilitate payments electronically in an incontrovertible way (Kayal and Rohilla 2021; Civelek et al. 2021). Cryptocurrencies result in transactions occurring without intermediaries between the owner and the receiver and broadcasted through a P2P network. While the information is available in the public domain, the user is assured of anonymity. As per Kayal and Rohilla (2021), a coin is “mined” to collect information in the form of “blocks” and all recorded transactions on the block are verified by the principle of Proof-of-Work. Currently, there are over 1000 cryptocurrencies, with new ones emerging. India ranked second out of 154 countries on the Global Adoption Index by Chainalysis in 2021. Crypto adoption is likely to be witnessed in regional markets in India, and with the current trend, more Indians are expected to join the crypto revolution (Kothari 2022). India is the fastest-growing crypto market in the world. India has the potential to become a crypto superpower, with 750 million users, and hundreds of millions more yet to come online with increasing and faster internet access, integration and digital adoption in the near future. The majority of India’s crypto owners are under the age of 35—and hail from tier-II cities and towns (Madhok 2022).
There has been an ongoing debate on whether Bitcoin is an asset, a currency or a commodity. Bitcoin has been found to be somewhere between a commodity and a currency and has been found to act like a currency (medium of exchange) in terms of its reaction to US federal fund rates (Kayal and Rohilla 2021). Research on Bitcoin has largely focused on its hedging capabilities, similar to gold against stocks and the dollar (Baur and Lucey 2010; Capie et al. 2005). Furthermore, considering the hedging capabilities of Bitcoin or its reactions to the news, it has been claimed that Bitcoin is similar to gold (Dyhrberg 2016). A comparative analysis of Bitcoin with gold and other precious metals finds a similarity between Bitcoin and gold in response to market shocks. However, during market distress, while gold remains steady Bitcoin tends to plummet (Klein et al. 2018).
Studies on the risk diversification of Bitcoin are abundant (Briere et al. 2015; Guesmi et al. 2019; Shahzad et al. 2020; Khan et al. 2020). There have been studies on the confluence of Economics, Technology and Governance, Bitcoin price formation and its political economy (Ciaian et al. 2016; Hendrickson and Luther 2017; Szetela et al. 2020). While the literature has investigated Bitcoin’s ability to act as a hedge, a safe haven and as a means of diversification, there is a dearth of studies analysing the volatility and spillover transmission with Bitcoin returns as the dependent variable and gold, NIFTY and USD-INR as independent variables in the Indian context post-COVID-19.
This paper attempts to bridge the gap in terms of analysing Bitcoin returns and examine its characteristics as a commodity, currency or financial asset post the outbreak of COVID-19 in India. The study attempts to understand the dynamic interrelationships and financial asset capabilities of Bitcoin by analysing several aspects of its volatility. An asymmetric GARCH model (EGARCH) is used to investigate whether Bitcoin may be useful in risk management and ideal for risk-averse investors in India. This paper also examines Bitcoin as an investment and hedge alternative to gold as well as the major stock index (NSE NIFTY) using a multivariate DCC GARCH model.

2. Literature Review

Bitcoin is known for its volatility. Notwithstanding the price fluctuations, Bitcoin’s price has exploded since 2009. According to a widely held view, Bitcoin’s history is largely one of “astronomical” growth marked by a few severe price retrenchments (Likos and Hicks 2022). Bitcoin’s price crossed 1 USD in February 2011. The price of Bitcoin was under 2 USD for the first few years. In June 2011, Bitcoin hit its first bubble, increasing to 31 USD before sinking back down to single-digits (Likos and Hicks 2022). In April 2013, Bitcoin reached 200 USD, and by the end of November of the same year, it was worth more than 1000 USD. Bitcoin rose to 10,000 USD in November 2017 and touched 68,990 USD in November 2021. The price of Bitcoin exceeded 60,000 USD in April 2021, setting a new record. In 2017, Bitcoin was thought to be in a bubble, with investors coughing up a premium to own Bitcoin. The 2017–2018 bubble was essentially led by a boom in initial coin offerings, or ICOs (Haar 2021). There is a view that cryptocurrency volatility is mostly due to the “immature market” conditions in that traders are susceptible to emotions and therefore, extreme market reactions come forth.
Basic economic indicators such as utility, supply, demand and scarcity drive the prices of any commodity. Nevertheless, while these factors do determine the price of Bitcoin, there are other factors as well, which is not the case with fiat currencies. For instance, a simple Google search of the US Dollar will not impact its volume and value but can influence the prices of Bitcoin or any other cryptocurrency (Aalborg et al. 2019). As per Rudolf et al. (2021), traditional stores of value are valuable due to their scarcity, when large networks of people seek them, or their ability to generate income. They have utility but can never be a Store of Value (SoV) as they are not completely scarce. Scarce objects have conservation energy, such as what we observe in thermodynamics (Rudolf et al. 2021). Bitcoin’s scarcity arises from two dynamics: the first-order dynamic is a decentralised network running on thousands of nodes, and therefore, it is impossible to change the operation in the network without taking over the whole network (massive inertia), and the second-order dynamic is cloning which has failed, owing to Bitcoin’s multiple network effects (Böhme et al. 2015; Rudolf et al. 2021).
It is important to note that the effects of halving the price of Bitcoin are not easy to understand. Bitcoin’s value rose after the first halving in 2012. After the second halving, Bitcoin’s value plummeted in 2016 and rose again. In May 2020 when the third halving was done, there were no drastic consequences on the price of Bitcoin. As per Rudolf et al. (2021), Bitcoin obeys the Austrian school’s definition of currency as Hayek envisioned as it serves as an MoE (medium of exchange). According to Hayek, the only way to ensure the prevention of currency inflation was to allow economic agents to choose multiple currencies within their own nations (Rudolf et al. 2021). Bitcoin’s characteristic as a store of value has been the subject of much debate. As per standard economic theorising, traditional stores of value are valuable owing to their scarcity, demand from large networks and income generation ability. As per Colon et al. (2020), the cryptocurrency market is an attractive emerging market for investment but has been punctuated with a loss in value due to news about hacking. In May 2019, hackers stole 40 million USD worth of Bitcoin from one of the largest cryptocurrency exchanges in the world, known as Binance. Therefore, investors face high risk from cryptocurrency investment (Colon et al. 2020; Setiawan et al. 2021).
Some studies have focused on Bitcoin’s place in the financial system in terms of its means of exchange characteristics and diversification (Brière et al. 2013; Glaser et al. 2014). The dynamic correlations between Bitcoin and gold and their characteristics as financial assets (Jin et al. 2019; Klein et al. 2018) have also been studied. Bitcoin’s viability as a replacement for fiat currencies has been examined (Lo and Wang 2014). As an investment alternative, the benefits and costs of the inclusion of Bitcoin in portfolios have been examined (Moore and Stephen 2016; Symitsi and Chalvatzis 2019). Many studies have also focused on the volatility of digital currencies (Beneki et al. 2019; Fassas et al. 2020). Integrated surveys on cryptocurrency characteristics (Corbet et al. 2020) and the tradability of cryptocurrencies (Wei 2018) have also been conducted. Some studies focus on a detailed view of the hedging capabilities of Bitcoin and its role as a store of value (Dyhrberg 2016; Baur and Dimpfl 2021). Conlon and McGee (2020) investigated the safe haven properties of Bitcoin during the COVID-19 bear market and found that Bitcoin does not shelter investors from market turbulence. A similar study conducted in China by Corbet et al. (2020) bolsters the argument that bitcoins do not act as hedges during financial crises and add that they are amplifiers of contagion.
As per Rogojanu and Badea (2014), Bitcoin is gold in a virtual environment. The said study identified several pros and cons of Bitcoin along the lines of the ideal properties of a currency as envisaged by FA Hayek, who in 1976 envisioned such monies in The Denationalization of Money. However, Hayek did not explain how such monies would be widely accepted in societies. The advantages of Bitcoin include its flexibility, lower transaction cost, no third-party commissions, it does not spur rapid inflation, assures trader anonymity and requires no central intervention. The disadvantages of Bitcoin include its high price volatility, speculative attacks, limited confidence in Bitcoin without governmental backing and greater likelihood of theft in cyberspace among others (Rogojanu and Badea 2014).
As per Kayal and Rohilla (2021), the supply-side variables seem to be insignificant in influencing the prices of an unregulated currency. Furthermore, the supply-side factors remain difficult to determine as the future money supply is reflected in the current prices because of a known algorithm (Kayal and Rohilla 2021). The predetermined supply schedule of Bitcoin prevents its debasement. Also, an open-source code has led to the emergence of alternative cryptocurrencies. As per Luther and Sridhar (2021), there is considerable overlap between Austrian economics and cryptocurrencies. Many have been critical of discretionary monetary policy and advocated competition among currencies as envisioned by Hayek. However, there have been conflicting views on it. Many hailing from the Austrian school of economics have been apprehensive of Bitcoin’s potential to function as a medium of exchange since as per Mises’s regression theorem, an item must have some non-monetary use value to be acceptable in exchange sans government support.
Liu and Tsyvinski (2021) attempted to understand if cryptocurrencies’ returns behave similarly to other asset classes. The study investigates whether major cryptocurrencies comove with stocks, currencies, commodities and macroeconomic factors and found that cryptocurrency market-specific factors explain the observed variations in returns. Consequently, it can be gleaned that markets do not view cryptocurrencies similarly to standard assets.
In India, there is neither a ban on cryptocurrencies (or crypto assets) nor a clear, unambiguous regulatory framework that governs their usage (RBI 2022). The crypto bill is expected to “create a facilitative framework for the creation of the official digital currency to be issued by the Reserve Bank of India”. This bill will also ban all private cryptocurrencies, except for allowing “for certain exceptions to promote the underlying technology of cryptocurrency and its uses” The Governor of RBI branded cryptos as a “threat to macroeconomic and financial stability” (RBI 2022). In the Budget for FY 2022–23, India announced taxes on digital assets like cryptocurrencies and non-fungible tokens (NFT) (30-percent tax on the transfer of assets and a 1-percent tax at TDS). The move has inspired a heated debate on the legality of cryptocurrencies and whether the imposition of taxes has served to legitimise their existence (RBI 2022). It is important to note that traditionally, Indians invested in buying gold or used savings accounts and fixed deposits. Furthermore, buying gold is an ingrained cultural habit, and gold is handed down generations within families. Not surprisingly, India is one of the largest markets for the yellow metal (Madhok 2022).

3. Data and Methodology

The data for the present study were taken from 11 November 2017 to 11 November 2021. There are no historical data available on the BTC-INR prior to 2017. The dependent variable is Bitcoin returns. Data on Bitcoin were taken from the website of Yahoo Finance India (Yahoo Finance 2022). The independent variables are GOLD cash rate, the data for which were taken from the MCX India website (MCX 2022). The data for INR-USD exchange rate were culled from the RBI website (RBI 2022) while data on NIFTY-50 were taken from NSE India website (NSE 2022). The independent variables are GOLD cash rate taken from MCX website, INR-USD exchange rate and NIFTY-50 taken from investing.com (Investing.com 2022). This paper will compare Bitcoin as an investment vehicle to NIFTY-50 and gold. This paper uses the multivariate GARCH process, as it is considered the most appropriate model for modelling stock indices, gold and currencies. The univariate GARCH models are oriented towards examining the sensitivity and persistence of a variable’s volatility shock on itself. Conversely, multivariate GARCH models (MGARCH) analyse the impact of the volatility of a variable on another variable. The most widely used form of MGARCH models are the study of co-volatilities in several markets by taking into account the transmission of volatility, price volatility and nonlinearity in variance. DCC-GARCH models help in forecasting multi-period volatility and correlations as the current volatility of one time series is not only influenced by its own past innovation but also by past innovations to volatilities of other time series.
There are several advantages to using the DCC modelling as it gives insight into markets’ volatility clustering and synchronisation in financial time series data. Dynamic conditional correlation (DCC) and generalised autoregressive conditional heteroscedasticity (GARCH) are found to be efficient methods to capture market volatility (Afzal et al. 2021). Studies show that the DCC-GARCH model is found to be more accurate in yielding conditional variance. Therefore, by using a conditional correlational and time-varying effect, this DCC model provides a better estimation of the dynamic correlation structure for capturing the volatilities and forecasting returns more efficiently than other models. Also, investors are more interested in co-movement and spillovers between the assets (or markets). The volatility captured by the GARCH (1,1) method is underestimated, but the volatility captured through the DCC model is more accurately addressed. The GARCH family models alone cannot capture volatility effectively. Therefore, dynamic conditional models can capture better volatility of stock returns without any assumptions or problems of underestimation or overestimation of market risk (Afzal et al. 2021). All analyses were performed using EVIEWS and RStudio.
GARCH 1, 1 model is as follows:
First a GARCH model with mean and variance equations estimated as shown below:
Δ l n P r i c e t = β 0 + β 1 l n P r i c e t 1 + β 2 I N D U S D t 1 + β 3 N I F T Y 50 t 1 + β 4 G o l d C a s h t 1 + ε t
σ t 2 = e x p ( λ 0 + λ 1 I N D U S D t 1 + λ 2 N I F T Y 50 t 1 + λ 3 G o l d C a s h t 1 + α ε t 1 2     + β σ t 1   2
EGARCH model is as follows:
The second model is the exponential GARCH model, which investigates if the return on Bitcoin is asymmetrically affected by good and bad news (known as the leverage effect) with mean and variance equations estimated as shown below:
Δ l n P r i c e t = β 0 + β 1 l n P r i c e t 1 + β 2 I N D U S D t 1 + β 3 N I F T Y 50 t 1 + β 4 G o l d C a s h t 1 + ε t
l n ( σ t 2 ) = λ 0 + λ 1 I N D U S D t 1 + λ 2 N I F T Y 50 t 1 + λ 3 G o l d C a s h t 1 + α ( ε t 1 σ t 1 ) + γ ( | ε t 1 σ t 1 | 2 π ) + δ ln ( σ t 1   2 )
Afzal et al. (2021) outline the DCC MGARCH estimation procedure as follows. The first step is to estimate the univariate GARCH model. Then a time-varying correlation matrix is calculated with the standardised residuals obtained from the univariate GARCH estimation. Assuming that the returns of N assets are conditionally and normally distributed and that the DCC GARCH is a generalised form of the CCC (constant conditional correlation) GARCH; It can be specified as below:
r t | I t ~ N ( 0 , D t R t D t )
Q t = ( 1 α β ) Q ¯ + α u t 1 u t 1 + β Q t 1
R t = d i a g ( Q t ) 1 Q t d i a g ( Q t ) 1
R t , the dynamic correlation matrix, is the standard deviation of the diagonal matrix from univariate GARCH models. Q t is a positive semi-definite matrix and Q ¯ is the unconditional variance matrix of u t . The standardised residuals from the GARCH model are given as u i t ~   N ( 0 ,   R t ) . α   and   β are scalars; α + β < 1 implies that the model is mean reverting.
The covariance forecasting using DCC GARCH involves generating r-step ahead of Q t with E ( u t + 1 u t + 1 ) Q t + 1 .

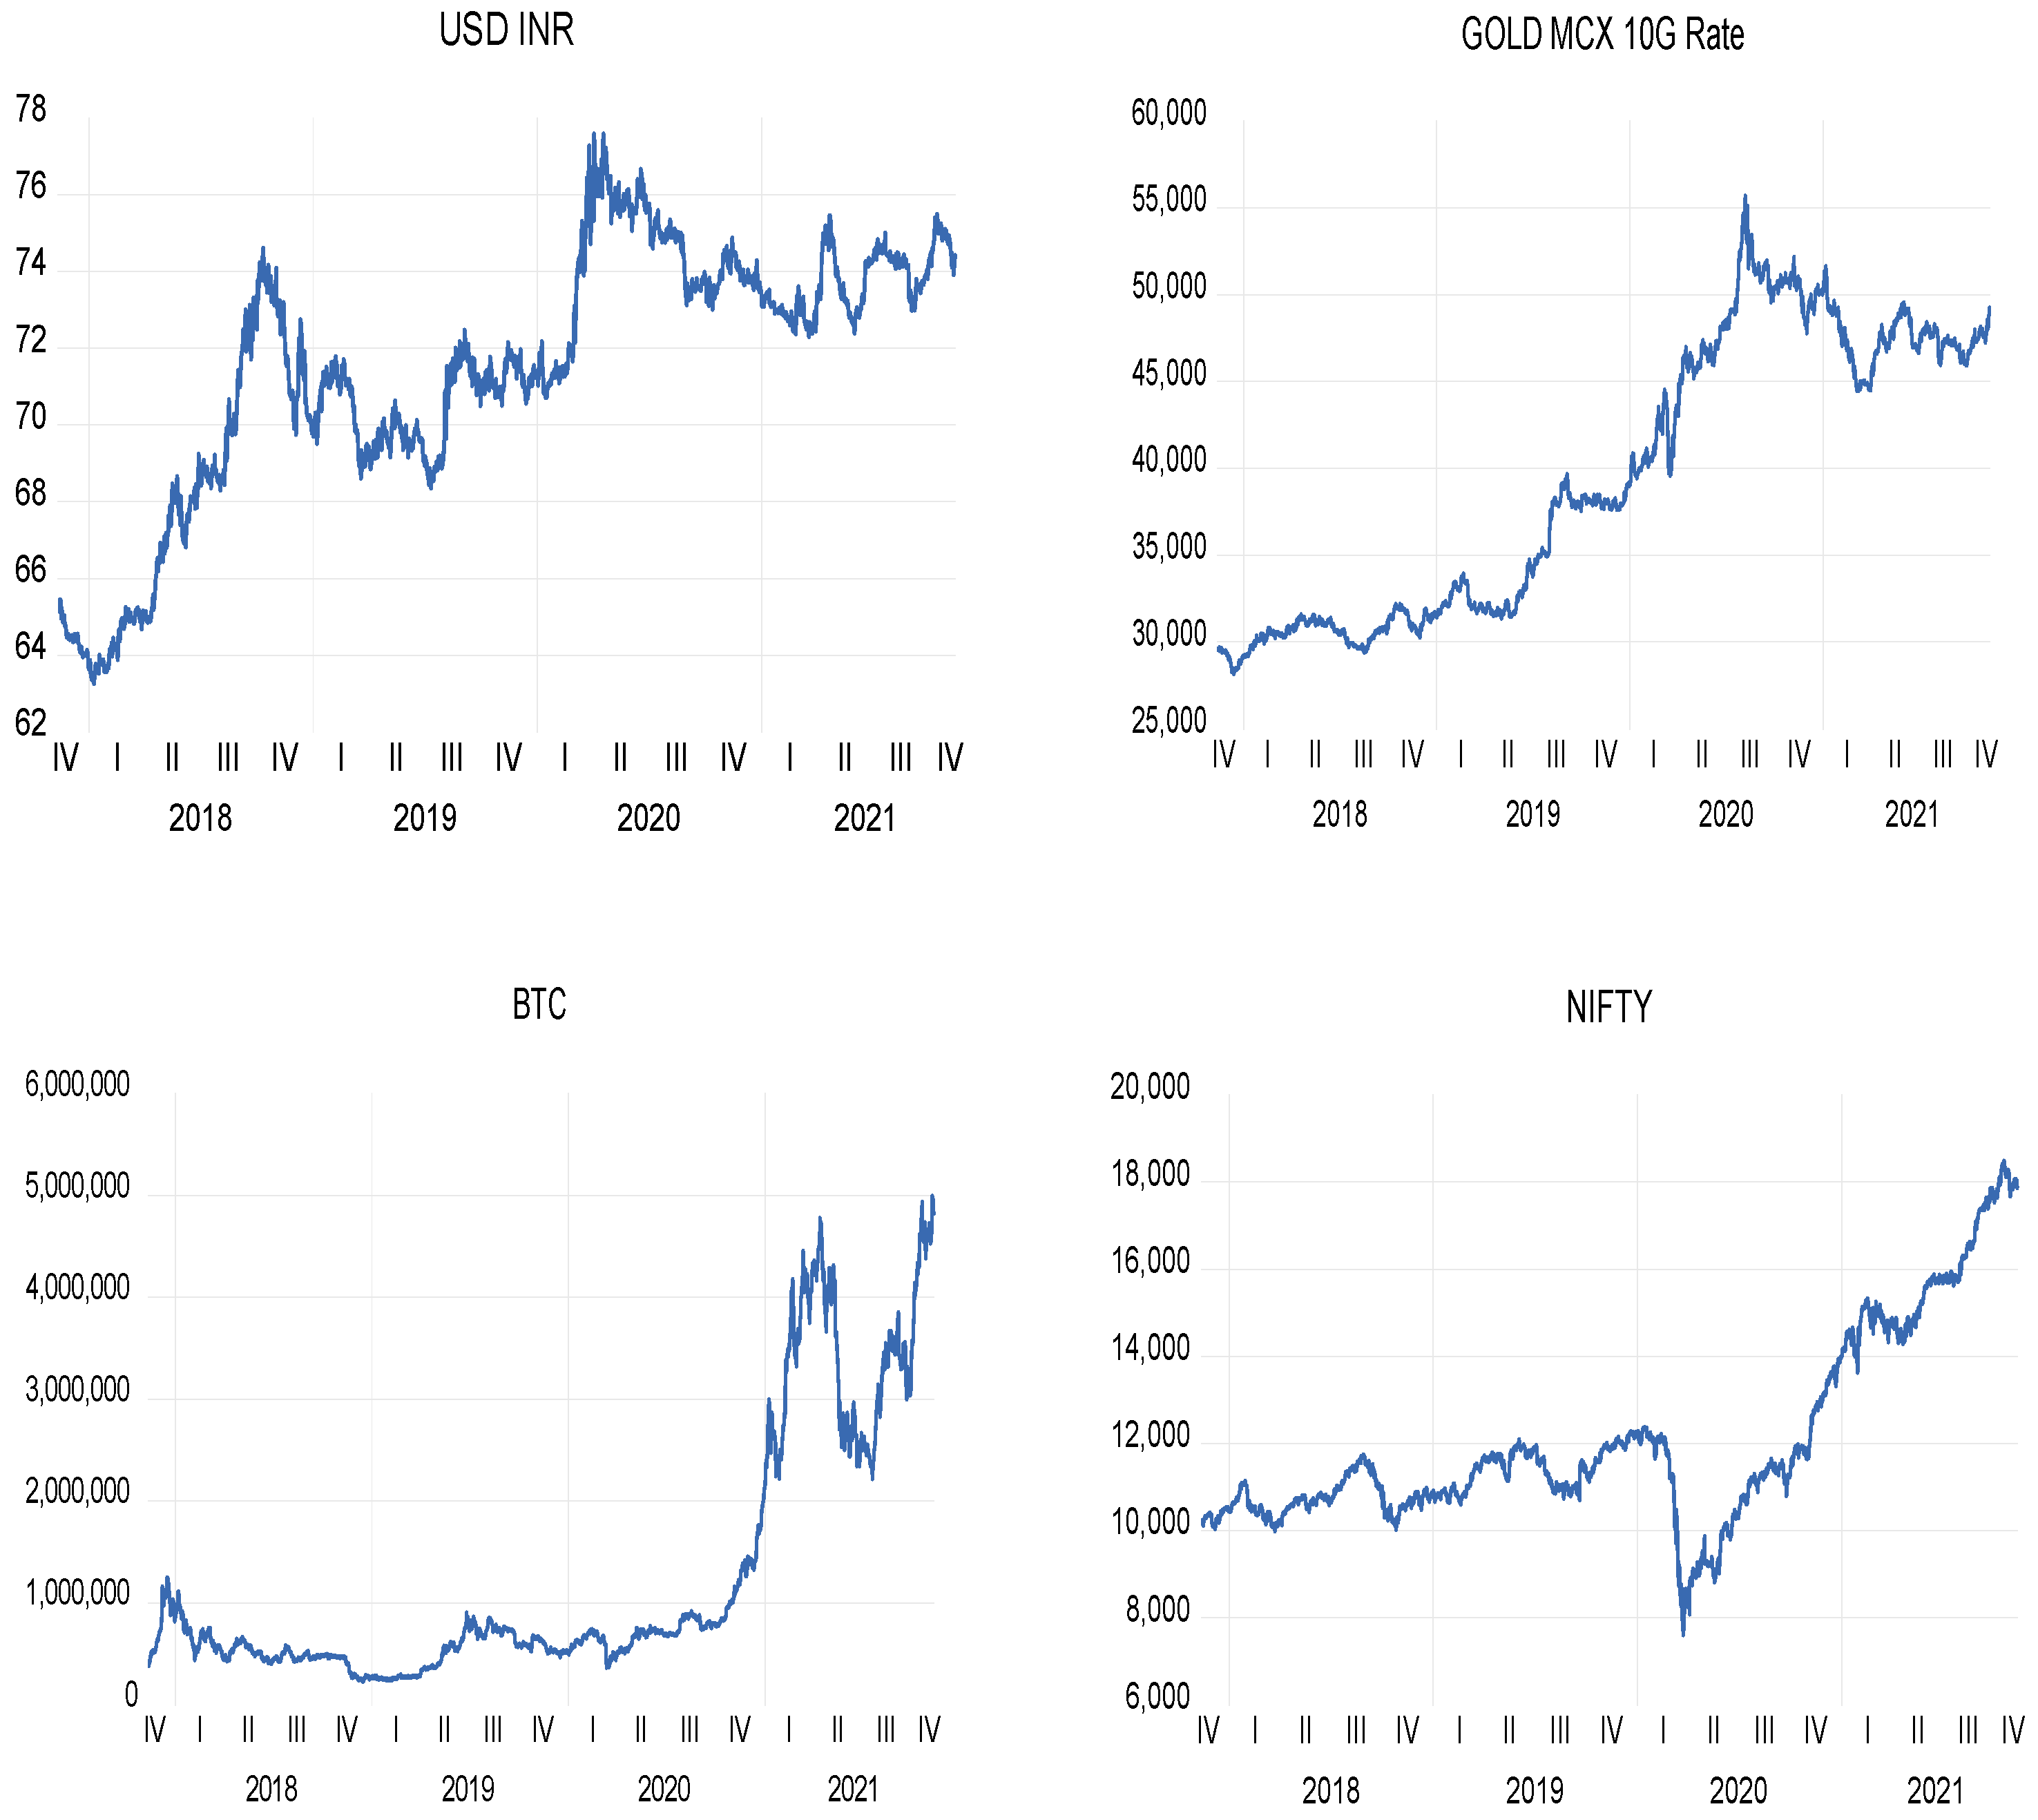
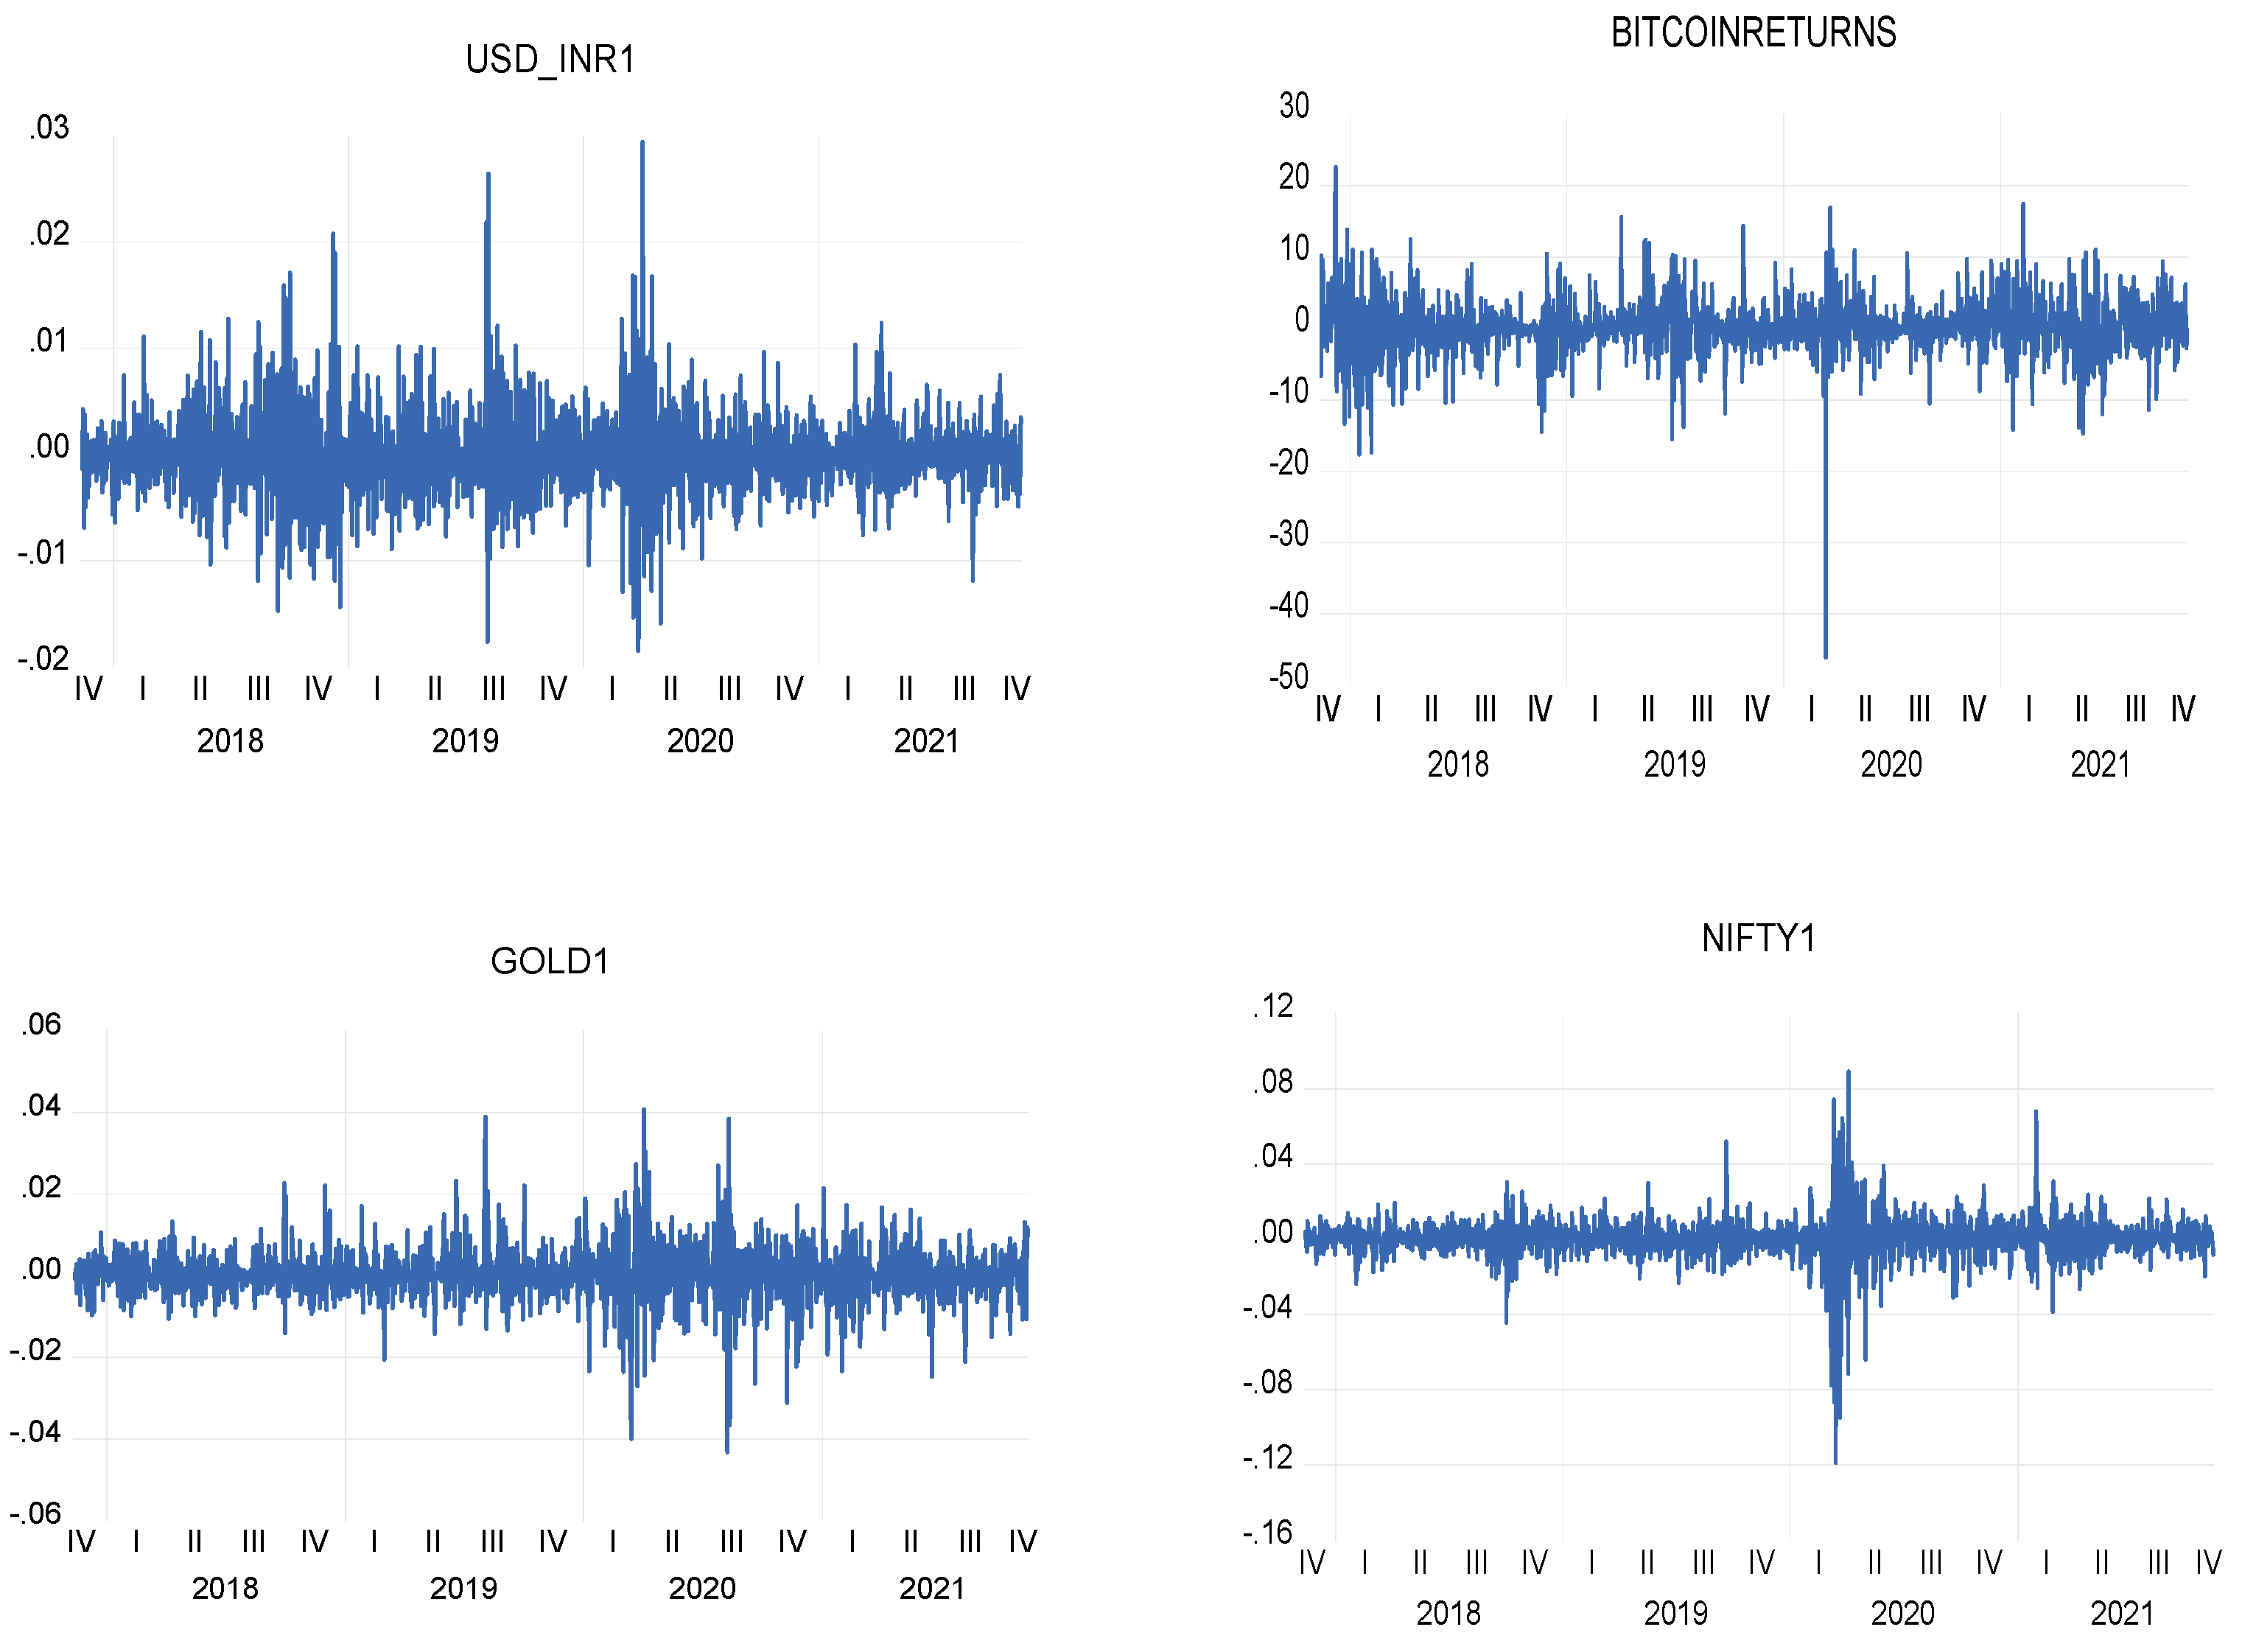
4. Time Series Properties

All graphs in Figure 1 indicate the presence of a random walk. The random walk model is common for the prices of financial assets. It means that the random walk does not settle at a long-term mean over time but can take any value. Bitcoin appears to be sensitive to some shocks and is clearly non-stationary. Volatility is a proxy for risk. It is a well-known fact that the returns depend on volatility (risk).
From Figure 2, the volatility variability is evident, which is a common feature in the case of financial assets. Volatility clustering is also evident, as explained by Mandelbrot (1963): “Large changes tend to be followed by large changes, of either sign, and small changes tend to be followed by small changes”. The ADF test along with the KPSS test was conducted on all the variables. The null hypothesis of the ADF test is that the series has a unit root (non-stationary). The results showed the presence of a unit root. The null hypothesis of the KPSS test is that the time series has no deterministic trend. Formal tests such as Engle’s Lagrange multiplier test were also done, which revealed a strong ARCH effect in the first differenced logged Bitcoin price residuals. Since initial test results showed AR(1) process, estimation is done using a GARCH(1,1) model.

5. Results

Table 1 shows that the skewness for all variables is fairly symmetrical while that of Nifty is on the higher side. Skewness can also be considered a measure of risk. Kurtosis is the degree to which scores cluster in the tails or the peak of a distribution. It shows the heaviness of the distribution tails. Kurtosis also refers to the degree of presence of outliers in the distribution. The above results indicate leptokurtic distributions (statistical distributions with kurtosis greater than three or fatter tails), indicating a greater likelihood of positive and negative returns realisations. The negative skew values show more chances to earn negative returns than positive returns. Investors who are risk-aversive prefer low kurtosis.

5.1. GARCH (1,1) Results

For GARCH (1,1) Volatility persistence of the return on Bitcoin, the dependent variable is the return on Bitcoins.
Alpha (α) in Table 2 represents how volatility reacts to new information, while beta represents volatility persistence. Furthermore, alpha + beta shows the overall measurement of volatility persistence. The variance equation shows volatility clustering and volatility persistence. As the GARCH coefficient value is higher than the ARCH coefficient value, we can conclude that volatility is persistent and clustering. ARCH term and GARCH term are significant. The sum of the coefficients is close to one, which means that shocks to conditional variance will be persistent. Since the GARCH parameter is significant, a large return value (positive or negative) will lead forecasts of variance to be high for a prolonged time. A positive volatility shock to NIFTY increases the variance of Bitcoin returns, revealing that Bitcoin may not be reckoned as a safe alternative asset. The high variance of an asset does not instil confidence amongst investors. In other words, it is anathema for risk-averse investors. The variance equation shows that a positive volatility shock to the dollar–rupee exchange rate increases the variance of the Bitcoin returns, indicating that Bitcoin is not considered an alternative currency by investors. Yesterday’s gold prices significantly impact the variance of the Bitcoin returns increasing volatility, indicating that Bitcoin is not viewed as a viable alternative asset vis-a-vis gold by Indian investors. Overall, Bitcoin does not seem to display properties that would attract risk-averse investors.

5.2. Exponential GARCH (EGARCH)

The exponential GARCH model examines the reaction to good and bad news, also known as the leverage effect. As per Dyhrberg (2016), asymmetric models describe the dynamic relationship between variables as volatility declines when returns increase and rise when returns decrease (leverage effect).
The results presented in Table 3 below confirm the presence of a significant leverage effect as the exponential GARCH term is negative and statistically significant. This indicates that Bitcoin is not a sound investment in anticipation of bad news. Good and bad news have an asymmetric impact on the volatility of the Bitcoin returns. Therefore, Indian investors have not used Bitcoin or gold interchangeably to hedge market risks. In other words, Indian investors did not believe that Bitcoin was a safe investment option for hedging. This finding, however, is not in line with Dyhrberg (2016), who used asymmetric GARCH models and did not find a leverage effect concluding that Bitcoin was useful as a hedge for risk management vis-a-vis stock indexes in the US context. However, many studies have confirmed that Bitcoin might not actually serve as a hedging instrument, especially during an economic downturn (Conlon and McGee 2020; Corbet et al. 2020; Bouri et al. 2017).
The findings in Table 3 indicate that the past period shocks have an asymmetric effect on the current period of Bitcoin return volatility. In other words, bad news has been found to affect the volatility of Bitcoin returns more than good news. This is an important finding as cryptocurrencies are viewed as instruments for investment and speculative gains. Therefore, determining the causes of return volatility is pertinent in making long-term investment decisions. Furthermore, due to greater financial integration, there is greater interest in understanding the effect of shocks and the volatility of the markets (Ari 2020).

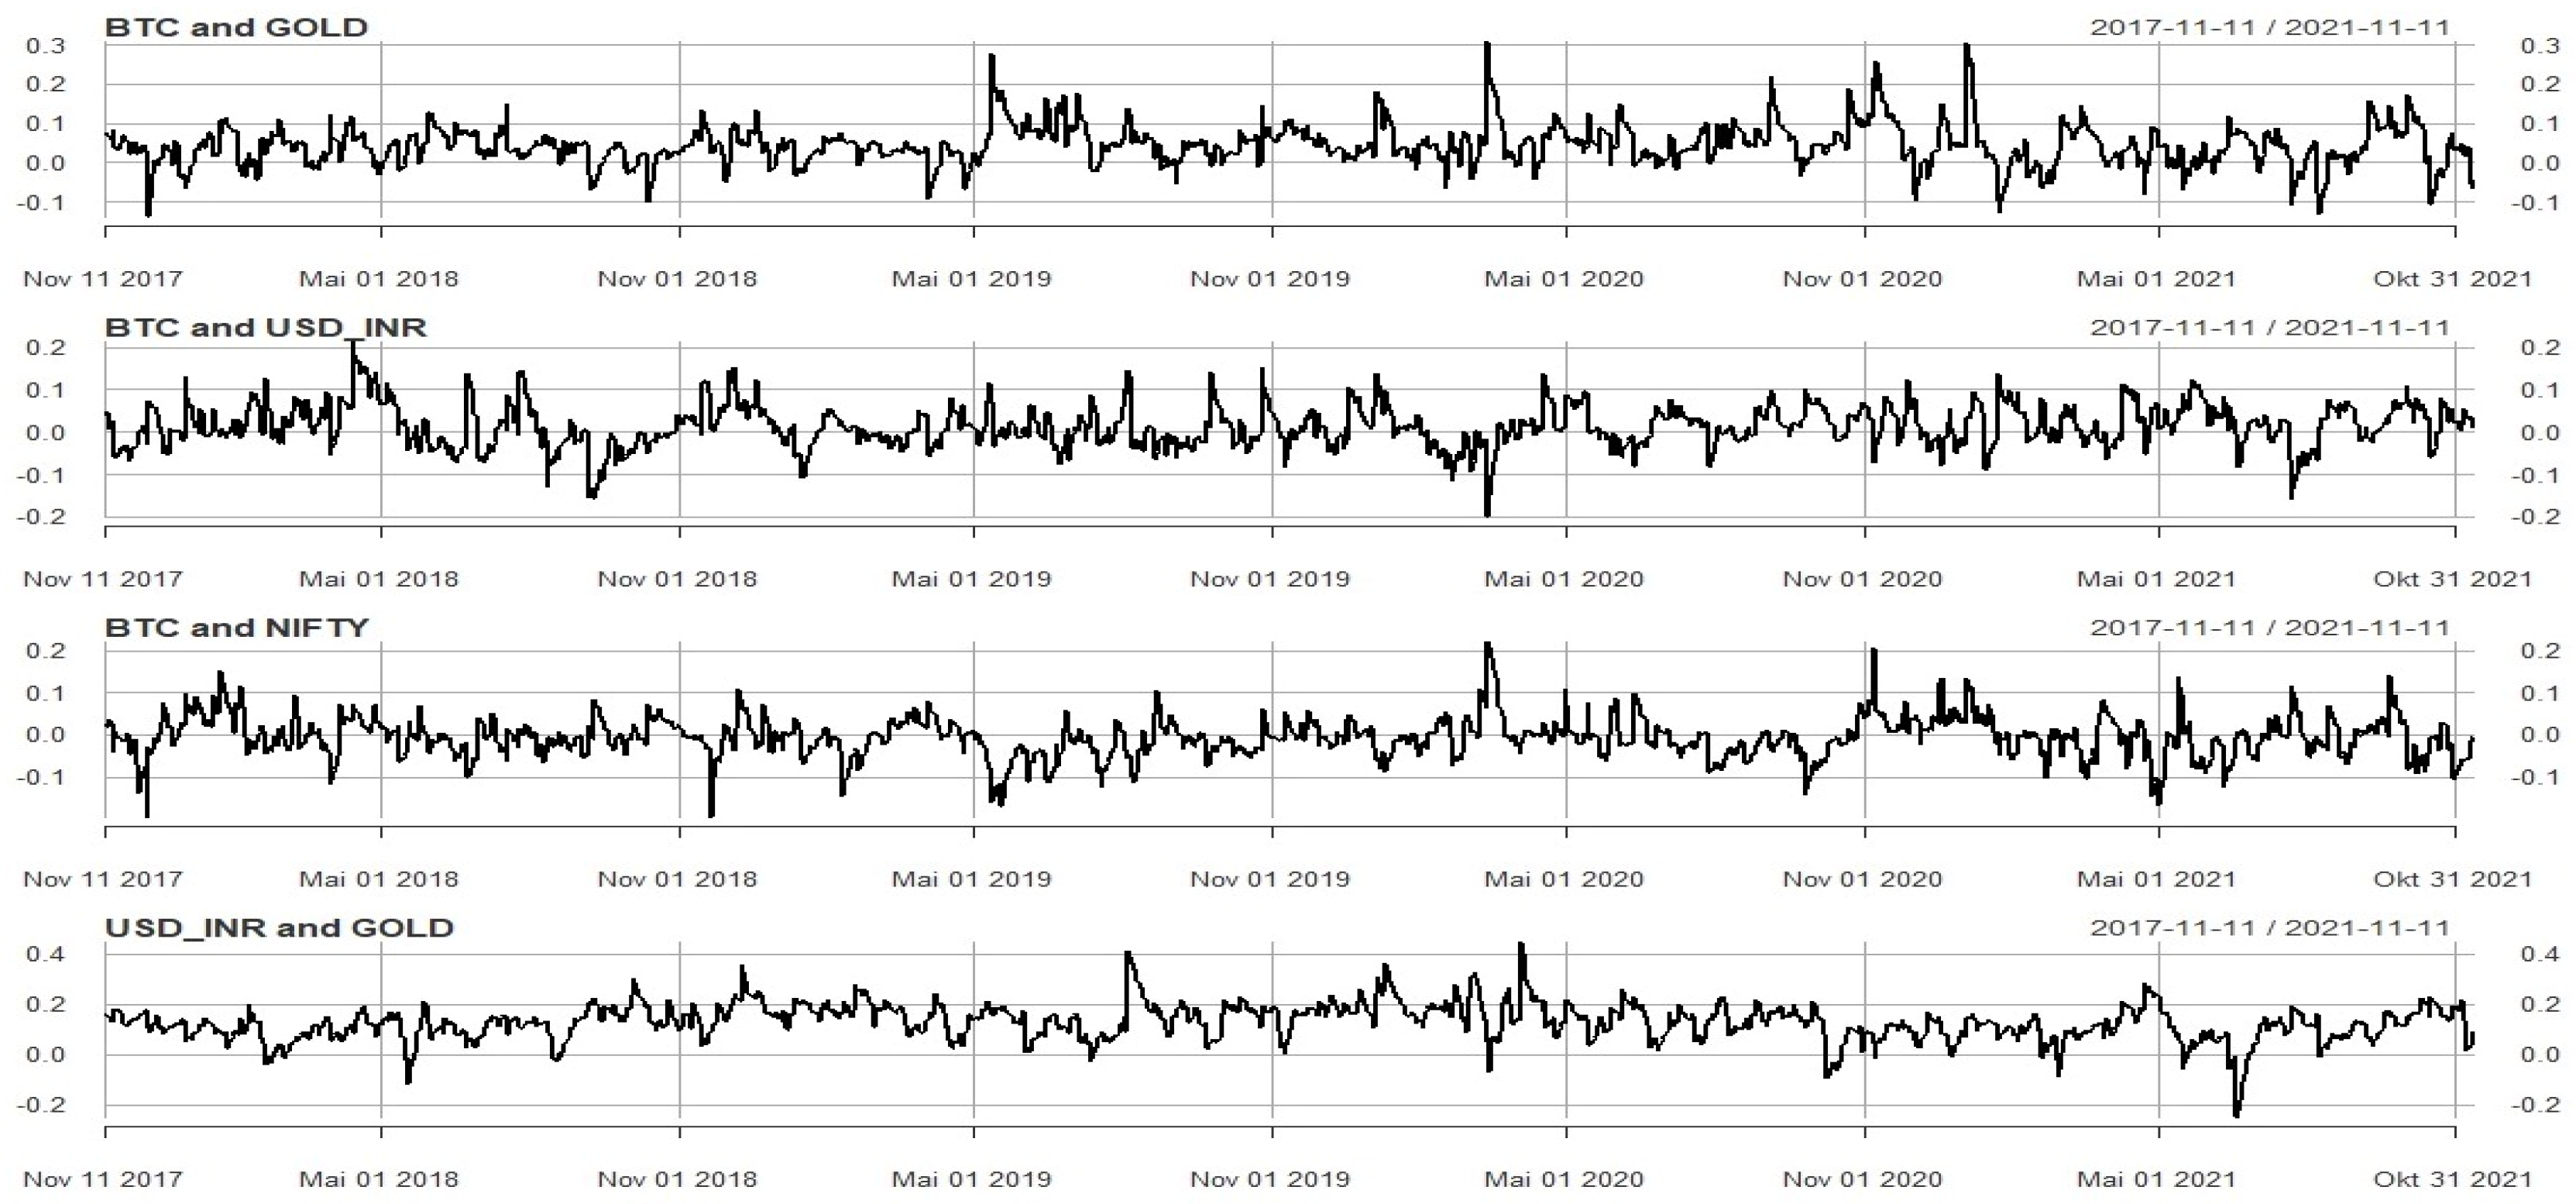
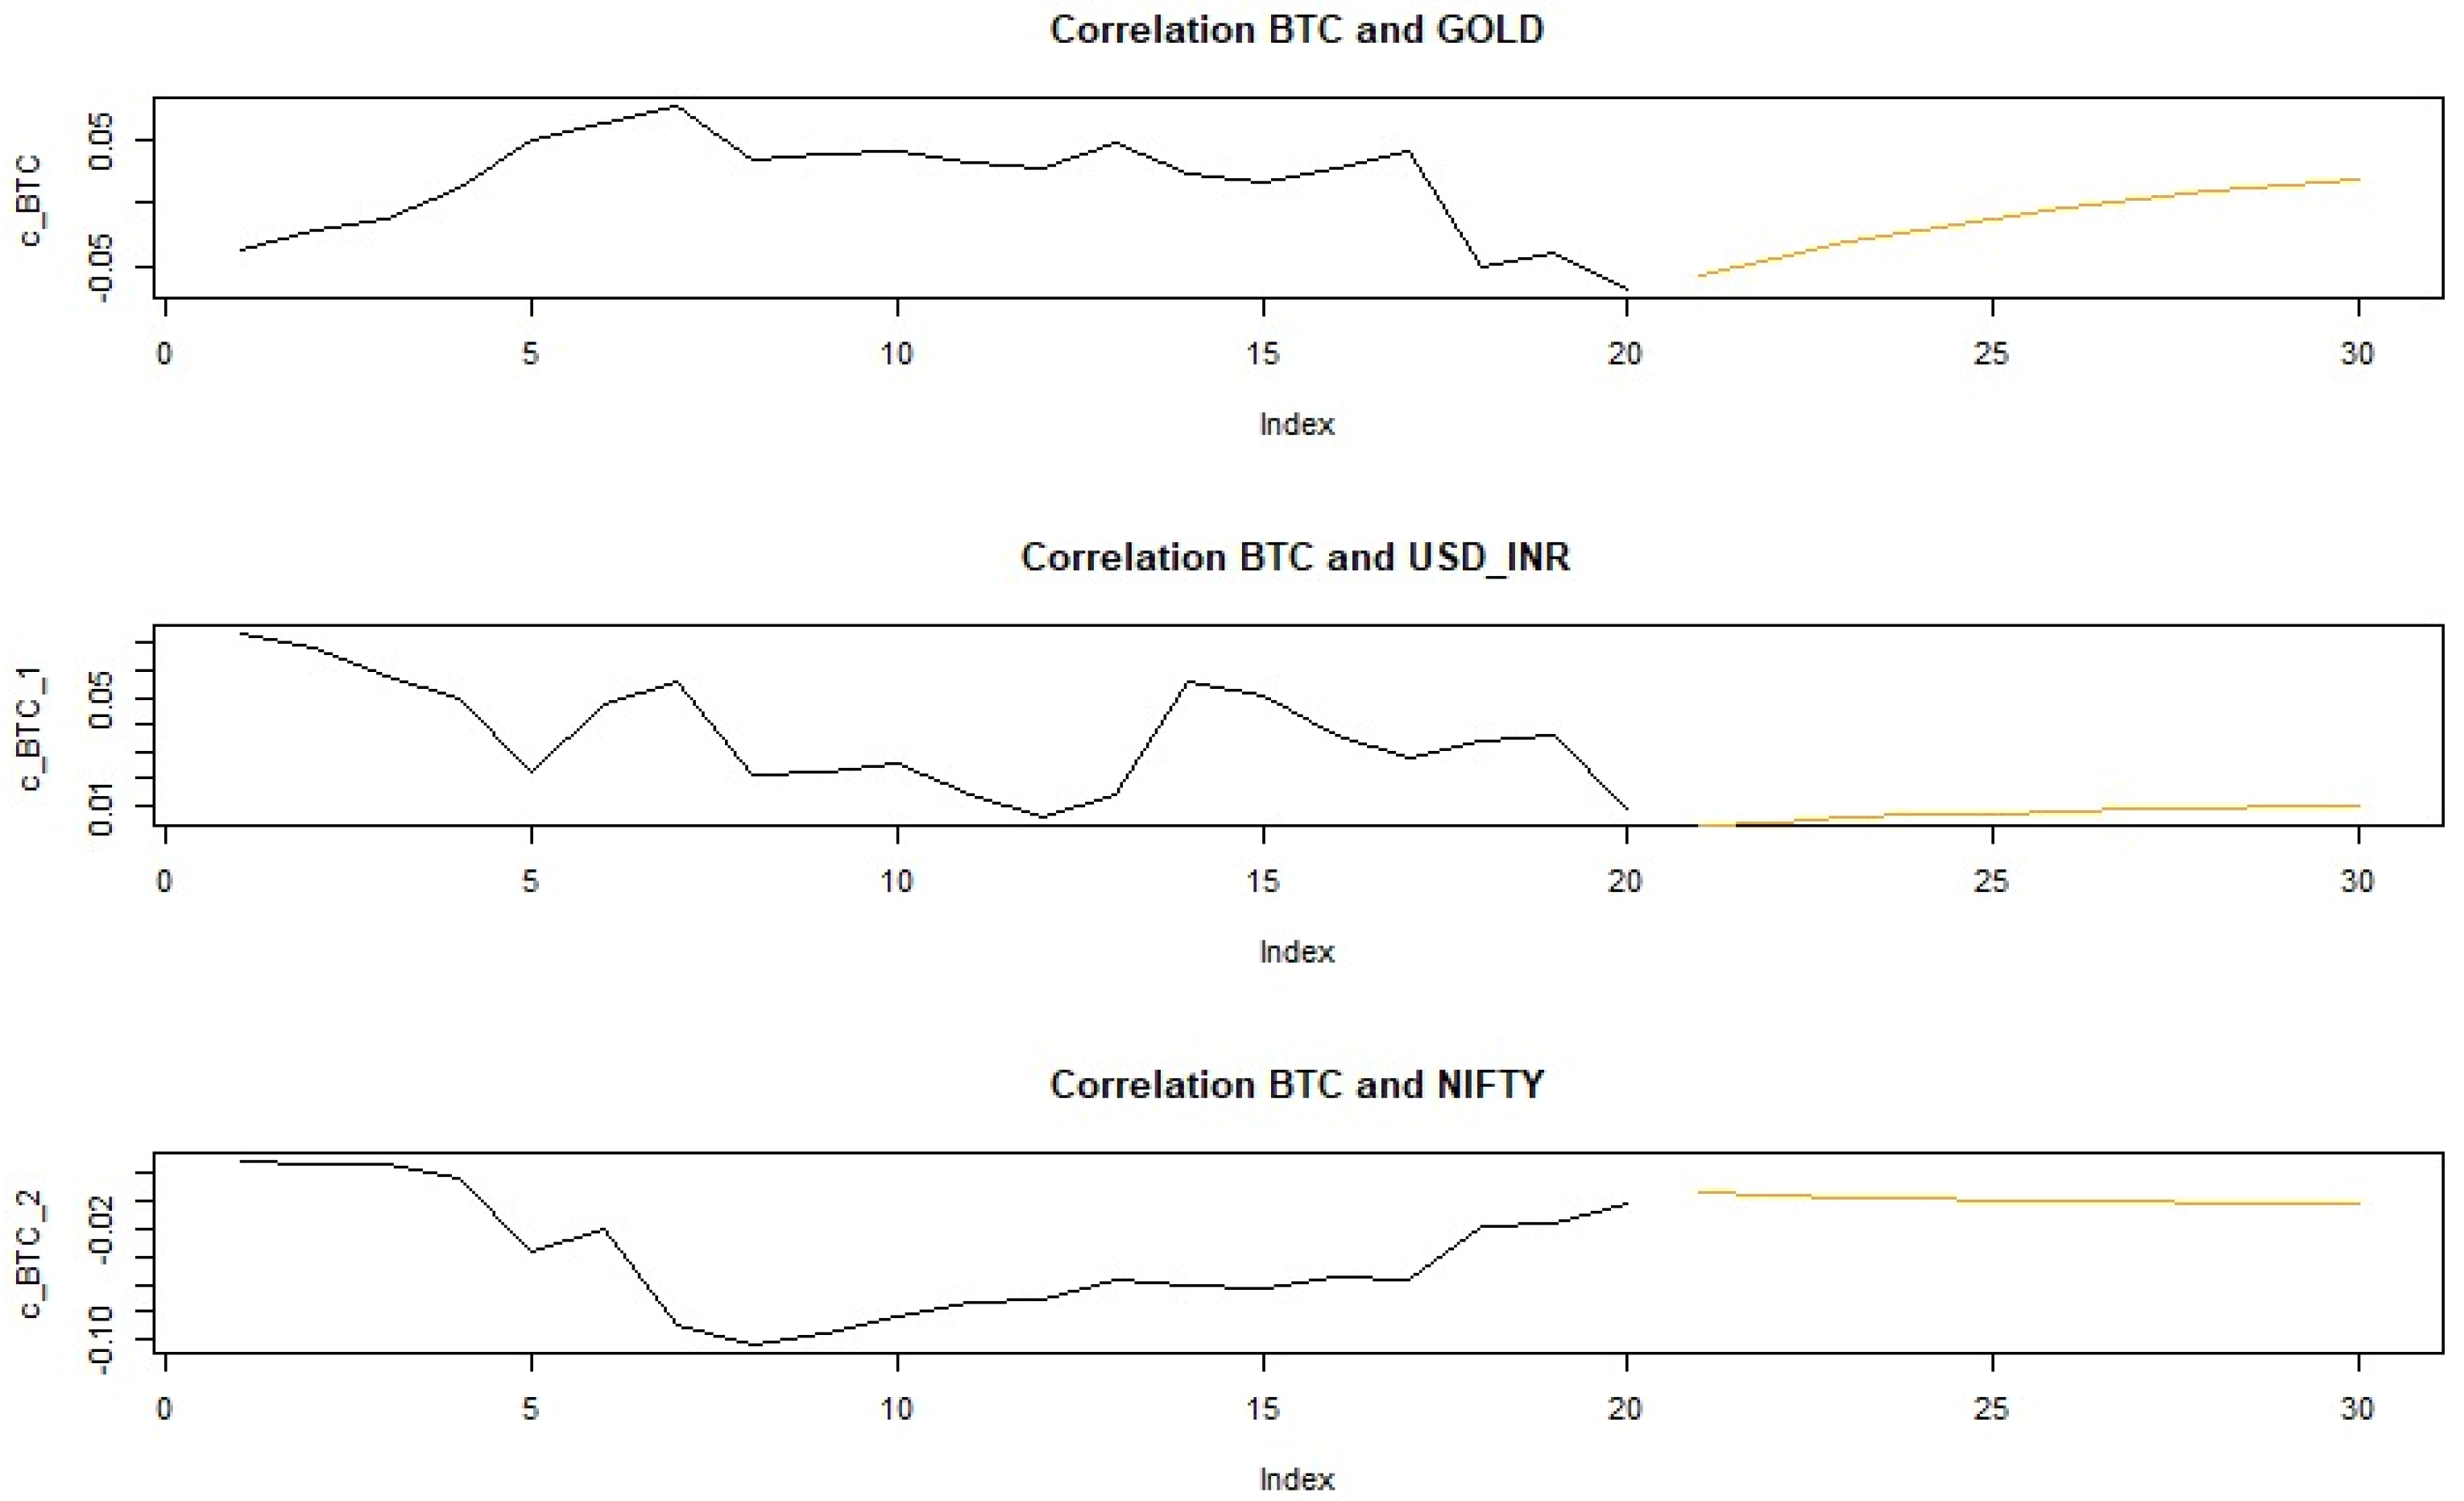
5.3. DCC GARCH Model

The above results do not explore the dynamic correlations between the asset classes. Therefore, the DCC GARCH model is used for better comparison since the current volatility of one time series is not only influenced by its own past innovation but also by past innovations in volatilities of other time series (Bhowmik and Wang 2020). This will help in better analysis of correlation dynamics and co-movement of returns of asset classes. As per Rudolf et al. (2021), Bitcoin does not have any internal variables except halvings and hacks, which cannot be examined as a function of returns. Therefore, Bitcoin’s value is driven by market forces. The returns are expected to be correlated with stock index crashes and lower volatility after halvings. Also, gold and NIFTY are expected to have an inverse relationship. Studies using DCC GARCH have found that pairing equities with gold is more effective in reducing the downside risk (Ali et al. 2021).
The results of the DCC GARCH model are given in Table 4.
Joint dccα1 and dccβ1 parameters are important in this analysis as individual parameters α1 and β1 are of univariate GARCH. As Table 4 shows, there is no short-run volatility spillover between the variables. However, since the p value of dccβ1 is less than 0.05, there is a long-run spillover of volatility between the variables; dccα1 and dccβ1 denote the parameters of the dynamic conditional correlation. If the coefficients of dccα1 and dccβ1 are positive and significant, it reveals the transmission of information both in the short run and long run. However, this study has found that there is no significant spillover effect in the short run whereas, in the long run, there is some transmission of information between the markets. Also, the sum of dccα1 and dccβ1 coefficients is less than 1 which shows that the DCC is mean-reverting.
Figure 3 shows the dynamic conditional correlations among gold, INR-USD and Bitcoin.
As Figure 3 shows, the co-movement between Bitcoin and gold is positively high around the time COVID-19 started, revealing that investors perceived Bitcoin as a hedge since gold is traditionally perceived as a hedge against recession. The co-movements between Bitcoin and gold show a negative correlation in the latter months of 2021, revealing that investors perceived Bitcoin as an alternative to gold; as a safe haven asset. However, this has not been a consistent phenomenon. The co-movement between Bitcoin and INR-USD is negatively low around the time COVID-19 broke out, revealing that investors perceived Bitcoin as a reserve currency. A similar trend emerged in the latter part of 2021, echoing similar investor sentiments. The correlation between Bitcoin and NIFTY shows an increasing trend indicating that of late, investors have perceived Bitcoin as a traditional financial asset. However, the overall trend does not present unambiguous evidence that Bitcoin is viewed as a mature asset. Bitcoin and INR-USD show a largely negative co-movement during and post the outbreak of COVID-19, which reveals that investors did perceive it as a store of value and having some credible characteristics as a currency.
Correlation and forecast results for the variables are further depicted in Figure 4.
The forecasted values as shown in Figure 4 indicate that Bitcoin and NIFTY will have an upward trajectory as opposed to Bitcoin and USD_INR. Bitcoin and gold are also projected to have a rising trend. The literature states that the higher the volatility of Bitcoin, the lower the incentive for the general public to use it in transactions and payments. In other words, a sudden drop in the price of Bitcoin is a loss for the buyer and erodes user confidence in using Bitcoin as a medium of exchange (Sahoo 2017).

6. Limitations and Future Study Directions

The limitations of this paper are that measures such as the RBI’s repo and reverse repo and other macro-economic variables that control India’s money supply are not included. The aforementioned variables can provide a deeper insight into the cost of a currency and its potency as a medium of exchange with implications for the attractiveness and adoption of Bitcoin in India. Second, there is a paucity of data related to BTC in INR prior to 2017. Therefore, undertaking a meaningful analysis of major shocks such as crypto markets is rather limited, inhibiting a richer analysis. Third, the influence of hacks and halvings is inevitable as the Bitcoin market is sensitive. However, data regarding such events are not available. Aysan et al. (2019) find a significant impact of geopolitical risks on the returns and volatility of Bitcoins. Future studies should incorporate such variables in the model to understand their causal effect. Furthermore, this paper does not analyse the Dynamic conditional correlations (DCCs) of financial firms versus nonfinancial firms after the outbreak of COVID-19 as some studies have in the recent past (Akhtaruzzaman et al. 2020). This could be a useful line of inquiry for future researchers. A future extension of this work could be in line with that of Ali et al. (2021) estimating four-moment modified value-at-risk; in this case, it would be pairing gold and Bitcoin with NIFTY-50 and constructing global minimum variance (GMV) portfolios that examine the optimal weights for each asset separately in addition to the DCC GARCH model.

7. Conclusions and Policy Implications

This study found statistically significant long-run volatility spillovers between investigated markets, and conditional correlations between returns during the outbreak of COVID-19 were found to be highly volatile. The co-movement has generally increased between Bitcoin and gold, while the co-movement between Bitcoin and the USD-INR exchange rate did not. This study has shed light on Bitcoin’s properties and how investors in India perceive it, on the potential of Bitcoin in portfolio management. The study also contributes to research on the volatility of Bitcoin vis-à-vis gold and the Indian Rupee post-COVID-19.
The presence of the leverage effect revealed that the volatility of Bitcoin returns increases more with bad news. Since volatility is an indicator of risk, it can be understood that investors did not perceive Bitcoin as a safe investment and did not consider it a mature asset. The DCC GARCH models presented a more granular picture of the co-movement among various explanatory variables. The overall analysis indicates that Bitcoin was not considered a safe hedge and an investment option by Indian investors during the study period. This is in line with the results of studies conducted in the US (Conlon and McGee 2020) and China (Corbet et al. 2020).
The findings confirm the long-term volatility (risk) spillover between the markets. This has policy implications, especially in the context of regulation in India. Also, it will deepen the understanding of Bitcoin’s overall role in the market. These insights are valuable to policymakers, investors and entrepreneurs.

Author Contributions

Conceptualisation, S.M., V.V.; methodology, S.M., V.V.; software, S.M.; formal analysis, S.M.; writing, S.M., V.V.; original draft preparation, S.M., V.V., M.F.-F.; writing—review and editing, S.M., M.F.-F.; supervision—M.F.-F. All authors have read and agreed to the published version of the manuscript.

Funding

This research received no external funding.

Institutional Review Board Statement

Not applicable.

Informed Consent Statement

Not applicable.

Data Availability Statement

Publicly available data sets were used in this study. The data can be found here: https://github.com/vjvictor/JRFM_DATA.

Acknowledgments

We are grateful to the Editor and to the anonymous reviewers for the helpful comments and suggestions.

Conflicts of Interest

The authors declare no conflict of interest.

References

  1. Aalborg, Halvor Aarhus, Peter Molnár, and Jon Erik de Vries. 2019. What can explain the price, volatility and trading volume of Bitcoin? Finance Research Letters 29: 255–65. [Google Scholar]
  2. Afzal, Fahim, Pan Haiying, Farman Afzal, Asif Mahmood, and Amir Ikram. 2021. Value-at-Risk Analysis for Measuring Stochastic Volatility of Stock Returns: Using GARCH-Based Dynamic Conditional Correlation Model. SAGE Open 11: 21582440211005758. [Google Scholar] [CrossRef]
  3. Akhtaruzzaman, Md, Sabri Boubaker, and Ahmet Sensoy. 2020. Financial contagion during covid–19 crisis. Finance Research Letters 38: 101604. [Google Scholar] [CrossRef] [PubMed]
  4. Ali, Fahad, Yuexiang Jiang, and Ahmet Sensoy. 2021. Downside risk in Dow Jones Islamic equity indices: Precious metals and portfolio diversification before and after the COVID-19 bear market. Research in International Business and Finance 58: 101502. [Google Scholar] [CrossRef]
  5. Ari, Yakup. 2020. Volatility Transmission Model using DCC-GARCH representation. In Studies at the Crossroads of Management & Economics. Edited by Samet Evci and Anshuman Sharma. London: IJOPEC, pp. 237–50. [Google Scholar]
  6. Aysan, Ahmet Faruk, Ender Demir, Giray Gozgor, and Chi Keung Marco Lau. 2019. Effects of the geopolitical risks on Bitcoin returns and volatility. Research in International Business and Finance 47: 511–18. [Google Scholar] [CrossRef] [Green Version]
  7. Baur, Dirk G., and Brian M. Lucey. 2010. Is gold a hedge or a safe haven? An analysis of stocks, bonds and gold. Financial Review 45: 217–29. [Google Scholar] [CrossRef]
  8. Baur, Dirk G., and Thomas Dimpfl. 2021. The volatility of Bitcoin and its role as a medium of exchange and a store of value. Empirical Economics 61: 2663–83. [Google Scholar] [CrossRef]
  9. Beneki, Christina, Alexandros Koulis, Nikolaos A. Kyriazis, and Stephanos Papadamou. 2019. Investigating volatility transmission and hedging properties between Bitcoin and Ethereum. Research in International Business and Finance 48: 219–27. [Google Scholar] [CrossRef]
  10. Bhowmik, Roni, and Shouyang Wang. 2020. Stock Market Volatility and Return Analysis: A Systematic Literature Review. Entropy 22: 522. [Google Scholar] [CrossRef]
  11. Böhme, Rainer, Nicolas Christin, Benjamin Edelman, and Tyler Moore. 2015. Bitcoin: Economics, Technology, and Governance. Journal of Economic Perspectives 29: 213–38. [Google Scholar] [CrossRef] [Green Version]
  12. Bouri, Elie, Rangan Gupta, Aviral Kumar Tiwari, and David Roubaud. 2017. Does Bitcoin hedge global uncertainty? Evidence from wavelet-based quantile-in-quantile regressions. Finance Research Letters 23: 87–95. [Google Scholar] [CrossRef] [Green Version]
  13. Brière, Marie, Bastien Drut, Valérie Mignon, Kim Oosterlinck, and Ariane Szafarz. 2013. Is the market portfolio efficient? A new test of mean-variance efficiency when all assets are risky. Finance 34: 7–41. [Google Scholar] [CrossRef] [Green Version]
  14. Briere, Marie, Kim Oosterlinck, and Ariane Szafarz. 2015. Virtual currency, tangible return: Portfolio diversification with bitcoin. Journal of Asset Management 16: 365–73. [Google Scholar] [CrossRef]
  15. Capie, Forrest, Terence C. Mills, and Geoffrey Wood. 2005. Gold as a hedge against the dollar. Journal of International Financial Markets. Institutions and Money 15: 343–52. [Google Scholar] [CrossRef]
  16. Ciaian, Pavel, Miroslava Rajcaniova, and d’Artis Kancs. 2016. The economics of BitCoin price formation. Applied Economics 48: 1799–815. [Google Scholar] [CrossRef] [Green Version]
  17. Civelek, Mehmet, Aleksandr Ključnikov, Jitka Kloudová, and Iveta Vozňáková. 2021. Digital local currencies as an alternative digital payment method for businesses to overcome problems of COVID-19 pandemic. Polish Journal of Management Studies 23: 57. [Google Scholar] [CrossRef]
  18. Colon, Francisco, Chaehyun Kim, Hana Kim, and Wonjoon Kim. 2020. The Effect of Political and Economic Uncertainty on the Cryptocurrency Market. Finance Research Letters 39: 101621. [Google Scholar] [CrossRef]
  19. Conlon, Thomas, and Richard McGee. 2020. Safe haven or risky hazard? Bitcoin during the COVID-19 bear market. Finance Research Letters 35: 101607. [Google Scholar] [CrossRef]
  20. Corbet, Shaen, Charles Larkin, and Brian Lucey. 2020. The contagion effects of the COVID-19 pandemic: Evidence from gold and cryptocurrencies. Finance Research Letters 35: 101554. [Google Scholar] [CrossRef]
  21. Dyhrberg, Anne Haubo. 2016. Bitcoin, gold and the dollar—A GARCH volatility analysis. Finance Research Letters 16: 85–92. [Google Scholar] [CrossRef] [Green Version]
  22. Fassas, Athanasios P., Stephanos Papadamou, and Alexandros Koulis. 2020. Price discovery in bitcoin futures. Research in International Business and Finance 52: 101116. [Google Scholar] [CrossRef]
  23. Glaser, Florian, Kai Zimmermann, Martin Haferkorn, Moritz Christian Weber, and Michael Siering. 2014. Bitcoin-asset or Currency? Revealing Users’ Hidden Intentions. Revealing Users’ Hidden Intentions. April 15 ECIS. Available online: https://papers.ssrn.com/sol3/papers.cfm?abstract_id=2425247 (accessed on 2 February 2022).
  24. Guesmi, Khaled, Samir Saadi, Ilyes Abid, and Zied Ftiti. 2019. Portfolio Diversification with Virtual Currency: Evidence from Bitcoin. International Review of Financial Analysis 63: 431–37. [Google Scholar] [CrossRef]
  25. Haar. 2021. What Is Bitcoin? August 12. Available online: https://time.com/nextadvisor/investing/cryptocurrency/what-is-bitcoin/ (accessed on 9 February 2022).
  26. Hendrickson, Joshua R., and William J. Luther. 2017. Banning bitcoin. Journal of Economic Behavior & Organization 141: 188–95. [Google Scholar]
  27. Investing.com. 2022. Bitcoin. Available online: https://in.investing.com/crypto/bitcoin/historical-data (accessed on 13 February 2022).
  28. Jin, Jingyu, Jiang Yu, Yang Hu, and Yue Shang. 2019. Which one is more informative in determining price movements of hedging assets? Evidence from Bitcoin, gold and crude oil markets. Physica A: Statistical Mechanics and Its Applications 527: 121121. [Google Scholar] [CrossRef]
  29. Kayal, Parthajit, and Purnima Rohilla. 2021. Bitcoin in the economics and finance literature: A survey. SN Business & Economics 1: 1–21. [Google Scholar]
  30. Khan, Muhammad Asif, Masood Ahmed, József Popp, and Judit Oláh. 2020. US Policy Uncertainty and Stock Market Nexus Revisited through Dynamic ARDL Simulation and Threshold Modelling. Mathematics 8: 2073. [Google Scholar] [CrossRef]
  31. Klein, Tony, Hien Pham Thu, and Thomas Walther. 2018. Bitcoin is not the New Gold–A comparison of volatility, correlation, and portfolio performance. International Review of Financial Analysis 59: 105–16. [Google Scholar] [CrossRef]
  32. Kothari. 2022. Crypto Revolution Is Here to Stay. What about India’s India’s Regulatory Stance. Available online: https://www.htsyndication.com/mint/article/crypto-revolution-is-here-to-stay.-what-about-india-s-regulatory-stance/57442497 (accessed on 12 February 2022).
  33. Likos, Paulina, and Coryanne Hicks. 2022. The History of Bitcoin, the First Cryptocurrency. Available online: https://money.usnews.com/investing/articles/the-history-of-bitcoin (accessed on 4 February 2022).
  34. Liu, Yukun, and Aleh Tsyvinski. 2021. Risks and returns of cryptocurrency. The Review of Financial Studies 34: 2689–727. [Google Scholar] [CrossRef]
  35. Lo, Stephanie, and Christina Wang. 2014. Bitcoin as Money. FED Boston, Boston. Available online: https://bitcoinwallets.com/bitcoin-as-money.pdf (accessed on 8 February 2022).
  36. Luther, William, and Nikhil Sridhar. 2021. On the Origin of Cryptocurrencies (1 December 2021). AIER Sound Money Project Working Paper No. 2022-02. Available online: https://ssrn.com/abstract=3976424 (accessed on 5 February 2022). [CrossRef]
  37. Madhok. 2022. India Wants to Launch a Digital Rupee and Tax Crypto Profits. Available online: https://edition.cnn.com/2022/02/01/investing/india-budget-digital-rupee/index.html (accessed on 8 February 2022).
  38. Mandelbrot, B. 1963. New methods in statistical economics. Journal of Political Economy 71: 421–40. [Google Scholar] [CrossRef]
  39. MCX, India. 2022. Historical Data. Available online: https://www.mcxindia.com/market-data/historical-data (accessed on 18 February 2022).
  40. Moore, Winston, and Jeremy Stephen. 2016. Should cryptocurrencies be included in the portfolio of international reserves held by central banks? Cogent Economics & Finance 4: 1147119. [Google Scholar]
  41. NSE. 2022. Historical Index Data. Available online: https://www1.nseindia.com/products/content/equities/indices/historical_index_data.htm (accessed on 4 February 2022).
  42. RBI, Reserve Bank of India. 2022. Reference Rate Archive. Available online: https://www.rbi.org.in/scripts/referenceratearchive.aspx (accessed on 7 February 2022).
  43. Rogojanu, Angela, and Liana Badea. 2014. The issue of competing currencies. Case study. Bitcoin Theoretical and Applied Economics 21: 103–14. [Google Scholar]
  44. Rudolf, Karl Oton, Samer Ajour El Zein, and Nicola Jackman Lansdowne. 2021. Bitcoin as an Investment and Hedge Alternative. A DCC MGARCH Model Analysis. Risks 9: 154. [Google Scholar] [CrossRef]
  45. Sahoo, Pradipta Kumar. 2017. Bitcoin as digital money: Its growth and future sustainability. Theoretical and Applied Economics 24: 53–64. [Google Scholar]
  46. Setiawan, Budi, Marwa Ben Abdallah, Maria Fekete-Farkas, Robert Jeyakumar Nathan, and Zoltan Zeman. 2021. GARCH (1, 1) Models and Analysis of Stock Market Turmoil during COVID-19 Outbreak in an Emerging and Developed Economy. Journal of Risk and Financial Management 14: 576. [Google Scholar] [CrossRef]
  47. Shahzad, Syed Jawad Hussain, Elie Bouri, David Roubaud, and Ladislav Kristoufek. 2020. Safe haven, hedge and diversification for G7 stock markets: Gold versus bitcoin. Economic Modelling 87: 212–24. [Google Scholar] [CrossRef]
  48. Symitsi, Efthymia, and Konstantinos J. Chalvatzis. 2019. The economic value of Bitcoin: A portfolio analysis of currencies, gold, oil and stocks. Research in International Business and Finance 48: 97–110. [Google Scholar] [CrossRef] [Green Version]
  49. Szetela, Beata, Grzegorz Mentel, Urszula Mentel, and Yuriy Bilan. 2020. Directional movement distribution in the bitcoin markets. Engineering Economics 31: 188–96. [Google Scholar] [CrossRef]
  50. Wei, Wang Chun. 2018. The impact of Tether grants on Bitcoin. Economics Letters 171: 19–22. [Google Scholar] [CrossRef]
  51. Yahoo Finance. 2022. Bitcoin INR (BTC-INR). Available online: https://finance.yahoo.com/quote/BTC-INR/history?p=BTC-INR&guccounter=1 (accessed on 8 February 2022).
Figure 1. The levels of gold cash rate, IND-USD exchange rate, Bitcoin price and NIFTY-50.
Jrfm 15 00317 g001
Figure 2. The logged first differences of IND-USD, NIFTY-50, gold cash and Bitcoin returns.
Jrfm 15 00317 g002
Figure 3. DCC among gold, INR-USD and BTC.
Jrfm 15 00317 g003
Figure 4. Correlation (black) and forecast (yellow) between gold, NIFTY, BTC and USD-INR.
Jrfm 15 00317 g004
Table 1. Summary statistics of log-transformed data.
BITCOINGOLDNIFTYUSD_INR
Mean0.24510.569.384.26
Median0.1510.559.334.27
Std. Dev5.020.200.160.04
Skewness−0.780.0160.81−0.85
Kurtosis12.2311.363.093.00
Jarque Bera 3595.27 (0.000)109.37 (0.000)109.60 (0.000)120.49 (0.000)
Note: p values in parentheses.
Table 2. Summary Statistics of GARCH (1,1).
VariablesMean EquationVariance Equation
USD-INRt-1−39.556505.618 **
(29.580)(87.57)
NIFTYt-1−5.22246.550
(14.044)(33.624)
GOLDt-123.20164.131 *
(19.044)(34.098)
α 0.158 **
(0.021)
β 0.774 **
(0.023)
Constant 0.2231.997
(0.1477)(0.251)
Observations983983
Note: Standard errors in parentheses; ** p < 0.05; * p < 0.1.
Table 3. Summary Statistics of EGARCH.
Variables Mean EquationVariance Equation
USD-INRt-1−27.4360.5155
(34.605)(6.427)
NIFTYt-1−9.858−6.062
(13.37)(1.734)
GOLDt-118.2480.3777
(21.41)(2.011)
L.egarch −0.0584 **
(0.0161)
Constant0.650
(0.1477)
Observations983983
Note: Standard errors in parentheses; ** p < 0.05.
Table 4. Dynamic conditional correlation generalised autoregressive conditional heteroskedasticity (DCC GARCH) FIT.
Variable Coefficient (Standard Error)
Distribution and Model Mvnorm (Multi-Variate Normal Distribution) and DCC (Dynamic Conditional Correlation) (1.1)
No. of parameters 28
No. of Series 4
No. of Observations 1462
Log likelihood 18,988.86
Av. Log likelihood 12.99
Information Criteria
Akaike −25.938
Bayes−25.837
Shibata −25.939
Hannah Quinn −25.900
Joint (dccα1)0.031634
(0.376823)
Joint (dccβ1)0.829733
(0.015282) **
Note: ** p < 0.05.
Publisher’s Note: MDPI stays neutral with regard to jurisdictional claims in published maps and institutional affiliations.

