Article

The Evolution of Job Lock in the U.S.: Evidence from the Affordable Care Act

1
Department of Economics, Providence College, Providence, RI 02905, USA
2
Department of Economics, Pace University, New York, NY 10038, USA
3
National Bureau of Economic Research, Cambridge, MA 02138, USA
4
Department of Economics, Bentley University, Waltham, MA 02452, USA
5
Institute of Labor Economics (IZA), 53113 Bonn, Germany
*
Author to whom correspondence should be addressed.
J. Risk Financial Manag. 2022, 15(7), 296; https://doi.org/10.3390/jrfm15070296
Submission received: 8 June 2022 / Revised: 23 June 2022 / Accepted: 24 June 2022 / Published: 3 July 2022
(This article belongs to the Special Issue Health Economics and Insurance)

Abstract

:
Since at least the early 1990s, economists have found substantial evidence of “job lock” in the United States: workers who get health insurance from their employer are less likely to switch jobs. Early work showed stronger job lock among groups that place a higher value on health insurance, whereas more recent work has focused on measuring the effect of specific policies on job lock. We combine these approaches by replicating some of the classic group comparisons (job switching among the more versus less healthy, and among those whose spouses do or do not have their own health insurance) over a much longer time period, using data from the Current Population Survey and the Medical Expenditure Panel Survey. This enables us to document the evolution of job lock over time, with a particular focus on how it changed when policies such as the Affordable Care Act (ACA) took effect. Estimates based on a difference-in-differences methodology indicate that job lock remains substantial, and that ACA has not significantly affected job mobility.

1. Introduction

One of the main goals of the Patient Protection and Affordable Care Act (ACA or Obamacare) was to reduce “job-lock” (ERP 2011, p. 120), the reluctance of workers to move to more rewarding activities for fear of losing their employer-sponsored health insurance (ESI). According to its eponymous author, Obamacare would increase the availability of health insurance so that “people who lose their jobs, change jobs, start a business, or retire early will know that they can find insurance for themselves and their families” (Obama 2012).
A number of studies have investigated the effect of the ACA on labor supply (Akosa Antwi et al. 2013; Colman and Dave 2018; Heim et al. 2018), entrepreneurship (Bailey 2017; Bailey and Dave 2019), and retirement (Levy et al. 2018; Aslim 2019), but there has been very little work on job lock in the post-ACA period.1 The exceptions are Bailey and Chorniy (2016), Jun (2018), and Kofoed and Frasier (2019), who study job-to-job mobility, though only through 2013, before the main elements of the ACA took effect.
We address this knowledge gap and contribute to this literature in several ways. First, we analyze the effect of the ACA on job-to-job mobility, and specifically on job mobility after the ACA fully took effect. Second, we measure job mobility among those most likely to be affected by the policy, which is workers with health conditions that, prior to the ACA, were likely to be denied or delayed coverage if they changed jobs because they had “pre-existing conditions”. Further, we identify the effect of the ACA on job mobility through a strategy that is both robust and chosen by many prior researchers on this topic, most of whom have found a substantial effect of employer-sponsored health insurance on mobility. Our study uses 2001–2019 data from both the Current Population Survey and the Medical Expenditure Panel Survey. This long time period allows us to track the evolution of job lock over time, and estimate its recent strength following the full implementation of the ACA.
We confirm the result from the prior literature that employer-sponsored health insurance appears to reduce job mobility by at least 25%, and we find that the ACA has not significantly improved the situation. Our results vary by dataset and identification strategy. When comparing those whose partners have employer-sponsored insurance to those whose partners do not, being the sole source of coverage for the family is associated with 28% lower job mobility. When comparing those who have health conditions that could have led to insurance denials pre-ACA to those who do not, we find that employer-sponsored health insurance is associated with up to 45% lower job mobility. Our point estimates suggest that if anything, job lock has become stronger following the full implementation of the ACA.

2. Background

Employer-sponsored health insurance (ESI) has been a prominent feature of the U.S. labor market since World War II, when price and wage controls restricted firms’ ability to attract workers through higher money wages, and, hence, induced them to do so through fringe benefits such as health insurance. Even after wage and price controls were removed in 1946, ESI has remained prevalent for a number of reasons (CBO 1994). First, employers’ contributions to workers’ health insurance premiums are exempt from workers’ taxable income, thus subsidizing the purchase of health insurance through employers. Second, ESI, as a type of group insurance, is typically cheaper than insurance bought individually by a worker (in the non-group market) because the employer can spread the fixed costs of setting up and administering the plan over its whole workforce and their families. As a result of the cost advantages of ESI, by 2010, about 55 percent of the population was covered under ESI (DeNavas-Walt et al. 2011).
Coverage by ESI reduces job mobility if workers believe that if they leave their current jobs, they will be unable to obtain equally good health insurance through their new job, through the government, or on the private non-group insurance market at a price similar to their current ESI. One reason they might fear this is if they developed serious health conditions at their current jobs that might not be covered by insurance available to them after they leave those jobs. According to the Kaiser Family Foundation, before the ACA, this was a reasonable fear. It was estimated that prior to the passage of the ACA, about 27% of the non-elderly adult population had a condition which would likely cause them to be turned down for insurance coverage, either altogether or for that condition (Claxton et al. 2016).
A number of features were included in the ACA to mitigate this concern among workers holding on to their current jobs for fear of losing their coverage. In the non-group market, the ACA prohibits insurers from denying coverage or charging higher premiums because of a person’s “pre-existing conditions” (PPACA section 2201). Enrollees in the group market were already protected from such practices before the ACA was passed in 2010 (see 42 U.S.C. § 300gg-1(a)). Although an employee’s new firm may delay coverage, the ACA restricts the maximum delay to 90 days (PPACA section 1201).
The ACA sets up health insurance marketplaces (or “exchanges”) in which consumers can compare the prices of standardized insurance plans whose premiums are allowed to vary only according to consumers’ family size, location, age, and tobacco use. Moreover, the exchanges provide premium tax credits for consumers with incomes between 100% and 400% of the Federal Poverty Limit, who made up about 46% of the working population in 2014 (authors’ calculations based on the American Community Surveys-ACS). In 2019, about 3% of the population had coverage through an ACA exchange.
Large firms (50+ employees) who fail to offer health insurance and have at least one full-time employee who receives a premium tax credit must pay a penalty. This provision of the ACA may have had a modest effect. According to the BLS National Compensation Survey, the share of workers offered health insurance in firms with 50 to 99 workers rose from 70% in 2013 to 77% in 2021 (Bureau of Labor Statistics 2021).
Small firms (1 to 50 employees) are not required to offer health insurance, but can obtain insurance for their employees through an online exchange, the Small Business Health Options Program (SHOP). Firms with fewer than 25 employees may qualify for tax credits. Relatively few firms have obtained insurance through SHOP. Of the 34 million workers in firms with fewer than 50 employees, around 230,000 were insured through a SHOP plan by 2017 (U.S. Census Bureau 2021; U.S. Department of Health and Human Services 2017). In addition, the ACA expands Medicaid eligibility to people with incomes up to 138% of the Federal Poverty Limit, increasing the number of workers eligible for Medicaid by about 60% (authors’ calculations based on the 2014 ACS).

3. Methods

Following Madrian (1994), we estimate the effect of ESI on job mobility using a difference-in-differences (DD) framework. A simple test of ESI’s effect on job-changing is to compare job mobility among those with and without ESI. However, workers may stay in jobs with ESI not only because of the ESI, but also because those jobs may provide other amenities, such as higher pay and generous retirement benefits, or because workers who value ESI also value job stability for other reasons. In order to address this bias due to other confounding job characteristics and worker preferences, one could control for the characteristics of both jobs (current and prospective) and of workers that might influence job mobility (Mitchell 1982; Cooper and Monheit 1993; Gilleskie and Lutz 2002). The difficulty with this approach is that data on firms’ benefits and other amenities are not always fully observed, and data on prospective jobs are nonexistent and remain unobserved.
Another solution to the confounding bias might be to limit the analysis to workers with ESI, and compare the mobility of workers for whom losing ESI is costly with the mobility of workers for whom it is not. For example, workers who can obtain insurance through their partners would find losing ESI less expensive than workers whose only source of insurance is their own ESI. Similarly, among workers with chronic health conditions and with no alternative source of insurance, losing insurance would be more expensive than among more healthy workers. The problem with using this simple difference between workers who face high and low costs of losing ESI is that the cost variable may affect mobility independently of its effect on the value of ESI. For example, workers who can obtain insurance through their partners’ ESI may make different job choices due to their partner’s additional income, compared with workers whose partners do not work or those who do not have partners. Similarly, workers with chronic health problems may change jobs less frequently regardless of insurance status because adjusting to a new job takes more time and money than it might for a healthy worker. Thus, we have to remove the independent effect of the cost factor on mobility.
This leads to the following difference-in-differences model, as proposed in Madrian (1994).
Pr ( Switch ) i = O w n E S I i × α + C o s t F a c t o r i × γ + ( O w n E S I i × C o s t F a c t o r i ) × δ + X i β + θ t + u i
In Equation (1), OwnESI represents a dummy variable indicating that the worker has insurance through the worker’s own job; the cost factor is either the availability of insurance through the worker’s partner or family, or one or more health conditions that has led to a denial of coverage before the ACA went fully into effect in 2014; the vector X includes worker characteristics such as educational attainment, race and ethnicity, age, and job characteristics such as industry and occupation; and θ t represents the fixed effects for year. The parameter of interest is δ , which captures the effect of ESI on mobility after removing the independent effect of the cost factor on mobility. We estimate this model for the 10 years before the ACA took full effect in 2014, and also from 2014 through 2019, when insurance companies were no longer allowed to deny coverage based on pre-existing conditions. We omit data from 2020 onwards in order to avoid the tumultuous disruption of insurance coverage and employment caused by COVID-19.

4. Data

We bring two national two datasets to bear on the analyses, the Medical Expenditure Panel Survey (MEPS), which has a longitudinal component, and the Current Population Survey (CPS). The MEPS is a stratified probability sample of the civilian non-institutional population of the U.S. It is drawn from the households participating in the previous year’s National Health Interview Survey (NHIS). Each household is interviewed five times over two full calendar years. Data are collected on every household member, and include respondents’ health care use, expenditures, sources of payment, and health insurance status, as well as health status, employment, demographic and socio-economic characteristics, and access to care. The measures of health expenditures include both out-of-pocket, as well as third-party payments. Each year’s sample contains information on about 15,000 households.
In the first-round interview, the jobs of each household member are numbered. In subsequent rounds, the respondents are asked if they still work at previously-reported jobs, at new ones, or are not working. Our dependent variable is a dichotomous variable that equals one if the respondent changed jobs from one round to the next.
Health insurance status is measured each round. Because data are collected on every household member, we have the source of health insurance for both respondents and their partners. We create dichotomous variables for coverage by the worker’s own employer, by the partner’s employer, or by the worker’s own private insurance provider or by the partner’s private insurance provider. The private insurance indicators include ESI as subsets.
We also create a dummy variable that equals one if the respondent had a health condition that was likely to have caused health insurers to deny coverage before the ACA. The Kaiser Family Foundation (KFF) has compiled a list of such conditions.2 The MEPS creates an inventory of respondents’ health conditions using questions of the form, “Has a doctor ever told you that you have [health condition]”. The advantage of the MEPS health conditions inventory is that it is comprehensive, covering illnesses in all of the 285 categories of the Clinical Classification System developed by the Healthcare Cost and Utilization Project (HCUP), sponsored by the Agency for Healthcare Research and Quality (AHRQ). The disadvantage is that it depends on whether a doctor has told the respondent that he or she has the illness, and on the respondent’s recollection of being told. The difference between having a condition and being told one has the condition is noticeable for a few conditions. For example, based on MEPS data, we estimate the prevalence of hypertension among adults in 2019 to be 25%, in contrast to 45% based on NHANES. We matched the health conditions identified in the MEPS with the list of conditions created by KFF, and created a dummy variable that equals one if the respondent had a condition that might have caused denial of coverage before the ACA went into effect.
Other independent variables include dichotomous variables for education (five categories), race and Hispanic origin (five categories), union membership, occupation (nine categories), industry (fourteen categories), spouse’s employment, and possession of a pension (either defined-contribution or defined-benefit), and continuous variables for family size, age, and the employment size of the firm.
We use the MEPS from 2001 through 2019, and limit the sample to employed persons between the ages of 18 and 56, which yields an analysis sample of 241,000 observations comprising 83,000 persons.
The second dataset we use is the Annual Social and Economic Supplement (ASEC) to the Current Population Survey (CPS) from 2001 through 2019. We accessed CPS microdata using the Integrated Public Use Microdata Series (Flood et al. 2020). The CPS is a monthly stratified probability sample of the civilian non-institutional population of the U.S. It is the source of the monthly estimates of the unemployment rate published by the Bureau of Labor Statistics. The ASEC is an expanded version of the monthly CPS that is conducted mainly in March, but also in February and April. The ASEC collects detailed information on household and personal income over the previous year; insurance status and employment over the previous year, as well at the time of the survey; and other characteristics. The number of households participating in the ASEC has declined from about 78,000 in 2003 to about 63,000 in 2019, partly due to fewer households being surveyed and partly due to the decline in the response rate from about 93% in 2003 to about 83% in 2019.
We create variables from responses to the ASEC that are as close as possible to those created with MEPS: dummy variables for health insurance coverage through workers’ own jobs, coverage through their partners’ jobs, whether their partners have insurance coverage through their jobs, and as with MEPS, dummy variables for education (five categories), race and Hispanic origin (five categories), union membership, occupation (nine categories), industry (fourteen categories), spouse’s employment, and possession of a pension (either defined-contribution or defined-benefit), and continuous variables for family size, age, and the employment size of the firm. Our measure of job mobility using the CPS differs from that in the MEPS. The CPS asks whether respondents had one, two, or three or more jobs during the previous calendar year. Jobs held simultaneously count as one job. Our dependent variable equals one if the respondent reports having more than one job over the previous calendar year. This differs from the measure of job mobility in the MEPS, which asks if the respondent has changed jobs approximately in the past 5 months.

5. Results

Table 1 and Table 2 report the means and standard deviations of the MEPS and CPS samples for both before and after the ACA went into effect in 2014. The sample values are quite similar before and after that date, reducing the chance that any estimated effects of the ACA are due to a changes in the composition of the sample. The measure of job-switching in the MEPS indicates that from 6 to 7 percent of workers changed jobs from one wave to the next during our study period, with the interview waves taking place about five months apart. The CPS measure, which refers to job changes over a year, is about double that of MEPS, at about 12 percent.
Figure 1 and Figure 2 show that job switching is highly responsive to the state of the economy, rising during recoveries and falling during recessions. It also shows that both before and after the ACA, workers with ESI were much less likely to change jobs than workers without ESI.
Panel A of Table 3 and Table 4 reports the results from our main difference-in-differences analyses. Using data from the MEPS, as shown in Table 3 (Panel A), both before and after the ACA went into effect, workers whose partners had ESI were about 1.7 to 1.8 percentage points more likely to change jobs than workers without such partners; these effect magnitudes represent about a 28 percent decrease in job lock relative to the pre-ACA mean in job-mobility from the MEPS (reported in Table 1). These estimates align closely with the results of Madrian (1994) and subsequent studies (GAO 2011). Equally interesting for our research question, the values before and after the ACA were not statistically different. The stability of estimates of job lock before and after the ACA are illustrated in Figure 3, which shows estimates of job lock for each two-year period from 2001 to 2019 using partner’s ESI as the variable that influences the cost of changing jobs for workers with their own ESI.
Our estimates of job lock using deniable health conditions as the factor that affects the cost of losing one’s insurance give substantially the same result. As shown in columns 4 and 5 of Table 3 (Panel A), workers with a deniable pre-existing condition were 2.0 (pre-ACA) to 2.8 (post-ACA) percentage points less likely to switch jobs, compared with similar workers without such health conditions. This cost factor implies estimates of job lock from 32 to 45 percent. These estimates do not differ statistically from before to after the ACA. Thus, based on MEPS, one cannot conclude that the ACA has reduced job lock. If anything, the estimates after the ACA, based on deniable health conditions as the cost factor, are somewhat larger than those before.
This is even more evident in the CPS results shown in Table 4 (Panel A). During the pre-ACA period, the estimated job lock is about 28 percent (0.0348/0.126), similar to the estimate using the MEPS. In the post-ACA period, however, our estimate of job lock rises to 44 percent (0.0557/0.126), a difference that is statistically significant at the one percent level. The same change is illustrated in Figure 4, which, as in Figure 3, estimates job lock for each two-year period from 2001 to 2019 based on the CPS. Thus, using either the MEPS or the CPS, we find no evidence that job lock has declined as a result of the ACA.
The DD tables in Panel B help to explain why the difference-in-differences and not just a simple difference is needed to identify the effect. These proportions are estimated assuming all the variables other than own- and partner-ESI are set at the sample means. If one looks only at workers with ESI and compares the mobility of such workers with partner-ESI with those without, there appears to be no job lock (0.001). However, this ignores the independent effect of the presence of a partner with ESI, which tends to reduce job mobility, an effect estimated to be about −0.15 percentage points. Subtracting the second difference from the first gives our estimate of job lock using partner ESI. Panel C in Table 3 repeats this exercise for the MEPS using the health conditions as a cost-factor. It is validating that our simple DD estimates (from Panels B and C), which do not control for any other individual factors or the flexible time trends, are highly similar to the generalized DD estimates (from Panel A) with the full set of observed controls and time trends.

6. Conclusions

As far as we are aware, ours is the first study to examine whether the ACA accomplished one of its primary goals, to reduce job lock due to fears of losing insurance. We confirm the presence of job lock before and after the ACA took full effect in 2014. Drawing on the prior methodology and identification strategies used to identify job lock, which also allows us to provide estimates for the pre-ACA period consistent with that in the literature, our results imply that the ACA has not significantly affected job mobility nor the perceived value of ESI. This is consistent with Heim and Lurie (2015), who found that ACA-like reforms in Massachusetts in 2006 did not increase job mobility.
In fact, our point estimates suggest that job lock actually got stronger following the ACA. One possible explanation for our finding is that the ACA’s individual mandate made insurance even more desirable by fining the uninsured. Another possibility is that workers continue to value employer-provided health insurance more over time as premiums continue to rise.
It is possible that our identification strategy, like that of much of the previous literature, is not estimating the causal effect of employer-provided health insurance on job mobility. Those with pre-existing conditions, or whose spouses have employer-provided health insurance, likely differ from others in ways we cannot fully control for, and which may also influence job mobility. It is further possible, though less likely, that these group differences changed around 2014 in ways that influence our evaluation of the ACA. However, our best attempt at estimating the causal effect of the ACA suggests it did not improve job mobility, and it is certainly clear in the raw data that job mobility remains much higher among workers without employer-provided health insurance compared to workers with employer-provided health insurance.
How big a problem is this? Dey and Flinn (2005) argue that job lock is actually efficient in most cases, and that job mobility is lower for those with ESI because the insurance prevents them from getting so sick they lose their jobs. Gallagher et al. (2020) find similar productivity-increasing effects of health insurance using more recent data. However, the general consensus among economists, as well as proponents of the ACA, has been that job lock is inefficient, trapping people in jobs they otherwise do not like, and perhaps keeping them from finding the job where they could be most productive and contribute the most to society. To the extent that job lock is inefficient, our results suggest that the magnitude of the problem is large, and that it has not been alleviated by the ACA. We show that job lock is still here, and so if policymakers think it is a problem, further action would be needed to address it.

Author Contributions

Conceptualization, J.B., G.C. and D.D.; Formal analysis, J.B., G.C. and D.D.; Methodology, J.B., G.C. and D.D.; Writing—original draft, G.C. and D.D.; Writing—review & editing, J.B. All authors have read and agreed to the published version of the manuscript.

Funding

This research received no external funding.

Institutional Review Board Statement

Not applicable.

Informed Consent Statement

Not applicable.

Data Availability Statement

Not applicable.

Conflicts of Interest

The authors declare no conflict of interest.

Notes

1
See Colman et al. (2019) for an overview of the relationships between health insurance (both employer-sponsored health insurance and public coverage such as Medicaid) and labor supply, a review of the post-ACA literature.
2

References

  1. Akosa Antwi, Yaa, Asako S. Moriya, and Kosali Simon. 2013. Effects of federal policy to insure young adults: Evidence from the 2010 Affordable Care Act’s dependent-coverage mandate. American Economic Journal: Economic Policy 5: 1–28. [Google Scholar]
  2. Aslim, Erkmen Giray. 2019. The relationship between health insurance and early retirement: Evidence from the Affordable Care Act. Eastern Economic Journal 45: 112–40. [Google Scholar] [CrossRef]
  3. Bailey, James. 2017. Health insurance and the supply of entrepreneurs: Evidence from the Affordable Care Act. Small Business Economics 49: 627–646. [Google Scholar] [CrossRef]
  4. Bailey, James, and Anna Chorniy. 2016. Employer-provided health insurance and job mobility: Did the affordable care act reduce job lock? Contemporary Economic Policy 34: 173–83. [Google Scholar] [CrossRef]
  5. Bailey, James, and Dhaval Dave. 2019. The Effect of the Affordable Care Act on Entrepreneurship among Older Adults. Eastern Economic Journal 45: 141–59. [Google Scholar] [CrossRef]
  6. Bureau of Labor Statistics. 2021. National Compensation survey. Available online: https://www.bls.gov/ncs/ (accessed on 23 June 2022).
  7. CBO (United States Congressional Budget Office). 1994. The Tax Treatment Of Employment-Based Health Insurance; Washington, DC: U.S. Government Printing Office.
  8. Claxton, Gary, Cynthia Cox, Anthony Damico, Larry Levitt, and Karen Pollitz. 2016. Pre-existing Conditions and Medical Underwriting in the Individual Insurance Market Prior to the ACA. Issue Brief, Kaiser Family Foundation. Available online: https://www.kff.org/health-reform/issue-brief/pre-existing-conditions-and-medical-underwriting-in-the-individual-insurance-market-prior-to-the-aca/ (accessed on 23 June 2022).
  9. Colman, Gregory, and Dhaval Dave. 2018. It’s about time: Effects of the affordable care act dependent coverage mandate on time use. Contemporary Economic Policy 36: 44–58. [Google Scholar] [CrossRef] [Green Version]
  10. Colman, Gregory, Dhaval Dave, and Otto Lenhart. 2019. Health Insurance and Labor Supply. Oxford Research Encyclopedia of Economics and Finance. Available online: https://oxfordre.com/economics/view/10.1093/acrefore/9780190625979.001.0001/acrefore-9780190625979-e-438 (accessed on 17 March 2021).
  11. Cooper, Philip F., and Alan C. Monheit. 1993. Does employment-related health insurance inhibit job mobility? Inquiry 30: 400–16. [Google Scholar]
  12. DeNavas-Walt, Carmen, Bernadette D. Proctor, and Jessica C. Smith. 2011. Income, Poverty, and Health Insurance Coverage in the United States: 2010; Census Bureau, Current Population Reports, P60-239; Washington, DC: U.S. Government Printing Office.
  13. Dey, Matthew S., and Christopher J. Flinn. 2005. An equilibrium model of health insurance provision and wage determination. Econometrica 73: 571–627. [Google Scholar] [CrossRef]
  14. Economic Report of the President. 2011. Council of Economic Advisors. Available online: https://obamawhitehouse.archives.gov/administration/eop/cea/economic-report-of-the-President/2011 (accessed on 23 June 2022).
  15. Flood, Sarah, Miriam King, Renae Rodgers, Steven Ruggles, and J. Robert Warren. 2020. Integrated Public Use Microdata Series, Current Population Survey: Version 8.0 [Dataset]. Minneapolis: IPUMS. [Google Scholar] [CrossRef]
  16. Gallagher, Emily, Nathan Blascak, Stephen Roll, and Michal Grinstein-Weiss. 2020. Health Insurance as an Income Stabilizer; FRB of Philadelphia Working Paper No. 20-05; Philadelphia: Federal Reserve Bank. [CrossRef]
  17. GAO (United States Government Accountability Office). 2011. Job Lock and the PPACA; (GAO Publication No. 12-166R); Washington, DC: U.S. Government Printing Office.
  18. Gilleskie, Donna B., and Byron F. Lutz. 2002. The Impact of Employer-Provided Health Insurance on Dynamic Employment Transitions. The Journal of Human Resources 37: 129–62. [Google Scholar] [CrossRef]
  19. Heim, Bradley T., and Ithai Z. Lurie. 2015. The Impact of Health Reform on Job Mobility: Evidence from Massachusetts. American Journal of Health Economics 1: 374–98. [Google Scholar] [CrossRef]
  20. Heim, Bradley, Ithai Lurie, and Kosali Simon. 2018. Did the Affordable Care Act young adult provision affect labor market outcomes? Analysis using tax data. ILR Review 71: 1154–78. [Google Scholar] [CrossRef] [Green Version]
  21. Jun, Dajung. 2018. The Effects of the Dependent Coverage Mandates on Fathers’ Job Mobility and Compensation. In Proceedings of the Annual Conference on Taxation and Minutes of the Annual Meeting of the National Tax Association. Washington, DC: National Tax Association, vol. 111, pp. 1–42. [Google Scholar] [CrossRef]
  22. Kofoed, Michael S., and Wyatt J. Frasier. 2019. [Job] Locked and [Un]loaded: The effect of the Affordable Care Act dependency mandate on reenlistment in the U.S. Army. Journal of Health Economics 65: 103–16. [Google Scholar] [CrossRef] [PubMed] [Green Version]
  23. Levy, Helen, Thomas C. Buchmueller, and Sayeh Nikpay. 2018. Health reform and retirement. The Journals of Gerontology: Series B 73: 713–22. [Google Scholar] [CrossRef] [PubMed]
  24. Madrian, Brigitte C. 1994. Employment-based health insurance and job mobility: Is there evidence of job-lock? The Quarterly Journal of Economics 109: 27–54. [Google Scholar] [CrossRef]
  25. Mitchell, Olivia S. 1982. Fringe benefits and labor mobility. The Journal of Human Resources 17: 286–98. [Google Scholar]
  26. Obama, Barack. 2012. Securing the future of American health care. New England Journal of Medicine 367: 1377–81. [Google Scholar] [CrossRef] [PubMed] [Green Version]
  27. U.S. Census Bureau. 2021. 2017 SUSB Annual Data Tables by Establishment Industry. Available online: https://www.census.gov/data/tables/2017/econ/susb/2017-susb-annual.html (accessed on 23 June 2022).
  28. U.S. Department of Health and Human Services. 2017. The Future of the SHOP: CMS Intends to Allow Small Businesses in SHOPs Using HealthCare.gov More Flexibility when Enrolling in Healthcare Coverage. Available online: https://www.cms.gov/CCIIO/Resources/Regulations-and-Guidance/Downloads/The-Future-of-the-SHOP-CMS-Intends-to-Allow-Small-Businesses-in-SHOPs-Using-HealthCaregov-More-Flexibility-when-Enrolling-in-Healthcare-Coverage.pdf (accessed on 23 June 2022).
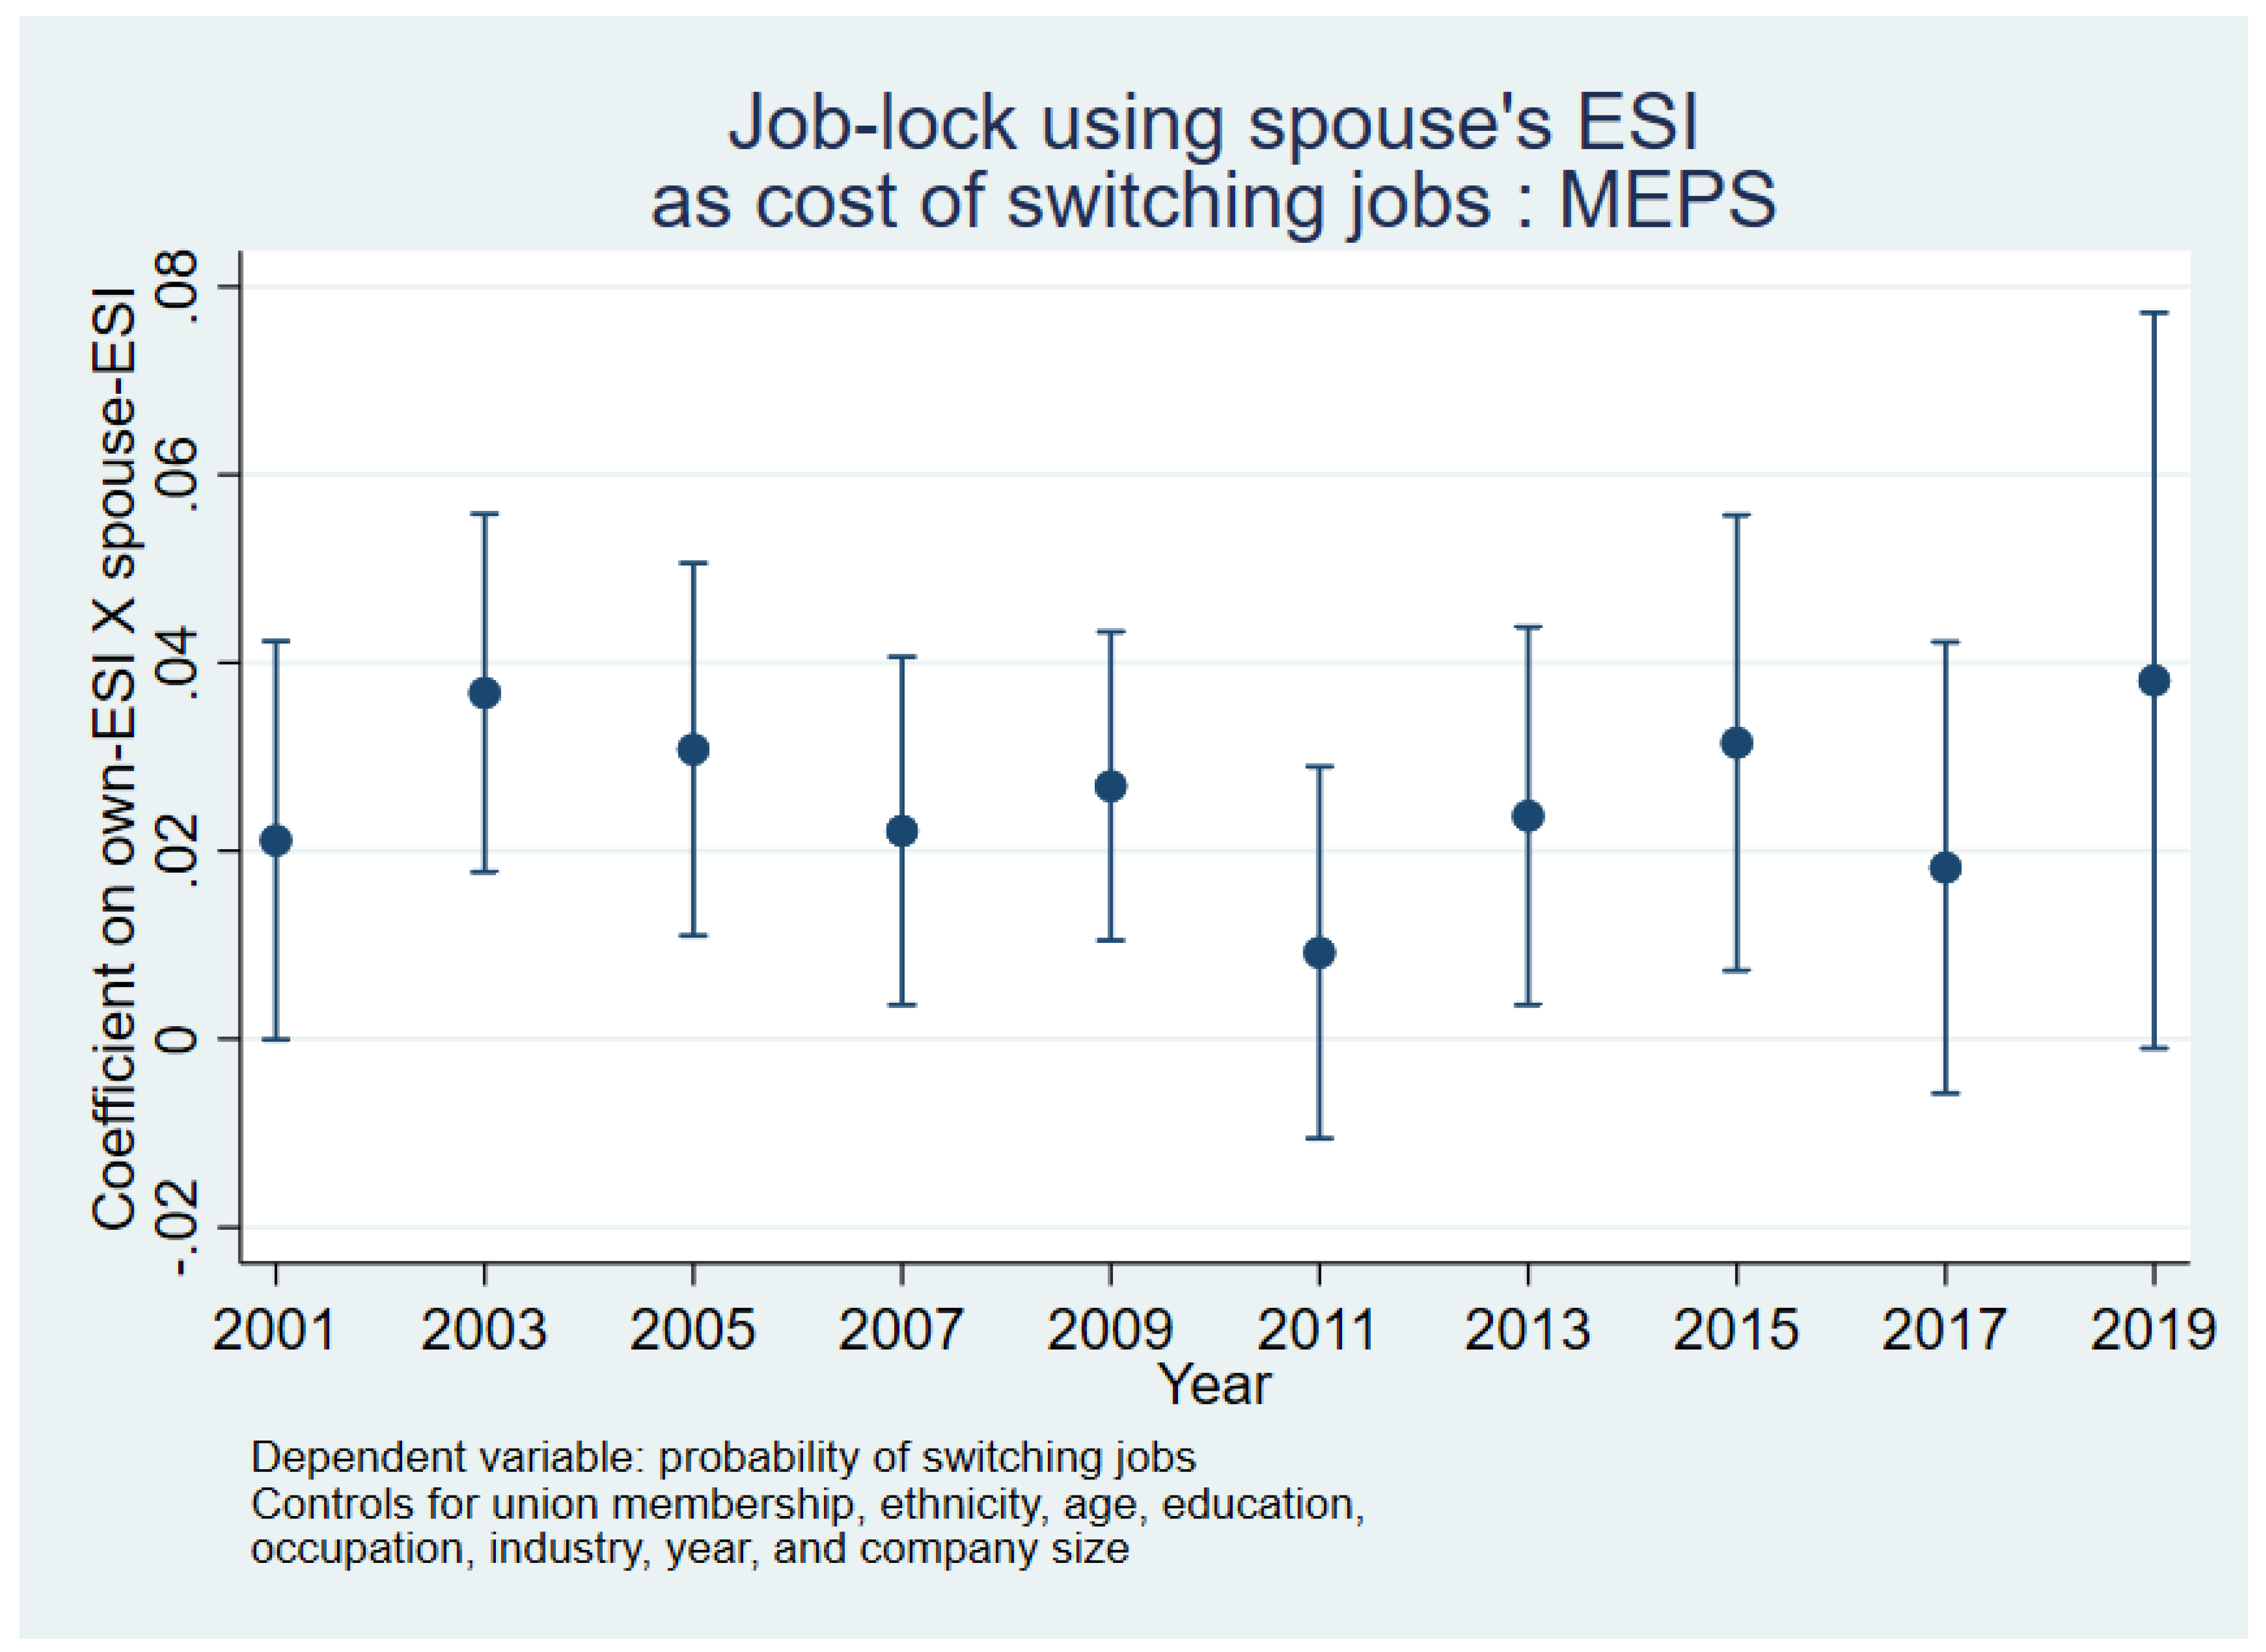
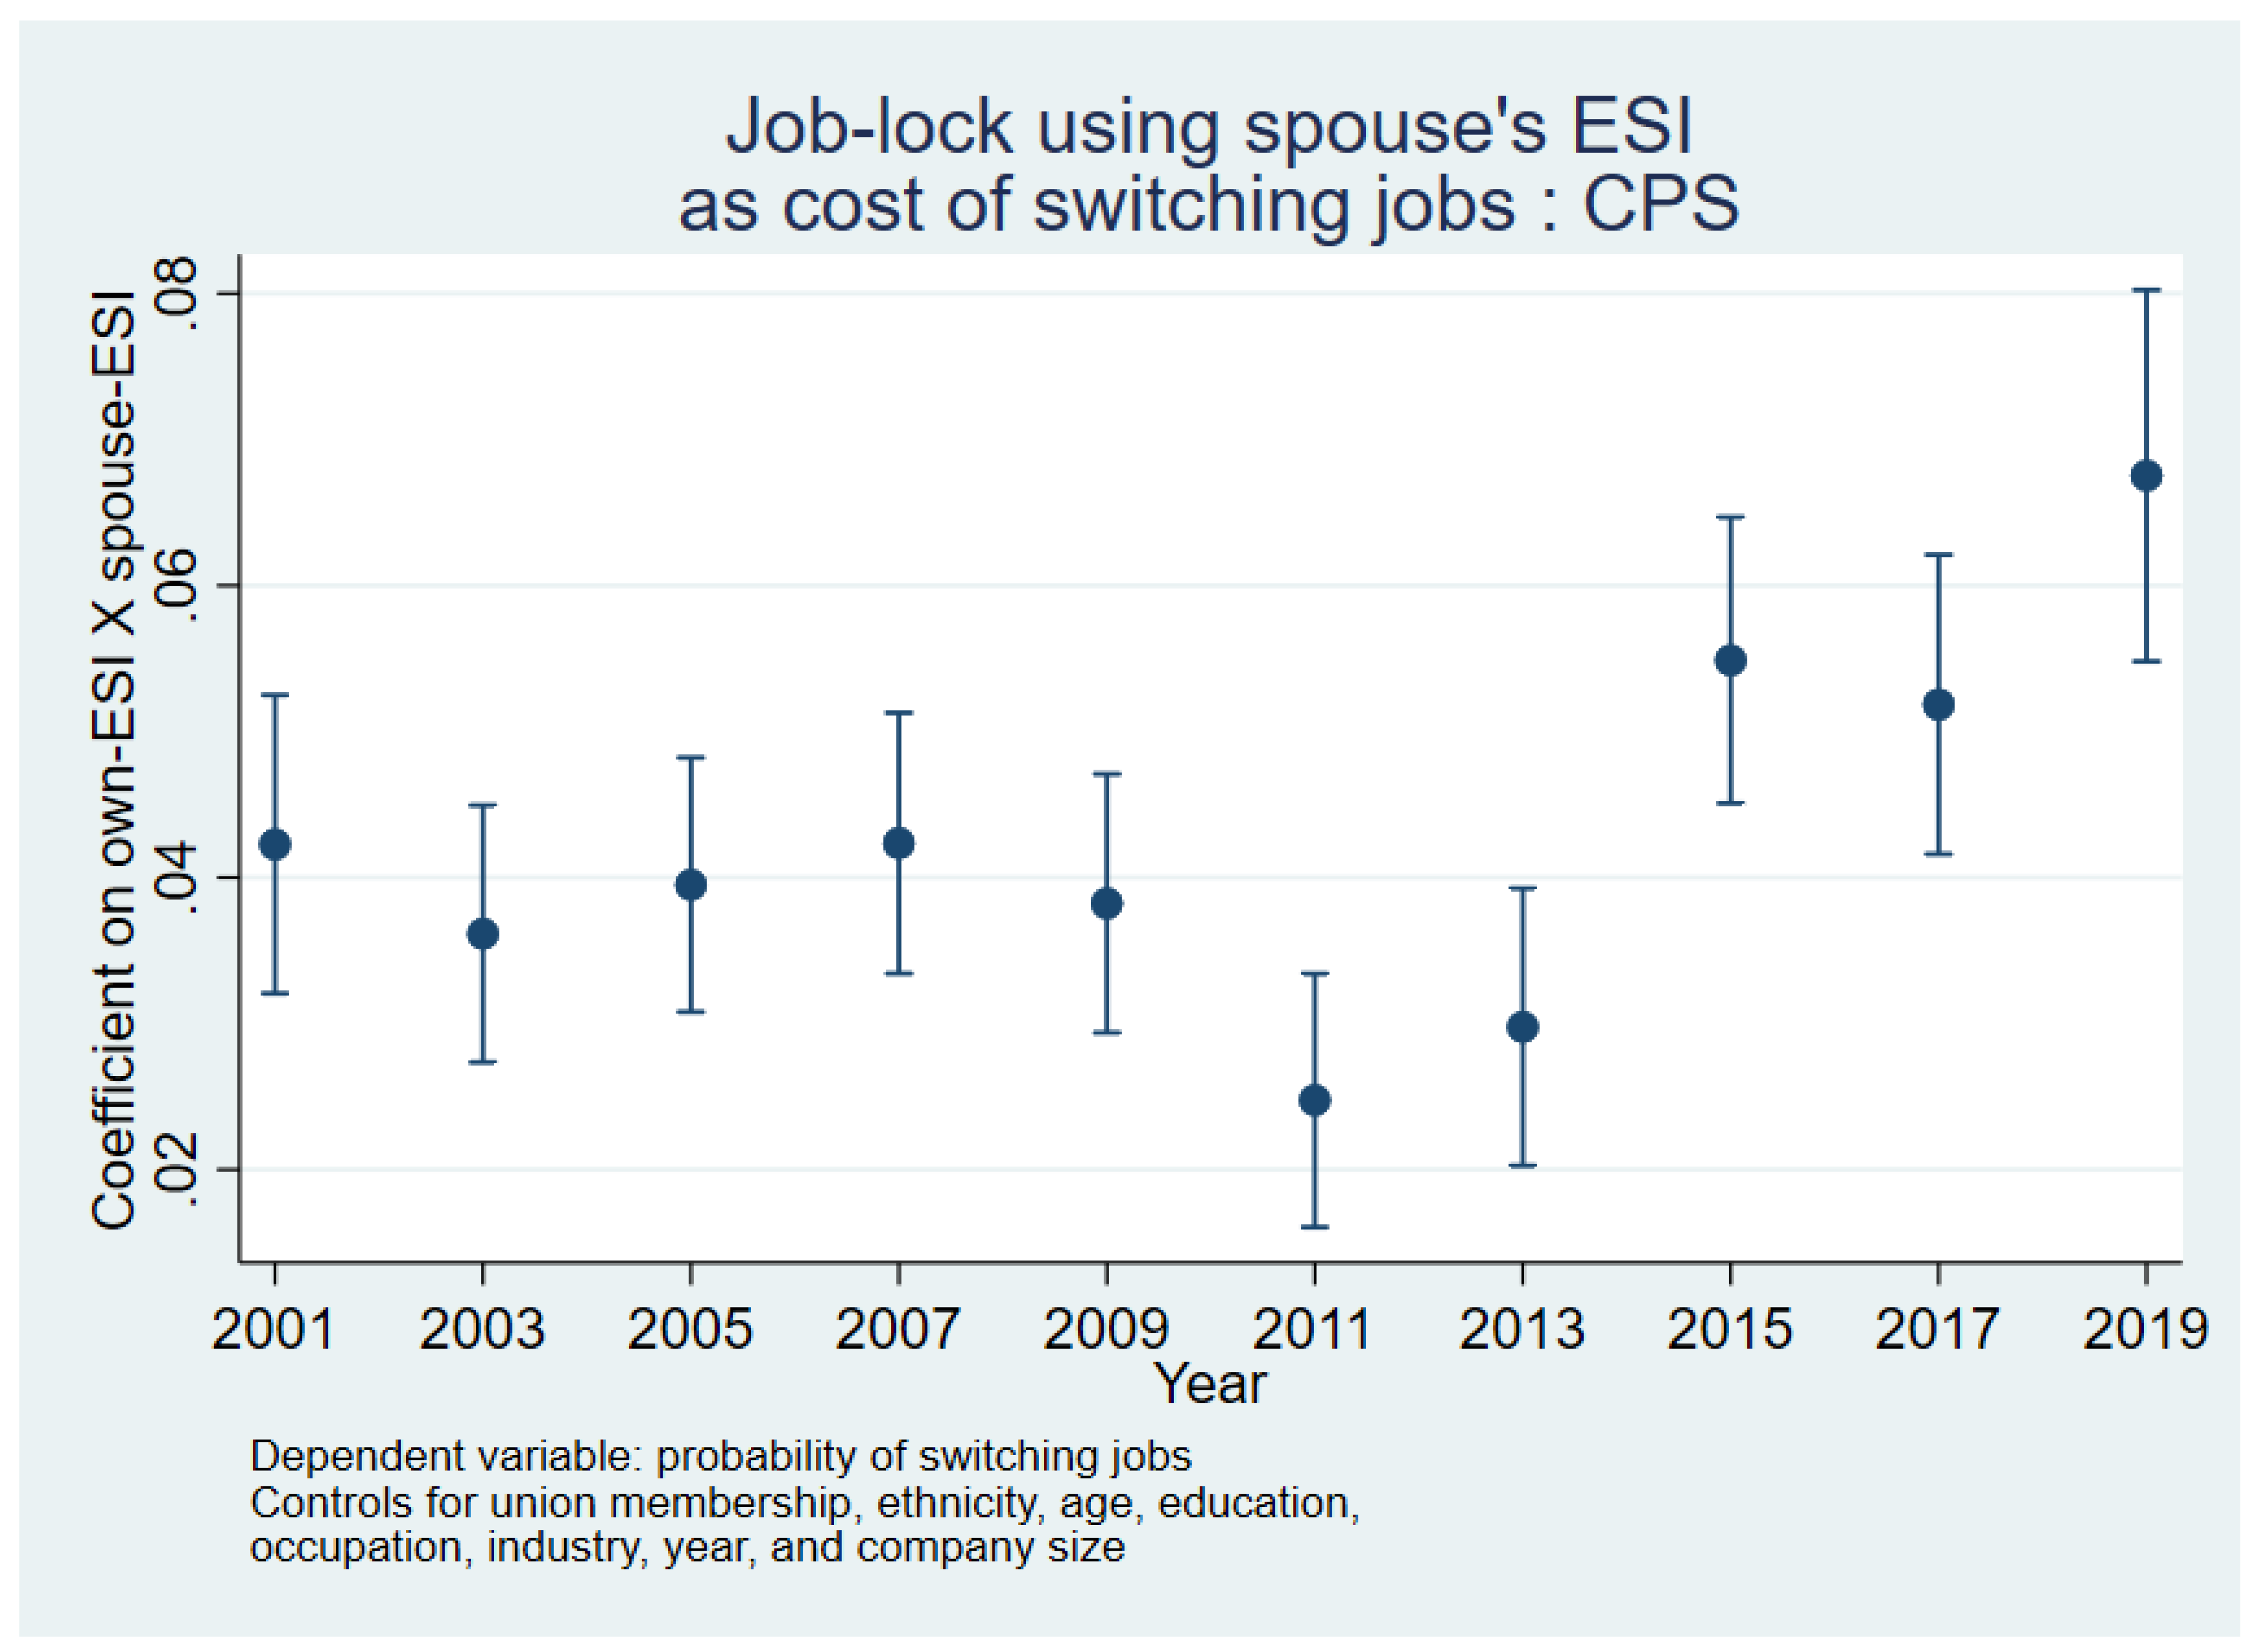
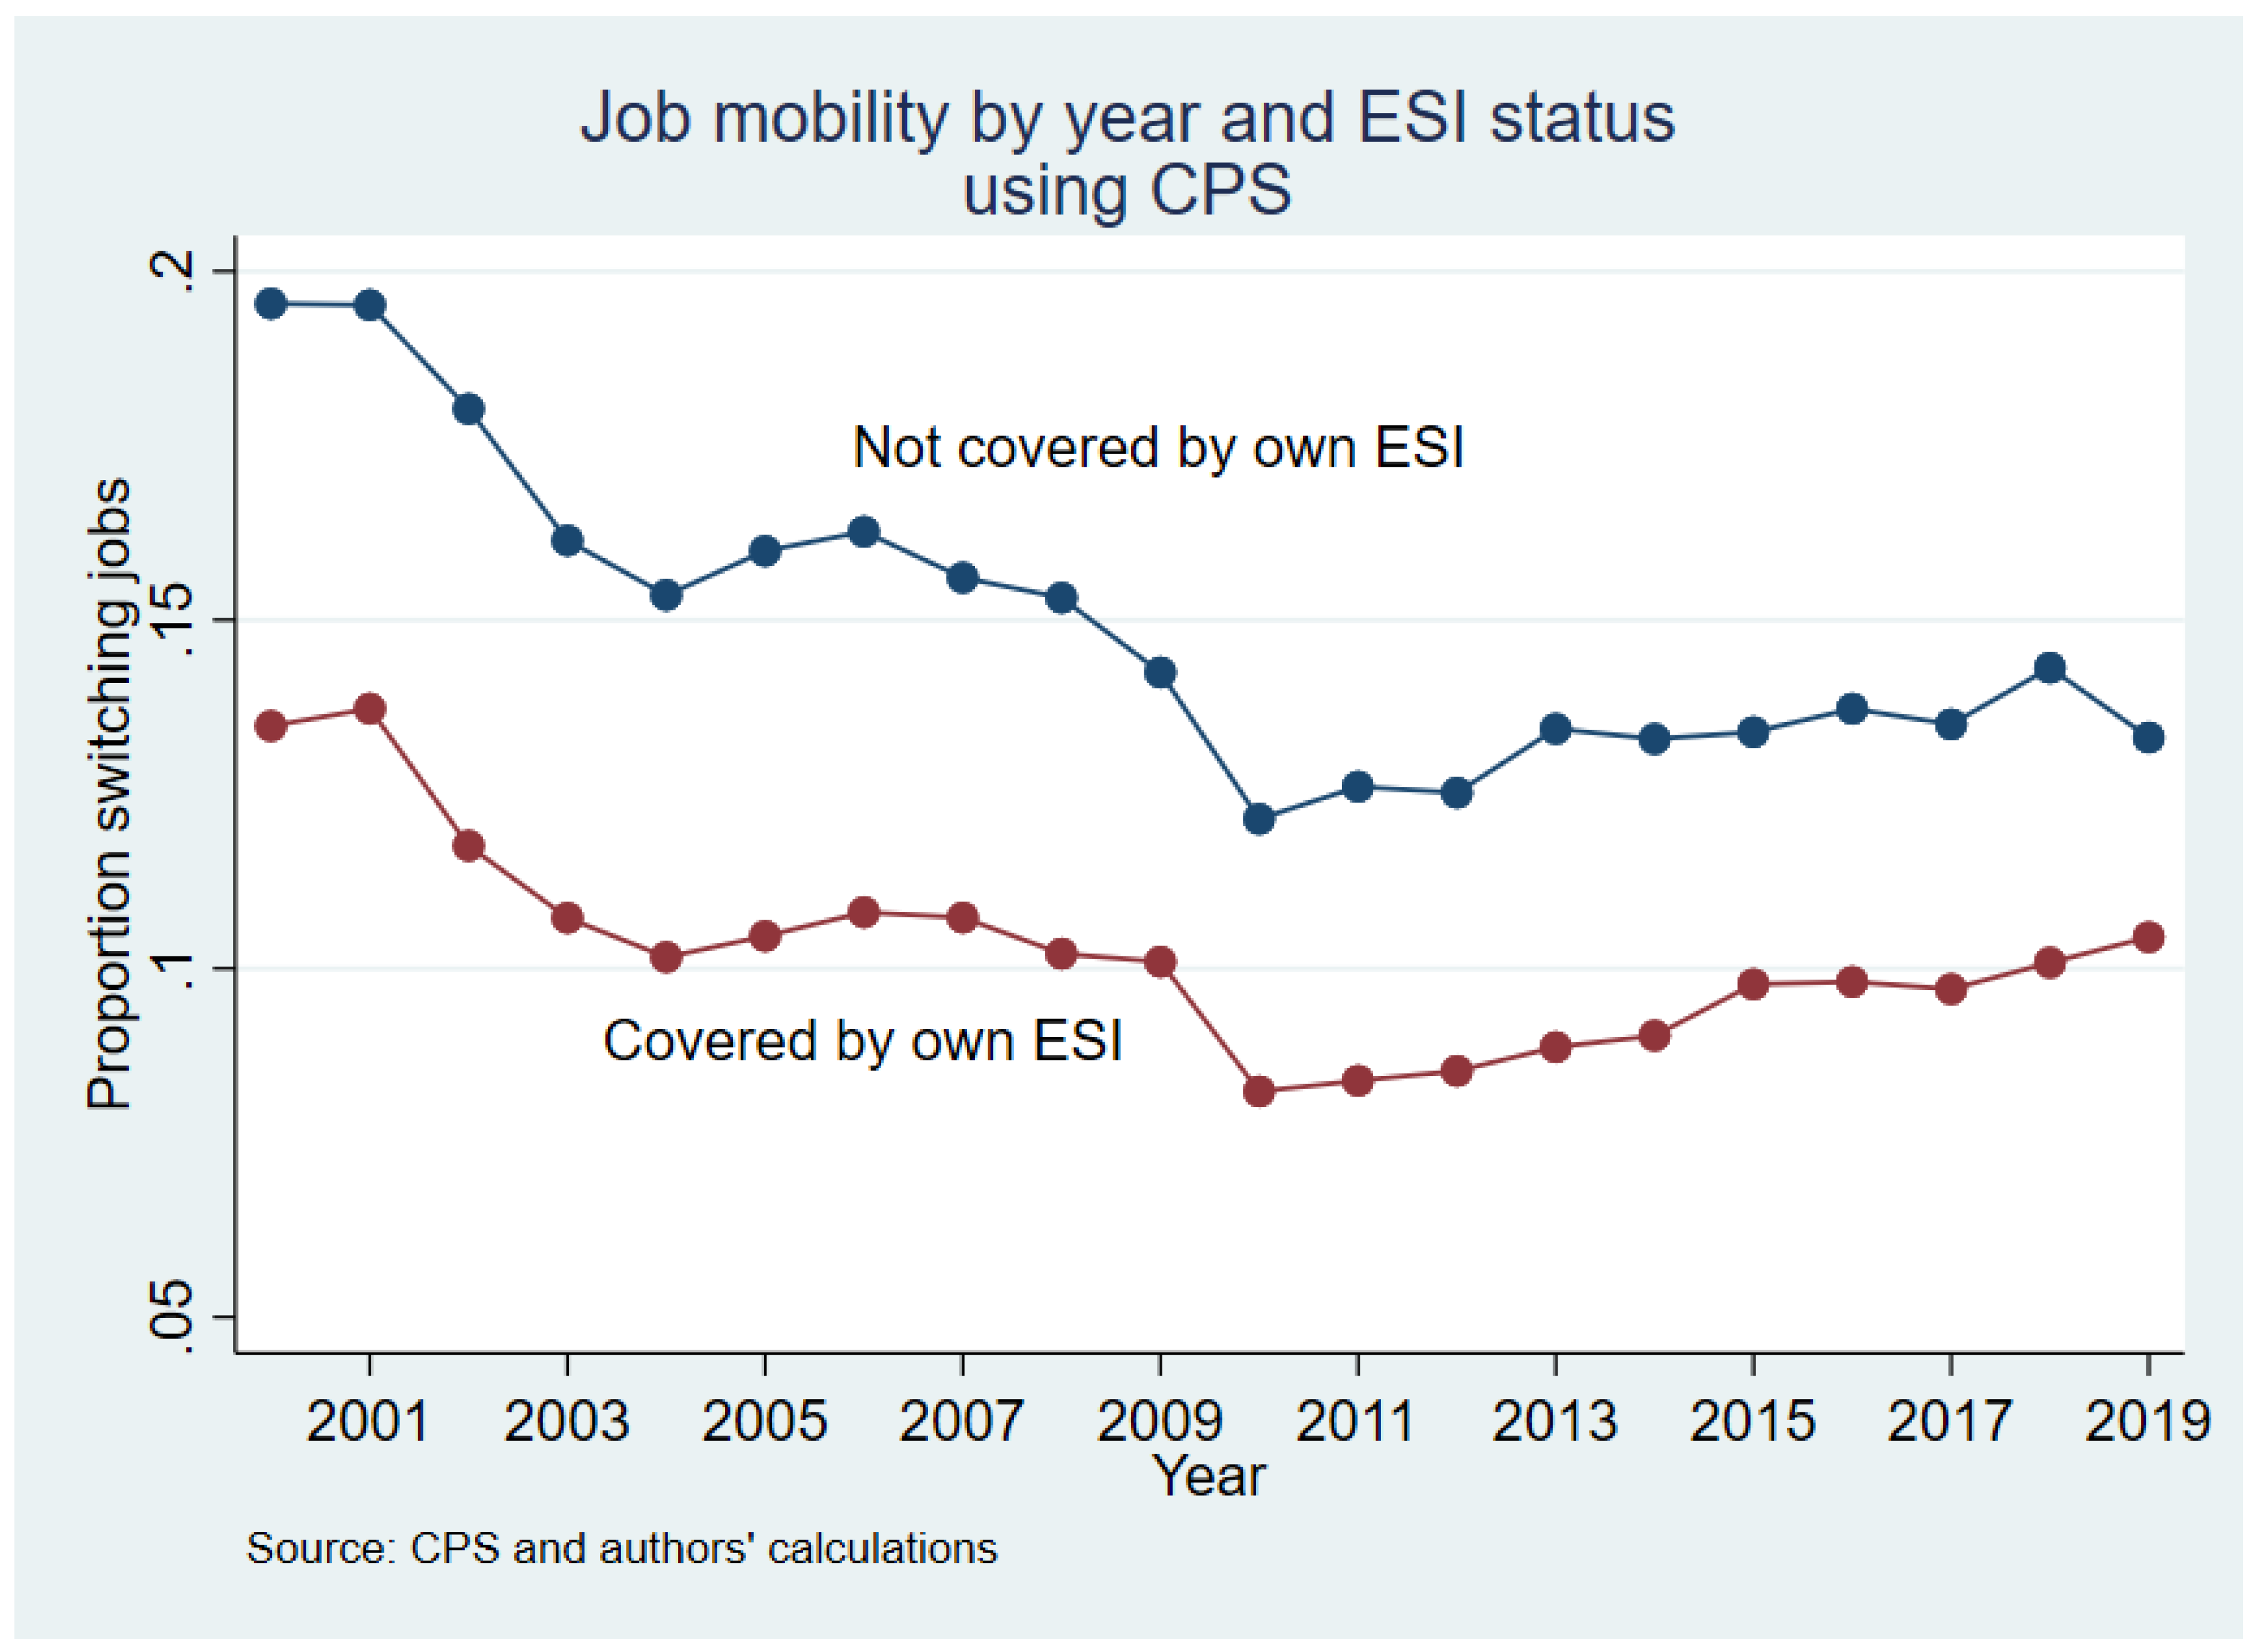
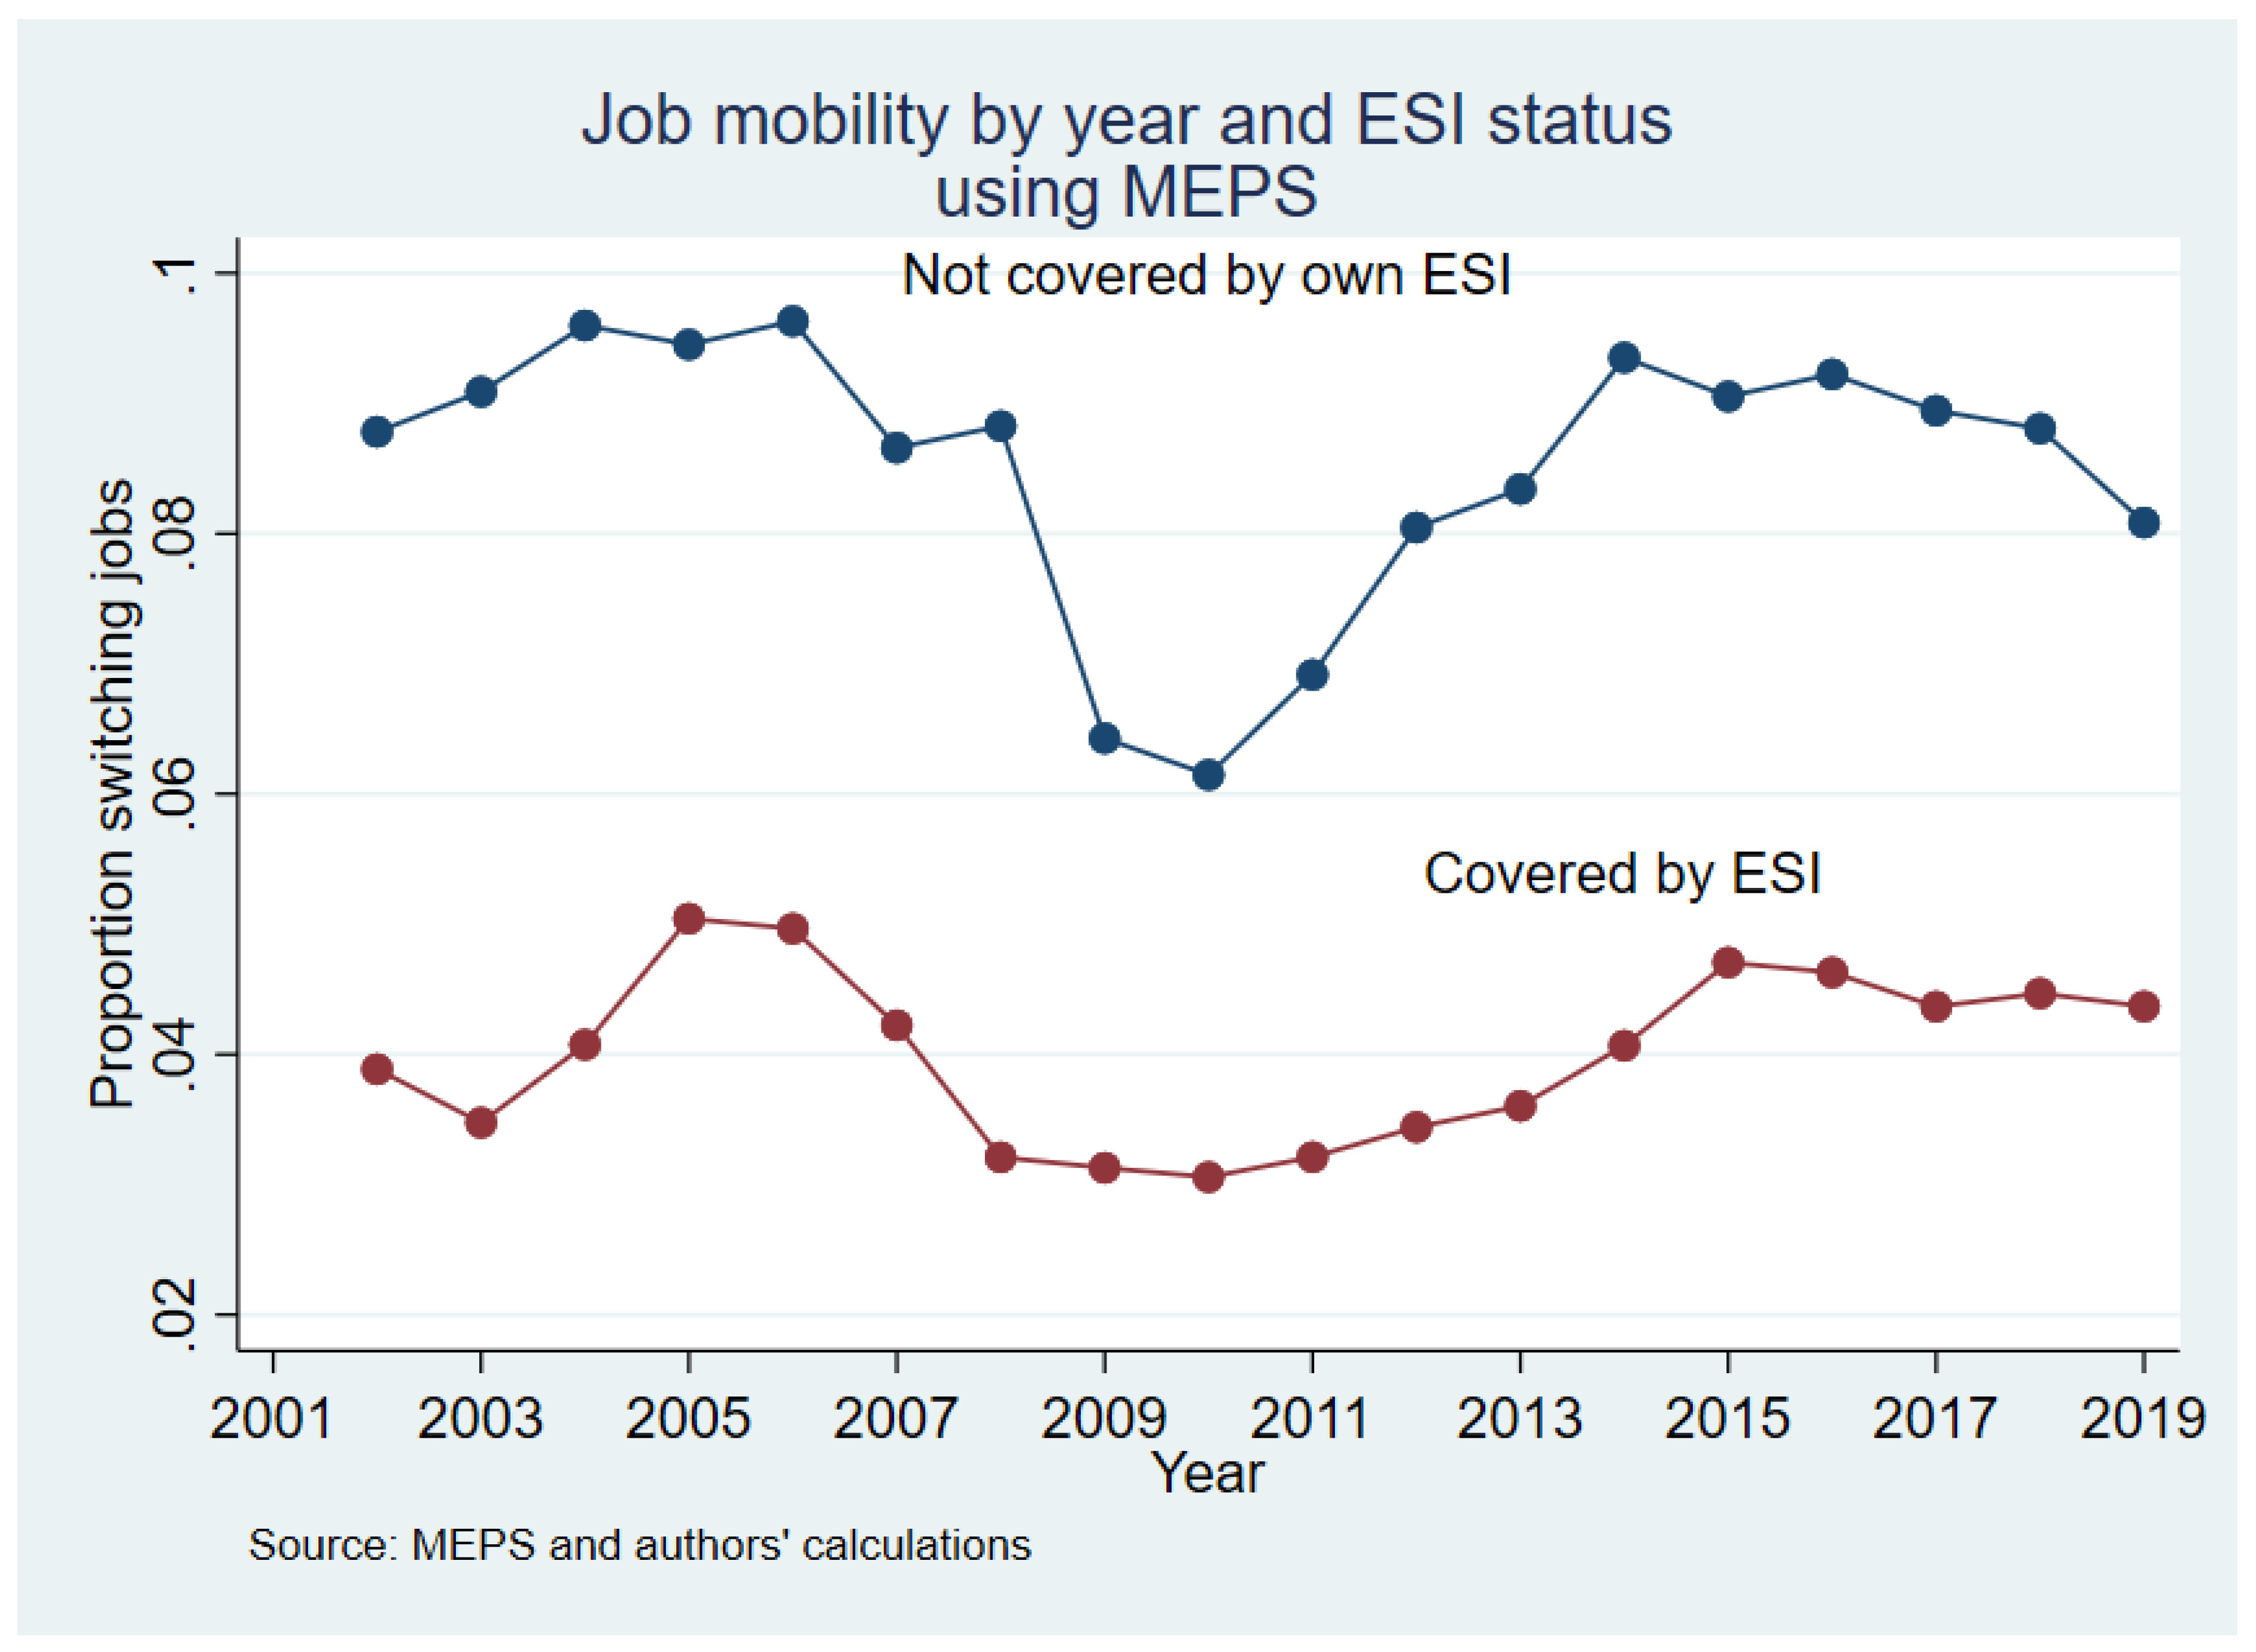
Figure 1. Trends in Job Mobility across ESI Status in the MEPS.
Jrfm 15 00296 g001
Figure 2. Trends in Job Mobility across ESI Status in the CPS.
Jrfm 15 00296 g002
Figure 3. Period-Specific DD Estimates of Job Lock from the MEPS.
Jrfm 15 00296 g003
Figure 4. Period-Specific DD Estimates of Job Lock from the CPS.
Jrfm 15 00296 g004
Table 1. Sample Means and Standard Deviations Medical Expenditure Panel Surveys (MEPS): 2001–2019.
VariableWeighted Mean Pre-ACAStandard Deviation Pre-ACAWeighted Mean Post-ACAStandard Deviation Post-ACA
Changed jobs (percent)6.224.16.925.4
Respondent has ESI (percent)54.949.852.949.9
Partner has ESI (percent)41.749.342.449.4
Deniable condition (0/1) (percent)9.429.210.831.0
Union member (percent)11.331.610.330.4
Hispanic (percent)15.636.318.939.2
Non-Hispanic White (percent)66.947.060.548.9
Non-Hispanic Black (percent)10.230.310.931.2
Non-Hispanic Asian (percent)6.123.86.825.1
Non-Hispanic Other (percent)1.210.92.916.8
Age in years37.99.937.510.0
Married (percent)68.046.761.148.7
Divorced (percent)7.025.46.725.0
Separated (percent)1.712.71.612.5
Widowed (percent)0.56.80.46.6
Never married (percent)23.042.130.145.9
Less than High School (percent)11.131.48.127.3
High School (percent)29.345.525.543.6
Some college (percent)26.544.127.844.8
College (percent)20.940.724.443.0
Graduate (percent)12.132.714.234.9
Management, Business, and Financial (percent)15.135.817.437.9
Professional and Related (percent)23.642.525.743.7
Service (percent)15.436.115.936.6
Sales and Related (percent)9.329.08.527.9
Office and Administrative Support (percent)12.733.311.131.4
Farming, Fishing, and Forestry (percent)0.88.60.78.2
Construction, Extraction, and Maintenance (percent)9.829.88.427.8
Production, Transportation (percent)13.233.912.332.8
Military Specific (percent)0.12.50.02.0
Natural Resources (percent)1.210.81.210.7
Mining (percent)0.56.80.57.3
Construction (percent)7.526.36.825.1
Manufacturing (percent)12.432.911.231.6
Wholesale and Retail Trade (percent)13.434.112.433.0
Transportation and Utilities (percent)5.122.04.721.3
Information (percent)2.415.22.214.7
Financial Activities (percent)6.725.06.624.8
Professional And Business Services (percent)10.730.912.232.7
Education, Health, and Social Services (percent)22.341.723.742.5
Leisure and Hospitality (percent)8.027.28.628.1
Other Services (percent)4.621.04.420.5
Public Administration (percent)5.222.15.422.6
Military (percent)0.12.50.02.0
Employment in firm141.7181.0131.1174.2
Pension available (percent)56.349.659.049.2
Table 2. Means and Standard Deviations Current Population Surveys ASEC: 2001–2019.
VariableWeighted Mean Pre-ACAStandard Deviation Pre-ACAWeighted Mean Post-ACAStandard Deviation Post-ACA
Switches jobs (1/0) (percent)12.633.211.932.3
Respondent has ESI (percent)52.549.950.150.0
Family has ESI (percent)21.941.420.540.4
Female (percent)47.349.947.449.9
Age37.510.937.510.9
Hispanic (percent)14.835.518.338.6
non-Hispanic White (percent)67.446.961.348.7
non-Hispanic Black (percent)11.231.511.832.3
non-Hispanic Asian (percent)5.623.07.125.7
non-Hispanic other (percent)1.010.11.512.2
Less than High School (percent)10.430.58.227.4
High School (percent)29.345.526.344.0
Some college (percent)30.446.030.045.8
College (percent)20.440.323.342.3
Graduate (percent)9.529.412.232.7
Married (percent)54.849.851.250.0
Divorced (percent)10.230.29.128.8
Separated (percent)2.515.62.315.0
Widowed (percent)0.99.40.99.2
Never married (percent)31.646.536.548.2
Union Member (percent)15.736.414.635.3
Agriculture, forestry and fisheries (percent)2.315.12.515.6
Mining (percent)0.57.10.67.9
Construction (percent)7.726.77.125.6
Manufacturing (percent)11.932.410.130.1
Transportation (percent)4.420.54.520.6
Communications and public utilities (percent)2.515.72.314.9
Trade (percent)21.040.721.040.8
Finance, insurance, and real estate (percent)6.524.66.324.3
Services (percent)43.149.545.649.8
Executive, administrative, and managerial (percent)13.534.114.435.1
Professional specialty (percent)17.037.619.639.7
Technicians and related support (percent)3.117.42.916.9
Sales (percent)11.331.710.630.8
Administrative support, including clerical (percent)13.834.512.132.6
Private household (percent)1.09.91.010.0
Protective service (percent)2.114.42.214.5
Service, except protective and household (percent)12.733.313.834.4
Precision production, craft, and repair (percent)10.530.79.128.8
Machine operators, assemblers, and inspectors (percent)4.721.24.019.7
Transportation and material moving equipment (percent)4.119.73.919.4
Handlers, equipment cleaners, helpers, and laborers (percent)3.719.03.819.2
Farming, forestry, and fishing (percent)2.415.32.515.5
Armed Forces0.00.00.00.0
Number of employees6.03.26.23.1
Table 3. (A) Difference-in-Differences Estimates of Partner ESI on Job Mobility. MEPS Analyses. (B) DD using Partner’s Insurance as Cost Factor. (C) DD using Respondent’s Deniable Health Condition as Cost Factor.
(A)
Dependent Variable: Job SwitchPre-ACAPost-ACAPre-ACAPost-ACA
Changed jobsChanged jobsChanged jobsChanged jobs
Respondent has ESI−0.028 ***−0.033 ***−0.040 ***−0.031 ***
(0.0035)(0.0065)(0.0027)(0.0041)
Partner has ESI−0.015 ***−0.016 **
(0.0039)(0.0071)
Respondent has ESI X Partner has ESI0.017 ***0.018 **
(0.0043)(0.0080)
Deniable condition (0/1) 0.021 **0.036 ***
(0.0089)(0.012)
Respondent has ESI X Deniable condition (0/1) −0.020 **−0.028 **
(0.0100)(0.014)
Observations98,28836,59499,34850,241
(B)
Proportion of workers changing jobs per MEPS wave
Pre-ACAPost-ACA
R has ESIDifferenceR has ESIDifference
Partner has ESINoYes NoYes
No0.0690.042−0.0270.0760.045−0.031
Yes0.0540.043−0.0110.0590.046−0.013
Difference0.015−0.0010.0160.017−0.0010.018
(C)
Proportion of workers changing jobs per MEPS wave
Pre-ACAPost-ACA
R ESI DifferenceR ESI Difference
Deniable ConditionNoYes NoYes
No0.0920.053−0.0390.0940.063−0.031
Yes0.1130.053−0.060.130.07−0.06
Difference−0.0210−0.021−0.036−0.007−0.029
Standard errors in parentheses. ** p < 0.05, *** p < 0.01. The regressions include controls for gender, union membership, race and ethnicity, age, marital status, education, occupation, industry, number of employees in the worker’s firm, and year of survey. R stands for respondent.
Table 4. (A) Difference-in-Differences Estimates of Partner ESI on Job Mobility. CPS Analyses. (B) DD using Partner’s Insurance as Cost Factor.
(A)
Pre-ACAPost-ACA
Switches jobsSwitches jobs
Respondent has ESI−0.0436 ***−0.0387 ***
(0.00134)(0.00170)
Family has ESI−0.0226 ***−0.0209 ***
(0.00185)(0.00188)
Respondent has ESI X Family has ESI0.0348 ***0.0557 ***
(0.00203)(0.00375)
Observations1,229,859448,419
(B)
Proportion of workers changing jobs each year (CPS)
Pre-ACA Post-ACA
R ESI DifferenceR ESI Difference
Partner ESINoYes NoYes
No0.1550.111−0.0440.1410.102−0.039
Yes0.1320.124−0.0080.120.1370.017
Difference0.023−0.0130.0360.021−0.0350.056
Standard errors in parentheses. *** p < 0.01. The regressions include controls for gender, union membership, race and ethnicity, age, marital status, education, occupation, industry, number of employees in the worker’s firm, and year of survey. R stands for respondent.
Publisher’s Note: MDPI stays neutral with regard to jurisdictional claims in published maps and institutional affiliations.

