
Impact of Negative Tweets on Diverse Assets during Stressful Events: An Investigation through Time-Varying Connectedness


Abstract
:1. Introduction
2. Literature Review
2.1. Twitter and Sentiments
2.2. Crypto (Especially Dogecoin)
2.3. Connectedness and Impact on Other Assets
3. Research Methodology
3.1. TVP-VAR
3.2. Textual Analysis
3.3. Data Details
4. Results and Interpretation
5. Conclusive Remarks
6. Limitations and Scope for Future Studies
Author Contributions
Funding
Institutional Review Board Statement
Informed Consent Statement
Data Availability Statement
Acknowledgments
Conflicts of Interest
| 1 | |
| 2 | |
| 3 | https://www.utahbusiness.com/buying-dogecoin-houses-could-be-the-new-norm/ (accessed on 16 April 2022). |
| 4 | https://www.coingecko.com/ (accessed on 18 April 2022). |
| 5 | https://www.cambridgeassociates.com/insight/is-bitcoin-a-better-disaster-hedge-than-Gold/ (accessed on 7 Feburary 2022). |
| 6 | |
| 7 |
References
- Al Guindy, Mohamed. 2021. Cryptocurrency price volatility and investor attention. International Review of Economics and Finance 76: 556–70. [Google Scholar] [CrossRef]
- Ando, S. 2019. International Financial Connection and Stock Return Comovement. In IMF Working Papers. Washington, DC: Inernational Monetary Fund, vol. 16. [Google Scholar] [CrossRef]
- Ante, Lennart. 2022. How Elon Musk’s Twitter Activity Moves Cryptocurrency Markets. SSRN Electronic Journal 16: 1–28. [Google Scholar] [CrossRef]
- Antonakakis, Nikolaos, David Gabauer, Rangan Gupta, and Vasilios Plakandaras. 2018. Dynamic connectedness of uncertainty across developed economies: A time-varying approach. Economics Letters 166: 63–75. [Google Scholar] [CrossRef] [Green Version]
- Baur, B. Dirk Glover, and Kristoffer J. Glover. 2010. The Destruction of a Safe Haven Asset? pp. 8–15. Available online: http://dx.doi.org/10.2139/ssrn.2142283 (accessed on 13 March 2022).
- Bouri, Elie, Oguzhan Cepni, David Gabauer, and Rangan Gupta. 2021a. Return connectedness across asset classes around the COVID-19 outbreak. International Review of Financial Analysis 73: 101646. [Google Scholar] [CrossRef]
- Bouri, Elie, Tareq Saeed, Xuan Vinh Vo, and David Roubaud. 2021b. Quantile connectedness in the cryptocurrency market. Journal of International Financial Markets, Institutions and Money 71: 101302. [Google Scholar] [CrossRef]
- Cary, Michael. 2021. Down with the # Dogefather: Evidence of a Cryptocurrency Responding in Real Time to a Crypto-Tastemaker. Journal of Theoretical and Applied Electronic Commerce Research 16: 2230–40. [Google Scholar]
- Corbet, Shaen, Charles James Larkin, and Brian Lucey. 2020. The contagion effects of the COVID-19 pandemic: Evidence from gold and cryptocurrencies. Finance Research Letters 35: 1015–54. [Google Scholar] [CrossRef]
- Deeney, Peter, Mark Cummins, Michael M. Dowling, and Alan Smeaton. 2018. Negativity Bias in the European Emissions Market: Evidence from High-Frequency Twitter Sentiment. SSRN Electronic Journal. Available online: https://doi.org/10.2139/ssrn.3174353 (accessed on 11 March 2022).
- Diebold, Francix X., and Kamil Yilmaz. 2012. Better to give than to receive: Predictive directional measurement of volatility spillovers. International Journal of Forecasting 28: 57–66. [Google Scholar] [CrossRef] [Green Version]
- Diebold, Francix X., and Kamil Yilmaz. 2014. On the network topology of variance decompositions: Measuring the connectedness of financial firms. Journal of Econometrics 182: 119–34. [Google Scholar] [CrossRef] [Green Version]
- Elliot, Graham, Thomas J. Rothenberg, and James H. Stock. 1996. Efficient Tests for an Autoregressive Unit Root. Econometrica 64: 813–36. [Google Scholar] [CrossRef] [Green Version]
- Fama, Eugene. 1970. Efficient Capital Markets: A Review of Theory and Empirical Work. Journal of Finance 25: 383–417. [Google Scholar] [CrossRef]
- Gözde, Gurgun, and İbrahim Ünalmış. 2014. Is gold a safe haven against equity market investment in emerging and developing countries? Finance Research Letters 11: 341–48. [Google Scholar]
- Hamurcu, Cagri. 2022. Can Elon Mask’s Twitter Posts About Cryptocurrencies Influence Cryptocurrency Markets by Creating a Herding Behavior Bias? Fiscaoeconomia 6: 215–28. [Google Scholar] [CrossRef]
- Hennig-Thurau, Thorsten, and Caroline F. Wiertz. 2015. Does Twitter matter? The impact of microblogging word of mouth on consumers’ adoption of new movies. Journal of the Academy of Marketing Science 6: 375–94. [Google Scholar] [CrossRef]
- Huynh, Toan Luu Duc. 2021. Does Bitcoin React to Trump’s Tweets? Journal of Behavioral and Experimental Finance 31: 100546. [Google Scholar] [CrossRef]
- Huynh, Toan Luu Duc. 2022. When Elon Musk Changes his Tone, Does Bitcoin Adjust Its Tune? Computational Economics 13: 1–23. [Google Scholar] [CrossRef]
- Jawad, Syed, Hussain Shahzad, Muhammed Anas, and Elie Bouri. 2022. Price explosiveness in cryptocurrencies and Elon Musk’s tweets. Finance Research Letters 47: 102695. [Google Scholar] [CrossRef]
- Klein, Tony. 2017. Dynamic Correlation of Precious Metals and Flight-to-Quality in Developed Markets. Finance Research Letter 23: 283–90. [Google Scholar] [CrossRef]
- Koop, Gary, M. Hashem Pesaran, and Simon M. Potter. 1996. Impulse response analysis in nonlinear multivariate models. Journal of Econometrics 74: 119–47. [Google Scholar] [CrossRef]
- Kraaijeveld, Olivier, and Johannes De Smedt. 2020. The predictive power of public Twitter sentiment for forecasting cryptocurrency prices. Journal of International Financial Markets, Institutions & Money 65: 101188. [Google Scholar] [CrossRef]
- Lansiaux, Edouard. 2022. Community Impact on a Cryptocurrency: Twitter Comparison Example between Dogecoin and Litecoin Community Impact on a Cryptocurrency. Frontiers in Blockchain 5: 829–65. [Google Scholar] [CrossRef]
- Lo, Andrew. 2004. The adaptive market hypothesis: Market efficiency from an evolutionary perspective. The Journal of Portfolio Management 30: 15–29. [Google Scholar] [CrossRef]
- Loughran, Tim, and Bill McDonald. 2011. When Is a Liability Not a Liability? The Journal of Finance 66: 35–65. [Google Scholar] [CrossRef]
- Mensi, Walid, Shawkat Hammoudeh, Duc Khuong Nguyen, and Sang Hoon Kang. 2016. Global financial crisis and spillover effects among the US and BRICS stock markets. International Review of Economics & Finance 42: 257–76. [Google Scholar]
- Naeem, Muhammad Abubakr, Imen Mbarki, Muhammed Tahir Suleman, Xuan Vinh Vo, and Syed Jawad Hussain Shahzad. 2021. Does Twitter Happiness Sentiment predict cryptocurrency? International Review of Finance 21: 1529–38. [Google Scholar] [CrossRef]
- Öztürk, Serda Selin, and M. Emre Bilgiç. 2021. Twitter & Bitcoin: Are the most influential accounts really influential? Applied Economics Letters 29: 1–4. [Google Scholar]
- Park, Chang Sup. 2015. Applying “Negativity Bias” to Twitter: Negative News on Twitter, Emotions, and Political Learning. Journal of Information Technology and Politics 12: 342–59. [Google Scholar] [CrossRef]
- Park, Seunghyun Brian, Jang Jichul, and Micheal O. Chihyung. 2016. Analyzing Twitter to explore perceptions of Asian restaurants. Journal of Hospitality and Tourism Technology 7: 405–22. [Google Scholar] [CrossRef]
- Pesaran, H. Hashem, and Yongcheol Shin. 1998. Generalized impulse response analysis in linear multivariate models. Economics Letters 58: 17–29. [Google Scholar] [CrossRef]
- Peters, Edgar. E. 1994. Fractal Market Analysis. Applying Chaos Theory to Investment & Economics. Hoboken: Wiley. [Google Scholar]
- Ren, Ballis, and Brain Lucey. 2022. Do clean and dirty cryptocurrency markets herd differently? Finance Research Letters 47: 102795. [Google Scholar] [CrossRef]
- Scott, Kim V. 2019. The Impact of Negative Twitter Feeds on Washington Metropolitan Area Transit Authority Ridership. Hampton: Hampton University. [Google Scholar]
- Shahzad, Syed Jawad Hussian, Elie Bouri, David Roubaud, Ladislav Kristoufek, and Brain Lucey. 2019. Is Bitcoin a better safe-haven investment than gold and commodities? International Review of Financial Analysis 63: 322–30. [Google Scholar] [CrossRef]
- Shen, Dehua, Andrew Urquhart, and Pengfel Wang. 2019. Does twitter predict Bitcoin ? Economics Letters 174: 118–22. [Google Scholar] [CrossRef]
- Stelios, Bekiros, Sabri Boubaker, Duc Khuong, and Gazi Salah Uddin. 2017. Black swan events and safe havens: The role of gold in globally integrated emerging markets. Journal of International Money and Finance 73: 317–34. [Google Scholar]
- Tetlock, Paul. 2007. Giving Content to Investor Sentiment: The Role of Media in the Stock Market. The Journal of Finance 62: 1139–68. [Google Scholar] [CrossRef]
- Tjahyana, Lady Joanne. 2021. Brand Monitoring for Dogecoin Cryptocurrency on Twitter. Paper presented at 2nd International Conference on Social Sciences and Humanities, Surabaya, Indonesia, July 30; pp. 131–21. [Google Scholar]
- Urquhart, Andrew. 2016. The inefficiency of Bitcoin. Economics Letters 148: 80–82. [Google Scholar] [CrossRef]
- Wen, Fenghua, Xi Tong, and Xiaohang Ren. 2022. International Review of Financial Analysis Gold or Bitcoin, which is the safe haven during the COVID-19 pandemic ? International Review of Financial Analysis 81: 102121. [Google Scholar] [CrossRef]
- Yuan, Yong, and Feiyue Y. Wang. 2018. Blockchain and cryptocurrencies: Model, techniques, and applications. IEEE Transactions on Systems, Man, and Cybernetics: Systems 48: 1421–28. [Google Scholar] [CrossRef]


| S. No | Negative Words | Occurrences |
|---|---|---|
| 1 | Boring | 158 |
| 2 | Problem | 130 |
| 3 | Down | 100 |
| 4 | Stop | 82 |
| 5 | Death | 43 |
| 6 | Challenge | 25 |
| 7 | Counter | 22 |
| 8 | Die | 21 |
| 9 | Sad | 20 |
| 10 | Hate | 19 |
| 11 | Abort | 18 |
| 12 | Bore | 17 |
| 13 | Fake | 16 |
| 14 | Lose | 16 |
| 15 | Mad | 15 |
| 16 | Trouble | 15 |
| 17 | Loss | 14 |
| 18 | Sick | 8 |
| 19 | Lie | 7 |
| 20 | Disable | 5 |
| 21 | Paranoid | 4 |
| 22 | Disadvantage | 3 |
| 23 | Losses | 3 |
| 24 | Suicide | 3 |
| 25 | Punish | 2 |
| 26 | Adverse | 1 |
| Ngsnt | Doge | GC.CMX | Pimco | GSPC | |
|---|---|---|---|---|---|
| Mean | 2.443 | 0.035 | 0.004 | 0.001 | 0.005 |
| Variance | 107.482 | 0.008 | 0.000 | 0.000 | 0.000 |
| Skewness | 20.47 *** | 2.99 *** | 2.76 *** | 7.79 *** | 4.94 *** |
| (0.000) | (0.000) | (0.000) | (0.000) | (0.000) | |
| Kurtosis | 671.57 *** | 9.6 *** | 11.82 *** | 120.8 *** | 43.94 *** |
| (0.000) | (0.000) | (0.000) | (0.000) | (0.000) | |
| JB | 46,325,450 *** | 132,289 *** | 17,365 *** | 1,518,545 *** | 207,602 *** |
| (0.000) | (0.000) | (0.000) | (0.000) | (0.000) | |
| ERS | −18.609 *** | −2.795 *** | −12.080 *** | −10.884 *** | −10.853 *** |
| (0.000) | (0.005) | (0.000) | (0.000) | (0.000) | |
| Q (10) | 14.7 *** | 12,817.7 *** | 105.3 *** | 701.31 *** | 934.93 *** |
| (0.007) | (0.000) | (0.000) | (0.000) | (0.000) | |
| Q2(10) | 0.077 | 10,720.5 *** | 89.8 *** | 620.8 *** | 1216.2 *** |
| (0.000) | (0.000) | (0.000) | (0.000) | (0.000) |
| Ngsnt | Doge | GC CMX | Pimco | GSPC | From | |
|---|---|---|---|---|---|---|
| Ngsnt | 98.45 | 0.25 | 0.41 | 0.43 | 0.47 | 1.55 |
| Doge | 0.7 | 97.44 | 0.43 | 0.68 | 0.75 | 2.56 |
| GC.CMX | 1.13 | 0.32 | 76.27 | 11.23 | 11.05 | 23.73 |
| pimco | 3.25 | 0.27 | 9.86 | 72.14 | 14.48 | 27.86 |
| GSPC | 2.13 | 0.52 | 9.35 | 13.04 | 74.97 | 25.03 |
| TO | 7.2 | 1.35 | 20.04 | 25.38 | 26.75 | 80.72 |
| NET | 5.64 | −1.21 | −3.68 | −2.47 | 1.72 | 16.14 |
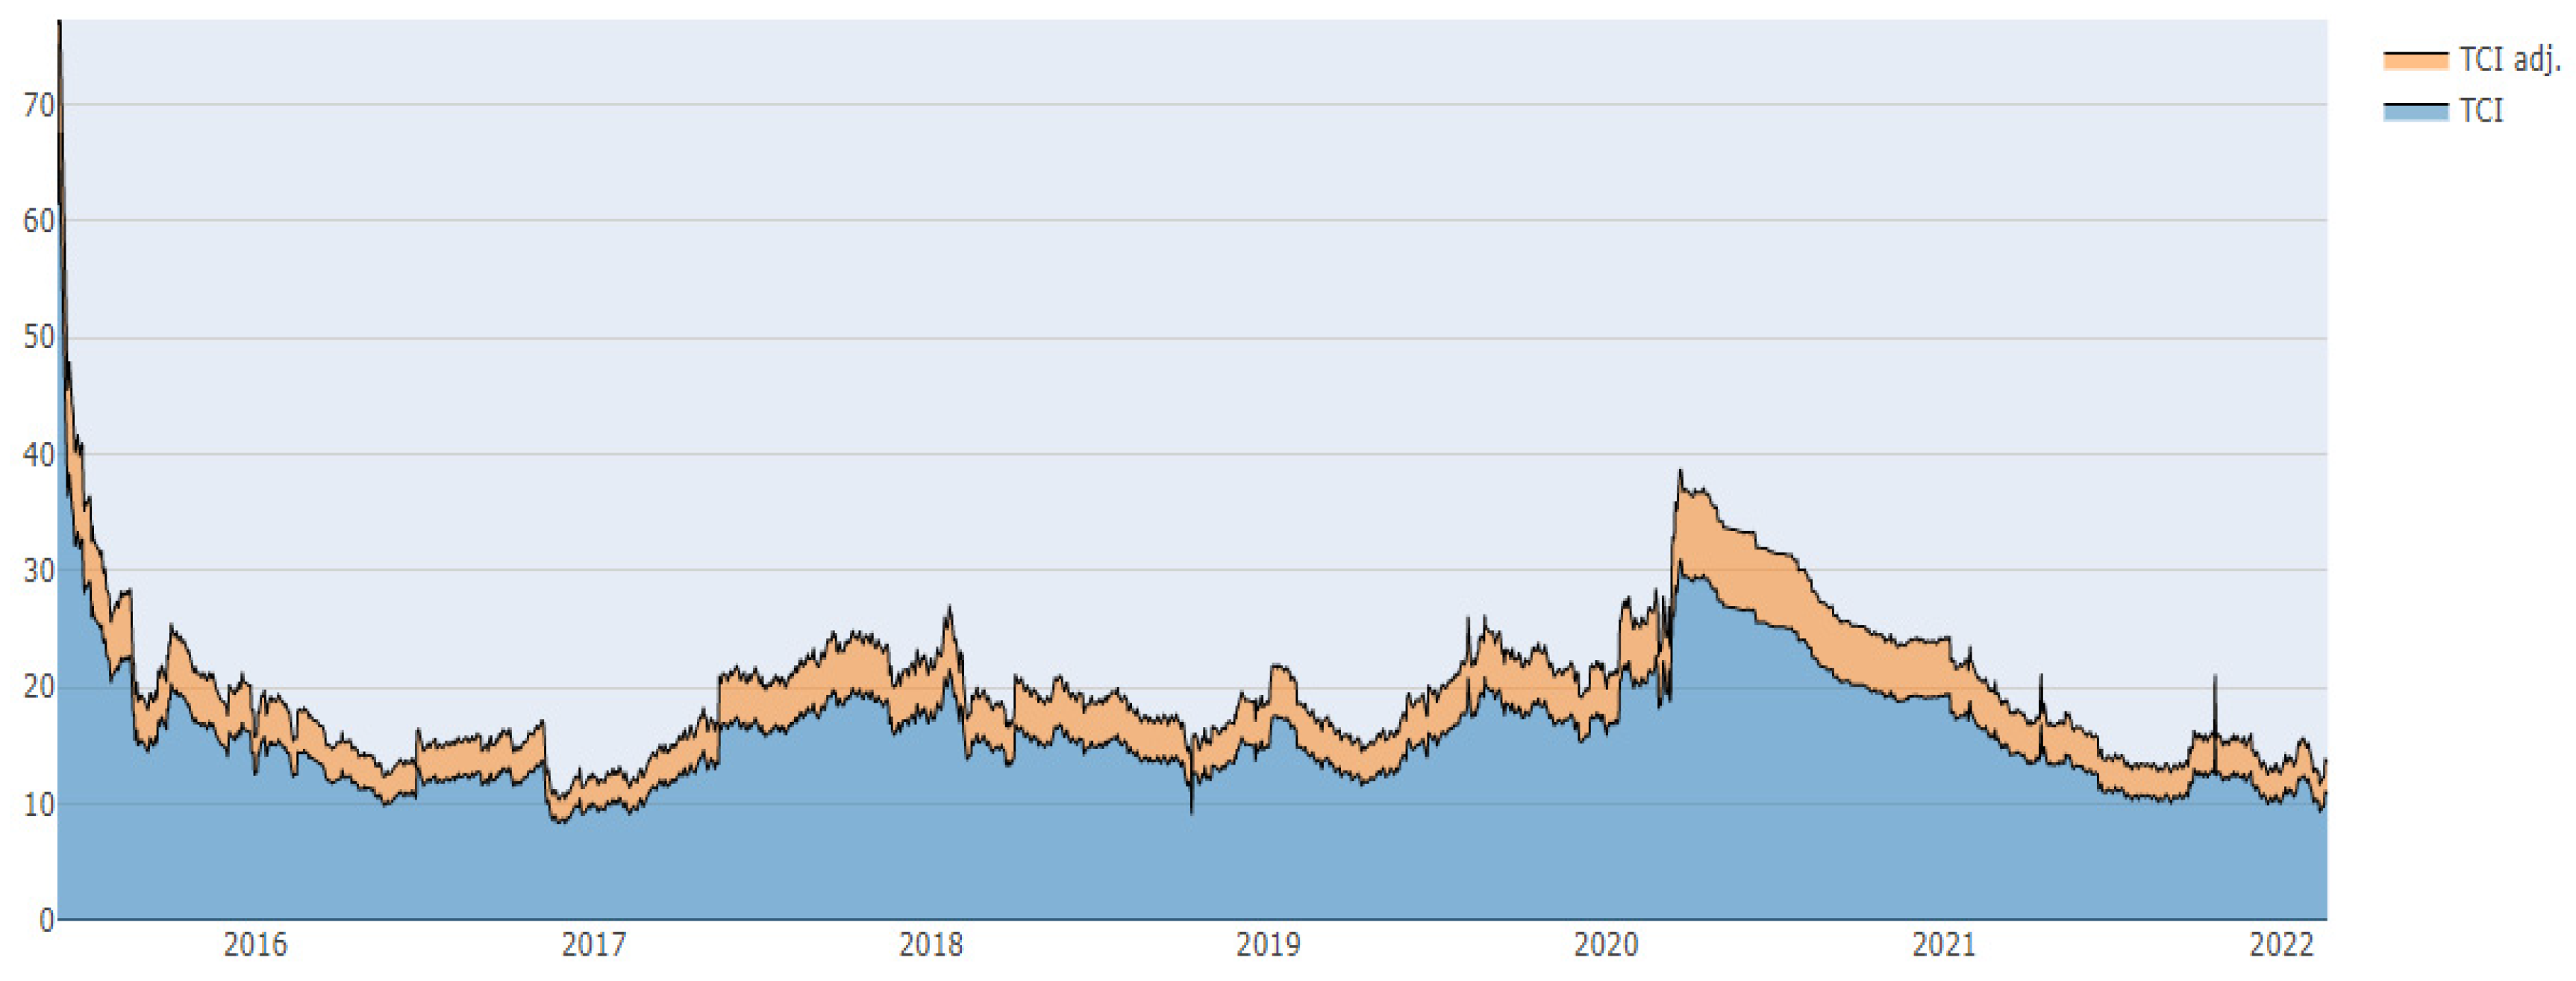
| TCI | Date Range | Event | Interpretations |
|---|---|---|---|
| 75% | June–July 2015 | Greek debt crisis | Stressful events pushed the TCI to an extreme limit |
| 17% | June–July 2016 | Brexit referendum | Stressful events pushed the TCI to a relatively smaller limit |
| 38% | March–April 2020 | COVID-19 breakout | Stressful events pushed the TCI to a relatively higher limit |
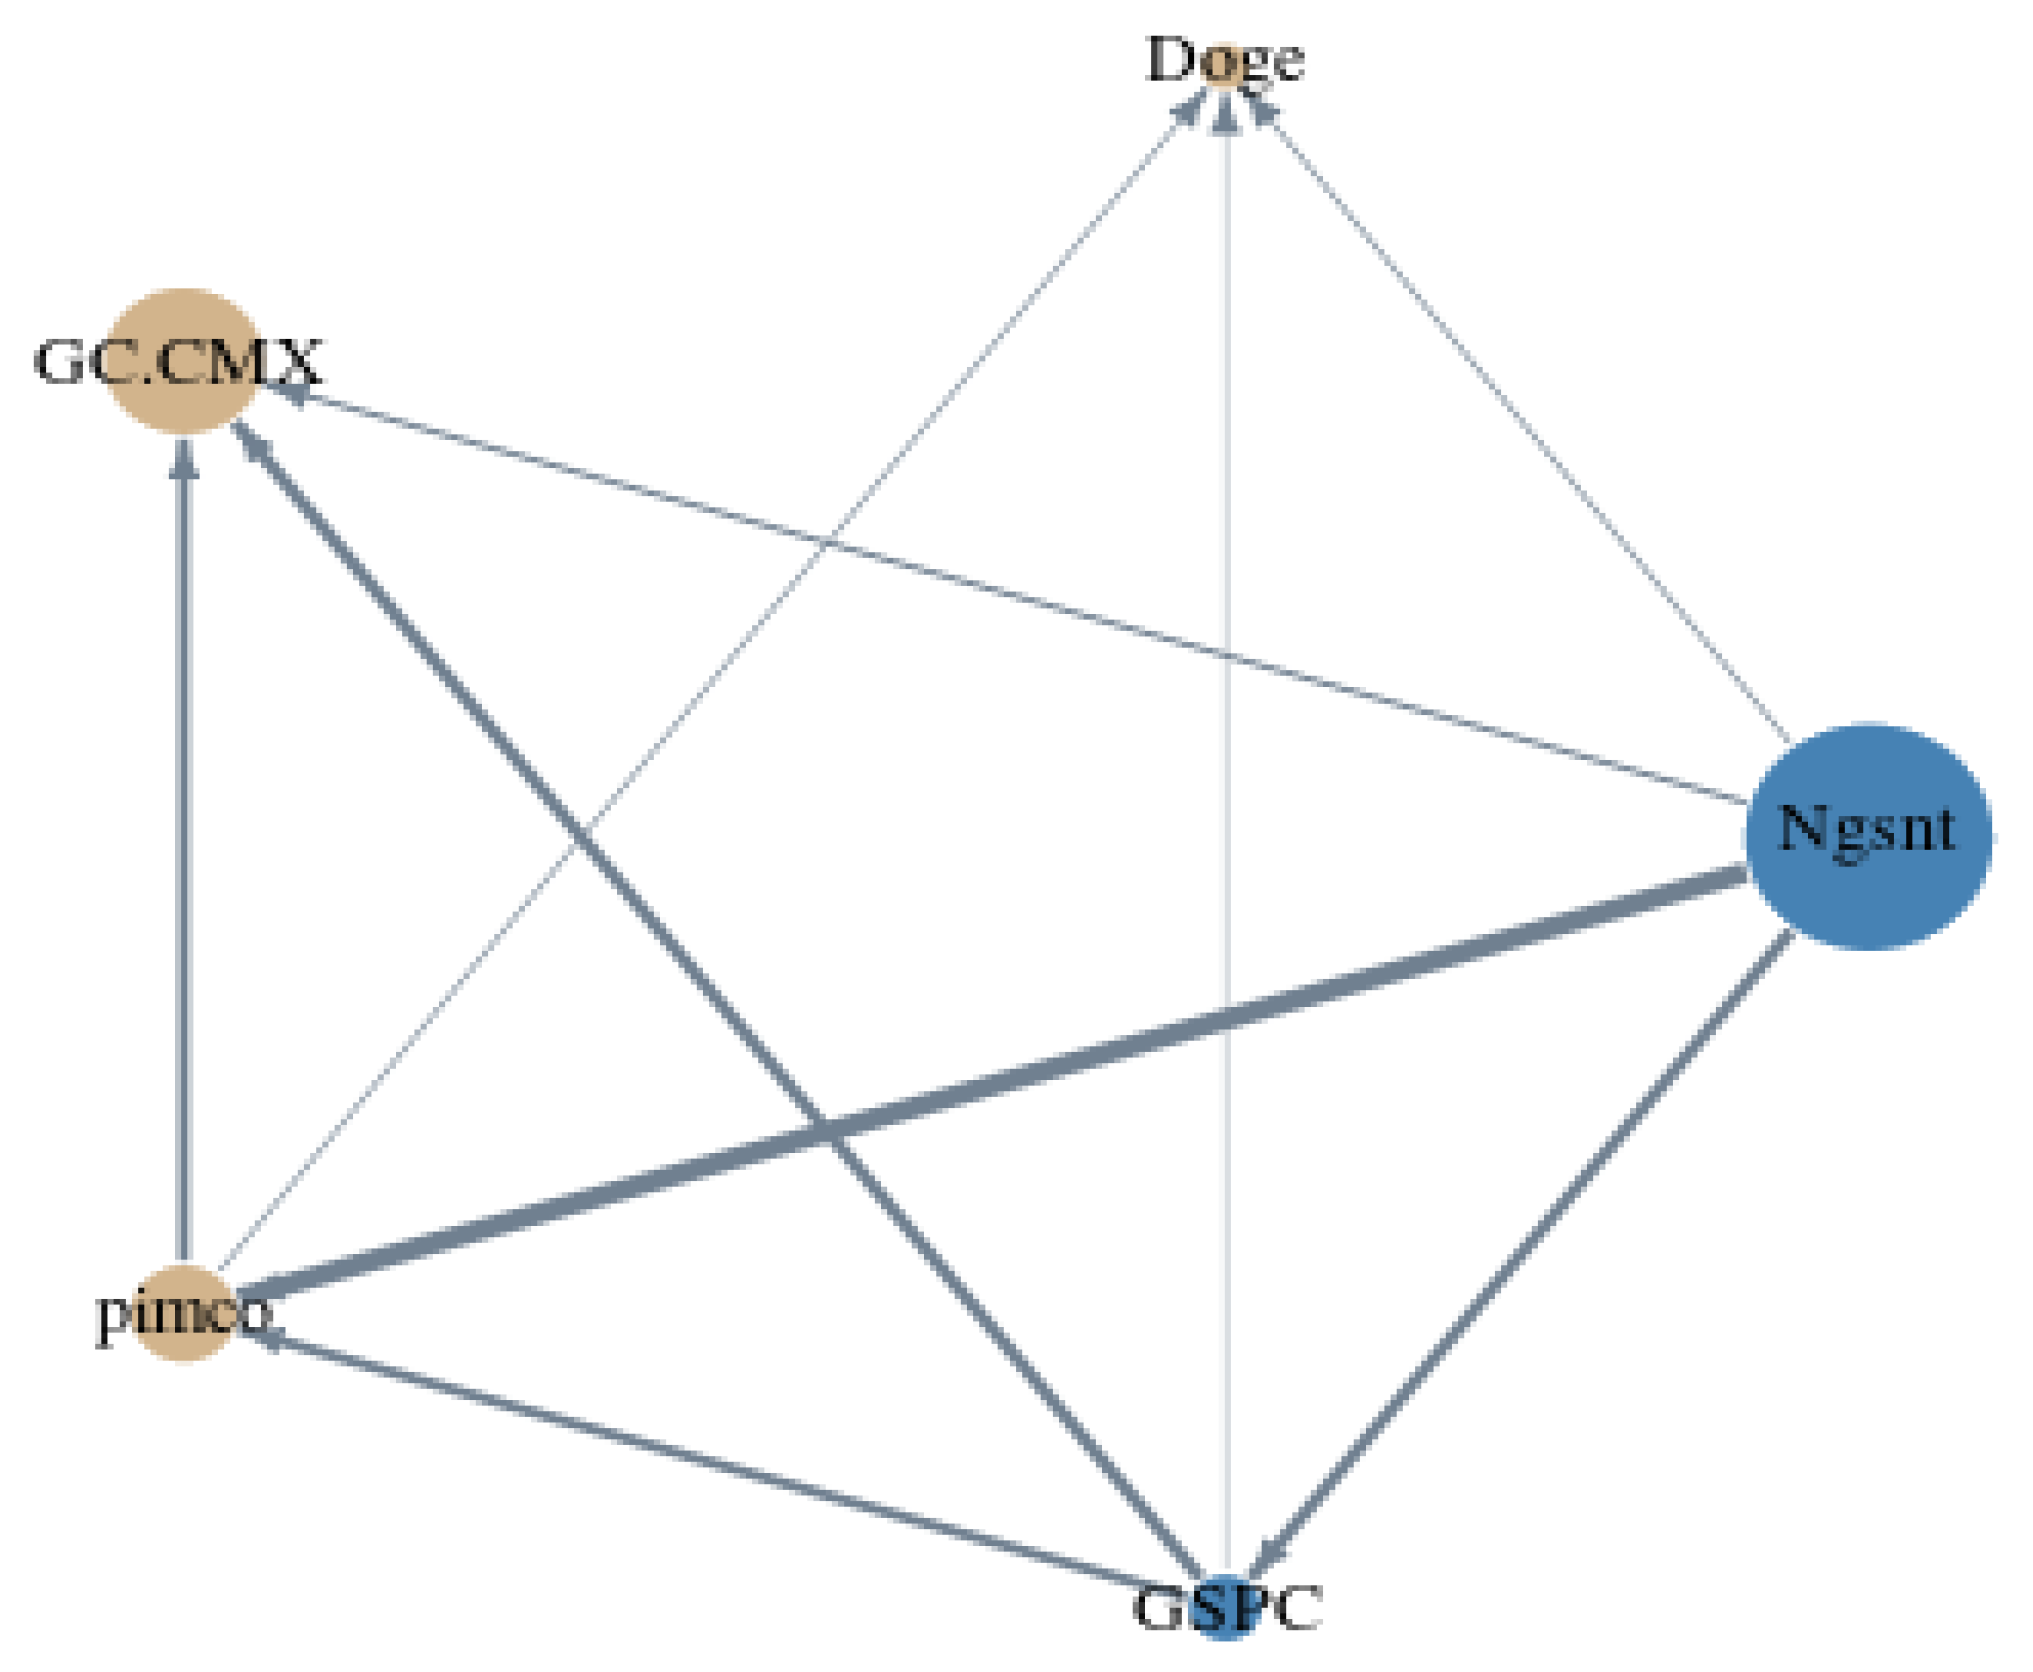
| Node | Size | Asset/Sentiment | Interpretation |
|---|---|---|---|
| Blue | Large | Ngsnt | Significant net transmitter of shocks; high weighted average net total directional connectedness (see Figure 6) |
| Small | GSPC | Low net transmitter of shocks; low weighted average net total directional connectedness (see Figure 6) | |
| Yellow | Large | GC CMX | Significant net receiver of shocks; high weighted average net total directional connectedness (see Figure 6) |
| Medium | pimco | Moderate net receiver of shocks; moderate weighted average net total directional connectedness (see Figure 6) | |
| Small | Doge | Low net receiver of shocks; low weighted average net total directional connectedness (see Figure 6) |
Publisher’s Note: MDPI stays neutral with regard to jurisdictional claims in published maps and institutional affiliations. |
© 2022 by the authors. Licensee MDPI, Basel, Switzerland. This article is an open access article distributed under the terms and conditions of the Creative Commons Attribution (CC BY) license (https://creativecommons.org/licenses/by/4.0/).
Share and Cite
Balasudarsun, N.L.; Ghosh, B.; Mahendran, S. Impact of Negative Tweets on Diverse Assets during Stressful Events: An Investigation through Time-Varying Connectedness. J. Risk Financial Manag. 2022, 15, 260. https://doi.org/10.3390/jrfm15060260
Balasudarsun NL, Ghosh B, Mahendran S. Impact of Negative Tweets on Diverse Assets during Stressful Events: An Investigation through Time-Varying Connectedness. Journal of Risk and Financial Management. 2022; 15(6):260. https://doi.org/10.3390/jrfm15060260
Chicago/Turabian StyleBalasudarsun, N. L., Bikramaditya Ghosh, and Sathish Mahendran. 2022. "Impact of Negative Tweets on Diverse Assets during Stressful Events: An Investigation through Time-Varying Connectedness" Journal of Risk and Financial Management 15, no. 6: 260. https://doi.org/10.3390/jrfm15060260
APA StyleBalasudarsun, N. L., Ghosh, B., & Mahendran, S. (2022). Impact of Negative Tweets on Diverse Assets during Stressful Events: An Investigation through Time-Varying Connectedness. Journal of Risk and Financial Management, 15(6), 260. https://doi.org/10.3390/jrfm15060260