Abstract
This paper examines whether urban leverage, defined by the bank loan-to-deposit ratio in a city, affects housing prices in China. Using a panel dataset of 236 cities and hedonic models, we find a depressing effect of urban leverage on housing price in first- and second-tier cities while leaving third- and fourth-tier cities unaffected. Urban leverage negatively affects housing prices by influencing credit supply. Moreover, the difference-in-differences analysis indicates that purchase restriction policies amplify the depressing effect of urban leverage on housing prices. Overall, we show that urban leverage is an important determinant of housing prices in China.
1. Introduction
In China, along with the financialization of the housing market in the past two decades, housing prices have risen rapidly and accumulated high risk in the capital market. The central government had implemented a series of policies to stabilize housing prices, including the use of mortgage rates and purchase restriction policies and credit supply to cool down the market (Claessens et al. 2013; Duffy et al. 2016; Favara and Imbs 2015). Although the influencing factors of credit supply to the housing market are complex, risk prevention is usually an essential motivation for the government to adjust credit supply to the housing market (Cornett et al. 2011; Zhou 2015). Liquidity risk is one of the major risks in the financial system in a country. In the 2008 financial crisis, the dry-up of liquidity had caused catastrophic damage to the economy in the US (Disalvo and Johnston 2017). The liquidity risk in the banking system has been proved to be related to risks in the real estate market, especially when the loan-to-deposit ratio in a bank increases due to the credit supply to the housing market (e.g., Disalvo and Johnston 2017). Previous studies have provided some evidence on a positive correlation between credit supply and housing prices, arguing that credit supply increases the housing demand (e.g., Favara and Imbs 2015; Justiniano et al. 2019; Mian and Sufi 2022; Adelino et al. 2012). Very few studies have explored the impacts of the liquidity risk in a city, caused by the aggregate credit supply, on housing prices. This study aims to fill this research gap. It is also dedicated to finding out the relationship between housing price and urban leverage which is an important indicator for liquidity risk and explores heterogeneity across cities.
China provides an ideal housing market to explore the relationship between aggregate liquidity risk in a city and housing price. The Chinese credit market is geographically segmented (Huang et al. 2020). Until very recently, doing business outside their own cities or province is not allowed for urban and rural financial institutions in China. Credit cannot be drawn from cities, as nation-wide policy banks and commercial banks usually extend loans on a local basis, i.e., local branches lend to local governments, firms, and residents (Dobson and Kashyap 2006; Huang et al. 2020). The geographical segmentation of the financial system in China restricts the capital mobility across cities and causes heterogeneous levels of liquidity risk in the local credit market across the country. Similar to the argument of Huang et al. (2020) that local lending to private firms can be limited by total available credit in the local market, we expect that credit supply to the housing market could be rationed locally by the aggregate liquidity risk, which in turn affects housing price in a city. The credit rationing could be exacerbated by intervention in local housing markets from the central government, as to prevent systematic risk in the financial market. In the cities where liquidity risk is high, the central government could directly issue some policies to curb rising housing prices and deleverage the aggregate urban leverage in these cities. For example, the central bank issued Notice on Issues Concerning the Adjustment of Personal Housing Loan Policies in 2016, requiring a down payment as low as 20% for the purchase of the first house in cities without purchase restriction while a tighter credit policy in cities with purchase restriction, which are usually the first- and second-tier cities. The third- and fourth-tier cities had relatively low urban leverage and liquidity risk, and hence received less policy pressure from the central government on deleveraging. The central government in China was keen to reduce unsold homes in these cities and credit supply was even loosened to stimulate the housing demand. For instance, the mortgage loan increased by 14.9% in Longyan and 13.43% in Inner Mongolia respectively in 2016 though the credit policies were tighter in capital cities in the same year. We exploit this setting and examine the heterogeneous effects of aggregate liquidity risk on housing prices in different Chinese cities.
Following the literature (e.g., Van den End 2016; Disalvo and Johnston 2017), liquidity risk in a city is measured by the ratio of aggregate bank loans to aggregate deposits. We define this ratio as urban leverage in a city. Using a city-level database for 236 cities in China from 2003 to 2019 and hedonic models, we showed that the increase in urban leverage, as an indicator for aggregate liquidity risk in the local financial system, depresses housing prices in a city, after controlling for the factors that can affect housing demand and supply. We also found that this depressing effect is heterogeneous across cities: in the first- and second-tier cities, an increase in urban leverage significantly leads to a decrease in housing prices; while, in the third-and fourth-tier cities, urban leverage has not exerted significant depression on housing prices as the liquidity risk is lower in these cities.
We argued that the negative effect of urban leverage on a city’s housing price is caused by the liquidity risk and the supervision from the central government. This argument was further tested by the housing purchase restriction policies in cities with hot housing markets in 2010 and 2016. Two rounds of housing purchase restrictions were implemented in only some major cities. This allowed us to apply a difference-in-differences analysis and test whether the depressing effect of urban leverage on housing prices is stronger in the cities that housing purchase restrictions were imposed. Consistent with the argument, we found that urban leverage’s depressing effect on housing prices is amplified in cities with purchase restrictions. Overall, this study indicates that urban leverage can negatively affect local housing markets in China when urban leverage may trigger liquidity risk and invite interventions from central government.
This paper is related to the vast literature on the effect of leverage and credit supply on housing prices in China. Previous studies have explored the relationship between leverage and housing prices from the demand side (Lamont and Stein 1997). This study contributes to the literature by investigating the impact of leverage on housing price from the supply side and exploring the influencing channel of urban leverage. It also contributes to understanding whether and how housing purchase restriction policy can be used effectively to affect housing prices.
The structure of this paper is as follows. The first section is about the social background and introduction of this research. The second section presents literature review and hypotheses development. The third section gives data, samples, and variables. Empirical results are discussed in the fourth section. The last section draws a conclusion on this research.
2. Literature Review and Hypotheses Development
2.1. Literature Review
Existing studies find that an increase in credit supply could contribute to a rise in housing prices. Tsai (2013) showed that expansionary monetary policy accelerates the housing price growth while restrictive monetary policy decreases the housing price growth and such impact is asymmetric. McDonald and Stokes (2013) also found that a loose monetary policy—e.g., a lower interest rate—contributes to the housing price bubble. Mian and Sufi (2022) argued that credit supply from banks can affect investment in the housing market and thus influence housing prices. Huang et al. (2015) analyzed the annual data of 35 major cities from 1999 to 2012 in China with a two-step regression model and found that credit supply plays an important role in pushing up housing price after the Great regression. These studies suggest that credit supply is an important determinant that can influence housing prices.
Previous studies find that some factors, such as liquidity risk in the banking system, cause to decline in credit supply. Cornett et al. (2011) analyzed the banking system in the US with bank-level data from 2006 to 2009 and found that the decrease in bank credit supply could be resulted from the liquidity risk exposure. Dursun-de Neef (2019) showed that the negative liquidity shock on banks in the 2007–2009 financial crisis led to a reduction in real estate loan supply and resulted in a decrease in housing prices in metropolitan statistical areas in the US. Drechsler et al. (2021) found that the interest rate hike by the Federal Reserve caused banks to reduce mortgage loan supply in the US between 2003 and 2006. Several studies in China’s capital market found that the stimulus package and expansionary monetary policies in 2009–2010 led to a significant increase of bank loan supply, corporate overinvestment, and also housing prices (e.g., Burdekin and Tao 2014; Burdekin and Weidenmier 2015; Shen et al. 2016; Chen et al. 2020). Jo et al. (2022) showed that the liquidity risk in the banking system affects the demand for commodities.
This study focused on the liquidity risk in the local financial system. We used the aggregate loan-to-deposit ratio in a city to measure this risk. The ratio had been used in the previous studies. On a bank scale, the loan-to-deposit ratio can roughly estimate the liquidity of a bank. Van den End (2016) pointed out that a high loan-to-deposit ratio in a bank may indicate an overextension of loan and a high liquidity risk. Banks with a relatively low loan-to-deposit ratio may weather the sudden withdrawal and crisis better. Therefore, to prevent mismatches between loans and stable funding and thus to prevent systemic risk in the banking system, it is reasonable for banks to set an upper limit to the loan-to-deposit ratio and keep the ratio at a sustainable level (Van den End 2016). On a city scale, urban leverage which measures the aggregate loan-to-deposit ratio in a city can roughly represent the systematic risk of the financial system in a city. Van den End (2016) argued that a high urban leverage may reflect the overextension of debt financing in a city; and while a very low urban leverage may indicate an insufficient level of financial development. Liquidity risk, captured by the loan-to-deposit ratio in banks, is related to risks in the real estate market. For example, in the US, the loan-to-deposit ratio of large banks approached 95 percent in the early and mid-2000s before the burst of the real estate bubble due to the rapid residential real estate mortgage expansion (Disalvo and Johnston 2017). It is interesting to explore whether urban leverage can generate a depressing effect on housing prices.
Several studies had explored the fundamental factors of demand and supply that can affect housing prices in Chinese cities. Wang et al. (2011) found that urban openness positively influences housing prices based on panel data of 365 cities. Wang and Zhang (2014) showed that fundamental factors—e.g., urban population, wage income, land supply, and construction costs—can explain the dynamics of housing prices in major Chinese cities. This study is also related to the literature that discusses the relationship between housing purchase restrictions and the housing price in China. Some studies showed that the purchase restriction policies in 2010 and 2016 had significantly depressed housing prices (Du and Zhang 2015; Cao et al. 2015); while some found opposite evidence (Li et al. 2020). Since loan restriction is the essential part of purchase restriction policies in China, the housing purchase restriction policies provide a good opportunity to further investigate whether the potential negative effect of urban leverage on housing prices could be amplified in the cities with purchase restrictions.
2.2. Hypothesis Development
The increase in bank lending is considered as an important factor that pushes up the housing price in China (Che et al. 2011; Huang et al. 2015). Due to the concerns of property and credit bubbles, the central government in China had adopted monetary policy and macro-prudential policy tools to restrain excessive credit expansion (Klingelhöfer and Sun 2019). Klingelhöfer and Sun (2019) tested the response of credit and property price to the macroprudential monetary policies in China from 2000 to 2015 with VAR models, and found that such monetary policies have significant impact on credit and house price. Several housing-related policies were implemented in China to control the potential systematic risk, including the restriction of loan supply to developers, the caps on the loan-to-value ratio and the debt-to-income ratio, the limits on credit growth and mortgage, down payment requirements, etc. In 2007, the central bank issued the Notice on Strengthening the Credit Management of Commercial Real Estate to prevent liquidity risk in the real estate market. The notice required banks to strictly tighten real estate development loans, land reserve loans, and housing mortgage loans and strengthen real estate credit investigation and loan monitoring management. In 2016, to reduce the financial risk, the Central Bank of China issued the Notice on Further Strengthening the Management of Housing Credit Risks. The notice required banks to (1) strengthen housing credit risk management; (2) implement differentiated housing credit policies; and (3) strengthen the authentic review of the qualifications of borrowers.
These policies can significantly affect the credit growth in the housing market and hence housing price (Klingelhöfer and Sun 2019). Higher urban leverage in a city indicates a higher liquidity risk in the local market and a greater probability that credit growth is restricted by the policies from the central government. Satria et al. (2016) found that the loan-to-deposit ratio in banking system can significantly influence credit supply and thus contribute to managing liquidity risk in an economic booming period. As a result, in cities with high liquidity risk, developers are less likely to obtain bank loans for acquiring land, leading to a lower land price and hence housing price in a city (Shen and Yin 2016; Shen et al. 2018). What is more, because homebuyers and developers in the city cannot obtain housing credit from other cities due to the market segmentation (Huang et al. 2020), the constraint in credit supply leads to a lower housing and land demand, and hence a lower housing price (Satria et al. 2016; Klingelhöfer and Sun 2019). The first hypothesis in this study argues that there is a depressing effect of urban leverage on housing prices in China.
Hypothesis 1 (H1).
Urban leverage is negatively associated with housing prices in China.
In the past two decades, housing prices grew very fast in the key cities in China, e.g., Beijing, Shanghai, Guangzhou, and Shenzhen (the first-tier cities) and the second-tier cities (Fang et al. 2016). These cities received greater pressure from the central government and were more likely to implement stringent housing policies to cool down the overheated housing market than the third- and fourth-tier cities (Li and Song 2016). The effect of housing-related regulation policies, such as an increase of interest rate, on housing prices was stronger in the first- and second-tier cities than in the third- and four-tier cities (Zhang et al. 2015; Wu and Bian 2018). As a result, house price in big cities should be more sensitive to government intervention. It is thus expected that the negative effect of urban leverage on housing price should be stronger in the first- and second-tier cities than in the third- and four-tier cities, because the credit growth would be restricted more in these cities if they have higher urban leverage.
Hypothesis 2 (H2).
The depressing effect of urban leverage on housing price is more pronounced in the first- and second-tier cities than in the third- and fourth-tier cities.
The last hypothesis examines whether the depressing effect of urban leverage on housing prices is amplified by housing purchase restrictions in some cities. Previous studies (e.g., Wu and Li 2018; Li et al. 2017) found that home purchase restriction significantly reduces housing prices in the largest cities in China. Cities with housing purchase restrictions implemented more stringent regulations to restrict the credit supply to home buyers than those without. For instance, in 2016, the central bank issued Notice on Issues Concerning the Adjustment of Personal Housing Loan Policies. The Notice required that in cities without purchase restrictions, the minimum down payment for the first house should not be lower than 25% and can be 20% for first-time buyers. For cities with purchase restrictions, the minimum down payment should not be lower than 30%. To prevent liquidity risk from real estate market, the credit supply should be restricted more by home purchase restrictions policies in the cities with higher urban leverage. The third hypothesis is given as:
Hypothesis 3 (H3).
The depressing effect of urban leverage on housing price is more pronounced during the periods of housing purchase restriction.
3. Materials and Methods
Different from previous studies that were based on the data of 35 capital cities or 70 big cities (Huang et al. 2015; Wu and Bian 2018), this study constructed a panel dataset of 236 prefecture-level (or above) Chinese cities. We collected housing price data and other city-level data from the CEIC China database. This sample includes 64 first- and second-tier cities and 172 third- and fourth-tier cities in China. Following prior studies (e.g., Fang et al. 2016) and the classifications by the National Bureau of Statistics of China, cities are divided into first- and second-tier cities, and third- and fourth-tier cities. There are four first-tier cities, i.e., Beijing, Shanghai, Guangzhou, and Shenzhen. The second-tier cities include provincial capitals, autonomous municipalities and other important cities in China. The remaining cities are classified as third- and fourth-tier cities. Our main results are robust if the second-tier cities contain only autonomous municipalities and provincial capitals. The sample period is from 2003 to 2019. The housing price is the annual average housing price calculated and reported by statistics departments of local governments. Following Lamont and Stein (1997), we create a variable LogPrice, which is the natural log of housing price in a city in a year. We define urban leverage as the loan-to-deposit ratio as a whole in a city following Van den End (2016). This definition is also consistent with the definition of the loan-to-deposit ratio in the banking industry. The higher the urban leverage in a city, the greater the liquidity risk.
To curb the rapid rise in housing prices and prevent risk, the central government had implemented two rounds of purchase restriction policies in 2010 and 2016 respectively. The data about purchase restriction policies were collected from official documents issued by local governments. Two dummy variables are created to capture the implementation of these two rounds of policies respectively. For the first round of housing price restrictions, the policy dummy (HPR) is equal to one from 2010 to 2014 in cities with purchase restriction policy, and 0 otherwise. Similarly, for the second round, the dummy of upgraded purchase restriction policy (UHPR) equals 1 for cities with restriction policies from 2016 to 2019, and 0 otherwise.
In addition to data on urban leverage and purchase restriction policy, our empirical analysis also relies on other city-level data that come from CEIC. Following Wang et al. (2011), Ding et al. (2017) and Fan et al. (2019), we selected control variables from the perspective of demand and supply, including annual residential completed area, annual mortgage rates, GDP per capita, registered population, and loan growth rate.
The variables and sources are summarized in Table 1.

Table 1.
Variable definitions and data sources.
Table 2 reports summary statistics. The minimum value of the log of annual housing price is 2.097 and the maximum is 4.746, corresponding to 125 yuan per square meter (the city of Fangchenggang in 2005) and 55,769 yuan per square meter (the city of Shenzhen in 2019). The standard deviation is 0.281 for the variable LogPrice, showing that housing prices in China vary widely in terms of geographical regions and time. The average urban leverage is 0.657. The average log of GDP per capita is 4.480, corresponding to 30,165 yuan. The total GDP across these 236 cities amounted to 59,928.76 billion yuan in 2017, which accounted for 80.29% of the total GDP across China. The mean value of POP is 3.540. The total registered population is 926.37 million for these 236 cities in 2016, accounting for 66.53% of China’s total registered population. The minimum and maximum values of LOANGR are −1117.04 and 70.85 respectively with a standard deviation of 25.916, meaning that the loan growth rate varies greatly from city to city in China.
Table 2.
Summary statistics of the variables.
The urban leverage level varies widely among different city groups. Figure 1 shows the change of urban leverage in first- and second-tier cities, third- and fourth-tier cities and the full sample of cities from 2003 to 2019 respectively.
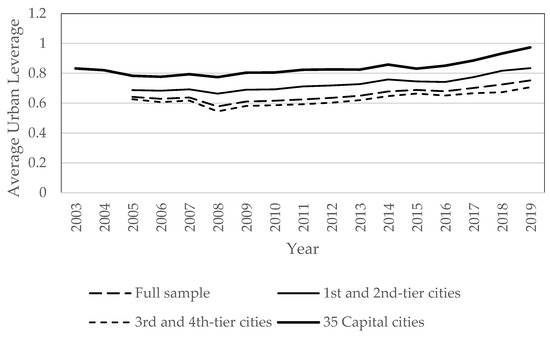
Figure 1.
Average urban leverage ratios from 2003 to 2019.
According to Figure 1, the average urban leverage level varies greatly in different city groups. The 35 major cities had largest urban leverage among different groups consistently over the sample period. The average urban leverage reached around 100% in 2019. The average urban leverage ratios in the first- and second-tier cities, which are usually more than 70%, are always higher than the average ratios in the third- and fourth-tier cities. Urban leverages in all cities increased in the past decade and urban leverage in big cities grew faster than that in small cities. As a result, the first and second-tier cities, especially capital cities, faced more liquidity risk than third and fourth-tier cities in China.
4. Results and Discussion
4.1. Housing Price and Urban Leverage
We started the empirical analysis by providing evidence on the impact of urban leverage on housing prices in 236 Chinese cities. Following previous studies (Wang et al. 2011; Huang et al. 2015; Fan et al. 2019), we adopted the following hedonic model to test the proposed hypotheses:
where LogPricei,t is the log of annual average housing price for a city i in year t; LEVi,t is urban leverage in the city i in year t; Xi,t is a vector of city-level controls including GDP per capita, annual residential completed area, mortgage rates, registered population, dummies for purchase restriction policy, and loan growth rate. City dummies and year dummies that capture city and year fixed effects are also included in the model. The model is estimated for the full sample to test the first hypothesis and separately for the subsamples of first- and second-tier cities, and third- and fourth-tier cities to test the second hypothesis. The key variable is the urban leverage. If β1 is significantly negative, it means urban leverage has a negative effect on housing price and the first hypothesis is confirmed. If the magnitude of the coefficient of urban leverage from the test using the subsample of first- and second-tier cities is larger than the magnitude from the subsample of third- and fourth-tier cities, the argument in the second hypothesis is supported.
LogPricei,t = α + β1 * LEVi,t + β2 * Xi,t + city dummies + year dummies + εi,t
Column (1) of Table 3 shows the results for the full sample of 236 cities. The coefficient of urban leverage is negative and but insignificant. Columns (2) and (3) separately show the results for 64 first-and second-tier cities and 172 third- and fourth-tier cities. Urban leverage exerts a depressing effect on housing prices in the large cities and while has positive effect on housing prices in the third- and fourth-tier cities: the coefficient on urban leverage variable is negative and highly significant in column 2 but positive in column 3. The results indicate that if urban leverage in a first- and second-tier city is increased by 50% (e.g., from 25% to 75%), there is a 3.75% reduction in housing price. The coefficient of urban leverage in column (1) is −0.075. For an increase of 50% in urban leverage, the change in housing price is: 50% * (−0.075) = −3.75%.
Table 3.
Urban leverage and housing price.
Urban leverage positively affects housing price in the third- and fourth-tie cities, probably because loan supply in the mortgage market pushes up the housing demand and while does not trigger rationing on the credit market. Considering that housing prices in the large cities are usually very high, this result is consistent with Li et al. (2020)’s findings that high leverage may exert a negative impact on housing prices in a high-price market. The results also confirm our second hypotheses.
The coefficients on control variables are consistent with previous studies. The residential completed area negatively affects housing price in the first- and second-tier cities, consistent with Yu (2010)’s finding that the area of housing sold and vacant housing has negative impacts on house prices in 35 major cities in China. The coefficients of GDP and POP are consistent with the findings in previous studies (e.g., Englund and Ioannides 1997; Wang et al. 2011; Fan et al. 2019) that GDP growth has a positive effect on housing prices; and while demographics do not have a significant effect on housing prices. The impact of housing purchase restriction on housing price is controversial in the previous studies. The results in Table 3 indicate that the first round of housing purchase restrictions generate an overall negative effect on housing price; and while housing price in the first- and second-tier cities increased during the period of the second round of restriction policies. The findings are consistent with some previous studies (Zou et al. 2014; Sun and Yu 2018) which found that purchase restriction policies may drive up housing price in China instead of depressing it.
4.2. Purchase Restriction and Urban Leverage
To control risk and maintain the stability of the housing market, the central government in China had implemented two rounds of purchase restriction policies in cities with high housing prices in 2010 and 2016 respectively. Restriction in the supply of mortgage loans and development loans is an important part of these policies. For example, in 2016, according to Notice on Issues Concerning the Adjustment of Personal Housing Loan Policies issued by the central bank, banks were required to: (1) independently determine the interest rate and down payment ratio based on the actual situation; (2) decide the specific down payment and interest rate based on local mortgage loan policies, risk prevention requirements and borrowers’ credit and repayment ability; and (3) The People’s Bank of China and the China Banking Regulatory Commission should strengthen the monitoring and evaluation of real estate loan asset quality, institutional robustness, and regional concentration.
If the hypothesis that urban leverage depresses housing prices by influencing credit supply in the high-price housing market is valid, the implementation of purchase restriction policies should amplify the depressing effect of urban leverage. The third hypothesis is tested by the following model:
where HPRi,t * LEVi,t is the interaction term of the dummy variable of first-round purchase restriction and urban leverage and UHPRi,t * LEVi,t is the interaction term of the dummy variable of second-round purchase restriction and urban leverage. We add these two interaction terms to the regression model to test how purchase restriction policies influence the effect of urban leverage on housing prices. Negative coefficients β9 and β8 indicate that purchase restriction can amplify urban leverage’s depressing effect. Control variables, city and year dummies in the model are the same as model 1.
Log(Pricei,t) = α + β1 * LEVi,t + β2 * HPRi,t + β3 * UHPRi,t + β9 * HPRi,t * LEVi,t + β8 * UHPRi,t * LEVi,t + β4 * Xi,t + city dummies + year dummies + εi,t
Table 4 reports the results. Column (1) of Table 4 shows that both rounds of housing purchase restrictions have amplified urban leverage’s depressing effect on housing prices. The coefficients on the interaction terms of urban leverage and purchase restriction dummies are negative and highly significant. Column (2) shows that urban leverage has a larger depressing effect in the first- and second-tier cities during the periods of housing purchase restrictions. Urban leverage does not generate a significantly negative impact on housing prices in third- and fourth-tier cities during the period of the first-round of housing purchase restriction. Note that there are no third- and fourth-tier cities that adopted the housing purchase restriction policy in the second round. The findings are consistent with previous results in Table 3 that the depressing effect of urban leverage on housing price is only significant in the first and second-tier cities in China. These results confirm the third hypothesis.
Table 4.
Housing purchase restrictions and the depressing effect of urban leverage on housing price.
5. Conclusions
This study examined the effect of urban leverage on housing prices in 236 cities in China. Urban leverage is closely related to liquidity risks in the local financial system in a city. Credit supply in a city with high urban leverage could be rationed due to large liquidity risk in the local market, which in turn affects housing demand. Consistent with this argument, we found that urban leverage has a depressing effect on housing prices in Chinese cities. This effect is strong in first-and second-tier cities but insignificant in the third- and fourth-tier cities, as liquidity risk due to urban leverage could be much larger in the first- and second-tier cities and the credit rationing is also more severe. The further analysis reveals that the depressing effect is amplified in the cities with housing purchase restrictions. Overall, this paper shows that a city’s aggregate leverage is an important determinant of housing price in China, especially when urban leverage could induce liquidity risk in the local financing system and invite policy intervention from the central government.
The central government have formulated a series of tightened monetary policies to prevent liquidity risk and such government intervention usually cooled down the housing market effectively. For example, in 2010, the central government tightened monetary policies by limiting loan issuance and restricting housing purchases to prevent liquidity risks resulting from the expansionary monetary policy that was adopted to mitigate the financial crisis in 2008. This round of government intervention depressed the growth of housing price effectively, slowing down the growth of housing price from 20% to nearly 7%. In 2016, to prevent the liquidity risk and systematic risk associated with the expansion of shadow banking, the central government strengthened macro-prudential regulations and tightened mortgage supply. However, the policy did not slow down the housing market as, in general, housing prices still increased in the cities with second round of housing purchase restrictions. Our analysis suggests that the housing purchase restriction policies, in both the first round and second round, can depress housing prices in the cities with larger urban leverage (and larger liquidity risk). In sum, the housing purchase policies can effectively curb the rising housing prices only when central government exerts pressure on local governments to prevent liquidity risk. The findings provide important policy implications for governments to control financial risk and stabilize housing price through policies to maintain a sustainable urban leverage in a city. Local governments should be aware of local liquidity risk by observing aggregate loan-to-deposit ratio of their cities. It also helps home buyers and investors to anticipate the potential effects of housing purchase restrictions on local housing prices. As the average loan-to-deposit ratio in recent years is close to 100% in the major cities in China, it is expected that central government will continue to exert pressures on local governments to mitigate liquidity risk, which could transmit into restrictive mortgage loan supply and a depressing effect on housing prices.
The findings in this study indicate that the depressing effect of urban leverage on housing prices is only significant in first- and second-tier cities where the urban leverage is higher. The impact of urban leverage on housing prices is even positive in cities with lower urban leverage. This suggests that it may be an optimal (sustainable) urban leverage for a city to prevent liquidity risk. Further studies are needed to explore the relationship between liquidity risk and urban leverage. To learn more about how housing prices respond to the government intervention, further research on the measurement of liquidity risk and the transmission mechanism of liquidity to housing market is needed.
Author Contributions
Conceptualization, W.L. and J.S.; Methodology, W.L. and J.S.; Software, W.L.; Validation, W.L. and J.S.; Formal analysis, W.L.; Investigation, W.L.; Resources, J.S.; Data curation, W.L.; Writing—original draft preparation, W.L.; Writing—review and editing, J.S.; Visualization, W.L.; Supervision, J.S.; Project administration, J.S.; Funding acquisition, J.S. All authors have read and agreed to the published version of the manuscript.
Funding
This research was funded by the Hong Kong Polytechnic University, grant numbers P0030199 and P0038209.
Data Availability Statement
Restrictions apply to the availability of these data. Data was obtained from the CEIC China and are available from Wanying Lu with the permission of the CEIC China.
Conflicts of Interest
The authors declare no conflict of interest.
References
- Adelino, Manuel, Antoinette Schoar, and Felipe Severino. 2012. Credit Supply and House Prices: Evidence from Mortgage Market Segmentation (No. w17832). Cambridge, MA: National Bureau of Economic Research. [Google Scholar] [CrossRef]
- Burdekin, Richard C. K., and Ran Tao. 2014. Chinese real estate market performance: Stock market linkages, liquidity pressures, and inflationary effects. Chinese Economy 47: 5–26. [Google Scholar] [CrossRef]
- Burdekin, Richard C. K., and Marc D. Weidenmier. 2015. Assessing the impact of the Chinese stimulus package at home and abroad: A damp squib? China Economic Review 33: 137–62. [Google Scholar] [CrossRef]
- Cao, Jerry, Bihong Huang, and Rose Neng Lai. 2015. On the Effectiveness of Housing Purchase Restriction Policy in China: A Difference in Difference Approach. Available online: https://ssrn.com/abstract=2584275 (accessed on 20 December 2021).
- Che, Xinwei, Bin Li, Kun Guo, and Jue Wang. 2011. Property prices and bank lending: Some evidence from China’s Regional Financial Centres. Procedia Computer Science 4: 1660–67. [Google Scholar] [CrossRef][Green Version]
- Chen, Zhuo, Zhiguo He, and Chun Liu. 2020. The financing of local government in China: Stimulus loan wanes and shadow banking waxes. Journal of Financial Economics 137: 42–71. [Google Scholar] [CrossRef]
- Claessens, Stijin, Swati R. Ghosh, and Roxana Mihet. 2013. Macro-prudential policies to mitigate financial system vulnerabilities. Journal of International Money and Finance 39: 153–85. [Google Scholar] [CrossRef]
- Cornett, Marcia Millon, Jamie McNutt, Strahan E. Philip, and Hassan Tehranian. 2011. Liquidity risk management and credit supply in the financial crisis. Journal of Financial Economics 101: 297–312. [Google Scholar] [CrossRef]
- Ding, Ding, Xiaoyu Huang, Tao Jin, and W. Raphael Lam. 2017. Assessing China’s Residential Real Estate Market. IMF Working Paper 17: 1. [Google Scholar] [CrossRef]
- Disalvo, James, and Ryan Johnston. 2017. The rise in loan-to-deposit ratios: Is 80 the new 60? Economic Insights 2: 18–23. [Google Scholar]
- Dobson, Wendy, and Anil K. Kashyap. 2006. The Contradiction in China’s Gradualist Banking Reforms. Hong Kong: Brookings Papers on Economic Activity, Economic Studies Program, The Brookings Institution, vol. 2006, pp. 103–62. [Google Scholar] [CrossRef]
- Drechsler, Itamar, Savov Alexi, and Schnabl Philipp. 2021. How monetary policy shaped the housing boom. Journal of Financial Economics. in press. [Google Scholar] [CrossRef]
- Du, Zaichao, and Lin Zhang. 2015. Home-purchase restriction, property tax and housing price in China: A counterfactual analysis. Journal of Econometrics 188: 558–68. [Google Scholar] [CrossRef]
- Duffy, David, McInerney Niall, and McQuinn Kieran. 2016. Macroprudential policy in a recovering property market: Too much too soon? International Journal of Housing Policy 16: 491–523. [Google Scholar] [CrossRef]
- Dursun-de Neef, H. Özlem. 2019. The transmission of bank liquidity shocks: Evidence from house prices. Review of Finance 23: 629–58. [Google Scholar] [CrossRef]
- Englund, Peter, and Yannis M. Ioannides. 1997. House price dynamics: An international empirical perspective. Journal of Housing Economics 6: 119–36. [Google Scholar] [CrossRef]
- Fan, Ying, Yang Zan, and Yavas Abdullah. 2019. Understanding real estate price dynamics: The case of housing prices in five major cities of China. Journal of Housing Economics 43: 37–55. [Google Scholar] [CrossRef]
- Fang, Hanming, Quanlin Gu, Wei Xiong, and Li An Zhou. 2016. Demystifying the Chinese housing boom. NBER Macroeconomics Annual 30: 105–66. [Google Scholar] [CrossRef]
- Favara, Giovanni, and Jean Imbs. 2015. Credit supply and the price of housing. American Economic Review 105: 958–92. [Google Scholar] [CrossRef]
- Huang, Daisy J., Charles K. Leung, and Baozhi Qu. 2015. Do bank loans and local amenities explain Chinese urban house prices? China Economic Review 34: 19–38. [Google Scholar] [CrossRef]
- Huang, Yi, Pagano Macro, and Panizza Ugo. 2020. Local crowding-out in China. The Journal of Finance 75: 2855–98. [Google Scholar] [CrossRef]
- Jo, Yonghwan, Kim Jihee, and Santos Francisco. 2022. The impact of liquidity risk in the Chinese banking system on the global commodity markets. Journal of Empirical Finance 66: 23–50. [Google Scholar] [CrossRef]
- Justiniano, Alejandro, Giorgio E. Primiceri, and Andrea Tambalotti. 2019. Credit supply and the housing boom. Journal of Political Economy 127: 1317–50. [Google Scholar] [CrossRef]
- Klingelhöfer, Jan, and Rongrong Sun. 2019. Macroprudential policy, central banks and financial stability: Evidence from China. Journal of International Money and Finance 93: 19–41. [Google Scholar] [CrossRef]
- Lamont, Owen, and Jeremy C. Stein. 1997. Leverage and house-price dynamics in U.S. cities. The Rand Journal of Economics 30: 498. [Google Scholar] [CrossRef]
- Li, Peng, and Shunfeng Song. 2016. What pushes up China’s urban housing price so high? The Chinese Economy 49: 128–41. [Google Scholar] [CrossRef]
- Li, Victor Jing, Cheng Andy, Wui Wing, and Cheong Tsun Se. 2017. Home purchase restriction and housing price: A distribution dynamics analysis. Regional Science and Urban Economics 67: 1–10. [Google Scholar] [CrossRef]
- Li, Yaoyao, Zhu Daolin, Zhao Jiangmeng, Zheng Xiaodong, and Zhang Lanyue. 2020. Effect of the housing purchase restriction policy on the Real Estate Market: Evidence from a typical suburb of Beijing, China. Land Use Policy 94: 104528. [Google Scholar] [CrossRef]
- McDonald, John F., and Houston H. Stokes. 2013. Monetary policy and the housing bubble. The Journal of Real Estate Finance and Economics 46: 437–51. [Google Scholar] [CrossRef]
- Atif, Mian, and Amir Sufi. 2022. Credit Supply and Housing Speculation. The Review of Financial Studies 35: 680–719. [Google Scholar] [CrossRef]
- Satria, Dadang, Cicilia A. Harun, and Anta Aditya Taruna. 2016. The macro-prudential aspects of loan-to-deposit-ratio-linked reserve requirement. Applied Economics 48: 24–34. [Google Scholar] [CrossRef]
- Shen, Jianfu, and Xianting Yin. 2016. Credit expansion, state ownership and capital structure of Chinese real estate companies. Journal of Property Investment & Finance 34: 263–75. [Google Scholar] [CrossRef]
- Shen, Jianfu, Michael Firth, and Winnie P. H. Poon. 2016. Credit expansion, corporate finance and overinvestment: Recent evidence from China. Pacific-Basin Finance Journal 39: 16–27. [Google Scholar] [CrossRef]
- Shen, Jianfu, Frederik Pretorius, and K. W. Chau. 2018. Land auctions with budget constraints. The Journal of Real Estate Finance and Economics 56: 443–71. [Google Scholar] [CrossRef]
- Sun, Bin-Yi, and Qian-Ni Yu. 2018. The mixed effect of interest rates and purchase restriction policies on house price fluctuation. Journal of East China Normal University (Humanities and Social Sciences) 50: 92. [Google Scholar]
- Tsai, I. Chun. 2013. The asymmetric impacts of monetary policy on housing prices: A viewpoint of housing price rigidity. Economic Modelling 31: 405–13. [Google Scholar] [CrossRef]
- Van den End, Jan Willem. 2016. A macroprudential approach to address liquidity risk with the loan-to-deposit ratio. The European Journal of Finance 22: 237–53. [Google Scholar] [CrossRef]
- Wang, Zhi, and Qinghua Zhang. 2014. Fundamental factors in the housing markets of China. Journal of Housing Economics 25: 53–61. [Google Scholar] [CrossRef]
- Wang, Songtao, Yang Zan, and Liu Hongyu. 2011. Impact of urban economic openness on real estate prices: Evidence from thirty-five cities in China. China Economic Review 22: 42–54. [Google Scholar] [CrossRef]
- Wu, Lili, and Yang Bian. 2018. Housing, consumption and monetary policy: How different are the first-, second-and third-tier cities in China? Applied Economics Letters 25: 1107–11. [Google Scholar] [CrossRef]
- Wu, Yi, and Yunong Li. 2018. Impact of government intervention in the housing market: Evidence from the housing purchase restriction policy in China. Applied Economics 50: 691–705. [Google Scholar] [CrossRef]
- Yu, Huayi. 2010. China’s house price: Affected by economic fundamentals or real estate policy? Frontiers of Economics in China 5: 25–51. [Google Scholar] [CrossRef]
- Zhang, Ling, Eddie Chi-man Hui, and Haizhen Wen. 2015. Housing price–volume dynamics under the regulation policy: Difference between Chinese coastal and inland cities. Habitat International 47: 29–40. [Google Scholar] [CrossRef]
- Zhou, Hui. 2015. Study on Chinese systemic risk prevention. In China’s Monetary Policy Regulation and Financial Risk Prevention. Berlin/Heidelberg: Springer. [Google Scholar] [CrossRef]
- Zou, L. H., Bo Gao, and F. J. Zhao. 2014. Housing speculation, price increase and the purchase restrictions: A natural experiment from China. Urban Development 6: 53–58. [Google Scholar]
Publisher’s Note: MDPI stays neutral with regard to jurisdictional claims in published maps and institutional affiliations. |
© 2022 by the authors. Licensee MDPI, Basel, Switzerland. This article is an open access article distributed under the terms and conditions of the Creative Commons Attribution (CC BY) license (https://creativecommons.org/licenses/by/4.0/).