
Lessons from Remarkable FinTech Companies for the Financial Inclusion in Peru


Abstract
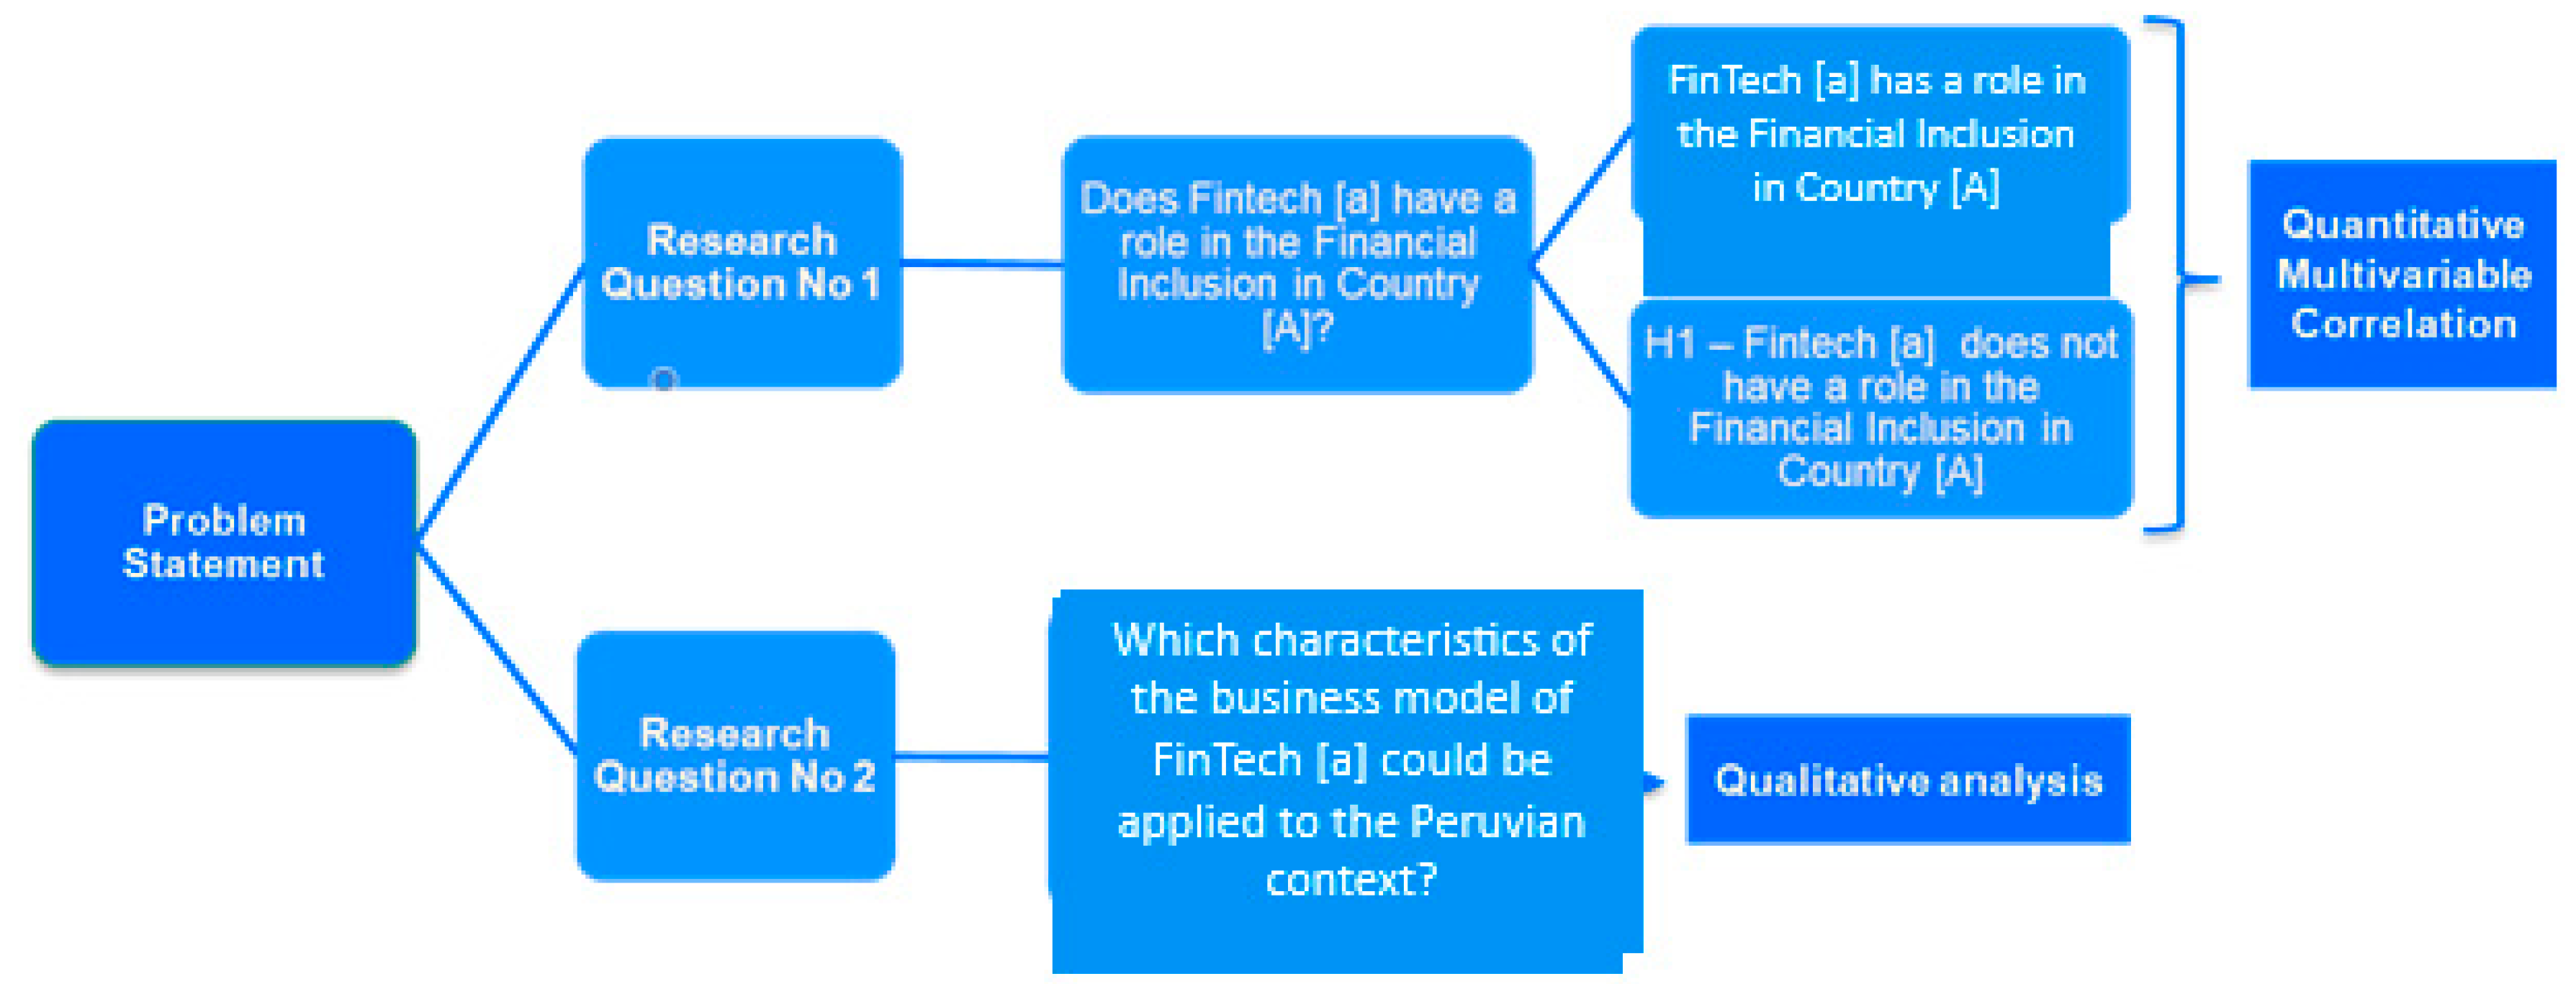
:1. Introduction
Problem Statement
2. Literature Review
- -
- Regulatory constraints: The national regulatory frameworks of states can disincentive the ability of financial providers to attract new clients due to higher costs or extra efforts that are not recuperable in the short term. Moreover, risk-averse regulation and its application can deny financial services to some population segments—for example, people from remote rural areas, migrants, and youth. Based on its work in 10 countries in Africa and Asia, CGAP has identified four building blocks for creating and enabling safe DFS regulatory frameworks (CGAP n.d.). The World Bank explored why account ownership varies widely among economies with similar income levels. The study found that account ownership and use of formal savings are higher in economies with more strict consumer protections. Formal saving is also correlated with policies that limit fees and tax incentives to foster financial inclusion (World Bank 2021c). Another research suggests that account owners’ use of savings is significantly related to consumer protection. At the same time, formal saving is also associated with regulations that cap account fees and tax incentives to promote financial inclusion (Klapper et al. 2021). Financial regulators can optimize linkages between four distinct policy objectives: financial inclusion (I), financial stability (S), financial integrity (I), and financial consumer protection (P) (or, collectively, “I-SIP”). The findings demonstrate that tradeoffs among the I-SIP objectives are not inevitable and that synergy is achievable. The study’s outcome (GPFI SSBs Conference 2021) suggests the need to consider the four I-SIP objectives collectively rather than independently, as is mostly the case so that linkages among them can be optimized. Based on the findings of the study in South Africa, the paper puts forth seven guidance statements to optimize the I-SIP linkage that may be helpful for both national-level policymakers and standard-setting bodies as they implement a financial inclusion plan that increases the chances of maximizing synergies and minimizing trade-offs (GPFI SSBs Conference 2021). Additionally, the question of how to craft a regulatory regime that expands access to financial services to the poor through the development of mobile phone financial services but is compliant with AML/CFT standards remains elusive for most governments. Specific AML/CFT regulations related to mobile money have not been issued in many jurisdictions, mainly due to the lack of awareness of the risks these services can pose if the proper controls are not in place. Due to the international standards for AML/CFT, the Financial Action Task Force’s 40 + 9 Recommendations were designed and issued well before mobile money technology and business models became prevalent; even developed countries have begun to face challenges with their regulation (Chatain et al. 2013).
- -
- Risks of mobile money: The abuse of mobile money could arise from four primary risk categories—anonymity, elusiveness, rapidity, and poor oversight. Poor oversight is an external risk factor potentially creating conditions that increase the likelihood of abuse stemming from the other three major risk categories. National authorities have prime responsibility for the quality of oversight. Low amounts of money, traceability, and the monitoring features of mobile money programs could make mobile money far less risky than other payment methods, particularly cash. Increasing evidence suggests that certain jurisdictions are implementing overly stringent risk mitigation techniques for money laundering and financing of terrorism, potentially increasing regulatory compliance costs among money providers and constraining financial inclusion objectives (Chatain et al. 2013).
- -
- Inclusion and integrity alignment: There is a noticeable trend of mandatory registration of users of prepaid SIM cards in Sub-Saharan Africa. More than 30 countries have started or are planning to register users of prepaid SIM cards. One immediate effect of registration is that the number of active cellular subscriptions drops due to disconnections. Moreover, penetration growth, measured as year-to-year changes in mobile cellular subscriptions per 100 inhabitants, is depressed due to increased paperwork. Customer identification can become, in particular, a constraint in countries with an insufficient identification infrastructure if no alternative methods for identification are allowed. The share of prepaid subscriptions out of total subscriptions is, on average, around 97 percent for the sampled countries. Therefore, the sheer size of the markets merits a preliminary analysis of the potential effects of mandatory registration (Jentzsch 2012).
- -
- Weak financial consumer protection: Financial services suppliers can attract customers and keep them in a cycle of credit that is too large to manage or too hard to repay.
- -
- Prohibitive market factors: Providers exclude sections of the population with some actions such as denying access to credit to those without credit records, charging high fees for basic transactions, designing terms and conditions to exclude, for example, the informal sector, and promoting marketing in favor to specific groups. These actions tend to exclude unprofitable or high-risk populations.
- -
- Geographical/physical barriers: Normally, people access financial services through physical locations. However, geographical and physical barriers such as remote rural and isolated areas and poor infrastructure make it impractical to provide branch services. This situation is that many potential customers are not served or underserved.
- -
- Infrastructure and connectivity barriers: The barriers are currently being reduced due to easy access to information technologies such as mobile telephones and computers. However, parts of the population are still excluded where electricity is unavailable and technology requires compatible products.
- -
- The financial vulnerability caused by personal circumstances: This includes issues such as lack of money or resources, no credit history, unemployment, lower-income or intermittent income, and others that discourage people from accessing financial products from the formal sector and giving a chance to informal moneylenders to operate, which increases the vulnerability of poor households and reduces the possibility of being involved in the traditional financial system.
- -
- Low levels of financial literacy: Studies show a relationship between financial literacy and financial inclusion. A lack of awareness, low confidence and trust, and insufficient knowledge create barriers and discourage people from accessing financial products.
- -
- Reduced social-technological inclusion: Some sectors of the population in some countries are isolated through different causes such as geographical barriers or inadequate infrastructure. However, despite mobile phones’ advantages, such as fast and easy access to a mobile bank account, these people may lack knowledge or familiarity with some technologies, such as the internet and mobile phone features. These issues are perceived as a barrier to financial inclusion.
- -
- Cultural and psychological barriers: Some population sectors can consciously decide to self-isolate from financial services due to personal, cultural, and religious beliefs. Additionally, barriers can be considered a lack of trust in the financial sector and the “outsiders.”
- -
- Linguistic or educational barriers: Attached to the lack of financial literacy, there are situations in which people speak a different language than the supplier’s language. Therefore, they are not familiar with the vocabulary used by the financial sector. Moreover, these communicational barriers can be exacerbated if these population sectors have lower general education levels, such as limited literacy and numeracy.
- -
- The environmental side refers to the macroeconomic context, geographical characteristics, vial and telecommunications infrastructure, and public policy.
- -
- The supply side refers to financial institutions’ objectives, priorities, characteristics, business models, products, and services offered.
- -
- The demand side refers to the access and use of financial services and macroeconomic indicators such as income level, employment rate, financial education, and similar factors.
3. Empirical Research
3.1. Methodology
- -
- RQ1: Does FinTech (a) have a role in financial inclusion in Country (A)?
- -
- RQ2: Which characteristics of the business model of FinTech (a) could be applied to the Peruvian context?
- -
- FinTech (a) can be either: M-PESA, Nubank, GCASH, or Easypaisa;
- -
- Country (A) can be either: Kenya, Brazil, the Philippines, or Pakistan.
3.2. Remarkable FinTechs in Selected Emerging Markets
3.2.1. M-PESA
3.2.2. Nubank
3.2.3. GCASH
3.2.4. Easypaisa
3.3. The Situation of Financial Inclusion in Selected Emerging Markets
3.3.1. Kenya
3.3.2. Brazil
3.3.3. The Philippines
3.3.4. Pakistan
3.4. Pearson Multivariable Correlation Analyses
3.4.1. M-PESA in Kenya
3.4.2. Nubank in Brazil
3.4.3. GCASH in the Philippines
3.4.4. Easypaisa in Pakistan
4. Discussion: Lessons for Peruvian Financial Inclusion
5. Conclusions
- The overall financial inclusion score of Kenya is above the average in the region and the group of lower-middle-income peers. The government and policy support, market stability and integrity, and consumer protection rules and infrastructure have an above-average score, indicating that this country’s financial inclusion environment is favorable. However, the dimension of products and outlets indicates challenges because the score obtained locates Kenya far under average peer countries in Sub-Saharan Africa and lower-middle-income countries. In 2020, during the COVID-19 crisis, the Central Bank of Kenya applied liquidity measures to financial institutions to support borrowers affected by the pandemic. Financial institutions could also extend and restructure loans for incapable borrowers to pay due to the pandemic. The Central Bank of Kenya introduced measures to increase the use of mobile money by removing transactions fees for transfers between mobile money accounts and bank accounts. The Kenyan government implemented money transfer programs through traditional bank accounts and M-PESA to alleviate the needs of households. These programs provided monthly financial help to around 1.1 million beneficiaries.
- Brazil has achieved an important number of account holders and debit cardholders. Nevertheless, the mobile money account, domestic remittances, and saving culture remains in a meager percentage. The high rate of people who own bank accounts and debit cards can be due to the integrated efforts of the Brazilian government, the Central Bank of Brazil, and stakeholders to promote financial inclusion in this country. These efforts were continued in 2019 by the Central Bank of Brazil, which launched a work plan focused on technological evolution to resolve structural problems in the financial system, competitiveness, transparency, and education. Mobile money accounts, savings, and remittances are not popular in this country, probably because of the lack of trust in the financial sector, lack of money, or lower financial literacy rates. The financial sector’s main problems in Brazil are the lack of bank branches and service points, especially in small rural areas, high documentation requirements to open bank accounts, high costs associated with bank accounts, and high-interest rates for credits. The response of the Brazilian government regarding the COVID-19 crisis was to increase liquidity in the financial system and a temporary relaxation of provisioning rules. The Central Bank opened a facility to provide loans to financial institutions, and the five largest banks in the country agreed to provide individuals and SMEs 60 day extension of debts. Likewise, the authorities offered temporary income support to vulnerable households, such as cash transfers to informal and low-income people. Brazil’s overall financial inclusion score is superior to the average in Latin American and Caribbean countries and the group of upper-middle-income countries. It could be said that this positive outcome in 2020 was due to efforts of the government, the Central Bank, and the financial sector of Brazil.
- The Central Bank of the Philippines (BSP) and the government are significant players creating regulations regarding financial inclusion. In 2009, the BSP created an electronic money ecosystem and efficient retail payments platform to allow banks to develop partnerships with e-money service providers such as telecommunication companies or become e-money issuers, either directly or through partnerships. In 2010, BSP enabled a regulatory environment to create a platform for electronic money and the expansion of financial access points through micro-banking offices, and in 2012 it was issued a regulation to ensure consumer protection. The indicators of financial inclusion in the Philippines are low. Account and debit card ownerships represent a higher percentage, showing progress through the years. However, the other indicators remain low. These results indicate an essential gap to provide suitable financial products and services to the population’s needs. Since 2016, a governmental institution has been created that guides and oversees the implementation of the National Strategy for Financial Inclusion, which places particular focus on digital financial inclusion and financial and digital literacy. However, an important issue was ensuring interoperability in retail payments because of the limited number of operators and the high transaction costs. The outlook of financial inclusion in the Philippines is promising since this country was recognized in 2016 as an ideal place for developing digital and financial products and services due to its large young population, positive annual GDP growth, fast-growing internet penetration, and mobile phone engagement. The creators Smart Money and GCASH approached this market in new ways. The overall financial inclusion score is higher than peers in East and South Asia and higher than in lower-middle-income countries. This outcome is a positive sign that the measures introduced by authorities since 2016 may have provided better governmental and policy support, stability to the financial system, and consumer protection rules. Therefore, the supply of products and services has increased, and this country’s overall financial inclusion situation has improved. However, there are still gaps to improve, especially regarding implementing adequate infrastructure to connect this country’s remote rural and low populated areas.
- In Pakistan, the financial inclusion indicators are shallow. Mobile account penetration remained extremely low despite the significant growth observed in mobile account activity. The challenge of expanding mobile money account users is linked to customer education on financial services. This indicator increased only 1% from 2014 to 2017, which means that the regulation implemented by the State Bank of Pakistan was not enough to encourage the market of mobile money services to develop further. In 2015, the Pakistani government established a National Financial Inclusion Strategy, which in 2018 was modified to place more emphasis on promoting digital payments to increase the number of digitized accounts. In addition, the State Bank of Pakistan (the Central Bank) implemented reforms in 2019 to allow non-banking entities to issue e-money directly. With this new regulation, mobile operators can provide further product innovations in digital finance. The COVID-19 pandemic hit this country’s economy due to lockdown measures to contain the spread of the virus. Therefore, the State Bank of Pakistan launched relief and stimulus measures to ensure adequate liquidity in the financial system, allowing Banks to defer the repayment of loans, and stimulating banks to keep lending small and medium enterprises to support the businesses in the country. Other measures introduced were promoting digital banking by waiving all fees for online transfers. To alleviate the most vulnerable population, the State Bank of Pakistan launched an emergency cash transfer program accessible after an online application and a confirmation received via SMS. The funds were targeted and delivered to female heads of households. The overall financial inclusion in Pakistan is above average among lower-middle-income countries and in the East and South Asia groups. The governmental policies and support and consumer protection environment have improved. The scores for the availability of products and outlets and the infrastructure that supports financial services and products are above average, indicating an improvement in comparison to lower indicators of financial inclusion.
Author Contributions
Funding
Informed Consent Statement
Data Availability Statement
Conflicts of Interest
Appendix A

| Peru | Kenya | Brazil | The Philippines | Pakistan | |
|---|---|---|---|---|---|
| Geographical conditions and population distribution | The coastal plain, high-rugged Andes, and Jungle Area: 496,225 sq miles 1/3 of the population lives along the desert coastal, especially in the capital city of Lima. The remote cities in the Andean highlands, the rainforests, and the jungle are sparsely populated. | Low plains rise to central highlands. Area: 224,961 sq miles The population is very concentrated in the west, the capital of Nairobi, and along the Indian Ocean coast. | The territory is mostly flat, but some rolling lowlands in the north, some plains, hills, mountains, and a narrow coastal belt. Area: 3 million sq miles The population lives along the Atlantic coast in the east, especially in the big cities of Sao Paolo, Brasilia, and Rio de Janeiro. | Archipelagic country, composed of islands, mountains, and extensive coastal lowlands Area: 115,831 sq miles The population is concentrated where good farmlands lie, principally in the north of the country, some islands, and Manila’s capital city. | The territory is divided into three major geographic areas, the northern highlands, the Indus River plain, and the Balochistan Plateau. Area: 339,697 sq miles The population is concentrated in the biggest cities, such as Karachi and Lahore. |
| Population (Ages 15 to 64 years) | 2011: 9.2 million 2014: 9.6 million 2017: 10.3 million 2020: 10.9 million | 2011: 23.7 million 2014: 26.1 million 2017: 28.8 million 2020: 31.7 million | 2011: 135.6 million 2014: 140.7 million 2017: 144.8 million 2020: 148.1 million | 2011: 59.3 million 2014: 63.1 million 2017: 66.8 million 2020: 70.6 million | 2011: 107.1 million 2014: 116 million 2017: 125.1 million 2020: 134.3 million |
| Mobile phone Subscriptions per 100 inhabitants in 2019 | 123.76. | 104.22 | 123.76 | 155.61 | 72.33 |
| The Rule of Law Index | 80th—0.5 score | 102nd—0.45 score | 67th—0.52 score | 91st—0.47 score | 120th—0.39 score |
| Financial literacy in 2015 | 28% of financial literacy. | 38% of financial literacy. | 35% of financial literacy. | 25% of financial literacy. | 26% of financial literacy. |
| Banking concentration in 2017 (World Bank, 2017) | 72.7% | 36.6% | 56.6% | 47.4% | 44.1% |
| Multiculturality | Mixed Amerindian, white, African descent, Chinese, and Japanese. Primary Languages: Spanish, Quechua, Aymara, Ashaninka, and others. | Bantu, Nilo-Saharan, Afro-Asiatic, and others. Main languages: English, Kiswahili, numerous indigenous languages | White, mulatto, black, Asian, indigenous. Main languages: Portuguese and a large number of minor Amerindian languages | More than seven ethnic groups dispersed in its territories. Main languages: Filipino, English, and many other languages. | Around seven different ethnic groups and their respective languages |
| The employment to population ratio is 2019 | 75.5% | 72.31% | 56.7% | 58.79% | 50.42% |
| Gross National Income per capita in 2020 | USD 6010 | USD 1760 | USD 7850 | USD 3430 | USD 1280 |
Appendix B
| M-PESA | Nubank | GCASH | Easypaisa | |
|---|---|---|---|---|
| Business objective | Deliver a simple, fast, safe, and easy method to move money across the country. | Provide a credit card service, 100% digital, without annuities and fees (cheap), fast and convenient. | Transform the user’s phone to a mobile account, safely, convenient, cheap | Empower people by providing timely, reliable, flexible, and easy methods of realizing mobile money transactions. |
| Strategy | Scaled installation of agents M-PESA users and non-users can make transactions. Active agents networking. Later partnership with the Kenyan Commercial Bank (KCB) | Customer services are automatized through a smartphone app, providing 100% digitalized services. Nubank reduces the costs of the personnel in charge of customers and can afford to offer no annuities or fees. | The company created a system involving retailers and users and no partnerships with banks initially. Financial institutions provided the logistics to keep money flowing in their system. In April 2021, CIMB Bank and GCASH partnered to expand digital banking services. | The partnership of Telenor and Tameer Microfinance Bank Reach low-cost deposits from the mass market to lower costs and increase profitability. Create innovative and suitable products to meet customer needs. |
| Target market | Bottom of pyramid approach. They are taking advantage of Safaricom’s large customers base. | In the beginning, Nubank targeted “millennials” under 36 years old. After popularity, the target is people of all ages and the unbanked. | Bottom of the pyramid, especially young urban consumers familiar with social media. | Bottom of the pyramid and urban population. |
| Marketing strategy | Customer education and aggressive advertisement through all channels and creating engagement with local culture Message: “send money home.” | The network effect of engaged customers. Creation of brand awareness through digital channels and gifting souvenirs in events Message: obtain financial control quickly. | Humor and colorful ads on TV, internet, and printed announces Message: a cheap, fast, accessible, and easy method to send remittances. | High-quality ads focus on customer education about the product. Message: reliable, easy, and convenient method to realize payments. |
| Revenue streams | Principally, mobile money transfers and payment services. The company had profit during COVID-19. | Interchange fees on every transaction made with the credit card, taxes over bills, and invoices not pated when due. | Fees are charged to deposits, withdraws, purchases, credit penalties, bill payments, bank accounts, and dormancy fees. | Transferences fees, bill payments, and mass disbursements. |
| Transactions | Withdrawals, Transferences, Deposits, registration, buying airtime, balance inquiry, and change of M-PESA PIN. | Purchases, transferences, bill payments, withdrawals, salary disbursements, online shopping, mobile credit recharges, and more. | Payments, transfers, withdrawals, mobile credit recharge, investment on funds, book movies, shop online, plant trees, and obtain insurance. | Payments, P2P transfers, mobile credit recharge credits, savings, remittances, salary disbursements, and savings products combined with insurances. |
| Main products | Wealth management, mobile banking, mobile wallet, credit, and insurances. | Digital bank, credit cards, personal loans, and insurances. | Investment funds, mobile wallets, insurances. | Mobile banking, various products, and insurances. |
| Users | In 2021: 28.21 million customers. In 2017: 27 million In 2014: 19.3 million In 2011: 13.8 million | In 2021: 40 million customers. In 2017: 3 million | In 2021: 33 million customers. In 2017: 5.1 million In 2014: 3 million In 2012: 1.3 million | In 2021: 30 million customers. In 2017: 19.9 Million In 2014: 6 Million In 2012: 2 Million |
| Technology applied | SIM Toolkit (STK) with SMS delivery for delivering mobile money transactions. Smartphone application. | Smartphone app Own software program and data science. Partnership with Ripple Net (Blockchain infrastructure) | SIM Toolkit with SMS usage. Smartphone app. | USSD mobile money option and at the agent transactions. Smartphone application. |
| Competitors | Airtel Money and T-Kash. | Banks: Caixa Econômica, Itaú Unibanco, Bradesco, and Santander. FinTechs: Digio, Neon, and Intermedium | Smart Money, Paymaya, Coins PH, GrabPay, etc. | Omni, Mobicash Timepey |
References
- Amidžić, Goran, Andre Massara, and Alexander Mialon. 2014. Assessing Countries’ Financial Inclusion Is Standing—A New Composite Index. International Monetary Fund. Working Paper. Available online: https://www.imf.org/external/pubs/ft/wp/2014/wp1436.pdf (accessed on 13 April 2021).
- Atkinson, Adele, and Flore-Anne Messy. 2013. Promoting Financial Inclusion through Financial Education: Oecd/Info Evidence, Policies, and Practice. OECD Publishing. OECD Working Papers on Finance, Insurance, and Private Pensions. Available online: https://www.wsbi-esbg.org/SiteCollectionDocuments/OECD%20Promoting%20financial%20inclusion%20through%20financial%20education.pdf (accessed on 13 July 2021).
- Banco Central do Brasil. 2021. Conglomerado prudencial e instituiçõnes independentes: Resumo. Banco Central do Brasil. Available online: https://www3.bcb.gov.br/ifdata/# (accessed on 28 July 2021).
- Bank for International Settlements. 2020. Payment Aspects of Financial Inclusion in the Fintech Era. World Bank. Bank for International Settlements. Committee on Payments and Market Infrastructures (CPMI). Available online: https://www.bis.org/cpmi/publ/d191.pdf (accessed on 28 July 2021).
- Barajas, Adolfo, Thorsten Beck, Mohamed Belhaj, and Sami Ben Naceur. 2020. Financial Inclusion: What Have We Learned So Far? What Do We Have to Learn? International Monetary Fund. Working Paper. Available online: https://www.google.com/url?sa=t&rct=j&q=&esrc=s&source=web&cd=&ved=2ahUKEwiCyu6_yc7tAhUGNOwKHRjrCoMQFjASegQIIBAC&url=https%3A%2F%2Fwww.imf.org%2F~%2Fmedia%2FFiles%2FPublications%2FWP%2F2020%2FEnglish%2Fwpiea2020157-print-pdf.ashx&usg=AOvVaw3UcfdNtM0iibhAbH_ni3Ji (accessed on 11 November 2020).
- BBC News. 2021. COVID: Why Has Peru Been So Badly Hit? [Press Release]. Available online: https://www.bbc.com/news/world-latin-america-53150808 (accessed on 11 June 2021).
- BMJ. 2021. COVID-19: Peru’s Official Death Toll Triples to Become the World’s Highest BMJ [Press Release]. Available online: https://www.bmj.com/content/373/bmj.n1442 (accessed on 11 June 2021).
- Braga, Carlos, Leif Sjöblom, and Howard Yu. 2013. Emerging Markets Perspectives. IMD Real-World Learning. Available online: https://www.imd.org/contentassets/0604e023b37a4193854b07a8fcb80c35/24.-emerging-markets-perspectives-27.06.13.pdf (accessed on 26 June 2021).
- Bull, Greta. 2018. Financial Inclusion: Is the Glass Half Empty or Half Full? (Pt 2). Available online: https://www.cgap.org/blog/financial-inclusion-glass-half-empty-or-half-full-pt-2 (accessed on 3 January 2022).
- Cámara, Noelia, and David Tuesta. 2014. Measuring Financial Inclusion: A Multidimensional Index: Working Paper. BBVA Research. Working Paper. Available online: https://www.bbvaresearch.com/wp-content/uploads/2014/09/WP14-26_Financial-Inclusion2.pdf (accessed on 14 April 2021).
- CGAP. 2011a. Global Standard-Setting Bodies and Financial Inclusion for the Poor: Proportionate Standards and Guidance. GPFI—Global Partnership for Financial Inclusion. Available online: https://www.cgap.org/sites/default/files/CGAP-White-Paper-Global-Standard-Setting-Bodies-Oct-2011.pdf (accessed on 1 May 2021).
- CGAP. 2011b. Marketing Branchless Banking: Examples from Around the World. [PowerPoint Slides]. Available online: https://www.ifc.org/wps/wcm/connect/52fb5786-a45a-4caf-8b38-25a9a64a31a0/Tool%2B3.7e.%2BCGAP%2BMarketing%2BBranchless%2BBanking%2B%285.2011%29.pdf?MOD=AJPERES&CVID=jlzQM7O (accessed on 20 July 2021).
- CGAP. n.d. Regulation for Inclusive Digital Finance. Available online: https://www.cgap.org/topics/collections/regulation-inclusive-digital-finance (accessed on 3 January 2022).
- Chatain, Pierre-Laurent, Andrew Zerzan, Wameek Noor, Najah Dannaoui, and Louis de Koker. 2013. Protecting Mobile Money against Financial Crimes. Available online: https://elibrary.worldbank.org/doi/abs/10.1596/978-0-8213-8669-9 (accessed on 3 January 2022).
- CIA.gov. 2021a. The World Factbook: Brazil. Available online: https://www.cia.gov/the-world-factbook/countries/brazil/#geography (accessed on 29 July 2021).
- CIA.gov. 2021b. The World Factbook: Kenya. Available online: https://www.cia.gov/the-world-factbook/countries/kenya/#geography (accessed on 29 July 2021).
- CIA.gov. 2021c. The World Factbook: Pakistan. Available online: https://www.cia.gov/the-world-factbook/countries/pakistan/#government (accessed on 29 July 2021).
- CIA.gov. 2021d. The World Factbook: Peru. Available online: https://www.cia.gov/the-world-factbook/countries/peru/#geography (accessed on 29 July 2021).
- CIA.gov. 2021e. The World Factbook: Philippines. Available online: https://www.cia.gov/the-world-factbook/countries/philippines/#geography (accessed on 29 July 2021).
- Claessens, Stijn. 2006. Access to Financial Services: A Review of the Issues and Public Policy Objectives. The World Bank Research Observer, Volume 21. Available online: https://www.researchgate.net/publication/5217978_Access_to_Financial_Services_A_Review_of_the_Issues_and_Public_Policy_Objectives (accessed on 1 May 2021).
- Dalberg. 2012. CGAP Landscape Study on International Remittances through Mobile Money: Final Report. CGAP. [PowerPoint Presentation]. Available online: https://www.gsma.com/mobilefordevelopment/wp-content/uploads/2012/06/2012landscapestudyoninternationalremittancesthroughmobilemoney.pdf (accessed on 13 June 2021).
- Damodaran, Akhil. 2013. Financial Inclusion: Issues and Challenges. AKGEC International Journal of Technology 4: 54–59. Available online: https://www.researchgate.net/publication/309194840_Financial_Inclusion_Issues_and_Challenges (accessed on 19 April 2021).
- de Koker, Louis, Nicholas Morris, and Sue Jaffer. 2020. Regulating Financial Services in an Era of Technological Disruption. Available online: https://journals.latrobe.edu.au/index.php/law-in-context/article/view/98/169 (accessed on 4 January 2022).
- Demirgüç-Kunt, Asli, Leora Klapper, Dorothe Singer, Saniya Ansar, and Jake Hess. 2018. The Global Findex Database 2017: Measuring Financial Inclusion and the Fintech Revolution. World Bank. Available online: https://openknowledge.worldbank.org/bitstream/handle/10986/29510/9781464812590.pdf (accessed on 25 June 2021).
- Easypaisa. 2021a. About Us. Available online: https://easypaisa.com.pk/about-easypaisa/#about_us_sec (accessed on 29 July 2021).
- Easypaisa. 2021b. Easypaisa Is a One-Stop-Shop for All Your Payment Needs: Products. Available online: https://easypaisa.com.pk/products-promotions/ (accessed on 29 July 2021).
- Economist Intelligence Unit. 2019. Global Microscope 2019: The Enabling Environment for Financial Inclusion. Available online: https://www.google.com/url?sa=t&rct=j&q=&esrc=s&source=web&cd=&ved=2ahUKEwjLxorSz5zwAhWh_rsIHVNsBM8QFjAGegQIBhAD&url=https%3A%2F%2Fidbinvest.org%2Fen%2Fdownload%2F8783&usg=AOvVaw17TjJmK2_kkIqvGmccJoEb (accessed on 26 April 2021).
- Economist Intelligence Unit. 2020. Global Microscope 2020: The Role of Financial Inclusion in the COVID-19 Response. Available online: https://idbinvest.org/en/download/11712 (accessed on 26 April 2021).
- Gates, Bill. 2015. 2015 Annual Letter: A Big Bet for 2030. [Blog]. Available online: https://www.gatesnotes.com/2015-annual-letter?page=3&lang=en&WT.mc_id=01_29_2015_AL2015-BG_FB_WorldBankingmap_Top_16&fbclid=IwAR0S3n2DFTWPKthi64lA93i66YJQsMKcoA0c6LWH1plLNeHQhL_pnjpvmFg (accessed on 20 July 2021).
- Ghosh, Saibal. 2016. How Important Is Mobile Telephony for Economic Growth? Evidence from MENA Countries. Info 18: 58–79. [Google Scholar] [CrossRef]
- GLOBE. 2014. 2014 Annual and Sustainability Report. Available online: https://www.globe.com.ph/content/dam/globe/brie/About-us/investor-relations/documents/Annual-and-Sustainability-Reports/GLO-2014-Annual-and-Sustainability-Report.pdf (accessed on 10 June 2021).
- GLOBE. 2017. Integrated Report 2017. Available online: https://www.globe.com.ph/content/dam/globe/brie/About-us/investor-relations/documents/Annual-and-Sustainability-Reports/GLO-2017-Integrated-Report.pdf (accessed on 10 June 2021).
- GLOBE. 2021. GCASH: Everything You Need to Know to Make Life Easier [Press Release]. Available online: https://www.globe.com.ph/go/technology/article/gcash-everything-you-need-to-know.html#gref (accessed on 28 July 2021).
- GPFI SSBs Conference. 2021. Financial Inclusion—A Pathway to Financial Stability? Understanding the Linkages. Available online: https://www.gpfi.org/publications/issues-paper-3-financial-inclusion-pathway-financial-stability-understanding-linkages (accessed on 3 January 2022).
- Hasnain, Sophia, Abigail Komu, and Christopher Blackburn. 2016. Mobile Money in the Philippines: Market Conditions Drive Innovation with Smart Money and GCASH. GSMA Association. Available online: https://www.gsma.com/mobilefordevelopment/programme/mobile-money/mobile-money-philippines-market-conditions-drive-innovation-smart-money-gcash-philippines-becoming-mobile-money-innovation-hub/?utm_medium=social-media&utm_campaign=mm230616&utm_source=twitt (accessed on 23 June 2021).
- International Finance Corporation. 2009. M-Money Channel Distribution Case—Kenya. Safaricom M-PESA. World Bank Group. Available online: https://www.ifc.org/wps/wcm/connect/e0d2a9bd-16b9-4a36-8498-0b2650b9af8b/Tool%2B6.7.%2BCase%2BStudy%2B-%2BM-PESA%2BKenya%2B.pdf?MOD=AJPERES&CVID=jkCVy-n (accessed on 9 December 2020).
- International Finance Corporation. 2011. Mobile Money Study 2011: Summary Report. Working Paper. Available online: https://openknowledge.worldbank.org/bitstream/handle/10986/21743/947350WP0Box380eMoneyReport0Summary.pdf?sequence=1&isAllowed=y (accessed on 20 June 2021).
- Jentzsch, Nicola. 2012. Implications of Mandatory Registration of Mobile Phone Users in Africa. DIW Discussion Papers, No. 1192. Berlin: Deutsches Institut für Wirtschaftsforschung (DIW). [Google Scholar]
- Johnson, Burke, and Larry Christensen. 2004. Educational Research: Quantitative, Qualitative, and Mixed Approaches, 5th ed. Thousand Oakes: Sage. [Google Scholar]
- Klapper, Leora, Annamaria Lusardi, and Peter Van Oudheusden. 2015. Financial Literacy Worldwide: Insights from the Standard & Poor’s Rating Services Global Financial Literacy Survey. International Bank for Reconstruction and Development & World Bank. Available online: https://gflec.org/wp-content/uploads/2015/11/3313-Finlit_Report_FINAL-5.11.16.pdf?x66755 (accessed on 28 July 2021).
- Klapper, Leora, Saniya Ansar, Jake Hess, and Dorothe Singer. 2021. Financial Inclusion and Financial Regulation. Available online: https://globalfindex.worldbank.org/sites/globalfindex/files/referpdf/FindexNote8_17.pdf (accessed on 3 January 2022).
- Macedo, Carlos, Marcelo Cintra, Steven Goncalves, and Nelson Catala. 2017. Future of Finance: Fintech’s Brazil Moment [Brazil’s Over-Branched Banking System Is Ripe for Disruption by New Entrants]. Goldman Sachs. Available online: https://www.gspublishing.com/content/research/en/reports/2017/05/12/f21e671e-dad0-4ef4-ba07-d694211b0c94.pdf (accessed on 28 July 2021).
- Malhotra, Naresh. 2010. Marketing Research: An Applied Orientation, 6th ed. Hoboken: Pearson/Prentice Hall. [Google Scholar]
- Mauree, V., and G. Kohli. 2013. The Mobile Money Revolution: Part 2: Financial Inclusion Enabler. ITU-T Technology Watch Report. Available online: https://www.itu.int/dms_pub/itu-t/oth/23/01/T23010000200002PDFE.pdf (accessed on 16 May 2021).
- McKay, Claudia, and Mark Pickens. 2010. Branchless Banking 2010: Who Is Served? At What Price? What Is? CGAP—Consultative Group to Assist the Poor. Focus Note. Available online: https://www.cgap.org/sites/default/files/researches/documents/CGAP-Focus-Note-Branchless-Banking-2010-Who-Is-Served-At-What-Price-What-Is-Next-Sep-2010.pdf (accessed on 5 July 2021).
- McKinsey Global Institute. 2018. Outperformers: High-Growth Emerging Economies and the Companies That Propel Them. McKinsey & Company. Available online: https://www.mckinsey.com/~/media/mckinsey/industries/public%20and%20social%20sector/our%20insights/outperformers%20high%20growth%20emerging%20economies%20and%20the%20companies%20that%20propel%20them/mgi-outperformers-in-brief-sep-2018.pdf (accessed on 26 July 2021).
- Mithe, Alaze. 2015. Mobile Financial Services for Microfinance Institutions: A Case Study of Easypaisa and Tameer in Pakistan. IFC and Swiss Confederation. Available online: https://documents1.worldbank.org/curated/en/852401500461391376/pdf/117452-WP-PK-Tool-11-3-Mobil-Finan-Serv-Tameer-in-Pakistan-1-29-15-Series-IFC-mobile-money-toolkit-PUBLIC.pdf (accessed on 29 July 2021).
- Moreno, Sandra, Madhu Vazirani, and Steven Lillis. 2015. Billion Reasons to Bank Inclusively. Accenture Banking. Available online: https://www.accenture.com/us-en/_acnmedia/Accenture/Conversion-Assets/DotCom/Documents/Global/PDF/Dualpub_22/Accenture-billion-reasons-bank-inclusively.pdf (accessed on 16 April 2021).
- Ngugi, Benjamin, Mathew Pelowski, and Javier Gordon Ogembo. 2010. M-PESA: A case study of the critical early adopters’ role in the rapid adoption of mobile money banking in Kenya. The Electronic Journal of Information Systems in Developing Countries 43: 1–16. Available online: https://doi.org/10.1002/j.1681-4835.2010.tb00307.x (accessed on 16 May 2021). [CrossRef]
- Nguyen, Thi Truc Huong. 2020. Measuring Financial Inclusion: A Composite Index for the Developing Countries. Journal of Economics and Development 23: 77–99. [Google Scholar] [CrossRef]
- Nubank. 2021. Homepage. Available online: https://nubank.com.br/en/ (accessed on 1 July 2021).
- Omar, Mohamed Abdullah, and Kazuo Inaba. 2020. Does financial inclusion reduce poverty and income inequality in developing countries? A panel data analysis. Journal of Economic Structures 9: 1–25. [Google Scholar] [CrossRef]
- Pearce, Douglas, and Claudia Ruiz Ortega. 2012. Financial Inclusion Strategies: Reference Framework (English). World Bank Group. Working Paper. Available online: http://documents1.worldbank.org/curated/en/801151468152092070/pdf/787610WP0P144500use0only0900A9RD899.pdf (accessed on 1 June 2021).
- Pinar Ardic, Oya, Maximilien Heiman, and Nataliya Mylenko. 2011. A Cross-Country Analysis with a New Data Set Can Access Financial Services Worldwide and the Financial Inclusion Agenda—The World Bank. Working Paper. Available online: https://www.cgap.org/sites/default/files/CGAP-Access-to-Financial-Services-and-the-Financial-Inclusion-Agenda-around-the-World-Jan-2011.pdf (accessed on 11 April 2021).
- Rojas-Suarez, Liliana, and Veronica Gonzales. 2010. Access to Financial Services in Emerging Powers: Facts, Obstacles, and Policy Implications. OECD. Background Paper. Available online: https://www.oecd.org/dev/pgd/45965165.pdf (accessed on 22 April 2021).
- S&P Global Market Intelligence. 2020. Financial Inclusion Would Have Helped Contain Coronavirus, BCP Manager Says [Press Release]. Available online: https://www.spglobal.com/marketintelligence/en/news-insights/latest-news-headlines/financial-inclusion-would-have-helped-contain-coronavirus-bcp-manager-says-60808067 (accessed on 20 October 2020).
- Safaricom PLC. 2020. Annual Report 2020. Available online: https://www.safaricom.co.ke/images/Downloads/Safaricom_AR2020_bookmarked_ONLINE_29_07_2020.pdf (accessed on 20 June 2021).
- Safaricom PLC. 2021. Annual Report and Financial Statements 2021. Available online: https://www.safaricom.co.ke/images/Downloads/2021_Annual_Report_Single_Spread_Final.pdf (accessed on 28 June 2021).
- Safaricom. 2011. Group Annual Report & Accounts. Available online: https://www.safaricom.co.ke/images/Downloads/Annual_Reports/2011_Annual_Report_FINAL.pdf (accessed on 8 June 2021).
- Safaricom. 2014. Annual Report 2014. Available online: https://www.safaricom.co.ke/images/Downloads/Resources_Downloads/annual_report-2014.pdf (accessed on 10 June 2021).
- Safaricom. 2017. Safaricom Annual Report and Financial Statements 2017. Available online: https://www.safaricom.co.ke/images/Downloads/Resources_Downloads/Safaricom_2017_Annual_Report.pdf (accessed on 12 June 2021).
- Safaricom. 2021. M-PESA Rates. Available online: https://www.safaricom.co.ke/personal/m-pesa/getting-started/m-pesa-rates (accessed on 15 June 2021).
- Scharwatt, Claire, Arunjay Katakam, Jennifer Frydrych, Alix Murphy, and Nika Naghavi. 2014. State of the Industry: Mobile Financial Services for the Unbanked. GSMA’s Mobile Money for the Unbanked (MMU). Available online: https://www.gsma.com/mobilefordevelopment/wp-content/uploads/2015/03/SOTIR_2014.pdf (accessed on 30 April 2021).
- Sirota, Fabio, and Gustavo Fratini. 2018. A Case about Nubank: The Story of an Innovative Fintech in Brazil. Master’s thesis, Politecnico di Milano, Milano, Italy. Available online: https://www.politesi.polimi.it/bitstream/10589/149606/1/Final%20Thesis.pdf (accessed on 10 July 2020).
- Sotomayor, Narda, Jacqueline Talledo, and Sara Wong. 2018. Determinants of Financial Inclusion in Peru: Recent Evidence from the Demand Side. Superintendencia de Banca y Seguros. SBS Working Paper. Available online: https://www.sbs.gob.pe/Portals/0/jer/DDT_ANO2018/DT-001-2018%20(eng).pdf (accessed on 19 July 2021).
- Statista. 2021. Number of Customers of Fintech Company Nubank in Brazil from 2016 to 2021 (in Millions). Available online: https://www.statista.com/statistics/882274/brazil-number-customers-nubank/ (accessed on 29 July 2021).
- Stein, Peer, Bikki Randhawa, and Nina Bilandzic. 2011. Toward Universal Access: Addressing the Global Challenge of Financial Inclusion. International Finance Corporation and World Bank. Working Paper. Available online: https://www.gpfi.org/sites/gpfi/files/documents/Toward%20Universal%20Access_0.pdf (accessed on 22 April 2021).
- Telenor Microfinance Bank. 2017. 2017 Annual Report. Available online: https://telenorbank.pk/wp-content/uploads/2020/03/Annual_report_web_2017.pdf (accessed on 14 July 2021).
- The Guardian. 2021. Peru Has the World’s Worst per Capita COVID Toll after Death Data Revised [Press Release]. Lima. Available online: https://www.theguardian.com/world/2021/jun/01/peru-has-worlds-worst-per-capita-covid-toll-after-death-data-revised (accessed on 11 June 2021).
- The World Justice Project. 2020. Rule of Law Index. Available online: https://worldjusticeproject.org/rule-of-law-index/global/2020 (accessed on 28 June 2021).
- UNCDF. n.d. Financial Inclusion and the SDGs. Available online: https://www.uncdf.org/financial-inclusion-and-the-sdgs (accessed on 3 January 2022).
- United Nations—UNSGSA. 2010. Annual Report to the Secretary-General. Available online: https://www.unsgsa.org/sites/default/files/resources-files/2020-09/UNSGSA_AR.pdf (accessed on 1 May 2021).
- United Nations—UNSGSA. 2017. Financial Inclusion Transforming Lives: Annual Report to the Secretary-General. United Nations Secretary-General’s Special Advocate for Inclusive Finance Development (UNSGSA). Available online: https://responsiblefinanceforum.org/wp-content/uploads/2017/10/UNSGSA_report_2017-final.pdf (accessed on 15 May 2021).
- Wishart, Neville. 2006. Micro-Payment Systems and Their Application to Mobile Networks. World Bank Group. Working Paper. Available online: https://documents1.worldbank.org/curated/en/886371468160779311/pdf/352950infoDev1m1Commerce01PUBLIC1.pdf (accessed on 15 July 2021).
- World Bank. 2016. Brazil—Systematic Country Diagnostic. World Bank. Available online: https://documents.worldbank.org/en/publication/documents-reports/documentdetail/239741467991959045/brazil-systematic-country-diagnostic-retaking-the-path-to-inclusion-growth-and-sustainability (accessed on 1 August 2021).
- World Bank. 2020a. Employment to Population Ratio, 15+, Total (%) (Modeled ILO Estimate)—Peru, Kenya, Philippines, Pakistan, Brazil. Available online: https://data.worldbank.org/indicator/SL.EMP.TOTL.SP.ZS?end=2020&locations=PE-KE-PH-PK-BR&start=2010 (accessed on 28 July 2021).
- World Bank. 2020b. Islamic Republic of Pakistan: Leveling the Playing Field: Systematic Country Diagnostic. World Bank. Available online: https://openknowledge.worldbank.org/bitstream/handle/10986/34549/Pakistan-Systematic-Country-Diagnostic-Leveling-the-Playing-Field.pdf?sequence=4&isAllowed=y (accessed on 3 August 2021).
- World Bank. 2020c. Kenya—Systematic Country Diagnostic. World Bank. Available online: https://documents.worldbank.org/en/publication/documents-reports/documentdetail/919181490109288624/peru-systematic-country-diagnostic (accessed on 4 August 2021).
- World Bank. 2020d. Population Ages 15–64, Total—Peru, Kenya, Brazil, Philippines, Pakistan. Available online: https://data.worldbank.org/indicator/SP.POP.1564.TO?end=2020&locations=PE-KE-BR-PH-PK&start=2006 (accessed on 29 July 2021).
- World Bank. 2021a. Overview of the Philippines. World Bank. Available online: https://www.worldbank.org/en/country/philippines/overview (accessed on 6 August 2021).
- World Bank. 2021b. The World Bank in Peru. Available online: https://www.worldbank.org/en/country/peru/overview (accessed on 7 August 2021).
- The World Bank. 2021. Regulations Help Explain Variations in Financial Inclusion. Available online: https://blogs.worldbank.org/allaboutfinance/regulations-help-explain-variations-financial-inclusion (accessed on 3 January 2022).
| Characteristic | Situation |
|---|---|
| Geographical conditions and population distribution | Peru has a western coastal plain (costa), high and rugged Andes in the center (Sierra), eastern lowland jungle of Amazon Basin (Jungle). Area: 496,225 sq. miles. Approximately one-third of the population lives along the desert coastal, focusing on Lima’s capital city. The remote cities in the Andean highlands, the rainforests, and the jungle are sparsely populated (CIA.gov 2021d). |
| Population | The adult population in Peru (ages 15 to 64) in 2020 was roughly 10.9 million. In 2011, 2014, and 2017 the population was 9.2, 9.6, and 10.3 million inhabitants, respectively (World Bank 2020b). |
| Mobile phone penetration | By 2019, the subscriptions per 100 inhabitants were 123.76 (CIA.gov 2021d). |
| The rule of law | According to the Rule of Law index, Peru is ranked in the 80th position out of 128 countries, and its score is 0.5, which means law enforcement and institutions are weak and there are corruption problems in the government (The World Justice Project 2020). |
| Financial literacy | In 2015, a survey found that 28% of the Peruvian population was financially literate (The World Justice Project 2020). |
| Banking concentration | In 2017, 72% of the market was concentrated in a few banks (World Bank 2021b). |
| Multiculturality | Ethnic groups: mixed Amerindian and white (60.2%), Amerindians (25.8%), White (5.9%), African descent (3.6%), Chinese and Japanese descent (1.2%), and unspecified (3.3%) (CIA.gov 2021d). Official Languages: Spanish (82.9%), Quechua (13.6%), Aymara (1.6%), Ashaninka 0.3%, and others (CIA.gov 2021d). |
| Employment to population ratio | In 2019, the pre-pandemic year, the employment rate in Peru was 75.5% (World Bank 2021b). |
| Gross National Income per capita | In 2020, the GNI per capita was USD 6010 (World Bank 2021b). |
| Indicator | 2011 | 2014 | 2017 |
|---|---|---|---|
| Account ownership (% age 15+): | 20% | 29% | 43% |
| Mobile money account (% age 15+) | - | 0% | 3% |
| Sent or received domestic remittances through a mobile phone (% age 15+) | - | 0% | 2% |
| Credit card ownership (% age 15+) | 10% | 12% | 12% |
| Debit card ownership (% age 15+) | 14% | 21% | 28% |
| Saved at a Financial Institution (% age 15+) | 9% | 12% | 8% |
| Key Characteristics | Analysis |
|---|---|
| Business objective | According to the IFC, M-PESA delivers a simple, fast, safe, and easy method to move money across the country. Their main message was the simple phrase “send money home,” which immediately engaged Kenyans (International Finance Corporation 2009). |
| Strategy | M-PESA carefully planned several agents according to customers and transactions to achieve its value proposition. In the beginning, registered customers were enabled to send money to non-registered users with an extra fee paid by the first ones. This entire strategy created viral registration and active and committed agent networking. However, M-PESA had to sign up a deal with the Kenyan Commercial Bank (KCB) to keep money flowing in agent-to-agent transactions. This improvement improved the availability of M-PESA in the market (International Finance Corporation 2009). |
| Target market | The early tactic of M-PESA to gain customers was targeting the poor through a bottom of pyramid approach and taking advantage of Safaricom’s market share and their large customers base for rapid growth in the country (Ngugi et al. 2010). |
| Marketing strategy | The marketing strategy focused on customer education and aggressive advertisement of their products and services by television, radio, and social media. The strategy also engages local culture through a catchy advertising jingle and nationalistic branding (International Finance Corporation 2009). |
| Revenue streams | According to the Annual Report of Safaricom 2020, the revenue stream of M-PESA consists basically of mobile money transfers and payment services. This daughter company contributes 33.6% of Safaricom’s revenue (McKay and Pickens 2010). In the previous years before the pandemic, M-PESA’s revenue is continuously growing despite the COVID-19 crisis. The revenue in 2020 was EUR 655.32 million (84,438 million Kenyan Shillings) (Safaricom PLC 2020). |
| Transactions | M-PESA has increased its number of transactions in recent years. When the product was launched, the transactions were deposit cash, withdraw cash (registered or non-registered users), and commission per M-PESA customer registration (International Finance Corporation 2009). Currently, according to Safaricom (Safaricom PLC 2020), the transactions with a charged fee are withdrawal from M-PESA agent, transfer to unregistered users, transfer to other M-PESA users, and transfer to other mobile money users. Other free-of-charge transactions are deposits, M-PESA registration, buying airtime through M-PESA, M-PESA balance inquiry, and change of M-PESA PIN (Safaricom 2021). As an example of one transaction cost of this company, a withdrawal from an M-PESA agent is free of charge when the amount is between (in Kshs) 1 and 49 (0.0078–EUR 0.38). Nonetheless, when the amount is between 100 to 500 (0.77–EUR 3.87), the charges to M-PESA are 27 (EUR 0.21). Then the costs for this company increase accordingly to the withdrawn amount. The highest possible withdrawal is between 50,001 and 150,000 (EUR 388.2–1164.57), and the charge is 300 (EUR 2.33) (CGAP 2011b). |
| Main products | Safaricom’s financial products through M-PESA offers are all based on mobile money solutions for wealth management, banking, credit, and insurance products. These products are as follows (Safaricom PLC 2021):
|
| Users | According to the Annual Report of 2021 of Safaricom, M-PESA has 28.21 million customers (Safaricom PLC 2021). In 2011, 2014, and 2017, the registered users of this company were 13.8 million, 19.3 million, and 27 million (Safaricom 2011, 2014, 2017). |
| Technology applied | Safaricom chose the SIM Toolkit (STK) technology with SMS delivery for delivering mobile money transactions. With STK, the user has an application on the mobile phone’s SIM card accessed from the phone’s menu. This technology offers high levels of security and usability but does need the SIM card to be changed. Therefore, Safaricom provides help for users in this process International Finance Corporation (2009). |
| Competitors | M-PESA was a pioneer mobile money service that began without competitors, and due to its dynamic services and products approach, it is the leading mobile money provider. By 2020 the main competitors were Airtel Money and T-Cash. |
| Key Characteristics | Analysis |
|---|---|
| Business objective | The principal value proposition of Nubank is to provide a credit card service, 100% digital, without annuities and fees from their clients, totally manageable by the user on their mobile application, while providing a personalized, friendly, and agile service. It has to be highlighted that one of the essential points of this value proposition is the approach of a 100% digital bank feature of Nubank because it reduces the physical contact with the company and also reduces enormous costs for the company since it does not have personnel handling costumes (Sirota and Fratini 2018). Nubank’s characteristics are their cheap, fast, and convenient products. |
| Strategy | Nubank proposes “end any complexity and return the financial control” to their users. By changing the relationship between people and how people treat their money, FinTech offers a different approach to banking. It aims to solve the most common problems that the Brazilian user has while dealing with banks and their finances, related to the complexity of the Financial Sector and the lack of transparency (Sirota and Fratini 2018). |
| Target market | The original target group that Nubank tried to reach was upper-class “millennials” and young professionals. People under 36 years old are born in a digital era and are used to being in contact with technology and sophisticated smartphones (Macedo et al. 2017). However, after the service became popular, the customer base expanded to different ages and lower-income classes with lower or no access to credit cards. Nubank presented a cheap option to facilitate access to credit cards (Nubank 2021). |
| Marketing strategy | Nubank employed considerable efforts in its marketing strategy because the main channel of marketing disclosure was through digital tools. They rapidly took advantage of every chance of spreading their services in a friendly, relaxed, personalized manner, providing quick and effective solutions. Therefore, this approach generated a positive marketing effect, reaching more customers, motivated by the network effect and marketing promotions to “accelerate their friends” to join Nubank’s services. In this manner, it could be said that Nubank’s marketing strategy relies on its brand awareness, digital marketing friendly approach, and the network effect of customers. Nubank also used traditional methods on special Brazilian festive days by gifting souvenirs and encouraging them to present them on social networks, spreading the brand using people’s networks for that purpose (Nubank 2021). |
| Revenue streams | As previously explained, the main benefit of Nubank is the lack of fees. However, there are two primary revenue streams: the interchange fees on every transaction made with the credit card and taxes over bills and invoices, which are not pated when due. There are minor sources of income, such as the subscription from “Nubank Rewards.” At the beginning of 2021, it is recently known that Nubank reported EUR 1.1 million (6.8 million reals) of revenue for the first time (Banco Central do Brasil 2021). |
| Transactions | Nubank is today a digital bank and not only a credit card provider. Therefore, it will not be possible in this section to cover all transactions. However, the transactions that represent an essential revenue stream are the interest on credit card debts that are not paid on time. For example, if the client is a good creditor, the rate could be 4%. If not, it could be up to 13%. Nevertheless, the average practice by the company is 7.75%. The competitors apply an average rate of 8%, which is relatively high compared to other countries (Statista 2021). Furthermore, transactions paid in US dollars will be changed in the domestic currency according to the exchange rate fixed by the Brazilian Central Bank plus four percent of each transaction (Banco Central do Brasil 2021). Consequently, if a purchase of USD 100 is made, Nubank will gain four percent of the conversion rate, which by the 24th of August with an exchange rate of BRL 5.3680 is BRL 21.47 (USD 3.9) (Banco Central do Brasil 2021). |
| Main products | In 2021, this digital bank expanded services for people and businesses, offering a digital bank account, instant payment solutions, remittances services, credit cards, personal loans, and insurances (Nubank 2021). Furthermore, due to this company’s rapid expansion, the partnership with Ripple, a blockchain company, has recently announced the collaboration for their international remittance services. |
| Users | The growth of Nubank in terms of the customer base is continuously increasing. In June of 2021, Nubank registered 40 million customers. In 2014, the company did not have customers yet, but in 2017, Nubank reported 3 million customers (Statista 2021). |
| Technology applied | Nubank developed a smartphone app that allows customers to apply for a card, activate it, block and unblock it, manage and pay their bills, increase and decrease their credit limits, and see their purchase information in real-time. Another essential technology developed by Nubank is an advanced data science infrastructure to process and make decisions about card applications. |
| Competitors | Brazil has a highly concentrated traditional banking sector. In 2016, 82% of the market was controlled by only five players: Caixa Econômica, Itaú Unibanco, Bradesco and Santander. Furthermore, in the last years, other FinTechs such as Digio, Neon, and Intermedium came to the market, offering similar products to Nubank (Nubank 2021). |
| Key Characteristics | Analysis |
|---|---|
| Business objective | The value proposition of GCASH is to transform the user’s phone to a mobile account for realizing diverse transactions through prepaid credit, facilitating the user’s self-management to fulfill their needs safely and affordably. Therefore, the main benefits for customers are safety, convenience, and low cost (Wishart 2006). |
| Strategy | Globe, in the beginning, did not have partnerships with banks. The operation and maintenance are performed through a clearinghouse facility in charge of all transactions and arrangements between retailers and GCASH customers. Globe’s business bank oversaw the money liquidity management, which did not know about individual users’ activities. Additionally, retailers maintain a balance in the system, used as the float for transactions with GCASH customers (Wishart 2006). Therefore, there is a clear strategy of delivering their value proposition between the system created by the company, involving retailers and users. Financial institutions provided the logistics to keep money flowing in their approach. In April of 2021, GCASH partnered with CIMB Bank to expand digital banking services (S&P Global Market Intelligence 2020). |
| Target market | The target market was to focus at the bottom of the pyramid, especially young urban consumers familiar with social media (GPFI SSBs Conference 2021). |
| Marketing strategy | GCASH used different channels such as TV, internet, printed announces, and in-site campaigns to reach more customers. The message mainly focused on cheap, fast, and easy methods to send remittances. Furthermore, the company used humor, celebrities, colorful outfits, and cool ads to make the brand accessible to everyone (CGAP 2011b). |
| Revenue streams. | The company registers revenue streams from fees charged to many types of transactions realized between registered users and retailers (Safaricom 2014). According to Globe Telecom, GCASH in 2020 generated EUR 20.09 million (1184.85 million Philippine peso) (GLOBE 2021). |
| Transactions. | GCASH, in the beginning, facilitated transactions such as all kinds of payments, transfers, withdrawals, buy load (prepaid credit), and mobile wallets (Safaricom 2011). Thanks to technological advancements, the company can realize more transactions such as bank transfers, investment in funds, booking movies, obtaining credits, shopping online from local and international online stores, in-store at GCASH merchants, saving money, planting trees, etc. insurance (GLOBE 2021). As an example of a transaction using GCASH, the cost of taking cash-out is 2% of the transaction if it is made through an agent point. If someone withdraws PHP 200 Phillippine pesos (EUR 3.39), the transaction cost will be PHP 4 (EUR 0.068). Whereas if the same transaction is made via ATM, the cost will be between PHP 10 to PHP 18 (EUR 0.17–0.31) (GLOBE 2021). |
| Main products | The main products are as follows (GLOBE 2021):
|
| Users. | In June of 2021, Globe reported that GCASH has 33 million users and over 73,000 partner merchants in the Philippines (Safaricom 2017). In 2012, 2014, and 2017, GCASH registered 1.3 million, 3 million, and 5.1 million users (Dalberg 2012; GLOBE 2014; GLOBE 2017). |
| Technology applied | In the beginning, Globe launched GCASH with the technology known as SMS SKT (SIM Toolkit technology) because in the Philippines was recognized the high levels of SMS usage. Therefore, users could realize transactions through SMS or SIM-based menus and encryption. With this approach, Globe emulated a banking network without having a banking partner (Wishart 2006). However, now GCASH conducts its other products through a mobile app (Mauree and Kohli 2013). |
| Competitors | In the Philippines, there exist two leading mobile money providers: Smart Money, the very first company that launched mobile money solutions in 2001, and GCASH, which expanded better than the competition (Hasnain et al. 2016). |
| Key Characteristics | Analysis |
|---|---|
| Business objective | This company was initially launched as a money transfer service, which empowers underserved masses by providing convenience, trust, and freedom to their lives by facilitating various mobile money services. Easypaisa operates as a branchless banking service facilitating their customers’ financial transactions through convenient and fast digitalized financial services (Easypaisa 2021a). |
| Strategy | Easypaisa is a product created by the partnership of Telenor and Tameer Microfinance Bank. Each company oversaw the different tasks in the value chain of this product. Telenor operated the system in the agents’ network, and Tameer was the core of the banking system, which was highly regulated. Easypaisa focuses on reaching low-cost deposits from the mass market to lower costs and increase profitability. Another strategy is to expand their product portfolio by introducing more innovative and suitable savings products to address customer needs while reducing capital costs—for example, insurances, credits, and enabling savings in gold (Mithe 2015). |
| Target market | The target market for the mobile wallet was urban users and people who already had bank accounts. However, the ads and promotions considered a more comprehensive range of users in the initial OTC (over-the-counter) transactions (Easypaisa 2021b). |
| Marketing strategy | The company invested millions of dollars in marketing and produced high-quality advertisements. For the launch of Easypaisa, Telenor focused on promoting and establishing the brand as a company that wants to make people’s life easier. In the campaigns, they invested in education by explaining the functionality of the OTC products and then mobile wallets. Easypaisa established awareness and trust in the new brand through video and print ads with educative messages, explaining that their services provide solutions to payments efficiently and conveniently (CGAP 2011a). |
| Revenue streams | Revenue is generated from different sources: customers (for transfer transactions), utility companies (bill payments), and corporate clients (mass disbursements) (Mithe 2015). |
| Transactions | In 2013, the principal transactions enabled by Easypaisa were as follows: diverse types of payments, P2P transfers, increased air time credits, and saving money (Mauree and Kohli 2013). Nonetheless, by 2015, more transactions were enabled, such as domestic and international remittances, salary disbursements, and savings products combined with insurances (Mithe 2015). As an example of the costs of one type of transaction, with withdrawal from an Easypaisa agent (in PKR) is between 1 and 200 (EUR 0.0052–1.04), the charge for the company will be 7 (EUR 0.36). Nonetheless, when the amount is between 500 to 1000 (EUR 2.56–5.12), the charges for Easypaisa are 20 (EUR 0.1). Then the charges for this company increase accordingly to the withdrawn amount. The highest possible withdrawal is between 40,001 and 50,000 (EUR 207.32–259.15), and the charge is 690 (EUR 3.58) (Easypaisa 2021b). |
| Main products | According to Easypaisa, the current products are mobile banking, various products, and insurances (Easypaisa 2021b). |
| Users | According to Easypaisa’s Annual Report, in 2019, the company registered 30 million customers with a country-wide branch network and over 150 thousand agents. Telenor continues to be a leader in FinTech in Pakistan (S&P Global Market Intelligence 2020). In 2012, 2014, and 2017, Easypaisa registered 2 million, 6 million, and 19.9 million users (Dalberg 2012; GLOBE 2014; GLOBE 2017). |
| Technology applied | The technology used by Easypaisa at the beginning was the USSD mobile money option and at the agent transactions. Later, internet and smartphone applications were enabled (Mithe 2015; Mauree and Kohli 2013). For the smartphone applications, the leading technologies used were a private cloud, real-time screening for customers onboarding on Easypaisa mobile account, business intelligence analysis, cashless service, a DDoS functionality for protection against cyber-attacks, and others (Telenor Microfinance Bank 2017). |
| Competitors | The years after the launch of Easypaisa, other mobile money operators entered the market. These companies joined in alliance with different banks and provided various banking services. The principal competitors are Omni and Mobicash Timepey (Mithe 2015). |
| Indicator | Definition |
|---|---|
| Account ownership (% age 15+): | It is defined as owning an account either at a formal financial institution or through a mobile money provider not linked to a financial institution (Demirgüç-Kunt et al. 2018). |
| Mobile money account (% age 15+) | It is limited to services that can be used without an account at a financial institution. This indicator measures the percentage of people who used a mobile money service in the past 12 months (Demirgüç-Kunt et al. 2018). |
| Sent or received domestic remittances through a mobile phone (% age 15+) | Refers to the percentage of people who reported sending to or receiving money from a relative friend in the same country through a mobile phone in the past 12 months (Demirgüç-Kunt et al. 2018). |
| Credit card ownership (% age 15+) | Refers to the percentage of people who reported having a credit card. This is an important indicator because a credit card is a payment instrument and a source of credit. It is believed that the introduction of credit cards might have affected the demand for and use of short-term credit (Demirgüç-Kunt et al. 2018). |
| Debit card ownership (% age 15+) | Debit cards are used to make direct payments and withdraw money. This definition refers to the percentage of people who reported having a debit card (Demirgüç-Kunt et al. 2018). |
| Saved at a Financial Institution (% age 15+) | This concept refers to the percentage of people who reported saving or setting aside money at a bank or another financial institution in the past 12 months. This indicator is important to measure the savings because having an account does not imply formal savings (Demirgüç-Kunt et al. 2018). |
| Characteristic | Situation |
|---|---|
| Geographical conditions and population distribution | Kenya has low plains rising to central highlands bisected by the Great Rift Valley and a fertile plateau in the west. Area: 224,961 sq. miles. The population in Kenya is very concentrated in the west along the shore of Lake Victoria, the capital of Nairobi, and along the Indian Ocean coast (CIA.gov 2021b). |
| Population | The population of Kenya between 15 and 64 years was, in the years 2011, 2014, and 2017, 23.7, 26.1, and 28.8 million inhabitants, respectively. In 2020, the population was 31.7 million (World Bank 2020c). |
| Infrastructure available (mobile phone penetration) | By 2019, the mobile phone subscriptions per 100 inhabitants were 104.22 (CIA.gov 2021b). |
| The rule of law | According to the Rule of Law index, Kenya is ranked in the 102nd position out of 128 countries, and its score is 0.45, which means law enforcement and the institutions are weak and that there are corruption problems in this country (The World Justice Project 2020). |
| Financial literacy | In 2015, a survey found that 38% of the Kenyan population was financially literate Klapper et al. 2015). |
| Banking concentration | In 2017, 36.6% of the market was concentrated in a few banks (World Bank 2020c). |
| Multiculturality | The principal ethnic groups are Bantu, Nilo-Saharan, Afro-Asiatic, and others. The main languages spoken in this country are English, Kiswahili, and numerous indigenous languages. In Kenya, there is religious diversity (CIA.gov 2021b). |
| Employment to population ratio | In 2019, the pre-pandemic year, the employment rate in Kenya was 72.31% (World Bank 2020c). |
| Gross National Income per capita | In 2020 the GNI per capita was USD 1760 (World Bank 2020c). |
| Indicator | 2011 | 2014 | 2017 |
|---|---|---|---|
| Account ownership (% age 15+): | 42% | 75% | 82% |
| Mobile money account (% age 15+) | - | 58% | 73% |
| Sent or received domestic remittances through a mobile phone (% age 15+) | - | 64% | 63% |
| Credit card ownership (% age 15+) | 6% | 5% | 6% |
| Debit card ownership (% age 15+) | 30% | 35% | 38% |
| Saved at a Financial Institution (% age 15+) | 23% | 30% | 27% |
| Characteristic | Situation |
|---|---|
| Geographical conditions and population distribution | The territory of Brazil is primarily flat, but there are some rolling lowlands in the north, some plains, hills, mountains, and a narrow coastal belt. Area: 3 million sq. miles. Most of the population lives along the Atlantic coast in the east, mainly in Sao Paolo, Brasilia, and Rio de Janeiro (CIA.gov 2021a). |
| Population | The adult population in Brazil (ages 15 to 64) in 2020 was roughly 148.1 million. In 2011, 2014, and 2017, the population was 135.6, 140.7, and 144.8 million inhabitants, respectively (World Bank 2016). |
| Infrastructure available (mobile phone penetration) | By 2019, the subscriptions per 100 inhabitants were 123.76 (CIA.gov 2021a). |
| The rule of law | According to the Rule of Law index, Brazil is ranked in the 67th position out of 128 countries, and its score is 0.52, which means the law enforcement and the institutions are weak and that there are corruption problems in the government (The World Justice Project 2020). |
| Financial literacy | In 2015, a survey found that 35% of the Brazilian population was financially literate (World Bank 2016). |
| Banking concentration | In 2017, 56.6% of the market was concentrated in a few banks (World Bank 2020a). |
| Multiculturality | The ethnic groups living in Brazil are white 47.7%, mulatto 43.1% (mixed white and black), black 7.6%, Asian 1.1%, and indigenous 0.4%. The most widely spoken language is Portuguese. However, there are many minor Amerindian languages (CIA.gov 2021a). |
| Employment to population ratio | In 2019, the pre-pandemic year, the employment rate in Brazil was 56.7% (World Bank 2020a). |
| Gross National Income per capita | In 2020 the GNI per capita was USD 7850 (World Bank 2021a). |
| Indicator | 2011 | 2014 | 2017 |
|---|---|---|---|
| Account ownership (% age 15+): | 56% | 68% | 70% |
| Mobile money account (% age 15+) | - | 1% | 5% |
| Sent or received domestic remittances through a mobile phone (% age 15+) | - | 0% | 1% |
| Credit card ownership (% age 15+) | 29% | 32% | 27% |
| Debit card ownership (% age 15+) | 41% | 59% | 59% |
| Saved at a Financial Institution (% age 15+) | 10% | 12% | 14% |
| Characteristic | Situation |
|---|---|
| Geographical conditions and population distribution | The Philippines is an archipelagic country composed of islands, mountains, and extensive coastal lowlands. Area: 115,831 sq. miles. The population in this country is concentrated where good farmlands lie, principally in the north of the country (Luzon), some islands, and in the capital city, Manila, where one-eighth of the entire national population resides (CIA.gov 2021e). |
| Population | The adult population in the Philippines (ages 15 to 64) in 2020 was roughly 70.6 million. In 2011, 2014, and 2017, the population was 59.3, 63.1, and 66.8 million inhabitants, respectively (World Bank 2021a). |
| Infrastructure available (mobile phone penetration) | By 2019, the subscriptions per 100 inhabitants were 155.61 (CIA.gov 2021e). |
| The rule of law | According to the Rule of Law index, the Philippines is ranked in the 91st position out of 128 countries, and its score is 0.47, which means that law enforcement and the institutions are weak and that there are corruption problems in the government (The World Justice Project 2020). |
| Financial literacy | In 2015, a survey found that 25% of the population was financially literate (Klapper et al. 2015). |
| Banking concentration | In 2017, 47.4% of the market was concentrated in a few banks (World Bank 2021a). |
| Multiculturality | This country is culturally very diverse. There are more than seven ethnic groups dispersed in its territories. Therefore, there are many languages and dialects as well. Nevertheless, the official language is Filipino and English (CIA.gov 2021e). |
| Employment to population ratio | In 2019, the pre-pandemic year, the employment rate in the Philippines was 58.79% (World Bank 2021a). |
| Gross National Income per capita | In 2020, the GNI per capita was USD 3430 (World Bank 2021a). |
| Indicator | 2011 | 2014 | 2017 |
|---|---|---|---|
| Account ownership (% age 15+): | 27% | 31% | 34% |
| Mobile money account (% age 15+) | - | 4% | 5% |
| Sent or received domestic remittances through a mobile phone (% age 15+) | - | 6% | 5% |
| Credit card ownership (% age 15+) | 3% | 3% | 2% |
| Debit card ownership (% age 15+) | 13% | 20% | 21% |
| Saved at a Financial Institution (% age 15+) | 15% | 15% | 12% |
| Characteristic | Situation |
|---|---|
| Geographical conditions and population distribution | The territory of this country is divided into three major geographic areas, the northern highlands, the Indus River plain in the center and east, and the Balochistan Plateau in the south and west. Area: 339,697 sq. miles. The population in this country is concentrated in the largest cities, such as Karachi and Lahore (CIA.gov 2021c). |
| Population | The adult population in Pakistan (ages 15 to 64) in 2020 was roughly 134.3 million. In 2011, 2014, and 2017, the population was 107.1, 116, and 125.1 million inhabitants, respectively (World Bank 2020b). |
| Infrastructure available (mobile phone penetration) | By 2019, the subscriptions per 100 inhabitants were 72.33 (CIA.gov 2021c). |
| The rule of law | According to the Rule of Law index, Pakistan is ranked in the 120th position out of 128 countries. Its score is 0.39, which means law enforcement and institutions are feeble, and this country has serious corruption problems (The World Justice Project 2020). |
| Financial literacy | In 2015, 26% of the Pakistani population was financially literate (World Bank 2020b). |
| Banking concentration | In 2017, 44.1% of the market was concentrated in a few banks (World Bank 2020b). |
| Multiculturality | Pakistan is a very diverse country. There are around seven different ethnic groups and languages in the same region (CIA.gov 2021c). |
| Employment to population ratio | In 2019, the pre-pandemic year, the employment rate in Pakistan was 50.42% (World Bank 2020b). |
| Gross National Income per capita | In 2020, the GNI per capita was USD 1280 (World Bank 2020b). |
| Indicator | 2011 | 2014 | 2017 |
|---|---|---|---|
| Account ownership (% age 15+): | 10% | 13% | 21% |
| Mobile money account (% age 15+) | 6% | 7% | |
| Sent or received domestic remittances through a mobile phone (% age 15+) | 1% | 5% | |
| Credit card ownership (% age 15+) | 1% | 0% | 1% |
| Debit card ownership (% age 15+) | 3% | 3% | 8% |
| Saved at a Financial Institution (% age 15+) | 1% | 3% | 6% |
| Independent Variable | The Population of Country (A) and User of FinTech (a) |
|---|---|
| Dependent variables |
|
| Users of Fintech (a) in Country (A) | 2011 | 2014 | 2017 |
|---|---|---|---|
| M-PESA Customers (million) | 13.8 | 19.3 | 27.0 |
| The population of Kenya above 15 years (million) | 23.7 | 26.2 | 28.8 |
| The population of Kenya as M-PESA users above 15 years (%) | 58.23 | 73.66 | 93.75 |
| The Population of Kenya as M-PESA Users above 15 Years | |
|---|---|
| The population of Kenya as M-PESA users above 15 years | 1.00 |
| Account (% age 15+) | 0.91 |
| Mobile money account (% age 15+) | 0.92 |
| Sent or received domestic remittances through a mobile phone (% age 15+) | 0.82 |
| Credit card ownership (% age 15+) | −0.19 |
| Debit card ownership (% age 15+) | 0.98 |
| Saved at a financial institution (% age 15+) | 0.44 |
| Users of Fintech (a) in Country (A) | 2011 | 2014 | 2017 |
|---|---|---|---|
| Nubank Customers (million) | 0.0 | 0.0 | 3.0 |
| The population of Brazil above 15 years (million) | 135.6 | 140.6 | 144.8 |
| The population of Brazil as Nubank users above 15 years (%) | 0.00 | 0.00 | 2.07 |
| The Population of Brazil as Nubank Users above 15 Years | |
|---|---|
| The population of Brazil as Nubank users above 15 years | 1.00 |
| Mobile money account (% age 15+) | 0.99 |
| Credit card ownership (% age 15+) | −0.83 |
| Indicators | 2015 | 2016 | 2017 | 2018 | 2019 | 2020 |
|---|---|---|---|---|---|---|
| The population of Brazil as Nubank users above 15 years (%) | 0.3 | 0.9 | 2.0 | 4.0 | 7.0 | 17.0 |
| Credit operations (12-month %) change households | −10.6 | −12.4 | 11.0 | 17.7 | 21.5 | 9.0 |
| The Population of Brazil as Nubank Users above 15 Years (%) | |
|---|---|
| The population of Brazil as Nubank users above 15 years (%) | 1.00 |
| Credit operations (12-month %) change households | 0.44 |
| Users of Fintech (a) in Country (A) | 2011 | 2014 | 2017 |
|---|---|---|---|
| GCASHCustomers (million) | 1.3 | 3.0 | 5.1 |
| The population of the Philippines above 15 years (million) | 59.4 | 63.2 | 66.9 |
| The population of the Philippines as GCASH users above 15 years (%) | 2.19 | 4.75 | 7.62 |
| The Population of the Philippines as GCASH Users above 15 Years | |
|---|---|
| The population of the Philippines as GCASH users above 15 years | 1.00 |
| Account (% age 15+) | 0.99 |
| Mobile money account (% age 15+) | 0.88 |
| Sent or received domestic remittances through a mobile phone (% age 15+) | 0.79 |
| Credit card ownership (% age 15+) | −0.87 |
| Debit card ownership (% age 15+) | 0.88 |
| Saved at a financial institution (% age 15+) | −0.87 |
| Users of Fintech (a) in Country (A) | 2011 | 2014 | 2017 |
|---|---|---|---|
| Easypaisa Customers (million) | 2.0 | 6.0 | 19.9 |
| The population of Pakistan above 15 years (million) | 107.1 | 116.1 | 125.2 |
| The population of Pakistan as Easypaisa users above 15 years (%) | 1.87 | 5.17 | 15.89 |
| The Population of Pakistan as Easypaisa Users above 15 Years | |
|---|---|
| The population of Pakistan as Easypaisa users above 15 years | 1.0000 |
| Account (% age 15+) | 0.9999 |
| Mobile money account (% age 15+) | 0.7819 |
| Sent or received domestic remittances through a mobile phone (% age 15+) | 0.9981 |
| Credit card ownership (% age 15+) | 0.5695 |
| Debit card ownership (% age 15+) | 0.9769 |
| Saved at a financial institution (% age 15+) | 0.9846 |
| M-PESA | CASH | EASYPAISA | |
|---|---|---|---|
| Withdrawal amount | (KES) 100–500 (EUR) 0.77–3.87 | (PHP) 200 (EUR) 3.39 | (PKR) 500–1000 (EUR) 2.56–5.12 |
| Charge | (KES) 27 (EUR) 0.21 | (PHP) 4 (EUR) 0.068 | (PKR) 20 (EUR) 0.1 |
Publisher’s Note: MDPI stays neutral with regard to jurisdictional claims in published maps and institutional affiliations. |
© 2022 by the authors. Licensee MDPI, Basel, Switzerland. This article is an open access article distributed under the terms and conditions of the Creative Commons Attribution (CC BY) license (https://creativecommons.org/licenses/by/4.0/).
Share and Cite
Velazquez, P.V.; Bobek, V.; Vide, R.K.; Horvat, T. Lessons from Remarkable FinTech Companies for the Financial Inclusion in Peru. J. Risk Financial Manag. 2022, 15, 62. https://doi.org/10.3390/jrfm15020062
Velazquez PV, Bobek V, Vide RK, Horvat T. Lessons from Remarkable FinTech Companies for the Financial Inclusion in Peru. Journal of Risk and Financial Management. 2022; 15(2):62. https://doi.org/10.3390/jrfm15020062
Chicago/Turabian StyleVelazquez, Patricia Vilcanqui, Vito Bobek, Romana Korez Vide, and Tatjana Horvat. 2022. "Lessons from Remarkable FinTech Companies for the Financial Inclusion in Peru" Journal of Risk and Financial Management 15, no. 2: 62. https://doi.org/10.3390/jrfm15020062
APA StyleVelazquez, P. V., Bobek, V., Vide, R. K., & Horvat, T. (2022). Lessons from Remarkable FinTech Companies for the Financial Inclusion in Peru. Journal of Risk and Financial Management, 15(2), 62. https://doi.org/10.3390/jrfm15020062