Abstract
This article aims to forecast the information trends related to the most popular cyberattacks, seen as the cyber-crimes’ consequences reflecting on the Internet. The study database was formed based on online users’ search engine requests regarding the terms “Cyberattacks on the computer systems of a financial institution”, “Cyberattacks on the network infrastructure of a financial institution”, and “Cyberattacks on the cloud infra-structure of a financial institution”, obtained with Google Trends for the period from 16 April 2017 to 4 October 2022. The authors examined the data using the Z-score, the QS test, and the method of differences of average levels. The data were found to be non-stationary with outliers and a seasonal component, so exponential smoothing was applied to reduce fluctuations and clarify the trends. As a result, the authors built additive and multiplicative cyclical and trend-cyclical models with linear, exponential, and damped trends. According to the models’ quality evaluation, the best results were shown by the trend-cyclic additive models with an exponential trend for predicting cyberattacks on computer systems and the cloud infrastructure and a trend-cyclic additive model with a damped tendency for predicting cyberattacks on the network infrastructure. The obtained results indicate that the U.S. can expect cybercrimes in the country’s financial system in the short and medium term and develop appropriate countermeasures of a financial institution to reduce potential financial losses.
1. Introduction
Over the past two decades, the Fourth Industrial Revolution has rapidly increased information and communication technologies and actively implemented them in different areas of society worldwide. On the one hand, this has facilitated and promoted positive trends, such as the digital transformation of business, the development of the Internet of Things, the sharing economy, the virtualization of IT infrastructure, 3D marketing, the emergence and use of cryptocurrencies, blockchains, artificial intelligence, I-tracking, etc. (Kwilinski 2019; Miskiewicz 2020; Bezpartochna and Trushkina 2021; Kuzior and Sira 2022). On the other hand, the computerized and digitalized processes have resulted in such negative phenomena as cybercrime, simultaneously accompanied by an increase in digital literacy and a decreased cost for technology to commit cybercrimes. For example, it costs $1 to install malicious software on the dark web marketplace, while anyone’s personal data can be obtained for only USD 3 (Vojinovic 2022). In other words, anyone can become a cybercriminal or gain access to any sensitive data for a small price.
The relevance of cybercrime and cyberfraud is evidenced by other statistics, which show a dynamic growth of its negative consequences in recent years. For example, the average cost of a cyber incident worldwide in 2022 was USD 4.35 million, an increase of about 24.29% compared to 2014 (USD 3.5 million) (IBM 2022a). The most affected sectors are Healthcare (USD 10.1 million), Financial (USD 5.97 million), Pharma (USD 5.01 million), Technology (USD 4.97 million), Energy (USD 4.72 million), Services (USD 4.7 million), and Industrial (USD 4.47 million) (IBM 2022b).
The financial sector is ahead of all other sectors in its exposure to these risks, and not only in terms of economic losses from cyber incidents. This industry is also in second place regarding the volume of cyberattacks. It accounts for 22.4% of all attacks among all other sectors. At the same time, 70% of attacks are aimed at banks, 16% at insurance companies, and 14% at other financial organizations (IBM Security 2022). If we compare the average cost of cybercrime, it is 40% higher for companies in the financial services sector than for companies in other spheres (The Actuary 2019). Banking experts put cyber risks and data protection first, among other threats. A total of 75% of respondents from European banks consider it the most severe operational risk. Fully 82% of respondents who are professional analysts also single it out along with geopolitical risk among all other threats. (EBA 2022). In the consulting company Deloitte’s report, the financial services provider notes, “The financial sector has always been exposed to cyber-attacks, and it is not only about stealing our clients’ money, but also about doing damage just to do damage.” (Deloitte 2021). That is, the financial sphere is the most targeted industry for cyber criminals and is one of the most vulnerable to cybercrime.
How can cybercrime be countered? Global IT companies are engaged in developing appropriate solutions for the protection of cyber-information and computer infrastructure, contributing to the formation of the relevant cyber protection market. In 2022, revenue from cyber solutions and cyber services is expected to be USD 159.84 billion, an increase of 14.88% over the level in 2021 and 91.68% above that in 2014 (Statista Research Department 2022). Meanwhile, the cybersecurity market is projected to grow by 86.87% to USD 298.7 billion (Statista Research Department 2022). Experts estimate that the cyber incident insurance market will also continue to grow. It reached USD 4 billion in 2018, USD 9 billion in 2020, and is projected to reach USD 20 billion in 2025 (Insurance Insider 2018). Regarding the financial sector, financial institutions are the largest investors in the cybersecurity industry, investing much more than companies in other fields (Jones 2021). They can spend 6 to 10% of the IT budget on such matters annually (Deloitte Insights 2019). For large banks, this figure can reach significant amounts. For example, Brian Moynihan, CEO of Bank of America, has stated that the bank’s cybersecurity spending has recently reached over $1 billion per year (Bursztynsky 2021). That is, the growth of cybercrime risks requires more and more severe capital investments from the financial sector, which will contribute not only to the strengthening of countermeasures but also to the development of the cybersecurity market.
Global organizations have introduced several programs and initiatives to combat cybercrime. In 2016, NATO member states recognized cybersecurity as an industry to be taken care of by the Alliance on a par with protection on land, air and sea and adopted the defensive mandate (NATO 2022). In 2021, a new Comprehensive Cyber Defense Policy was proposed and endorsed at the NATO Summit (NATO 2022). United Nations developed the Cybersecurity and New Technologies program to develop and strengthen measures against cyber terrorism for member nations and private companies (United Nations 2020). Due to the war launched by the Russian Federation against Ukraine, many countries have introduced enhanced cybersecurity measures. For example, The White House (2022) outlined appropriate steps for private entities to counter cyberattacks that could be a consequence of the cyber war in a fact sheet. National Cyber Security Centre (2022) prepared and published new guidance to support staff resilience, which companies must comply with in the face of cyber threats initiated by military aggression.
The European Commission is the leading developer of cyber strategies for the financial sector. It published a Fintech action plan in 2018, which aims to ensure greater cyber resilience for financial institutions (European Commission 2018). It also initiated the Digital Operational Resilience Act (‘DORA’), which regulates the risks associated with information and communication technologies and emphasizes creating and enforcing standards that limit cyber incidents’ impact (European Commission 2021). The European Banking Authority (EBA) is engaged in developing regulatory documents regulating IT and cyber risks. It proposed the Guidelines on ICT and security risk management, which contain defined requirements for the ICT and cyber risks management, which are based on the organization of internal control of a financial institution (European Banking Authority 2019). Also, the activities of The Euro Cyber Resilience Board for pan-European Financial Infrastructures (ECRB) and The European Union Agency for Cybersecurity (ENISA) to ensure cyber security issues for financial organizations should be noted. While the first agency performs an educational function to raise awareness of cyber security issues, the second performs an expert function to develop and implement relevant policies. Despite the strong international support for the implementation of cyber security strategies of financial institutions, the main direction for them is the development and implementation of personal measures to detect and counter threats identified as cybercrimes.
Thus, the issue of combating cybercrime is relevant, and the growing interest in it has been noticed over time, especially on the part of financial institutions as the most targeted objects for cybercrimes. Under these circumstances, it is essential to pay attention to various directions of solving the problem of preventing cyber-risk situations, which requires a systematic approach to their research and implementation at both practical and scientific levels.
2. Literature Review
The analysis of literature sources on cybercrime relevant to economics allowed us to state that there are studies for the macro level, business, and financial sphere. Thus, scholars worldwide are focusing on the macroeconomic issues of cybercrime. Kobushko et al. (2021) proved that not only is money the foremost tool of influence on different spheres of life of the country, but also information and communication technologies exist as a means of obtaining it. Their rapid development resulted in the transformation of the economy in a positive way, which, as noted by Tiutiunyk et al. (2021a), may also affect the macroeconomic stability of countries. However, the massive digitalization of society has caused the cybercrime development, which fostered just the formation of the shadow sector, as the financial flows from this type of activity are not transferred to the country’s development, are not taxed and accumulated in offshore accounts of criminals (Logan and Esmanov 2017). As a result, the countries’ innovation potential is weakened, as was proven by Vysochyna et al. (2020). Cybersecurity measures must be developed to counter cybercrime and its impact on a country’s development. Petroye et al. (2020) proved that information security in general, and cybersecurity in particular, significantly influenced the formation of the country’s image in the international arena, making it one of the effective strategic areas for most countries worldwide when considering their development.
The following research direction looks to publications addressing cybercrime issues in the business sector. Thus, Skrynnyk (2021) notes a positive perception of enterprises’ informatization and computerization of business processes, because they increase the quality and efficiency of decision-making management and reduce routine operations in economic activity. On the other hand, possible cyber-risks are the most dangerous for effective business management and their growth results in increased losses for the national economy (Semenova and Tarasova 2017; Bilan et al. 2020). Zadorozhnyi et al. (2021) determined that the level of digital competitiveness influences the increased cyberthreats. However, factors such as information and communication technology development, the innovativeness of the economy, and access to the Internet may also significantly influence a company’s cyber-risks (Leonov et al. 2019; Fernando Alonso Ojeda 2021). The global pandemic has made it possible to transfer the business processes of many companies to cloud-based platforms. On the one hand, this has contributed to the cost reduction for the use of physical storage facilities, while, on the other hand, increasing costs to ensure cybersecurity because cloud technology facilitates cybercriminals’ access to data (Djamila and Abdelatif 2022). Cybersecurity is nowadays considered to be a significant area of management innovation development and support in business (Fernando Alonso Ojeda 2021). Therefore, comprehensive information technology covering key business processes in the company as well as measures to prevent cyberattacks and data leaks needed to be organized to ensure cybersecurity operates effectively (Rahiman et al. 2021).
The study of cybercrime risks in financial institutions is a rather specific topic connected with the closedness and non-publicity of information in this sector. Despite this limitation, some scientists are trying to solve several problems in this field. Thus, Nicholls et al. (2021) introduced the concept of “financial cybercrime”, which means a set of financial and cybercrimes that occur in the cyber environment and are directed at financial institutions. Akinbowale et al. (2020) proved, based on the balanced scorecard, that the growing level of cybercrime has a negative impact on the banking sector. The Fintech sector is the most vulnerable to cyber criminals, which correlates to the greatest extent with cyber risks due to its technological component. What are the most critical cyber threat risks for the finance area? Primarily, computer infrastructure is exposed to cyberattacks, which can lead to operational disruptions, physical damage, and outages (Kumar et al. 2020). Computer networks support the work of many divisions of financial institutions and must withstand the Internet load from many customers. Their vulnerability can be a source of cyber threats, requiring authentication, privacy, and encryption risk management (Umaselvi et al. 2022). Although cloud services reduce computing infrastructure losses, they are also the main targets of cyberattacks (Aldasoro et al. 2022). Ghazi-Tehrani and Pontell (2021) highlight phishing as a targeted cyberattack to steal personal financial information. Makki et al. (2019) consider credit card cyber fraud the most critical threat to banks and their customers.
The global COVID-19 pandemic was one of the causes of the slowdown in economic growth and sustainable development (Tiutiunyk et al. 2021b). But it also affected the growth of the financial services business, which for customers takes place mainly online and with the use of mobile technologies. (Kyslyy et al. 2021). That is, this crisis has created a favorable environment for financial cybercrime development. Some scholars explore other reasons for this. Thus, Vasylyev et al. (2021) note the low level of information measures applied among the population in some countries regarding the risks of becoming a cybercrime victim, especially those that are least developed or currently going through the economic development phase. Didenko et al. (2020) found a direct correlation between the population’s digital and financial literacy level and the cybersecurity measures they take to counter cybercrime. Naser (2021) highlights the concept of digital financial inclusion, which is one of the circumstances behind the rise in monetary cyberfraud.
Furthermore, research concerning the psychological aspects of the financial cybercrime issue can be singled out. Their implementation is a complex process that combines the fraudster’s awareness of computer and information technology, motivation, and the availability of software and hardware tools to commit cybercrimes. Therefore, when developing preventive measures, it is necessary to consider not only the factors listed above but also to understand the nature of the cybercriminal’s decision-making (Njegovanović 2018). Leukfeldt and Roks (2021) confirmed that cybercrime incidents correlate with and are isolated incidents that may be considered when determining relevant attributes in the cybersecurity-building process. Stults and You (2021) researched that the low level of self-control of information systems and computer technology users leads to an increased risk of becoming a cybercriminal victim. This fact may also be used to develop the concept of cyber threat prevention in financial institutions. One of the potential sources of cyber threats is social networks, through which criminals can apply social engineering methods and obtain personal and financial data (Kirichenko et al. 2017; Kuzior and Kuzior 2018; Štrbová and Kuzior 2019). This direction must be considered in determining the risks of cyber threats for bank clients.
How can cybercrime risks be countered in financial institutions? Chinnasamy et al. (2021) emphasize the need to develop cybercrime risk prevention standards to support the Fintech industry. Mugarura and Ssali (2020) are inclined to the fact that, after all, the problem of the imperfection of legislation in the field of cyber risks is key to combating financial cybercrimes. Pandey et al. (2022) explore the need to develop an innovative cyber security system for banks based on the most effective cyber threat detection algorithms. Al-Dhaqm et al. (2017) suggest using a forensic examination of databases, which will contribute to their prompt assessment and detection of cyber threats. Qasaimeh et al. (2022) point out that predictive systems effectively combat cybercrime and should be integrated into complex cybersecurity software solutions of financial institutions.
To solve this issue, the most effective application of mathematical methods and models are those proposed by scholars from different research schools worldwide. These include traditional econometric research methods such as regression analysis (Leonov et al. 2014), structural equation modeling methods (Brychko et al. 2021), VAR- and VEC-modeling (Tiutiunyk et al. 2022), binary and matrix approaches (Yarovenko et al. 2021), fuzzy sets-based methods (Sarwar et al. 2021), gravity modeling (Lyeonov et al. 2020), data mining (Kuzmenko et al. 2020), and machine learning (Sivakumar et al. 2021), while artificial intelligence (Obeid et al. 2020) also became popular in the research. In this study, information trends of the most popular types of cybercrime will be used as input data. Since their values represent a time series, it is advisable to use econometric methods for their forecasting that are easy to implement and provide accurate results in the short- and medium-term perspectives.
3. Data and Research Methodology
3.1. Data
A set of input data was generated based on Google Trends toolkit queries to research and predict cybercrime trends. This included the most popular internet users’ queries for the terms “Cyberattacks on computer systems of a financial institution” (CS), “Cyberattacks on the network infrastructure of a financial institution” (NI), and “Cyberattacks on the cloud infrastructure of a financial institution” (CI) for the period from 16 April 2017 to 10 April 2022, in the context of week-by-week levels.
This information was selected based on the following considerations. Mass cyberattacks tend to be carried out in the economic entities of a particular country or countries. These events are reflected in the growing interest among Internet users in the network regarding these events. The time gap between actual cybercrime and online activity is not excessively large, because users’ responses to significant events within the country and around the world are instantaneous. Official sources that collect, process and publish statistical data usually publish it with a significant time lag and in an aggregated form. Therefore, in this case, the information trends reflecting the Internet users’ queries are a quick response to real events. Accordingly, their research will make it possible to predict possible cybercrimes worldwide quite accurately.
Decomposition of the studied temporal trends of global network users’ queries, considering seasonal, trend and random components for additive and multiplicative models are presented in Figure 1, Figure 2 and Figure 3.

Figure 1.
Decomposition (actual data, trend, seasonal and random components) of the “Cyberattacks on computer systems of a financial institution” time series: (a) additive model; (b) multiplicative model.

Figure 2.
Decomposition (actual data, trend, seasonal and random components) of the “Cyberattacks on the network infrastructure of a financial institution” time series: (a) additive model; (b) multiplicative model.
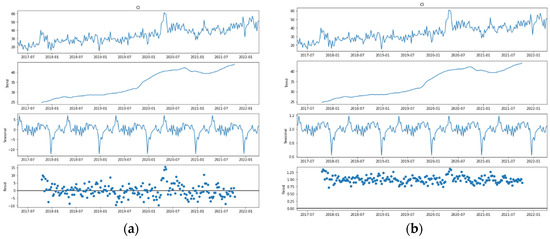
Figure 3.
Decomposition (actual data, trend, seasonal and random components) of the “Cyberattacks on the cloud infrastructure of a financial institution” time series: (a) additive model; (b) multiplicative model.
An analysis of the “Cyberattacks on computer systems of financial institutions” time series decomposition (Figure 1a,b) shows that it is a challenge to determine visually whether the trend component is present, so to check the series for stationarity requires the application of tests. The present outliers also need to be checked. The series contains a seasonal component, and the density of residual distribution indicates the model to be additive. Analysis of the “Cyberattacks on the network infrastructure of a financial institution” time series decomposition (Figure 2a,b) indicates that the present seasonal component and the density of the distribution of residuals testifies to an additive process. As for the trend component, the visual analysis does not allow us to conclude its absence or presence. (Figure 3a,b) shows the decomposition of the “Cyberattacks on the cloud infrastructure of a financial institution” time series, which demonstrates the clear presence of a trend, seasonal components, and consistency with an additive process.
Thus, the data under study are time series, which can be modeled by exponential smoothing models or autoregressive models depending on whether the evidence of the process is stationary or non-stationary.
3.2. Research Methodology
The information trend forecasting of cybercrime indicators involves the following steps.
Step 1. Checking time series for the presence or absence of anomalous values and making appropriate adjustments. To implement this step, we will use the Z-score statistical method. The Z-score measures the distance between the value of observation and the mean value by means of standard deviations and is calculated by the Formula (1):
where is the actual value of observation; is the mean value of the series; and is the root-mean-square deviation.
The calculated values of the Z-score are compared to extreme ones (−3 та +3). If one of the values is greater than +3 or less than −3, then the observation is an outlier.
Step 2. Checking for seasonality component for CS, NI, CI time series by performing QS test.
Seasonal persistence occurs when the process is nearly periodic in the season. In this case, we might think of average time series level xt as being modeled as:
where is a seasonal component that varies a little from one year to the next, according to a random walk:
where and are uncorrelated white noise processes.
To check for seasonal component existence in CS, NI, CI time series it is proposed to use QS test and its application in R on the base of “seastests” package. The score idea of QS test is pillared on the ratio:
where n is the number of observations in the time series and s is the periodicity of the data (12 in this case with monthly data); and denote the autocorrelations obtained for the corresponding time series. This statistic follows approximately the χ2 distribution with 2 degrees of freedom.
To perform the QS test for seasonality in a time series, the function is used:
where x—time series; freq—Frequency of the time series; diff—the differenced series; residuals—the residuals of a model; autoarima—automatic.
Step 3. Checking the stationarity in time series by applying the method of differences of average levels. This test verifies the hypothesis about the homogeneity of variances of parts of the time series and the hypothesis about the trend absence. It is reasonable to apply this test for the input data, as the trend graphs (Figure 1, Figure 3 and Figure 5) show that the data are not homogeneous over the whole period and there is an inflection. To implement it, it is necessary to divide the series into two parts with approximately the same number of points and calculate their variance (6):
where , are variances of two parts of the time series; , are actual values of two parts of the time series; , are mean values of two parts of the time series; , —the number of observations in the first and second parts of the time series.
The hypothesis for the homogeneity of the series is carried out using Fisher’s criterion (7):
where is the calculated value of Fisher’s criterion. If its value is less than the value in the table, which is determined for the significance level of and , are degrees of freedom, then the hypothesis of homogeneity of dispersions is accepted, otherwise, the method does not provide an answer to the question about the presence or absence of a trend.
The hypothesis of the trend absence is tested using Student’s criterion (8):
where is the calculated value of Student’s criterion. If its value is less than the table value determined for the significance level of and are degrees of freedom, then the hypothesis regarding the trend absence is accepted, otherwise, the trend is present.
Step 4. Section 4 of this study proves that the analyzed series are non-stationary, so exponential smoothing models will be chosen to predict cybercrime information trends.
A simple exponential smoothing model is of the form (9):
where are exponentially smoothed values at time and respectively (); is the smoothing parameter, taking a value from zero (when all current observations are ignored) to one (when all previous observations are completely ignored); is the level of time series at time t.
In this paper, the following types of exponential smoothing models will be constructed:
- (1)
- An additive cyclical model (10):where are the smoothed seasonal factor at time and (season length); and are the residuals at time ;
- (2)
- A trend-cyclic additive model with a linear trend (11):where is a linear trend (value at time );
- (3)
- A trend-cyclic additive model with an exponential trend (12):where is an exponential trend (value at time );
- (4)
- A trend-cyclic additive model with a damped trend (13):where is the damped trend (value at time );
- (5)
- A multiplicative cyclical model (14):where is the seasonal smoothing parameter, which is specified only for seasonal models;
- (6)
- A multiplicative trend-cyclic model with a linear trend (15):
- (7)
- A multiplicative trend-cyclic model with an exponential trend (16):
- (8)
- A multiplicative trend-cyclic model with a damped trend (17):
Although the visual analysis of the input data has been proven to follow an additive process, multiplicative exponential smoothing models will also be built to justify mathematically the conclusions obtained.
Step 5. The last stage of this study provides the assessment of prediction accuracy of indicators: “Cyberattacks on computer systems of a financial institution”, “Cyberattacks on the network infrastructure of a financial institution,” “Cyberattacks on the cloud infrastructure of a financial institution,” calculated by the constructed exponentiation models. For this purpose, the following values will be calculated: Mean Error, Mean Absolute Error, Sums of Squares, Mean Square, Mean Percentage Error, and Mean Absolute Percentage Error.
4. Results
At the first stage of the proposed methodology for cybercrime information trends prediction, time series were analyzed for the presence of anomalous values. The Python programming language was used to implement the Z-score statistical method. As a result, one anomalous value was found for the “Cyberattacks on computer systems of a financial institution” time series, five—for the “Cyberattacks on the network infrastructure of a financial institution” time series, and three—for the “Cyberattacks on cloud infrastructure of a financial institution” time series. The detected values were replaced by the arithmetic mean taken for the observations preceding and following the anomalous one.
At the second stage, a QS test, carried out with the help of the R programming language, was applied. As a result, it was found that the cyclical component value for the three series of dynamics equals 48, which is also confirmed by the visualized seasonal component in Figure 1, Figure 2 and Figure 3.
At the third stage, autocorrelation functions of time series were constructed to carry out their visual analysis for stationarity. The results are presented in Figure 4, Figure 5 and Figure 6:
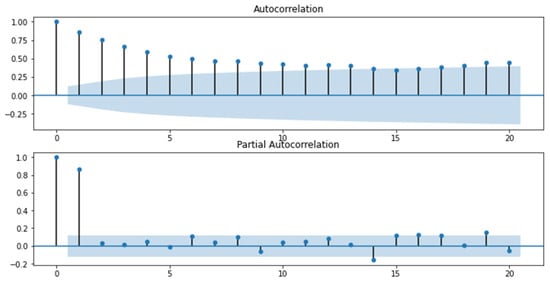
Figure 4.
Graphs of the autocorrelation function and the partial autocorrelation function for the “Cyberattacks on the computer systems of a financial institution” indicator.
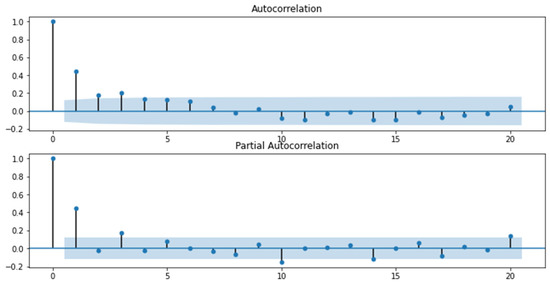
Figure 5.
Graphs of the autocorrelation function and the partial autocorrelation function for the “Cyberattacks on the network infrastructure of a financial institution” indicator.
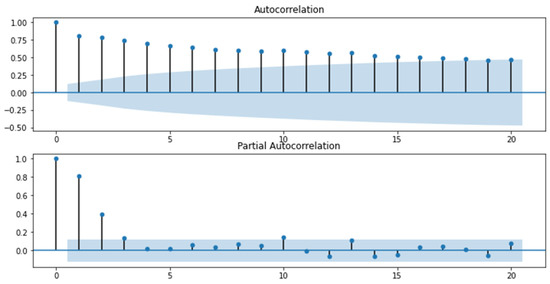
Figure 6.
Graphs of the autocorrelation function and the partial autocorrelation function for the “Cyberattacks on the cloud infrastructure of a financial institution” indicator.
Analyzing the obtained graphs, a preliminary conclusion was drawn that the series “Cyberattacks on computer systems of a financial institution” (Figure 4) and “Cyberattacks on cloud infrastructure of a financial institution” (Figure 6) are non-stationary, as the autocorrelation coefficients for the first levels are statistically significant. As for the series “Cyberattacks on the network infrastructure of a financial institution,” we cannot definitely state that the series is stationary or non-stationary because the value of the autocorrelation function for the first level equals 0.5, which indicates only a visible level of connectivity and does not allow to conclude with certainty about stationarity. Therefore, a mean level difference test was carried out using MS Excel software, the results of which are presented in Table 1.

Table 1.
Results of the mean level difference test.
The test results show that the “Cyberattacks on computer systems of a financial institution” and “Cyberattacks on the cloud infrastructure of a financial institution” series are heterogeneous and contain a trend. For the “Cyberattacks on the network infrastructure” series, the presence of a trend was confirmed, although it appeared to be homogeneous. Thus, a class of exponential smoothing models can be applied to the research data.
At the fourth stage, exponential smoothing models were constructed to predict the information trends of queries for cyberattacks on computer systems, network, and cloud infrastructure of a financial institution. For this purpose, the tools of the STATISTICA analytical package were used. The results of obtained predicted models are presented in Table 2.
Table 2.
Predictive models of exponential smoothing of information trends of queries for cyberattacks on the computer systems, network, and cloud infrastructure of a financial institution.
The results of the detected cyclical components of three types of time series under study are presented in Appendix A.
Let us represent the modeling results in Figure 7, Figure 8 and Figure 9 as the ratio of actual, theoretical, and predicted levels of the “Cyberattacks on the computer systems of the financial institution” indicator. Predicted values reflect the period from 16 April 2017 to 9 July 2023.
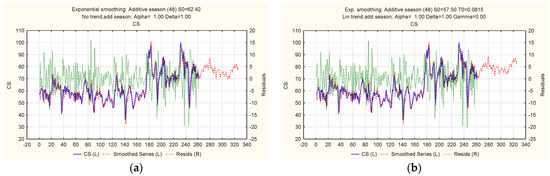
Figure 7.
Ratio of actual, theoretical, and predicted levels of the “Cyberattacks on the computer systems of a financial institution” indicator: (a) additive cyclical model; (b) trend-cyclic additive model with a linear trend.
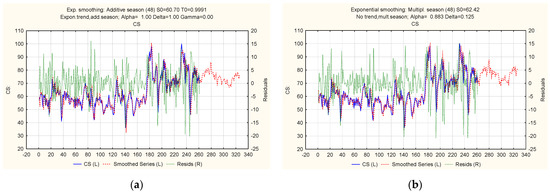
Figure 8.
Ratio of actual, theoretical, and predicted levels of the “Cyberattacks on the computer systems of a financial institution” indicator: (a) trend-cyclic additive model with an exponential trend; (b) multiplicative cyclical model.
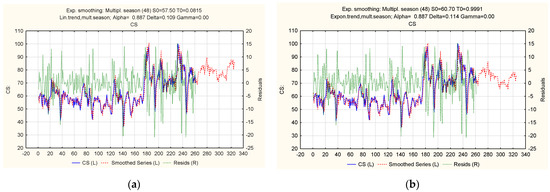
Figure 9.
Ratio of actual, theoretical, and predicted levels of the “Cyberattacks on the computer systems of a financial institution” indicator: (a) multiplicative trend-cyclic model with a linear trend; (b) multiplicative trend-cyclic model with an exponential trend.
Let us present the results of the exponential modeling in Figure 10, Figure 11, Figure 12 and Figure 13, as the ratio of actual, theoretical, and predicted levels of the “Cyberattacks on the network infrastructure of a financial institution” indicator. The predicted values reflect the period from 16 April 2017 to 9 July 2023.
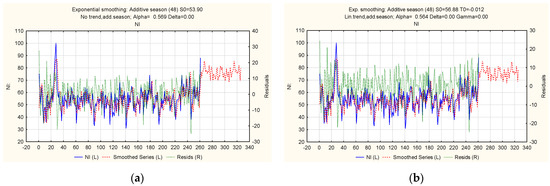
Figure 10.
Ratio of actual, theoretical, and predicted levels of the “Cyberattacks on the network infrastructure of a financial institution” indicator: (a) additive cyclical model; (b) trend-cyclic additive model with a linear trend.

Figure 11.
Ratio of actual, theoretical, and predicted levels of the “Cyberattacks on the network infrastructure of a financial institution” indicator: (a) trend-cyclic additive model with an exponential trend; (b) trend-cyclic additive model with a damped trend.
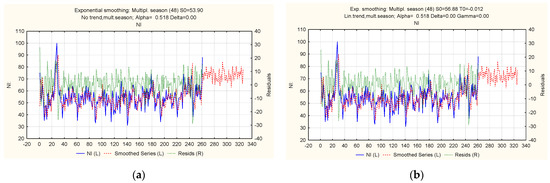
Figure 12.
Ratio of actual, theoretical, and predicted levels of the “Cyberattacks on the network infrastructure of a financial institution” indicator: (a) multiplicative cyclical model; (b) multiplicative trend-cyclic model with a linear trend.
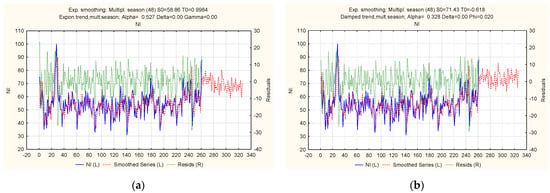
Figure 13.
Ratio of actual, theoretical, and predicted levels of the “Cyberattacks on the network infrastructure of a financial institution” indicator: (a) multiplicative trend-cyclic model with an exponential trend; (b) multiplicative trend-cyclic model with a damped trend.
Figure 14, Figure 15 and Figure 16 show modeled results of a ratio of actual, theoretical, and predicted levels of the “Cyberattacks on the cloud infrastructure of a financial institution” indicator. The predicted values reflect the period from 16 April 2017 to 9 July 2023.
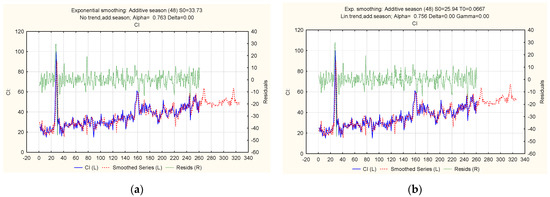
Figure 14.
Ratio of actual, theoretical, and predicted levels of the “Cyberattacks on the cloud infrastructure of a financial institution” indicator: (a) additive cyclical model; (b) trend-cyclic additive model with a linear trend.

Figure 15.
Ratio of actual, theoretical, and predicted levels of the “Cyberattacks on the cloud infrastructure of a financial institution” indicator: (a) trend-cyclic additive model with an exponential trend; (b) multiplicative cyclical model.
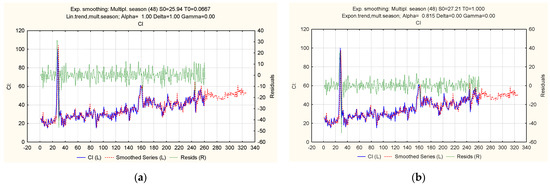
Figure 16.
Ratio of actual, theoretical, and predicted levels of the “Cyberattacks on the cloud infrastructure of a financial institution” indicator: (a) multiplicative trend-cyclic model with a linear trend; (b) multiplicative trend-cyclic model with an exponential trend.
Calculated predicted values of the cyberattack indicators on computer systems, network and cloud infrastructure of a financial institution for the period from 17 April 2017 to 9 July 2023 are systematized in the form of a table and presented in Appendix B.
The development of a model for predicting cyberattacks on the computer systems, network, and cloud infrastructure of a financial institution required testing the accuracy of calculated predicted levels. Therefore, at the fifth stage, the following list of indicators was analyzed: Mean Error, Mean Absolute Error, Mean Square, Mean Percentage Error, and Mean Absolute Percentage Error (Table 3, Table 4 and Table 5 for the three considered directions of cyberfraud attacks).
Table 3.
Prediction accuracy rates for the “Cyberattacks on computer systems of a financial institution” indicator.
Table 4.
Prediction accuracy rates for the “Cyberattacks on the network infrastructure of a financial institution” indicator.
Table 5.
Prediction accuracy rates for the “Cyberattacks on the cloud infrastructure of a financial institution” indicator.
An analysis of the calculated accuracy characteristics made it possible to select suitable models for the time series under study. Model 3 (Table 3), a trend-cyclic additive model with an exponential trend, proved to be the most accurate for the “Cyberattacks on computer systems of a financial institution” series by many indicators. The trend-cyclic additive model with a damped trend is accurate for the “Cyberattacks on the network infrastructure of a financial institution” series (Table 4). The trend-cyclic additive model with an exponential trend showed the best results for the “Cyberattacks on the cloud infrastructure of a financial institution” series (Table 5). The results also confirmed that the studied series follow an additive process and have trend and seasonal components.
5. Conclusions
The research topic of predicting cybercrime information trends becomes relevant due to the rapid growth of cybercrime over the past decade. The consequences of cybercrime are felt worldwide by increased financial losses from the theft, loss and recovery of personal information and data of business entities, government organizations, etc. This issue is particularly tangible in the context of warfare and global pandemics, as they form a favorable environment for cybercriminals and cyberfraudsters. That is why its prevention and early detection are strategic goals in combating this phenomenon.
The research paper has revealed that the issue of cybercrime is being actively studied by the scientific community, which pays attention to macroeconomic problems, namely, its impact on macroeconomic stability, the country’s capacity for innovation, and its image, as well as the growth of the shadow sector. Researchers also study the influence of information technology on business development, issues of business process re-engineering in the context of cloud-based technology implementation, conditions for increased cyber-risks and cybersecurity organization measures. The scientific direction associated with the issues of cybercrime against users of information systems and computer technology, which may occur through social networks, mobile and Internet applications is also relevant. The psychological causes of cybercrime, motivation of criminals and other factors are investigated.
We have proposed a research methodology, one which includes the investigation of input data set for anomalous observations by using the Z-score, and the QS-test to identify the cyclical patterns of the series, using the mean level difference test to carry out the hypothesis of trend absence, modeling and forecasting the series of dynamics based on exponential smoothing method, and building additive and multiplicative cyclical models with linear, exponential and damped trends, as well as assessing the quality of the built models. Information trends of Google user queries regarding cyberattacks on computer systems, networks and cloud infrastructure of a financial institution were selected as input data. The data were selected according to the consideration that the response to any event is faster on the Internet than in reality, so a corresponding growing user query is identified as a response to cyberattacks.
The decomposition of the selected time series revealed that they follow an additive process with seasonal and trend components. An analysis of the series for anomalous observations revealed that the information trend of queries for “Cyberattacks on computer systems” contains one anomalous observation, the trend of queries for “Cyberattacks on network infrastructure” contains five anomalous observations, and the trend of queries for “Cyberattacks on the cloud infrastructure” contains three anomalous observations. Their values were replaced by the arithmetic mean taken for the observations preceding and following the anomalous one. The QS-test determined that the cycle period is equal to 48 for all three series, which is also confirmed by the visualization of their seasonal component. The mean level differences test revealed that the information trends of cyberattacks on computer systems and cloud infrastructure have heterogeneous variance while the series of cyberattacks on network infrastructure has a homogeneous variance. However, the study of Student’s criterion values found that the series are non-stationary and have a trend component, so exponential smoothing models can be used for their modeling and predicting. As a result of their building and quality assessment, it was determined that the additive trend-cyclic model with an exponential trend sufficiently well models and predicts several queries regarding cyberattacks on computer systems and cloud infrastructure, and the additive trend-cyclic model with a damped trend—a number of queries regarding cyberattacks on the network infrastructure.
The study of the information trends of user queries regarding cybercrimes and their predictions will make it possible to prevent mass cyberattacks, which are common in cyberwarfare and cyberterrorism at the state level. The methodology proposed in this paper and its results are also practically significant for improving cybercrime strategies for financial institutions. One of the possible directions is developing an internal standard for determining potential cyber security risks, which will provide for implementing the following countermeasures, considering the results of this study. Firstly, a company will have the opportunity to continuously analyze potential cyber threats due to the availability and interactivity of these information trends. Secondly, rapid monitoring screening of crucial business processes least at risk for cybercrimes can be initiated based on receiving operational forecasts of cyberattacks. Thirdly, the risk action plan in the event of a cyber threat can be improved by risk management based on received predictions of mass cyberattacks. Fourthly, the forecast’s results will increase the personnel’s awareness of the possible risks of cyberattacks and contribute to implementing appropriate responses. Fifthly, the information trends of cyberattacks will contribute to the identification of potential dangers of their influence on the activities of a financial institution in a proactive mode. In further research, it is planned to expand the list of cyberattacks information trends to have an opportunity to identify a broader range of cybercrime risks in financial institutions.
Author Contributions
All authors contributed equally towards the conceptualization, methodology, formal analysis, investigation, data curation, original draft preparation, and the writing of the manuscript. All authors have read and agreed to the published version of the manuscript.
Funding
The research received funding under the research subsidy of the Faculty of Organization and Management of the Silesian University of Technology for the year 2022 (13/990/BK_22/0170).
Data Availability Statement
The data used in this study is available upon reasonable request.
Acknowledgments
This research was funded by the grant from the Ministry of Education and Science of Ukraine (No. s/r 0121U109559, No. s/r 0121U100467, No. s/r 0121U109553, No. s/r 0120U102001).
Conflicts of Interest
The authors declare no conflict of interest.
Appendix A
Table A1.
The value of the cyclical components of the information trends of inquiries regarding cyber attacks on computer systems, network, and cloud infrastructure of a financial institution.
Table A1.
The value of the cyclical components of the information trends of inquiries regarding cyber attacks on computer systems, network, and cloud infrastructure of a financial institution.
| Case | CS | NI | CI | Case | CS | NI | CI |
|---|---|---|---|---|---|---|---|
| 1 | −1.63689 | −6.11530 | −4.06617 | 25 | −1.84210 | 1.41283 | 4.52446 |
| 2 | −6.18898 | −4.03717 | −3.40992 | 26 | 0.44540 | 3.27533 | 2.42862 |
| 3 | −0.69939 | −2.39134 | −3.92033 | 27 | 1.36207 | 9.50033 | 9.33279 |
| 4 | −0.00148 | −3.16738 | −3.75367 | 28 | 0.86623 | 8.00866 | 13.63696 |
| 5 | 1.21207 | 5.62428 | 1.33487 | 29 | −0.99210 | 0.76699 | 11.32029 |
| 6 | 0.92561 | 4.35866 | −1.19117 | 30 | 3.42457 | 2.01283 | −0.19221 |
| 7 | 0.85269 | 2.42637 | −0.24846 | 31 | 2.66623 | 2.08783 | 2.77029 |
| 8 | −1.15773 | 4.69720 | −0.05054 | 32 | 5.04123 | −0.52884 | −0.73804 |
| 9 | −5.46502 | −2.29238 | −3.58700 | 33 | 2.61623 | 1.20449 | 0.16196 |
| 10 | −3.00668 | −3.75592 | 1.90779 | 34 | 3.56623 | 0.55449 | −2.74221 |
| 11 | −2.29835 | −0.02676 | −0.69638 | 35 | 5.89540 | 6.08366 | −1.06304 |
| 12 | −2.07439 | −1.82363 | 0.97550 | 36 | 3.00790 | 0.03783 | −0.61721 |
| 13 | −0.42856 | −6.36530 | 2.64217 | 37 | 1.10373 | −6.08717 | −2.17554 |
| 14 | −1.09523 | −2.40697 | 0.99633 | 38 | 3.82457 | 3.71699 | −0.27971 |
| 15 | −3.49627 | 3.50449 | 3.92342 | 39 | 10.70373 | 4.72116 | −1.03388 |
| 16 | −4.42335 | −1.83405 | 4.02237 | 40 | 9.60373 | 0.85449 | −1.97138 |
| 17 | −2.62648 | −3.15176 | 1.88175 | 41 | 2.10790 | −6.19551 | −5.48804 |
| 18 | −0.80877 | 1.03574 | 1.06404 | 42 | 3.20790 | −0.80801 | −0.96721 |
| 19 | −4.70981 | −7.51113 | −1.30575 | 43 | 3.33290 | −2.43301 | −0.86721 |
| 20 | −4.57439 | −3.53197 | −2.12867 | 44 | −0.32127 | −2.45801 | −2.14638 |
| 21 | −6.48064 | 4.44720 | 1.03279 | 45 | 1.40790 | −5.09134 | −3.67138 |
| 22 | −5.88689 | 0.91595 | −3.83700 | 46 | −2.22960 | −3.02884 | −3.78804 |
| 23 | −3.93898 | −3.70905 | 1.33487 | 47 | 1.89436 | 2.86908 | −2.35783 |
| 24 | −5.81398 | 0.52533 | −3.27971 | 48 | 3.12873 | 4.10866 | −3.71721 |
Appendix B
Table A2.
Predicted levels of cyberattacks on computer systems, network, and cloud infrastructure of a financial institution.
Table A2.
Predicted levels of cyberattacks on computer systems, network, and cloud infrastructure of a financial institution.
| Data | CS | NI | CI | Data | CS | NI | CI |
|---|---|---|---|---|---|---|---|
| 17 April 2022 | 70 | 75 | 46 | 4 December 2022 | 80 | 77 | 51 |
| 24 April 2022 | 72 | 69 | 51 | 11 December 2022 | 77 | 78 | 51 |
| 1 May 2022 | 68 | 76 | 47 | 18 December 2022 | 72 | 69 | 47 |
| 8 May 2022 | 75 | 74 | 55 | 25 December 2022 | 74 | 69 | 53 |
| 15.May 2022 | 78 | 72 | 52 | 1 January 2023 | 71 | 73 | 50 |
| 22. May 2022 | 79 | 81 | 59 | 8 January 2023 | 77 | 70 | 52 |
| 29 May 2022 | 79 | 76 | 64 | 15 January 2023 | 74 | 67 | 54 |
| 5 June 2022 | 78 | 70 | 61 | 22 January 2023 | 77 | 69 | 52 |
| 12 June 2022 | 82 | 75 | 50 | 29 January 2023 | 77 | 78 | 55 |
| 19 June 2022 | 80 | 76 | 53 | 5 February 2023 | 75 | 70 | 55 |
| 26 June 2022 | 84 | 71 | 49 | 12 February 2023 | 77 | 69 | 53 |
| 3 July 2022 | 83 | 76 | 50 | 19 February 2023 | 79 | 74 | 52 |
| 10 July 2022 | 80 | 74 | 47 | 26 February 2023 | 76 | 63 | 50 |
| 17 July 2022 | 84 | 80 | 49 | 5 March 2023 | 75 | 69 | 49 |
| 24 July 2022 | 77 | 73 | 50 | 12 March 2023 | 74 | 81 | 52 |
| 31 July 2022 | 81 | 66 | 48 | 19 March 2023 | 74 | 75 | 47 |
| 7 July 2022 | 82 | 78 | 50 | 26 March 2023 | 76 | 69 | 53 |
| 14 August 2022 | 88 | 76 | 49 | 2 April 2023 | 72 | 76 | 48 |
| 21 August 2022 | 90 | 75 | 48 | 9 April 2023 | 79 | 74 | 56 |
| 28 August 2022 | 79 | 65 | 45 | 16 April 2023 | 82 | 72 | 54 |
| 4 September 2022 | 84 | 75 | 49 | 23 April 2023 | 83 | 81 | 61 |
| 11 September 2022 | 82 | 69 | 50 | 30 April 2023 | 83 | 76 | 65 |
| 18 September 2022 | 75 | 70 | 48 | 7 May 2023 | 82 | 70 | 63 |
| 25 September 2022 | 82 | 69 | 47 | 14 May 2023 | 86 | 75 | 51 |
| 2 October 2022 | 79 | 67 | 47 | 21 May 2023 | 84 | 76 | 54 |
| 9 October 2022 | 79 | 75 | 48 | 28 May 2023 | 88 | 71 | 51 |
| 16 October 2022 | 82 | 78 | 47 | 4 June 2023 | 87 | 76 | 52 |
| 23 October 2022 | 81 | 64 | 47 | 11 June 2023 | 84 | 74 | 49 |
| 30 October 2022 | 77 | 72 | 47 | 18 June 2023 | 88 | 80 | 50 |
| 6November 2022 | 80 | 73 | 47 | 25 June 2023 | 80 | 73 | 51 |
| 13 November 2022 | 79 | 67 | 47 | 2 July 2023 | 85 | 66 | 49 |
| 20 November 2022 | 80 | 85 | 52 | 9 July 2023 | 86 | 78 | 51 |
| 27 November 2022 | 80 | 79 | 50 |
References
- Akinbowale, Oluwatoyin Esther, Heinz Eckart Klingelhöfer, and Mulatu Fekadu Zerihun. 2020. Analysis of cyber-crime effects on the banking sector using the balanced score card: A survey of literature. Journal of Financial Crime 27: 945–58. [Google Scholar] [CrossRef]
- Aldasoro, Iñaki, Leonardo Gambacorta, Paolo Giudici, and Thomas Leach. 2022. The drivers of cyber risk. Journal of Financial Stability 60: 100989. [Google Scholar] [CrossRef]
- Al-Dhaqm, Arafat, Shukor Razak, Siti Hajar Othman, Kim-Kwang Raymond Choo, William Bradley Glisson, Abdulalem Ali, and Mohammad Abrar. 2017. CDBFIP: Common Database Forensic Investigation Processes for Internet of Things. IEEE Access 5: 24401–16. [Google Scholar] [CrossRef]
- Bezpartochna, Olesia, and Nataliia Trushkina. 2021. Use of Modern Information Technologies and Digitalization of Business Processes. In Concepts, Strategies and Mechanisms of Economic Systems Management in the Context of Modern World Challenges. Sofia: VUZF University of Finance, Business and Entrepreneurship, pp. 310–22. [Google Scholar]
- Bilan, Yuriy, Tetyana Pimonenko, and Lyudmila Starchenko. 2020. Sustainable business models for innovation and success: Bibliometric analysis. Paper presented at the 1st International Conference on Business Technology for a Sustainable Environmental System (BTSES-2020), Almaty, Kazakhstan, March 19–20, Volume 159, p. 04037. [Google Scholar] [CrossRef]
- Brychko, Maryna, Yuriy Bilan, Serhiy Lyeonov, and Grzegorz Mentel. 2021. Trust crisis in the financial sector and macroeconomic stability: A structural equation modelling approach. Economic Research-Ekonomska Istrazivanja 34: 828–55. [Google Scholar] [CrossRef]
- Bursztynsky, Jessica. 2021. Bank of America Spends Over $1 Billion per Year on Cybersecurity, CEO Brian Moynihan Says. CNBC. June 14. Available online: https://www.cnbc.com/2021/06/14/bank-of-america-spends-over-1-billion-per-year-on-cybersecurity.html (accessed on 5 December 2022).
- Chinnasamy, Gopalakrishnana, Arabya Madbouly, and Sameh Reyad. 2021. Fintech: A Pathway for MENA Region. Studies in Computational Intelligence 935: 135–51. [Google Scholar] [CrossRef]
- Deloitte. 2021. Financial Cyber Survey. Deloitte. July 16. Available online: https://www2.deloitte.com/content/dam/Deloitte/dk/Documents/finance/FSI_cyber.pdf (accessed on 5 December 2022).
- Deloitte Insights. 2019. Pursuing Cybersecurity Maturity at Financial Institutions. Survey Spotlights Key Traits among More Advanced Risk Managers. Results and Analysis from the Second Annual FS-ISAC/Deloitte Cyber Risk Services CISO Survey. Deloitte. March 2. Available online: https://www2.deloitte.com/content/dam/Deloitte/ec/Documents/financial-services/DI_Pursuing-cybersecurity-maturity-at-financial-institutions.pdf (accessed on 5 December 2022).
- Didenko, Iryna, Jolanta Paucz-Olszewska, Serhiy Lyeonov, Anna Ostrowska-Dankiewicz, and Zbigniew Ciekanowski. 2020. Social safety and behavioral aspects of populations financial inclusion: A multicountry analysis. Journal of International Studies 13: 347–59. [Google Scholar] [CrossRef]
- Djamila, Toumi Amara, and Maza Abdelatif. 2022. The Impact of Setting up a Cloud Computing Solution on Small and Medium Organization’s Management: A Qualitative Study. Business Ethics and Leadership 6: 33–38. [Google Scholar] [CrossRef]
- EBA. 2022. Main Drivers of Operational Risk for the Banking Sector in Europe According to European Banks and Analysts in 2022 [Graph]. Statista. June 17. Available online: https://www.statista.com/statistics/1313848/main-drivers-of-operational-risk-among-european-banks/ (accessed on 5 December 2022).
- European Banking Authority. 2019. Final Report. EBA Guidelines on ICT and Security Risk Management. EBA. March 27. Available online: https://www.eba.europa.eu/regulation-and-policy/internal-governance/guidelines-on-ict-and-security-risk-management (accessed on 5 December 2022).
- European Commission. 2018. Communication From The Commission. FinTech Action plan: For a More Competitive and Innovative European Financial Sector. EUR-Lex Access to European Union Law. April 7. Available online: https://eur-lex.europa.eu/legal-content/EN/TXT/?uri=CELEX:52018DC0109 (accessed on 5 December 2022).
- European Commission. 2021. Financial Services—Improving Resilience against Cyberattacks (New Rules). European Commission. June 20. Available online: https://ec.europa.eu/info/law/betterregulation/have-your-say/initiatives/12090-Digital-Operational-Resilience-of-Financial-Services-DORFS-Act (accessed on 5 December 2022).
- Fernando Alonso Ojeda, Castro. 2021. Cybersecurity, An Axis On Which Management Innovation Must Turn in the 21st Century. SocioEconomic Challenges 5: 98–113. [Google Scholar] [CrossRef]
- Ghazi-Tehrani, Adam Kavona, and Henry N. Pontell. 2021. Phishing Evolves: Analyzing the Enduring Cybercrime. Victims and Offenders 16: 316–42. [Google Scholar] [CrossRef]
- IBM. 2022a. Average Cost of a Data Breach Worldwide from 2014 to 2022 (in Million U.S. Dollars) [Graph]. Statista. July 27. Available online: https://www.statista.com/statistics/987474/global-average-cost-data-breach/ (accessed on 5 October 2022).
- IBM. 2022b. Average Cost of a Data Breach Worldwide from May 2020 to March 2022, by Industry (in Million U.S. Dollars) [Graph]. Statista. July 27. Available online: https://www.statista.com/statistics/387861/cost-data-breach-by-industry/ (accessed on 5 October 2022).
- IBM Security. 2022. X-Force Threat Intelligence Index 2022. IBM. February 23. Available online: https://www.ibm.com/downloads/cas/ADLMYLAZ (accessed on 5 December 2022).
- Insurance Insider. 2018. Estimated Value of Cyber Insurance Premiums Written Worldwide in 2018, 2020 and 2025 (in Billion U.S. Dollars) [Graph]. Statista. September 9. Available online: https://www.statista.com/statistics/976526/global-cyber-insurance-market-size/ (accessed on 5 October 2022).
- Jones, David. 2021. Banks Outpace Other Industries in Cyber Investments, Defense Strategies: Report. Cybersecurity Dive. November 15. Available online: https://www.cybersecuritydive.com/news/banks-cyber-security-investments/610045/ (accessed on 5 December 2022).
- Kirichenko, Lyudmyla, Tamara Radivilova, and Carlsson Anders. 2017. Detecting cyber threats through social network analysis: Short survey. SocioEconomic Challenges 1: 20–34. [Google Scholar] [CrossRef]
- Kobushko, Iana, Inna Tiutiunyk, Ihor Kobushko, Mykola Starinskyi, and Zhanna Zavalna. 2021. The triadic approach to cash management: Communication, advocacy, and legal aspects. Estudios De Economia Aplicada 39: 1–16. [Google Scholar] [CrossRef]
- Kumar, Dharmendra, Darshana Pandey, Aamir Hussain Khan, and Himanshu Nayyar. 2020. Cyber Risk Analysis of Critical Information Infrastructure: (A Quantitative Approach). Paper presented at the 6th International Conference and Exhibition on Smart Grids and Smart Cities, ISUW 2020, New Delhi, India, March 3–7, Volume 847, pp. 1–9. [Google Scholar] [CrossRef]
- Kuzior, Aleksandra, and Paulina Kuzior. 2018. Identity Theft: The Escalation of the Problem—The Multidimensional Consequences. In Von der Agorá zur Cyberworld. Soziale und kulturelle, digitale und nicht-digitale Dimensionen des öffentlichen Raumes. Edited by Hg. Gerhard Banse and Xabier Insausti. Berlin: Trafo, pp. 81–89. [Google Scholar]
- Kuzior, Aleksandra, and Mariya Sira. 2022. A Bibliometric Analysis of Blockchain Technology Research Using VOSviewer. Sustainability 14: 8206. [Google Scholar] [CrossRef]
- Kuzmenko, Olha, Petr Šuleř, Serhiy Lyeonov, Ilze Judrupa, and Anton Boiko. 2020. Data mining and bifurcation analysis of the risk of money laundering with the involvement of financial institutions. Journal of International Studies 13: 332–39. [Google Scholar] [CrossRef]
- Kwilinski, Aleksy. 2019. Implementation of Blockchain Technology in Accounting Sphere. Academy of Accounting and Financial Studies Journal 23: 1–6. [Google Scholar]
- Kyslyy, Volodymyr, Tetyana Bondar, Yevhen Kabluchko, and Hlib Lieonov. 2021. Improving company communication activity amidst the COVID-19 restrictions. Health Economics and Management Review 2: 92–104. [Google Scholar] [CrossRef]
- Leonov, Sergiy, Sergiy Frolov, and Viacheslav Plastun. 2014. Potential of institutional investors and stock market development as an alternative to households’ savings allocation in banks. Economic Annals-XXI 146: 65–68. [Google Scholar]
- Leonov, Serhiy, Hanna Yarovenko, Anton Boiko, and Tetiana Dotsenko. 2019. Information system for monitoring banking transactions related to money laundering. Paper presented at the 8th International Conference on Monitoring, Modeling & Management of Emergent Economy (M3E2-EEMLPEED 2019), Odessa, Ukraine, May 22–24, Volume 2422, pp. 297–307. [Google Scholar]
- Leukfeldt, Rutger, and Robert Roks. 2021. Cybercrimes on the Streets of the Netherlands? An Exploration of the Intersection of Cybercrimes and Street Crimes. Deviant Behavior 42: 1458–69. [Google Scholar] [CrossRef]
- Logan, Winston, and Oleksii Esmanov. 2017. Public financial services transparency. Business Ethics and Leadership 1: 62–67. [Google Scholar] [CrossRef]
- Lyeonov, Serhiy, Joanna Żurakowska-Sawa, Olha Kuzmenko, and Vitaliia Koibichuk. 2020. Gravitational and intellectual data analysis to assess the money laundering risk of financial institutions. Journal of International Studies 13: 259–72. [Google Scholar] [CrossRef]
- Makki, Saraa, Zainabb Assaghir, Yehiac Taher, Rafiquld Haque, Mohand-Saïda Hacid, and Hassan Zeineddine. 2019. An Experimental Study With Imbalanced Classification Approaches for Credit Card Fraud Detection. IEEE Access 7: 93010–22. [Google Scholar] [CrossRef]
- Miskiewicz, Radosław. 2020. Internet of things in marketing: Bibliometric analysis. Marketing and Management of Innovations 3: 371–81. [Google Scholar] [CrossRef]
- Mugarura, Normana, and Emma Ssali. 2020. Intricacies of anti-money laundering and cyber-crimes regulation in a fluid global system. Journal of Money Laundering Control 24: 10–28. [Google Scholar] [CrossRef]
- Naser, Nahidah. 2021. Porter Diamond Model and Internationalization of Fintechs. Financial Markets, Institutions and Risks 5: 51–61. [Google Scholar] [CrossRef]
- National Cyber Security Centre. 2022. Maintaining a sustainable strengthened cyber security posture. National Cyber Security Centre, July 5. Available online: https://www.ncsc.gov.uk/guidance/maintaining-a-sustainable-strengthened-cyber-security-posture (accessed on 5 October 2022).
- NATO. 2022. Cyber Defence. NATO. March 23. Available online: https://www.nato.int/cps/en/natohq/topics_78170.htm (accessed on 5 October 2022).
- Nicholls, Jack, Aditya Kuppa, and Nhien-An Le-Khac. 2021. Financial cybercrime: A comprehensive survey of deep learning approaches to tackle the evolving financial crime landscape. IEEE Access 9: 163965–86. [Google Scholar] [CrossRef]
- Njegovanović, Ana. 2018. Artificial Intelligence: Financial Trading and Neurology of Decision. Financial Markets, Institutions and Risks 2: 58–68. [Google Scholar] [CrossRef]
- Obeid, Hassan, Fatima Hillani, Rana Fakih, and Kholoud Mozannar. 2020. Artificial Intelligence: Serving American Security and Chinese Ambitions. Financial Markets, Institutions and Risks 4: 42–52. [Google Scholar] [CrossRef]
- Pandey, Anand Bhushan, Ashish Tripathi, and Prem Chand Vashist. 2022. A Survey of Cyber Security Trends, Emerging Technologies and Threats. Studies in Computational Intelligence 1007: 19–33. [Google Scholar] [CrossRef]
- Petroye, Olha, Oleksii Lyulyov, Iryna Lytvynchuk, Yurii Paida, and Vladimir Pakhomov. 2020. Effects of information security and innovations on Country’s image: Governance aspect. International Journal of Safety and Security Engineering 10: 459–66. [Google Scholar] [CrossRef]
- Qasaimeh, Malik, Rand Abub Hammour, Muneer Bania Yassein, Raad S. Al-Qassas, Juan Alfonso Larac Torralbo, and David Lizcano. 2022. Advanced security testing using a cyber-attack forecasting model: A case study of financial institutions. Journal of Software: Evolution and Process 34: e2489. [Google Scholar] [CrossRef]
- Rahiman, Habeeb Ur, Nishad Nawaz, Rashmi Kodikal, and A. Hariharasudan. 2021. Effective information system and organisational efficiency. Polish Journal of Management Studies 24: 398–413. [Google Scholar] [CrossRef]
- Sarwar, Musavarah, Muhammad Akram, and Sundas Shahzadi. 2021. Bipolar fuzzy soft information applied to hypergraphs. Soft Computing 25: 3417–39. [Google Scholar] [CrossRef]
- Semenova, K. D., and K. I. Tarasova. 2017. Establishment of the new digital world and issues of cyber-risks management. Marketing and Management of Innovations 3: 236–44. [Google Scholar] [CrossRef]
- Sivakumar, P., V. Jayabalaguru, R. Ramsugumar, and S. Kalaisriram. 2021. Real Time Crime Detection Using Deep Learning Algorithm. Paper presented at the 2021 International Conference on System, Computation, Automation and Networking (ICSCAN), Puducherry, India, July 30–31; pp. 1–5. [Google Scholar] [CrossRef]
- Skrynnyk, Olena. 2021. Literature Review on Social and Organizational Acceptance of Digital Transformation. Business Ethics and Leadership 5: 110–17. [Google Scholar] [CrossRef]
- Statista Research Department. 2022. Cybersecurity—Worldwide. (n.d.). Statista. Available online: https://www.statista.com/outlook/tmo/cybersecurity/worldwide (accessed on 5 October 2022).
- Štrbová, Monika, and Paulina Kuzior. 2019. Safety Management in the Age of Internet Threats. Management Systems in Production Engineering 27: 88–92. [Google Scholar] [CrossRef]
- Stults, Brian J., and Myunghee You. 2021. Self-Control, Cyberbullying, and the Moderating Effect of Opportunity. Deviant Behavior 43: 1267–84. [Google Scholar] [CrossRef]
- The Actuary. 2019. Cybercrime to Cost Global Economy $5.2trn over Five Years. The Actuary. July 26. Available online: https://www.theactuary.com/news/2019/07/2019/07/26/cyber-crime-cost-global-economy-52trn-over-five-years (accessed on 5 December 2022).
- The White House. 2022. FACT SHEET: Act Now to Protect against Potential Cyberattacks. The White House, March 21. Available online: https://www.whitehouse.gov/briefing-room/statements-releases/2022/03/21/fact-sheet-act-now-to-protect-against-potential-cyberattacks/ (accessed on 5 October 2022).
- Tiutiunyk, Inna, Josef Drabek, Nataliia Antoniuk, Valentinas Navickas, and Pavlo Rubanov. 2021a. The impact of digital transformation on macroeconomic stability: Evidence from EU countries. Journal of International Studies 14: 220–34. [Google Scholar] [CrossRef]
- Tiutiunyk, Inna, Yuliia Humenna, and Anna Flaumer. 2021b. Covid-19 impact on business sector activity in the EU countries: Digital issues. Health Economics and Management Review 2: 54–66. [Google Scholar] [CrossRef]
- Tiutiunyk, I. V., A. O. Zolkover, S. V. Lyeonov, and L. B. Ryabushka. 2022. The impact of economic shadowing on social development: Challenges for macroeconomic stability. Naukovyi Visnyk Natsionalnoho Hirnychoho Universytetu 1: 183–91. [Google Scholar] [CrossRef]
- Umaselvi, M., E. Menaka, V. Chandrasekar, and D. Saravanapriya. 2022. 5G and IoT Networks Risk Management. In EAI/Springer Innovations in Communication and Computing. Cham: Springer, pp. 47–71. [Google Scholar] [CrossRef]
- United Nations. 2020. Cybersecurity. United Nations. September 9. Available online: https://www.un.org/counterterrorism/cct/programme-projects/cybersecurity (accessed on 5 October 2022).
- Vasylyev, Yuriy, Iryna Savchenko, Yana Us, and Regina Veckalne. 2021. Generating Confidence in the Healthcare System through Information Activities of Healthcare Institutions. Health Economics and Management Review 2: 38–51. [Google Scholar] [CrossRef]
- Vojinovic, Ivana. 2022. More Than 70 Cybercrime Statistics—A $6 Trillion Problem. DataProt. October 4. Available online: https://dataprot.net/statistics/cybercrime-statistics/ (accessed on 5 October 2022).
- Vysochyna, Alina, Olena Kryklii, Mariia Minchenko, Aliyeva Aygun Aliyeva, and Kateryna Demchuk. 2020. Country innovative development: Impact of shadow economy. Marketing and Management of Innovations 4: 41–49. [Google Scholar] [CrossRef]
- Yarovenko, Hanna, Yuriy Bilan, Serhiy Lyeonov, and Grzegorz Mentel. 2021. Methodology for assessing the risk associated with information and knowledge loss management. Journal of Business Economics and Management 22: 369–87. [Google Scholar] [CrossRef]
- Zadorozhnyi, Zenovii-Mykhaylo, Volodymyr Muravskyi, Oleg Shevchuk, and Mykhailo Bryk. 2021. Innovative accounting methodology of ensuring the interaction of economic and cybersecurity of enterprises. Marketing and Management of Innovations 4: 36–46. [Google Scholar] [CrossRef]
Publisher’s Note: MDPI stays neutral with regard to jurisdictional claims in published maps and institutional affiliations. |
© 2022 by the authors. Licensee MDPI, Basel, Switzerland. This article is an open access article distributed under the terms and conditions of the Creative Commons Attribution (CC BY) license (https://creativecommons.org/licenses/by/4.0/).