Article

The Influence of Transparency and Disclosure on the Valuation of Banks in India: The Moderating Effect of Environmental, Social, and Governance Variables, Shareholder Activism, and Market Power

by
Venkata Mrudula Bhimavarapu
1,2,*,
Shailesh Rastogi
2 and
Rebecca Abraham
3
1
School of Commerce & Management, D Y Patil International University, Pune 411044, India
2
Symbiosis Institute of Business Management, Symbiosis International (Deemed University), Pune 412115, India
3
Huizenga College of Business, Nova South Eastern University, 3301 College Avenue, Fort Lauderdale, FL 33314, USA
*
Author to whom correspondence should be addressed.
J. Risk Financial Manag. 2022, 15(12), 612; https://doi.org/10.3390/jrfm15120612
Submission received: 7 November 2022 / Revised: 9 December 2022 / Accepted: 13 December 2022 / Published: 16 December 2022
(This article belongs to the Special Issue ESG-Investing and ESG-Finance)

Abstract

:
Research on the impact of transparency and disclosures (TD) on the firm’s valuation presents an ambiguous result. The effect of disclosure on value is a concern because disclosure is not an economic activity. It grows further due to the embellishment of positive disclosures and the suppression of hostile facts. This situation has motivated the authors to conduct the current research. The study aims to empirically find the influence of TD on the valuation of banks in India while the Environmental, Social, and Governance Index (esgi), Shareholder activism index (shai), and Lerner Index (li) act as moderators. A panel data regression (PDR) is adopted to analyse the data in the study. Panel data for 31 public/private banks for ten years (2010–2019) are collated. The authors used econometric models to understand the linear, quadratic, and interaction association of Transparency and Disclosure (TD) with the valuation of the banks in India. It is empirically found that TD alone does not impact the valuation of banks but is positively associated with a bank’s value under the influence of the moderators, Environmental, Social, and Governance variables (esgi), and shareholder activism (shai).

1. Introduction

All the information shared with the shareholders/stakeholders can be defined as transparency and disclosure (TD). According to Jayaraman and Wu (2019) and Charumathi and Ramesh (2020), TD includes mandatory and voluntary disclosures. TD is an inevitable and integral part of corporate governance (Patel and Dallas 2002). Despite being a non-economic activity, TD is seen as having economic consequences for firms, particularly in the context of firm valuation (Damodaran 2007). Firms that are transparent and truthful in disclosing results facilitate the better computation of market value. Reductions in value prompt corrective action, while increases in value imply positive earnings. As such, TD becomes a proxy for management quality. These are some of the immeasurable benefits of TD for corporate firms in India (Bhimavarapu et al. 2022). However, banks are unique because they are not the same as firms. The disclosures of the banks are intrinsically complex. Banks cannot disclose sources of deteriorating loan quality and are not required to disclose the levels of risky investments on financial statements, such as loan commitments and derivatives. It is worth diving deep into whether disclosure and transparency impact value in banks (Damodaran 2007).
TD is taken for granted, particularly with banks, as the regulatory authorities, monetary markets, and shareholders have a right to get information from the banking services. As TD is still in the pioneering stage in India, the disclosure levels are not at a high level as compared to the developed countries. Compared to corporate non-financial firms, opaqueness is inherent in Indian banks (Fosu et al. 2017; Wagner 2007), which could explain TD’s impact on value.
The extant literature emphasises that firms have glorified their disclosures (Hutton et al. 2003; Lev and Penman 1990; Waymire 1984). It is also evident that all the disclosures discussed are mostly regarding social responsibility and the environment, as they are helpful in value creation (Dewi 2020; Longo et al. 2005; Vishwanath and Kaufmann 1999). Hence it is presumed that TD is compromised in non-environmental areas, and therefore, there are vast chances of varied effects on the valuation of firms.
Reviews of transparency and disclosure have enumerated a variety of determinants of TD. Firm size, with large firms displaying higher disclosure, has been presented as an important determinant of TD in several studies (Berglof and Pajuste 2005; Hanifa and Rashid 2005; Mendez-DaSilva and Onusic 2014). A recent examination of TD in former socialist countries determined that firm size was positively related to transparency (Arsov and Bucevska 2017). The concentration of ownership had mixed effects on TD, with large owners with significant control demanding disclosure from management in certain country samples (Ahmed 2015; Hanifa and Rashid 2005), with the opposite effect of less TD with concentrated ownership in other countries (Arsov and Bucevska 2017). Firms with a broader array of growth opportunities, along with the need for external financing, exhibited greater disclosure in that lenders will only furnish funds with disclosure of financial status (Arsov and Bucevska 2017; Durnev and Kim 2005; Hanifa and Rashid 2005). Specifically, less leveraged firms seeking external debt financing have greater disclosure (Berglof and Pajuste 2005).
The annual financial statements of a bank reveal its financial performance. While reporting, it demonstrates the quality of its assets. However, banks’ operations are inherently opaque (Jones et al. 2012). The lack of clarity on financial disclosures is exacerbated by the diverse expectations of banks’ stakeholders. The stock market, regulators, shareholders, and other stakeholders may not evaluate the bank’s performance using comparable criteria (Liu and Sickles 2021). Bank management is overwhelmed by enormous pressures and reveals similar information to all concerned stakeholders. In this endeavour, the firms’ management always wants to put their best foot forward, regardless of their actual financial and non-financial positions.
Due to several constraints, such as complex reporting systems, lack of documentation of transactions, and the existence of a nonbank sector, TD remains a challenge in Indian banking. In order to overcome the stumbling blocks in the Indian banking system, many banking reforms have been implemented in India. Governance-related regulatory measures are critical in such reforms. Nevertheless, while the effect of TD on value can be found in the literature on companies, it is ignored in the case of banks (Jiao 2011; Lang et al. 2012). Moreover, there are further concerns about how much transparency is optimal, as TD has other issues in addition to adding value to firms or banks (Moreno and Takalo 2016).
The preceding discussion explains and deduces that there are concerns about TD and valuation in India that merit considering a fresh perspective, particularly in banks. Rather than addressing the issue of TD in general, most studies are lost in the literary maze of mandatory versus voluntary disclosure (Hossain 2008; Zhang et al. 2019). Another source of digression is social responsibility disclosure and its varied impact on bank performance (Chakroun et al. 2017; Jain et al. 2015). Baumann and Nier (2004) addressed another pertinent issue, the benefits of TD practice in banks. The current study is motivated by a gap in the literature on TD in banking. Following the discussion of the issue, this research proposes to empirically determine how TD affects the value of banks in India. This exploration can be determined by establishing a link between TD and valuation while controlling for the other valuation determinants.
The current study and its findings are one-of-a-kind. Undoubtedly, there is a voluminous literature on how TD affects valuation. However, no study, however, has attempted to link the relationship between TD and valuation using Environmental, Social, and Governance variables, shareholder activism, and market power as moderators. One of the study’s significant contributions is to the Indian banks. The study’s findings have several important implications for administrators. Administrators should avoid exaggerating disclosures because they may add temporary value. Such behaviour can backfire and be self-defeating in the long run. As a result, managers must exercise restraint and follow best corporate governance practices regarding disclosures.
The paper is organised as follows. Section 3 describes empirical results from the literature and hypotheses development. Section 4 describes the data and methodology. Section 5 presents the results and discusses them. Section 6 presents the conclusions. Following the introduction in the paper’s first section, the remainder is organised, followed by elaborating empirical results obtained by diverse researchers and the hypothesis development of the study. The paper’s data, methodology, results, and discussion are discussed in the succeeding sections. The paper is concluded in the last section.

2. Review of Literature

2.1. Investment Efficiency as a Predictor of Firm Value

Investors purchase securities with the intent of obtaining capital gains and dividends. Securities are selected for investments based on positive firm value, as it is such investments that will increase wealth by achieving positive net present value (Stein 2003). However, agency costs may interfere with investment efficiency. Management may undertake inferior projects or limit the prospect of selecting an optimal project due to agency costs (Stein 2003). Two moderators may prevent the occurrence of suboptimal decisions. The first one is institutional ownership. Institutional ownership, whereby key external institutions own stock in a firm, results in these institutional representatives demanding transparency in the dissemination of information about the firm’s financial performance and reviewing management performance independent of internal employees. The ensuing reduction in information asymmetry between managers and shareholders reduces agency costs, controls directors, and improves financial performance (Rashed et al. 2018). Independent directors are the other entity that can reduce agency costs by performing an oversight role over management and internal directors and balancing the needs of minority and majority shareholders (see Salehi et al. 2022, for a review). Using a sample of 177 Iranian companies, Salehi et al. (2022) empirically showed that both institutional ownership and board independence moderated the relationship between investment efficiency and firm value. Institutional ownership strengthened the positive influence of investment efficiency on firm value, as did the presence of independent directors. Conversely, the lack of institutional ownership or board independence resulted in sub-optimal investments that had an adverse effect on firm value.

2.2. Managerial Entrenchment, Social Responsibility, Firm Risk-Taking, and Shareholders’ Activity

Agency theory (Jensen and Meckling 1976) sets forth that managers who pursue their own self-interest may take actions that conflict with their role of shareholder wealth maximisation as agents of shareholders. Salehi and Alkhyyoon (2022) presented a novel test of agency theory by relating managerial entrenchment, social responsibility disclosures, firm risk-taking, and shareholders’ activity. Using a sample of Iranian firms, they found that managerial entrenchment was significantly associated with social responsibility disclosure, as such disclosure presents management in a favourable light regarding other stakeholders. The growth of social responsibility disclosures is supported by shareholder demands for information about the firm’s performance. The two forces of social responsibility growth and shareholder activism encourage firm risk-taking by increasing transparency about firm performance and reducing information asymmetry between managers and shareholders. As a caveat, for the Iraqi sample, shareholder activism had no effect on the relationship between social responsibility growth and firm risk-taking. It may be concluded that agency conflict, represented by managerial entrenchment and social responsibility disclosures, may be overcome by growth in social responsibility and shareholder activism.

2.3. Board Compensation and Disclosure Quality: Interference in Corporate Governance

Directors on corporate boards may receive equity-based compensation for their service. Sengupta and Zhang (2015) and Salehi et al. (2018) set forth that such compensation offers private benefit incentives. The growth of directors’ equity may direct board members to maximise the value of their own equity stake in the firm rather than safeguarding shareholder interests. Outside directors benefit from information asymmetry, whereby they have privileged information about the firm’s financial prospects over investors. Directors may prevent management from releasing information that would adversely influence the equity valuations of their portfolios. Manipulation of reported earnings using accruals, the release of earnings information at the time of the release of options, the positive link between audit committee compensation and accounting restatements, and the association between directors’ option awards and total accruals, have been documented as practices that interfere with the monitoring of management by directors (see Sengupta and Zhang 2015, for a review).

2.4. Capital Market Response to Exploration and Exploitation Disclosure

Can there be drawbacks to transparency and disclosure? The answer is in the affirmative, as in certain countries, disclosure of the financial position of firms causes powerful elites to seek out the managers and politicians associated with those firms to obtain preference in securing additional capital for investment in these entities. These elites concurrently deprive new entrants of the capital needed for them to similarly benefit from such investment (Durnev et al. 2004). Durnev et al. (2004) maintain that even with large stock markets, Russia and China lag behind other transition economies in fostering efficient capital markets, as disclosures by firms are not associated with the information being incorporated into stock prices, so low-quality capital investments, which fail to support positive net present value projects, ensue. Grosman (2022) concurred with the above finding, observing that oligarch-owned enterprises had fewer positive effects on fixed investment from transparency than state-owned enterprises. This is a form of paradoxical transparency whereby capital markets react to transparency with adverse effects on security returns due to owner-imposed constraints.

3. An Elaboration of Empirical Results Obtained by Diverse Researchers and Hypotheses Development

3.1. Conceptual Model of the Study

The current section of the paper is organised thematically. Firstly, it highlights the theoretical concept used for the study using a conceptual model depicted in the figure. Later, it discusses in detail the critical studies available in the literature, identifies gaps, and formulates the study’s hypothesis. Figure 1 depicts the study’s approach to achieving the desired results.
The figure shows that TD impacts bank valuation, measured by market price to book price. Four moderators may impact this relationship. They include Environmental, Societal, Governance, Shareholder Activism, and Market Power. Higher levels of these moderators may strengthen the influence of TD on bank valuation. Base, quadratic, and interaction models with each moderator are tested.

3.2. Empirical Evidence on Disclosures

The literature fully reveals that disclosures and their authenticity are the issues of concern, and it also establishes that firms embellished the information disclosures (Kim and Lyon 2015; Marquis et al. 2016). The pressure of the competition may be one of the prime reasons for the exaggerated disclosures. Pae (2005) illustrates investors’ quandary in the case of firms’ selective disclosures. Investors are concerned about compensating for the lack of disclosed information caused by the corporate selection of relevant information to disclose. Research provides evidence of disclosure biases (Fischer and Verrecchia 2004; Hutton et al. 2003; Lev 1992; Lev and Penman 1990). The persuasive arguments presented above highlight the fact that disclosures can be deceptive. The valuation supported by such erroneous disclosures may also be misleading. It would add to the woes of investors who are already lost in the maze of too much information.

3.3. Researchers Take on Disclosures and Valuation

Evidence of TD and value are abstruse in literature. Evidence is categorised into two broad categories from the literature on the relationship between TD and valuation. The first is concerned with studies showing that TD impacts firm value. Jiao (2011) postulates in his research that disclosures positively impact not only the value but the performance of the firms. At the same time, Charumathi and Ramesh (2020) used the voluntary disclosure scale to assess the impact of TD on the value of 81 financial and non-financial firms from the BSE 100 indices from 2010 to 2015. They discover evidence of a positive and significant relationship between voluntary disclosure and firm value. Anam et al. (2011), using disclosure of the intellectual capital of Malaysian firms, find a positive and significant association supported by Sheu et al. (2010). Hassan et al. (2009) discovered that disclosures are significantly negatively associated with firm value.
The relationship between disclosure and value appears to be non-existent in other studies. They contradict the widely held belief that the two have a significant relationship. Alencar (2005) discovers evidence from 222 Brazilian firms that corporate disclosure does not affect the valuation of the firms supported by Banghøj and Plenborg (2008). Furthermore, Alencar (2005) claims no connection between corporate governance and valuation. Azrak et al. (2020) proved that the disclosure index does not affect stock volatility and return.
In most studies, the disclosure is for specialised purposes and has a positive and significant relationship with value. A holistic corporate disclosure could have been used. As a result of the issues raised in the current study, there is a need to reconsider the relationship between corporate disclosure and value. Although empirical firm results can also be considered for banks, the relationship between disclosures and value found is vague. New evidence on the topic may demystify the clouded and cluttered findings. This situation implies that the possible association of TD with bank valuation may be devoid of bank performance. This finding calls into question the sanctity of the association of TD with bank valuation. H1 is framed to understand the linear association between the variables TD and the valuation of the bank, whereas H2 is framed to understand the non-linear relationship, which provides a clearer view and insights on the sustainability of the relationship to an optimal level. Hence the following hypotheses are framed to understand the linear and quadratic (non-linear) relationship of TD on the bank valuation.
H1. 
TD influences the bank’s valuation.
H2. 
TD has a non-linear association with the bank’s valuation.
Intuitively, ESG, Shareholder Activism, and Market Power moderate the relationship between TD and bank valuation. Banks with a strong emphasis on ESG variables will have shareholders who demand information on the bank’s performance on these variables. Therefore, high levels of ESG will strengthen the positive influence of TD on bank valuation. Conversely, low levels of ESG will weaken the positive impact of TD on bank valuation. Activist shareholders examine bank financial statements, question results, and demand explanations. It follows that there is a need for more transparency and disclosure with such shareholders. Greater TD with shareholder activism will strengthen the positive influence of TD on bank valuation. Finally, market power for banks leads to the demand for accountability. Such demands may be satisfied by increased transparency and disclosure. Therefore, greater TD, with market power for banks, will strengthen the positive influence of TD on bank valuation.
According to Alencar (2005), corporate disclosure does not affect firm value. Bajic and Yurtoglu (2018) and Taylor et al. (2018) discovered that social disclosures are positively associated with higher firm value. In contrast, Sampong et al. (2018) on South African listed firms and Oktaviani et al. (2019) on Indonesian listed firms discovered empirical evidence that, despite its numerous benefits, social disclosures may not necessarily influence firm value. The preceding discussion attests to the fact that the relationship between disclosures and value is perplexing. New evidence is needed to guide corporate disclosures’ relationship with firm valuation.
The extensive discussions on the association of TD with firm valuation explicitly present that the association needs to be viewed with a fresh perspective, especially when other factors can impact the association when a moderator variable is used. As a result, empirical tests are carried out to find the association between TD and the firm’s value; Hence the following hypothesis is written in an alternate form for empirical testing:
H3. 
esgi mitigates the effect of TD on bank evaluation.
H4. 
shai mitigates the effect of TD on bank evaluation.
H5. 
li mitigates the effect of TD on bank evaluation.

4. Data, Research Methodology, and Results

4.1. Data

Ten years of data is procured from 2010 to 2019 for 31 banks giving services in India. The CMIE Prowess database and the bank’s annual reports are the primary source data for this study. The selection of 31 banks is made because they have authenticated data for a balanced panel, and they are believed to cover a significant chunk of India’s banking system. The chosen period is also important for the study because several regulatory measures after the reform period have been taken to improve India’s banking activities. The sample data needs to have sufficient observations in numbers so that consistent results can be delivered. This also makes the justification for sample selection with enough observations. Table 1 presents a detailed note on the variables taken for the analysis.

4.2. Methodology

This study involves the panel data design with 31 banks as the cross-sectional units and the study period of 2010–2019 as the time dimension of ten years. Therefore, the panel data regression models (PDRM) appropriately suit for the analysis to test the study’s hypotheses. As per Hsiao (1985), Hsiao (2007), Baltagi (2008), and Rastogi and Kanoujiya (2022), the PDRMs have the advantage of delivering information regarding both cross-sectional and time dimensions. Therefore, their estimates are unbiased with an exploration of more details. Additionally, PDRMs are less prone to endogeneity biasedness. Therefore, PDRM becomes a better choice for this study to deliver reliable outcomes. This study finds the association of mpbp and TD in different angles, including linear base association, quadratic (non-linear) association, and their connection with the interaction of other variables (shareholders’ activism [shai], ESG [esgi], and competition [li]). Thus, five models are established to test the assumed hypotheses in the study. We have further applied STATA’s CHECKROB command to ensure the robustness of the results. The model specifications are mentioned as follows:
mpbpt = β1tdiit + δ1In_Assetsit + δ2ln_Salesit + uit
mpbpit = β1dtdiit + β2dtdiit + δ1In_Assetsit + δ2ln_Salesit + uit
mpbpit = β1dtdiit + β2dshaiit + β3dtdi_shaiit + δ1In_Assetsit + δ2ln_Salesit + uit
mpbpit = β1dtdiit + β2desgiiit + β3dtdi_esgiit + δ1In_Assetsit + δ2ln_Salesit + uit
mpbpit = β1dtdiit + β2dliiit + β3dtdi_liit + δ1In_Assetsit + δ2ln_Salesit + uit
Equations from Equations (1) to (5) correspond to Models 1 to 5, respectively. Where
mpbp is the dependent variable for financial performance.
‘tdi’ is the main exogenous variable indicating the TD. ‘ dtdi 2 ’ (=tdi × tdi) is the square term of ‘tdi’ for non-linear establishment.
‘shai’, ‘esgi’, and ‘li’ are other independent variables taken as a moderator in interaction terms to estimate the interaction effect of tdi on mpbp.
‘dtdi_shai’ (dtdi × dshai), ‘dtdi_esgi’ (dtdi × desgi), and ‘dtdi_li’ (dtdi × dli) are the interaction terms where prefix ‘d’ represents demean value. The demean values are taken to deal with multicollinearity or extreme value issues.
In addition, two control variables named ‘ln_Assets’ and ‘ln_Sales’ are included in the models to make it an appropriate fit to observe the internal validity of the main exogenous variable. It is subscript shows that cross-sectional unit ‘i’ with year ‘t’ (time dimension). uit (=μit + νit) refers to error-term summing up regular error-term (νit) and individual effects (μit). βj and δj are coefficients for the exogenous variables and control variables.

4.3. Descriptive Statistics

In Table 2, the statistical summary of variables is demonstrated. The mean value of mpbp is 1.293, which is much closer to Min; thus, on average, the sample banks do not show a very good financial performance during the sample period. ‘tdi’ and ‘shai,’ respectively, have average values of 0.502 and 0.529 having slight inclination towards Max. Therefore, on average, a moderate level of TD and shareholders’ activism in sample banks is found in Indian banks during the sample period; ‘esgi’ has a mean value of 0.271, which is minutely towards Max. However, it is, on average, relatively low because the Max value is also below 0.5 (i.e., an average of Min and Max). The mean values of Assets and Sales are towards Max; it implies that, on average, a substantial amount of assets and sales are observed in sample firms during the study period. The low standard deviation (SD) shows that sample banks are not much varying for a particular variable. However, a high standard deviation indicates that banks vary.

4.4. Multicollinearity and Endogeneity

Table 3 portrays a pairwise correlation matrix. It can be observed from the correlation coefficients that coefficients with significant p-value are less than 0.800 (except correlation with interaction terms and control variables). Interaction terms have significant coefficients with values more than 0.800. Therefore, it causes a structural multicollinearity issue which is permissible for regression analysis (Wooldridge 2015). In all, severe multicollinearity issues are not found. Wherever there is multicollinearity due to interaction terms, the demean values are used to overcome this issue in model specifications (Wooldridge 2015).
The results of endogeneity tests are provided in Table 4. We have applied the Durbin-Ch2 test and the Wu-Hausman test. Both tests are performed using the variable of interest (tdi) for ‘mpbp’ to confirm their exogeneity. The variable is instrumented at lag 3 for the test (Wooldridge 2015; Baltagi 2008). The endogeneity is found significant in the base model (Model 1), Quadratic model (Model 2), and interaction model (Model 5) because of having significant outcomes. Models 3 and 4 have insignificant consequences at 5% significance. Hence, there is no significant endogeneity problem in these models. Models 1, 2, and 5 have endogeneity issues; therefore, instrument variable regression (ivreg) analysis is applied in these models (Wooldridge 2015; Baltagi 2008). Models 3 and 4 follow static models with random effects.

4.5. Presenting the Empirical Results of the Study

Table 5 reflects the regression outcomes. Observing the model diagnostics, the BP-test has insignificant values in all models. The Hausman test is further applied to confirm the models’ suitable effect for a good fit. The insignificant values exhibited in all models confirm that a random effect is to be followed in all models (Wooldridge 2015; Baltagi 2008).
The significant value revealed by the Wooldridge test indicates that heteroscedasticity exists in Models 2 and 3. Therefore, we have considered robust error estimates (Wooldridge 2015; Baltagi 2008).
The coefficient of tdi in the base model (Model 1 in Table 5) is negative (−75.2) but insignificant at 5% significance. Thus, tdi is not found to be significantly impactful for mpbp. It is also not significant for non-linear establishment because the coefficient of dtdi2 is positive but insignificant at 5% significance in Model 2. However, dtdi is significant (at 5% significance) and positive in Models 3 and 4 with coefficient values of 5.31 and 3.96, respectively. The moderator ‘dshai’ in Model 3 is insignificant. However, the moderator ‘desgi’ in Model 4 is significant and positive (4.13). It means the moderator individually impacts mpbp in a positive direction. The moderator ‘dli’ is also insignificant. The interaction term ‘dtdi_shai’ and ‘dtdi_esgi’ (in Models 3 and 4) have positive coefficients with values of 5.94 and 9.78, respectively. However, the interaction term ‘dtdi_dli’ is insignificant in Model 5.
These coefficients are also significant at 5% significance. It implies that the association of ‘tdi’ and ‘mpbp’ is positively influenced by ‘shai’ and ‘esgi’. In other words, at the higher shareholders’ activism level (shai), tdi impacts mpbp and vice-versa (Figure 2 demonstrates this association). Similarly, at a higher level of ESG engagement (esgi), tdi improves mpbp (see Figure 3). However, the interaction term ‘dtdi_li’ is insignificant in Model 5. Therefore, the association of tdi and mpbp is not significantly influenced by competition (li). The control variables i.e., ln_Assets and ln_Sales are significant at 5% significance in Models 3 and 4, where ‘ln_Assets’ has negative coefficients, and ‘ln_Sales’ has positive coefficients (see Table 5).

4.6. Robustness Test of Results

The results’ robustness is important for ensuring reliable outcomes (Barslund 2018; Bhimavarapu et al. 2022). Thus, the multi-model approach, as well as the CHECKROB command of STATA, is utilised to test the robustness of the results. It processes the regression analysis in different segments of variables’ data by choosing them randomly (Barslund 2018; Bhimavarapu et al. 2022). The CHECKROB command is used for Models 3 and 4 for its suitability. ‘dtdi’ is found significant with a 100% significance share at a 5% significance level. However, interaction terms ‘dtdi_shai’ and ‘dtdi_esgi’ are found insignificant as having a 0% share of significance at 5% significance. The moderators ‘dshai’, ‘desgi’, and ‘dli’ are found insignificant as having a 0% significance share (PerSigni is ‘0’). The control variables are partially significant, with a 50% share of significance. However, it may be 100% significant at a 10% significance level. The results of Models 3 and 4 are similar in CHECKROB (Table 6). Therefore, the results are robust. Our multiple-model approach also shows similar results in most cases. Hence, it also confirms the robustness of the results (Kanoujiya et al. 2021).

5. Discussion of Results Obtained

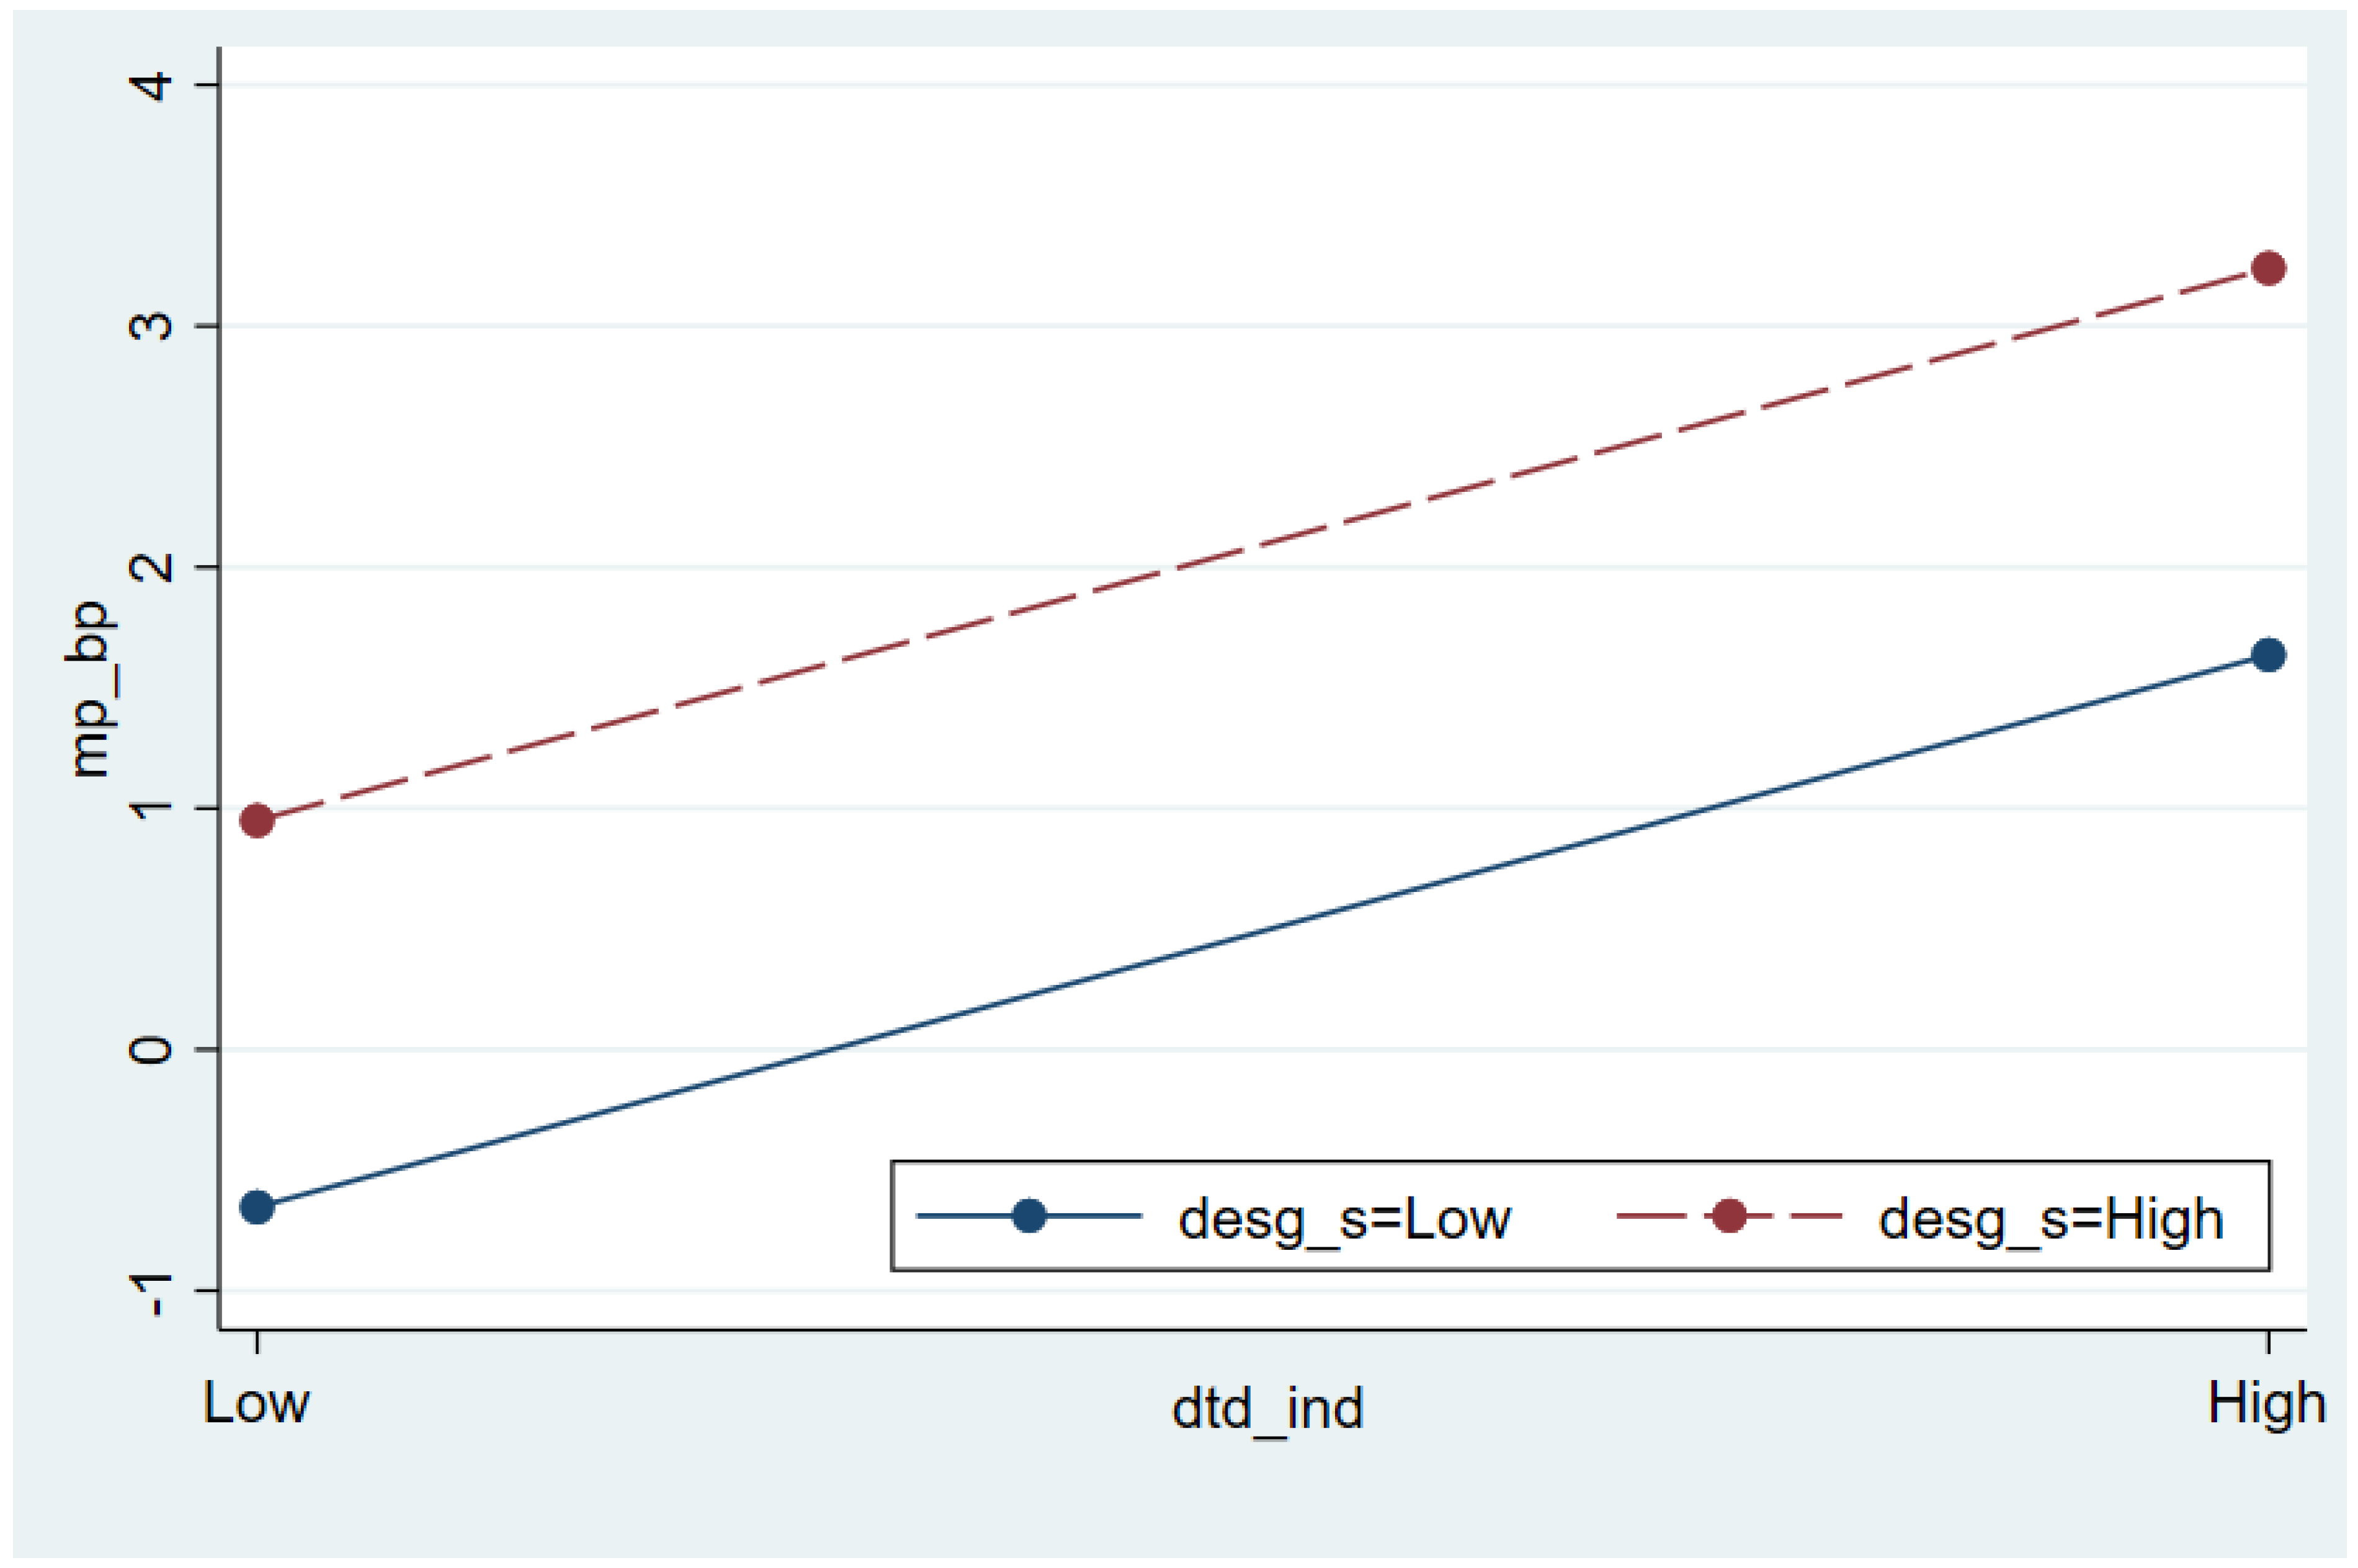
5.1. Conversation over Hypotheses Testing

Hypotheses one and two that TD has linear and quadratic (non-linear) impacts on bank valuation are rejected because the results are insignificant (Table 5). Hypotheses three and four, that TD impacts the valuation under the influence of esgi and shai are accepted as the results are significant at 5% (Table 5) and are consistent in the robustness test (Table 6). Hypotheses three and four empirically prove that TD is positively associated with the valuation of the banks under the influence of the moderators, Environmental, Social, and Governance (esgi) and Shareholder Activism (shai). The non-rejection of the hypothesis implies that TD causes the bank’s valuation to increase positively. It is noteworthy that the positive association of the TD with the value of the bank is there despite controlling for the banks’ assets and sales.
This finding implies that the apprehensions raised in the study are valid. Value is linked to the TD when interacting with moderators such as Environmental, Social, and Governance (esgi) and Shareholder Activism (shai), even though the TD alone may or may not independently support the bank’s valuation. The findings can be construed that the value of banks can be enhanced by artificially doctoring the TD. In contradiction to hypotheses three and four, hypothesis six is again rejected even after TD is moderated with the moderator variable, market power/competition (li), denoting that TD has no impact on the valuation of banks in India under the influence of competition.

5.2. Comparison of the Findings with the Previous Work

No other study in the literature has observed emphasising the impact of TD on the valuation of banks through such a realistic linkage with valuation. Jiao (2011) tries to link TD’s association with value separately to performance. However, no other study in the literature addresses the issue head-on and provides some empirical evidence. However, it is found that the current results are in contrast with the findings of studies supporting TD’s significant influence on valuation (Anam et al. 2011; Sheu et al. 2010). In a similar vein, the study’s findings refute the claim that TD does not influence the value of the firms/banks (Alencar 2005; Banghøj and Plenborg 2008; Azrak et al. 2020). However, the findings of the current study claim that even though the TD alone has no influence (neither linear nor quadratic) association on the valuation of banks but as per Panayi et al. (2021), TD has a positive effect on the bank’s valuation when moderated by the moderators esgi and shai. As no other similar study in the literature has reported similar results, the current study’s findings are novel and ensure a significant contribution to the existing lode of knowledge on the topic.
Transparency and disclosure may be the mechanism for either reducing agency costs or increasing them. In subsequent studies, Salehi et al. (2022) provided empirical evidence that institutional ownership and independent directors strengthened the positive influence of investment efficiency on firm value, while social responsibility growth and shareholder activism reduce the adverse impact of managerial entrenchment on firm risk-taking. Transparency and disclosure give institutional owners, independent directors, and activist shareholders the ability to reduce the information asymmetry that permits managers to benefit themselves at the expense of shareholders.

5.3. Contributions and Practical Implications of the Study

The present study and its findings are unique. It is observed that no study from the literature made efforts to link the association of TD with the market price to the book price. The current study’s findings are added to the empirical evidence available in the literature. These ground-breaking results provide a newer perspective to the shareholders that only disclosures may sometimes not give them the details required. The importance of the moderator variables is underscored.
The study’s findings have a few important implications for managers and policymakers. Managers should avoid exaggerating disclosures because they may add false values that will not last. Such behaviour can backfire and be self-defeating in the long run. As a result, managers should exercise restraint and follow best practices in corporate governance when it comes to disclosures. Similarly, the study’s findings have some serious implications for policymakers. There is mandatory disclosure regulation. However, there are no guidelines or regulations to govern voluntary disclosures. There is no mechanism in place to verify the accuracy of the disclosures.

6. Conclusions

The prime purpose of this study is to determine the relationship between disclosure and bank valuation while controlling for other determinants of value. According to the study, TD is significantly associated with bank valuation, and TD interacts with the moderators, Environmental, Social, and Governance Variables (esgi) and Shareholder Activism (shai). The results are noted to be consistent because they are robust. The study’s findings support the paper’s concern that TD can influence valuation with the help of a moderator. More research is needed to determine whether or not TD is doctored, but the current study found evidence that it is a possibility.
The current study findings are obtained from data from public and private banks in India. The results can also be extended to scheduled banks, but results may vary depending on the situation. This situation is one of the limitations of the study. All three indices of TD, Environmental, Social, and Governance Variables (esgi), and Shareholder Activism (shai) are scored using the unweighted methodology and the weighted methodology. The results may vary from the current; this is the second limitation of the study. In the future, to judge the veracity of the disclosures, studies can be done on considering these issues. In addition, another study can be conducted to distinguish the characteristics of banks that adhere to best practices and those that deviate from the right approach regarding disclosures.

Author Contributions

Conceptualisation: V.M.B. and S.R., Methodology: V.M.B., Software: S.R., Validation: V.M.B., Formal Analysis: S.R., Investigation: V.M.B., Resources: R.A., Data Curation: V.M.B., Writing—Original Draft: V.M.B., Writing—Review and Editing: R.A., Visualisation: S.R., Supervision: V.M.B., Project Administration: S.R. All authors have read and agreed to the published version of the manuscript.

Funding

This research received no external funding.

Data Availability Statement

Data is available from the authors upon request.

Conflicts of Interest

The authors report no conflict of interest.

Appendix A. TD Index (TD)

The current study builds a customised index with four main categories and 102 attributes using the compiled database of the S&P index as the base. The newly built TD index includes a more contemporary set of attributes unnoticed in previous investigations (Patel and Dallas 2002; Aksu and Kosedag 2006) but would be extremely valuable to the stakeholders and hold prominence in the present era. In addition to the three basic categories of the S&P index, the newly constructed index introduced the fourth broad category of “Strategic, Technology, Basel and Website Disclosures,” comprising four sub-categories.

Appendix B. ESG Index (esgi)

Investors have recognised ESG elements as essential indicators for measuring firm valuation and risk management. An emerging group of investors also invest in companies under their value system or ethical principles (Sudha 2015). Investors hesitate to invest in companies that negatively affect society—directly or indirectly. Even though there are different ESG index models available in India, we considered Thomson Reuters’ ten themes to be sub-categories of our index, which is further adjusted and finalised our set of attributes to meet the needs of Indian investors. The initial sample size comprising 34 banks was considered. Three banks were eliminated due to a lack of data for the balanced panel, leaving 31 banks as the final set. The primary source of our data is the annual reports of the official banking website. We referred to sources like RBI for any missing data. The firm’s score was computed using dichotomous scoring.

Appendix C. Shareholder Activism Index (shai)

Shareholders Activism indicates the involvement of shareholders using ownership positions to influence the company’s policy and practices. A shareholder activism index is constructed with six broad categories and 34 attributes, considering corporate governance categories as the database. The SHAI includes a set of attributes unnoticed by the researchers in the literature (Vargas et al. 2018; Shingade et al. 2022) but would be extremely valuable to the shareholders and hold prominence in the present era. A score was calculated using a dichotomous method (taking value 1 if activism does persist and 0 otherwise) from the self-made shareholder activism index.

Appendix D. Lerner Index (li)

Lerner index measures the market power of the banks (Repková 2012; Casu and Girardone 2009; Demirgüç-Kunt and Martínez Pería 2010)
li = ( Price Marginal   cost ) / Price ( or ) L i t = ( p i t q M C t ) p i t q
where, p i t q is the outprice for ith bank at the time ‘t’ and M C t is the marginal cost. The value of the learner index (li) is between 0 to 1, where zero means no market power (maximum competition) and 1 means supreme market power (or no competition) (Ariss 2010).

References

  1. Ahmed, Sheraz. 2015. Determinants of the quality of disclosed earnings and value relevance across transitional Europe. Journal of Accounting in Emerging Economies 5: 325–49. [Google Scholar] [CrossRef]
  2. Aksu, Mine, and Arman Kosedag. 2006. Transparency and disclosure scores and their determinants in the Istanbul Stock Exchange. Corporate Governance: An International Review 14: 277–96. [Google Scholar] [CrossRef]
  3. Alencar, Roberta. 2005. Cost of equity capital and disclosure level in Brazilian companies. Brazilian Business Review 2: 1–12. [Google Scholar] [CrossRef]
  4. Anam, Ousama Abdulrahman, Abdul Hamid Fatima, and Abdul Rashid Hafiz Majdi. 2011. Effects of intellectual capital information disclosed in annual reports on market capitalisation: Evidence from Bursa Malaysia. Journal of Human Resource Costing & Accounting 15: 85–101. [Google Scholar]
  5. Ariss, Rima Turk. 2010. On the implications of market power in banking: Evidence from developing countries. Journal of Banking and Finance 34: 765–75. [Google Scholar] [CrossRef]
  6. Arsov, Sasho, and Vesna Bucevska. 2017. Determinants of transparency and disclosure–evidence from post-transition economies. Economic Research-Ekonomska Istraživanja 30: 745–60. [Google Scholar] [CrossRef] [Green Version]
  7. Azrak, Tawfik, Buerhan Saiti, Ali Kutan, and Engku Rabiah Adawiah Engku Ali. 2020. Does information disclosure reduce stock price volatility? A comparison of Islamic and conventional banks in Gulf countries. International Journal of Emerging Markets 16: 1769–92. [Google Scholar] [CrossRef]
  8. Bajic, Stevan, and Burcin Yurtoglu. 2018. Which aspects of CSR predict firm market value? Journal of Capital Markets Studies 2: 50–69. [Google Scholar] [CrossRef]
  9. Baltagi, Badi H. 2008. Forecasting with panel data. Journal of Forecasting 27: 153–73. [Google Scholar] [CrossRef]
  10. Banghøj, Jesper, and Thomas Plenborg. 2008. Value relevance of voluntary disclosure in the annual report. Accounting & Finance 48: 159–80. [Google Scholar]
  11. Barslund, Mikkel. 2018. CHECKROB: Stata Module to Perform Robustness Check of Alternative Specifications. Copenhagen: University of Copenhagen Press. [Google Scholar]
  12. Baumann, Ursel, and Erlend Nier. 2004. Disclosure, volatility, and transparency: An empirical investigation into the value of bank disclosure. Economic Policy Review 10: 31–45. [Google Scholar]
  13. Berglof, Erik, and Anete Pajuste. 2005. What do firms disclose and why ? Enforcing corporate governance and transparency in central and eastern Europe. Oxford Review of Economic Policy 21: 178–97. [Google Scholar] [CrossRef]
  14. Bhimavarapu, Venkata M., Shailesh Rastogi, and Jagjeevan Kanoujiya. 2022. Ownership concentration and its influence on transparency and disclosures of banks in India. Corporate Governance. [Google Scholar] [CrossRef]
  15. Casu, Barbara, and Claudia Girardone. 2009. Testing the relationship between competition and efficiency in banking: A panel data analysis. Economics Letters 105: 134–37. [Google Scholar] [CrossRef]
  16. Chakroun, Raidi, Hamadi Matoussi, and Sara Mbirki. 2017. Determinants of CSR disclosure of Tunisian listed banks: A multi-support analysis. Social Responsibility Journal 13: 552–84. [Google Scholar] [CrossRef]
  17. Charumathi, Balakrishnan, and Latha Ramesh. 2020. Impact of voluntary disclosure on valuation of firms: Evidence from Indian companies. Vision 24: 194–203. [Google Scholar] [CrossRef]
  18. Damodaran, Aswath. 2007. Information transparency and valuation: Can you value what you cannot see. Managerial Finance 33: 877–92. [Google Scholar] [CrossRef] [Green Version]
  19. Demirgüç-Kunt, Asli, and Maria Soledad Martínez Pería. 2010. A framework for analysing competition in the banking sector: An application to the case of Jordan. World Bank Policy Research Working Paper 23: 1–24. [Google Scholar]
  20. DesJardine, Mark R., Wei Shi, and Zhihui Sun. 2022. Different horizons: The effects of hedge fund activism versus corporate shareholder activism on strategic actions. Journal of Management 48: 1858–87. [Google Scholar] [CrossRef]
  21. Dewi, Rosiyana R. 2020. Building reputation through environmental disclosure. Indonesian Management and Accounting Research 18: 1–16. [Google Scholar] [CrossRef] [Green Version]
  22. Dias, Alexandra. 2013. Market capitalisation and Value-at-Risk. Journal of Banking and Finance 37: 5248–60. [Google Scholar] [CrossRef] [Green Version]
  23. Durnev, Art, Kan Li, Randall Morck, and Bernard Yyeung. 2004. Capital markets and capital allocation: Implications for economies in transition. Economies of Transition 12: 593–634. [Google Scholar] [CrossRef] [Green Version]
  24. Durnev, Art, and E. Han Kim. 2005. To steal or not to steal: Firm attributes, legal environment, and valuation. The Journal of Finance 60: 1461–93. [Google Scholar] [CrossRef] [Green Version]
  25. Fischer, Paul E., and Robert E. Verrecchia. 2004. Disclosure bias. Journal of Accounting and Economics 38: 223–50. [Google Scholar] [CrossRef]
  26. Fosu, Samuel, Collins G. Ntim, William Coffie, and Victor Murinde. 2017. Bank opacity and risk-taking: Evidence from analysts’ forecasts. Journal of Financial Stability 33: 81–95. [Google Scholar] [CrossRef] [Green Version]
  27. Grosman, Anna. 2022. Mitigating financing constraints on investment: Ownership and transparency in Russia. Journal of East European Management Studies 27: 434–61. [Google Scholar] [CrossRef]
  28. Hanifa, Mohammed H., and Hafiz Majdi Ab Rashid. 2005. The determinants of voluntary disclosures in Malaysia: The case of internet financial reporting. Unitar E-Journal 2: 22–42. [Google Scholar]
  29. Hassan, Omaima A.G., Peter Romilly, Gianluigi Giorgioni, and David Power. 2009. The value relevance of disclosure: Evidence from the emerging capital market of Egypt. The International Journal of Accounting 44: 79–102. [Google Scholar] [CrossRef]
  30. Hossain, Mohammed. 2008. The Extent of Disclosure in Annual Reports of Banking Companies: The Case of India. European Journal of Scientific Research 23: 660–81. [Google Scholar]
  31. Hsiao, Cheng. 1985. Benefits and limitations of panel data. Econometric Reviews 4: 121–74. [Google Scholar] [CrossRef]
  32. Hsiao, Cheng. 2007. Panel data analysis—Advantages and challenges. Test 16: 1–22. [Google Scholar] [CrossRef] [Green Version]
  33. Hutton, Amy P., Gregory S. Miller, and Douglas J. Skinner. 2003. The role of supplementary statements with management earnings forecasts. Journal of Accounting Research 41: 867–90. [Google Scholar] [CrossRef]
  34. Jain, Ameeta, Monica Keneley, and Dianne Thomson. 2015. Voluntary CSR disclosure works! Evidence from Asia-Pacific banks. Social Responsibility Journal 11: 2–18. [Google Scholar] [CrossRef] [Green Version]
  35. Jayadev, M. 2013. Basel III implementation: Issues and challenges for Indian banks. IIMB Management Review 25: 115–30. [Google Scholar] [CrossRef] [Green Version]
  36. Jayaraman, Sudarshan, and Joanna Shuang Wu. 2019. Is silence golden? Real effects of mandatory disclosure. The Review of Financial Studies 32: 2225–59. [Google Scholar] [CrossRef]
  37. Jensen, Michael A., and William H. Meckling. 1976. Theory of the firm: Managerial behavior, agency costs, and ownership structure. Journal of Financial Economics 3: 305–60. [Google Scholar] [CrossRef]
  38. Jiao, Yawen. 2011. Corporate disclosure, market valuation, and firm performance. Financial Management 40: 647–76. [Google Scholar] [CrossRef]
  39. Jones, Jeffrey S., Wayne Y. Lee, and Timothy J. Yeager. 2012. Opaque banks, price discovery, and financial instabilit. Journal of Financial Intermediation 211: 383–408. [Google Scholar] [CrossRef]
  40. Kanoujiya, Jagjeevan, Venkata M. Bhimavarapu, and Shailesh Rastogi. 2021. Banks in India: A Balancing Act Between Profitability, Regulation and NPA. Vision. [Google Scholar] [CrossRef]
  41. Kim, Eun-Hee, and Thomas P. Lyon. 2015. Greenwash vs. brownwash: Exaggeration and undue modesty in corporate sustainability disclosure. Organization Science 26: 705–23. [Google Scholar] [CrossRef] [Green Version]
  42. Lang, Mark, Karly V. Lins, and Mark Maffett. 2012. Transparency, liquidity, and valuation: International evidence on when transparency matters most. Journal of Accounting Research 50: 729–74. [Google Scholar] [CrossRef]
  43. Lev, Baruch. 1992. Information disclosure strategy. California Management Review 34: 9–32. [Google Scholar] [CrossRef]
  44. Lev, Baruch, and Stephen H. Penman. 1990. Voluntary forecast disclosure, nondisclosure, and stock prices. Journal of Accounting Research 28: 49–76. [Google Scholar] [CrossRef]
  45. Liu, Shasha, and Robin Sickles. 2021. The agency problem revisited: A structural analysis of managerial productivity and CEO compensation in large US commercial bank. Empirical Economics 60: 391–418. [Google Scholar] [CrossRef]
  46. Longo, Manolina, Matteo Mura, and Alessandra Bonoli. 2005. Corporate social responsibility and corporate performance: The case of Italian SMEs. Corporate Governance: The International Journal of Effective Board Performance 5: 28–42. [Google Scholar] [CrossRef]
  47. Marquis, Christopher, Michael W. Toffel, and Yanhua Zhou. 2016. Scrutiny, norms, and selective disclosure: A global study of greenwashing. Organization Science 27: 483–504. [Google Scholar] [CrossRef]
  48. MendezDa-Silva, Wesley, and Luciana Massaro Onusic. 2014. Corporate e-disclosure determinants: Evidence from the Brazilian market. International Journal of Disclosure and Governance 11: 54–73. [Google Scholar] [CrossRef]
  49. Moreno, Diego, and Tikalo Takalo. 2016. Optimal bank transparency. Journal of Money, Credit and Banking 48: 203–31. [Google Scholar] [CrossRef] [Green Version]
  50. Oktaviani, Rachmawati M., Desy T. Susanti, Sunarto Sunarto, and Udin Udin. 2019. The effect of profitability, tax avoidance and information transparency on firm value: An empirical study in Indonesia. International Journal of Scientific and Technology Research 8: 3777–80. [Google Scholar]
  51. Pae, Suil. 2005. Selective disclosures in the presence of uncertainty about information endowment. Journal of Accounting and Economics 39: 383–409. [Google Scholar] [CrossRef]
  52. Panayi, Evridiki, Konstantinos Bozos, and Gianluca Veronesi. 2021. Corporate governance “bundles” and firm acquisitiveness. Corporate Governance: An International Review 29: 402–26. [Google Scholar] [CrossRef]
  53. Patel, Sandeep A., and George S. Dallas. 2002. Transparency and Disclosure: Overview of Methodology and Study Results-United States. SSRN 422800. Available online: http://repository.binus.ac.id/content/f0024/f002455955.pdf (accessed on 18 March 2020).
  54. Rashed, Ahmed, Ebitihj El-Rahman, Ezra Isamil, and Doaa Abd El-Samea. 2018. Ownership structure and investment efficiency: Evidence from Egypt. International Journal of Accounting and Financial Reporting 8: 1–22. [Google Scholar] [CrossRef]
  55. Rastogi, Shailesh, and Jagjeevan Kanoujiya. 2022. Does transparency and disclosure (T&D) improve the performance of banks in India? International Journal of Productivity and Performance Management. [Google Scholar] [CrossRef]
  56. Rastogi, Shailesh, Rajani Gupte, and R. Meenakshi. 2021. A holistic perspective on bank performance using regulation, profitability, and risk-taking with a view on ownership concentration. Journal of Risk and Financial Management 14: 111. [Google Scholar] [CrossRef]
  57. Repková, Iveta. 2012. Market power in the Czech banking sector. Journal of Competitiveness 4: 143–55. [Google Scholar] [CrossRef]
  58. Salehi, Mehdi, and Hussein Alkhyyoon. 2022. The relationship between managerial entrenchment, social responsibility, and firm’s risk-taking and shareholders’ activity. Social Responsibility Journal 18: 1035–49. [Google Scholar] [CrossRef]
  59. Salehi, Mahdi, Bahman Jamalikazemini, and Shayan Farhangdoust. 2018. Board compensation and disclosure quality: Corporate governance interference. Contaduría y Administración 63: 1–30. [Google Scholar] [CrossRef]
  60. Salehi, Mahdi, Grezgorz Zimon, Avinash Arianpoor, and Fatemeh Eidi Gholezoo. 2022. The impact of investment efficiency on firm value and moderating role of institutional ownership and board independence. Journal of Risk and Financial Management 15: 170. [Google Scholar] [CrossRef]
  61. Sampong, Frank, Na Song, Kingsley Osei Boahene, and Kwame Ansong Wadie. 2018. Disclosure of CSR performance and firm value: New evidence from South Africa on the basis of the GRI guidelines for sustainability disclosure. Sustainability 10: 4518. [Google Scholar] [CrossRef] [Green Version]
  62. Sengupta, Partha, and Suning Zhang. 2015. Equity-based compensation of outside directors and corporate disclosure quality. Contemporary Accounting Research 32: 1073–98. [Google Scholar] [CrossRef]
  63. Sheu, Her-Jiun, Huimin Chung, and Chih-Liang Liu. 2010. Comprehensive disclosure of compensation and firm value: The case of policy reforms in an emerging market. Journal of Business Finance and Accounting 37: 1115–44. [Google Scholar] [CrossRef] [Green Version]
  64. Shingade, Sudam, Shailesh Rastogi, Venkata M. Bhimavarapu, and Abhijit Chirputkar. 2022. Shareholder Activism and its impact on profitability, return, and valuation of the firms in India. Journal of Risk and Financial Management 15: 148. [Google Scholar] [CrossRef]
  65. Stein, Jeremy C. 2003. Agency, information, and corporate investment. In The Handbook of the Economics of Finance. Edited by George M. Constantinides, Milton Harris and Renee M. Stultz. Amsterdam: Elsevier, pp. 111–65. [Google Scholar]
  66. Sudha, S. 2015. Risk-return and volatility analysis of Sustainability Index in India. Environment, Development and Sustainability 17: 1329–42. [Google Scholar] [CrossRef]
  67. Taylor, Joseph, Joseph Vithayathil, and Dobin Yim. 2018. Are corporate social responsibility (CSR) initiatives such as sustainable development and environmental policies value-enhancing or window dressing? Corporate Social Responsibility and Environmental Management 25: 971–80. [Google Scholar] [CrossRef]
  68. Vargas, Luiz Henrique F., Patricia M. Bortolon, Lucan A. Barros, and Ricardo P. Leal. 2018. Recent activism initiatives in Brazil. International Journal of Disclosure and Governance 15: 40–50. [Google Scholar] [CrossRef] [Green Version]
  69. Vishwanath, Tara, and Daniel Kaufmann. 1999. Towards Transparency in Finance and Governance. Available online: https://ssrn.com/abstract=258978 (accessed on 5 June 2020). [CrossRef]
  70. Wagner, Wolf. 2007. Financial development and the opacity of banks. Economics Letters 97: 6–10. [Google Scholar] [CrossRef]
  71. Waymire, Gregory. 1984. Additional evidence on the information-content of management earnings forecasts. Journal of Accounting Research 22: 703–18. [Google Scholar] [CrossRef]
  72. Wibowo, Agus Adi, Didit Supriyadi, and Nunung Nurhasanah. 2022. Pengaruh Current Ratio Terhadap Harga Saham dengan Price to Book Value sebagai Variabel Intervening pada Perusahaan Terklasifikasi SIC-3711 yang Terdaftar di NYSE Periode 2016–2020. Business Innovation and Entrepreneurship Journal 4: 108–17. [Google Scholar] [CrossRef]
  73. Wooldridge, Jeffrey M. 2015. Introductory Econometrics: A Modern Approach. Boston: Cengage Learning. [Google Scholar]
  74. Xu, Shen, Bichao Yin, and Chungjie Lou. 2022. Minority shareholder activism and corporate social responsibility. Economic Modelling 116: 106045. [Google Scholar] [CrossRef]
  75. Zhang, Yi, Gin Chong, and Ruixin Jia. 2019. Fair value, corporate governance, social responsibility disclosure and banks’ performance. Review of Accounting and Finance 19: 30–47. [Google Scholar] [CrossRef]
Figure 1. The conceptual model was adopted. Source: Authors compilation. Note: Strategy adopted for the study is portrayed in Figure 1.
Jrfm 15 00612 g001
Figure 2. Interaction Graph 1.
Jrfm 15 00612 g002
Figure 3. Interaction Graph 2.
Jrfm 15 00612 g003
Table 1. List of Variables.
SNVariableTypeSymbolDefinitionCitations
1Financial PerformanceDVmpbp The bank’s financial performance is proxied by the performance ratio, measured as the market price ratio to the book price (mpbp) of the bank’s share. Rastogi et al. (2021), Wibowo et al. (2022)
2Transparency and DisclosuresEVTdiIt represents the transparency and disclosure level of a bank, and it is computed by developing a TD index as discussed in Appendix A, Appendix B, Appendix C and Appendix D. Arsov and Bucevska (2017), Rastogi and Kanoujiya (2022)
3Shareholders’ ActivismMVShaiIt shows the degree of shareholders’ activism practices in a bank. Please see the detail for the measurement of SHA index (shai) formation in the Appendix A, Appendix B, Appendix C and Appendix D. DesJardine et al. (2022), Xu et al. (2022)
4Environmental, social, and governanceMVEsgiIt shows the level of ESG engagement in a bank. An ESG index is developed for measuring ESG practices in a bank. Kanoujiya et al. (2021), Rastogi et al. (2021)
5Competition (Lerner index) MVLiIt shows the competition level of banks in India. The Lerner index is used to quantify the competition. Higher values show the greater monopoly power of a bank. See Appendix A, Appendix B, Appendix C and Appendix D. Kanoujiya et al. (2021)
6AssetsCVln_AssetsIt is the total amount (in INR) of assets in a bank. The log value (natural) was taken due to extreme value inconsistencies. Rastogi et al. (2021), Jayadev (2013)
7SalesCVln_SalesIt refers to the bank’s value. The amount (in INR) of sales is taken in INR. The log value (natural) is taken for extreme value inconsistencies. Jayadev (2013), Dias (2013)
Note: CV, MV, EV, and DV refer to the control variable, moderating variable, explanatory variable, and dependent variable, respectively. The interaction term is taken as EV*MV to examine the interaction effect under moderating variable.
Table 2. Descriptive Statistics.
VariablesMeanSDMinMax
mpbp1.2931431.277247012.11
tdi0.5020870.09644500.843137
shai0.5298620.10525200.714286
esgi0.271820.06480700.435484
li−0.351296.49438−51.20251.875981
Assets307,270.8446,877.33229.693,680,914
Sales20,564.0738,199.2650321,006.7
Note: Mean, SD, Min, and Max are mean value, standard deviation, minimum and maximum, respectively.
Table 3. Correlation Matrix.
VariablestdiDtdidtdi2dshaidesgidlidtdi_dshaidtdi_desgidtdi_dliln_Assetsln_Sales
tdi1.0000
dtdi1.0000 *1.0000
(0.0000)
dtdi20.0770.0771.0000
(0.1762)(0.1762)
dshai0.4469 *0.4469 *−0.05471.0000
(0.0000)(0.0000)(0.3375)
desgi0.3711 *0.3711 *0.01280.1261 *1.0000
(0.0000)(0.0000)(0.8225)(0.0264)
dli0.2315 *0.2315 *−0.08980.1551 *0.1682 *1.0000
(0.0000)(0.0000)(0.1144)(0.0062)(0.003)
dtdi_dshai−0.0718−0.07180.8293 *−0.2966 *−0.1552 *−0.10111.0000
(0.2075)(0.2075)(0.0000)(0.0000)(0.0062)(0.0754)
dtdi_desgi0.01850.01850.8584 *−0.1710 *−0.0832−0.1131 *0.8470 *1.0000
(0.7455)(0.7455)(0.0000)(0.0025)(0.1441)(0.0466)(0.0000)
dtdi_dli−0.1349 *−0.1349 *0.1087−0.1156 *−0.1174 *−0.9856 *0.09620.1287 *1.0000
(0.0175)(0.0175)(0.0559)(0.0419)(0.0388)(0.0000)(0.0908)(0.0234)
ln_Assets0.4760 *0.4760 *−0.02870.3619 *0.05490.3203 *−0.1647 *−0.0473−0.2860 *1.0000
(0.0000)(0.0000)(0.6147)(0.0000)(0.3357)(0.0000)(0.0036)(0.4062)(0.0000)
ln_Sales0.5193 *0.5193 *−0.01590.3768 *0.09810.2800 *−0.1557 *−0.0166−0.2409 *0.8255 *1.0000
(0.0000)(0.0000)(0.7806)(0.0000)(0.0848)(0.0000)(0.006)(0.7714)(0.0000)(0.0000)
Note: * represents a significant correlation coefficient at 0.05.
Table 4. Results of the Endogeneity Test.
Model 1
(Base Model)
Model 2
(Quadratic Model)
Model 3
(Interaction Model)
Model 4
(Interaction Model)
Model 5
(Interaction Model)
Durbin Chi-26.2653 * (0.0123)5.38234 * (0.0203)0.002612 (0.9592)0.333322 (0.5637)7.46166 * (0.0063)
Wu-Hausman Test6.29426 * (0.0127)5.38984 * (0.0210)0.002547 (0.9598)0.325377 (0.5689)7.4743 * (0.0067)
Note: The value in () is the p-value. * Shows a significant value at a 5% significance level. DV represents the dependent variable considered for the study.
Table 5. Result (Static Model).
DV: mp_bpModel 1
(Base Model)
Model 2
(Quadratic Model)
Model 3
(Interaction Model)
(Robust)
Model 4
(Interaction Model)
(Robust)
Model 5
(Interaction Model)
Coeff.SE.Coeff.SE.Coeff.SE.
tdi−75.2176.5
dtdi 5.31 *0.3173.96 *0.4314.543.18
dtdi2 109.289.1
dshai −0.2330.477
desgi 4.13 *1.05
dli 9.6026.77
dtdi_shai 5.94 *1.65
dtdi_esgi 9.78 *3.47
dtdi_dli 63.56177.42
ln_Assets1.0202.82−0.100.211−0.24 *0.04−0.21 *0.050.412.04
ln_Sales2.0443.990.310.170.22 *0.040.22 *0.040.470.92
Cons.9.49522.1−1.271.862.11 *0.741.87 *0.77−16.8253.83
BP-test (Random effect) 0.00 (1.0000)0.00 (1.0000)0.00 (1.0000)0.00 (1.0000)0.00 (1.0000)
Hausman Test4.95 (0.1752)1.59 (0.6609)5.48 (0.3596)6.60 (0.2522)5.83 (0.3233)
Wald test for Heteroscedasticity 19.04 (0.0398) *18.92 (0.0053) *
Chi- square1.17 (0.7601)7.88 (0.0485) *1356.24 (0.0000) *3283.73 (0.0000) *1.24 (0.9413)
Wooldridge Autocorrelation Test AR (1) 0.800 (0.3943)0.316 (0.5879)
Note: Wald test of heteroscedasticity has the null of no heteroscedasticity. Wooldridge test of autocorrelation in the panel has the null of no autocorrelation (with 1 lag). Robust estimates are estimated due to significant Heteroscedasticity and Autocorrelation. DV is mpbp ( ). * sig at 5%.
Table 6. CHECKROB (for static models).
MaxMinMeanAvgSTDPercSigniPerc+Perc−AvgTObs
Core var (Model 3)
dtd_ind5.535935.1953445.4067210.7150161107.5676734
dshai−0.10074−0.34168−0.216960.7403870010.293054
i_dtd_ind_dsha_ind6.3426665.8814616.1440443.6602060101.6784354
ln_Assets−1.48 × 10⁻⁸−8.90 × 10⁻⁷−4.53 × 10−72.41 × 10−70.5011.4130622
ln_Sales1.16 × 10−52.48 × 10−67.05 × 10−62.82 × 10−60.5102.2041062
Core var (Model 4)
dtd_ind5.7878334.9933715.3531140.7674971107.0102214
desgi−0.10074−0.34168−0.216960.7403870010.293054
i_dtd_ind_desg_s8.311767.1569847.8166956.5466990101.1937924
ln_Assets−0.05713−0.24755−0.152340.0723610.5011.9106442
ln_Sales0.219260.0505020.1348810.0641120.5101.9090642
Note: Core var Embodies Core variables. The overall Coefficient regression’s Max, Min, and Mean values are its maximum, minimum, and Man values. Average Slandered Deviation, or AvgSTD. The percent of a regression where the coefficient is significant is known as PercSigni. Perc+ and Perc- represent the proportion of regressions with positive and negative coefficients, respectively. AvgT stands for the average T-value. Obs measures of how frequently a variable is utilised in the regression.
Publisher’s Note: MDPI stays neutral with regard to jurisdictional claims in published maps and institutional affiliations.

