Abstract
The modern credit market is actively changing under the influence of digitalization processes. Some of the drivers of these changes are financial companies that carry out, among other things, online lending. Online lending is objectively focused on short-term small loans, both payday loans (PDL) and short-term loans for SMEs. In our research, we applied a special segmentation of borrowers based on the whale-curve approach. Such segmentation leads to four segments of borrowers (A, B, C, and D) which are characterized by the specific features of profitability, risk, recurrent loan granting, and others. The model of optimal correspondence between “risk–return-marketing efforts” is elaborated in the mentioned segments. Marketing efforts are considered in the context of the optimization of the marketing-budget allocation. Our approach was essentially grounded in special scoring-tools that allow multi-layer assessment. A scheme of assessment of profitability, risk, and marketing-resources allocation for borrower’s inflow is constructed. The results can be applied to the customer relationship management (CRM) of online non-banking lenders.
1. Introduction
Non-banking lenders are actively developing online loan-granting. This is primarily focused on short-term loans, such as payday loans, micro-enterprises loans, or quite often short-term loans for SMEs. The processing time of the application is a very important competitive advantage in online lending. The use of different information about the borrower (both traditional and alternative data) enhances the quality of the assessment of creditworthiness. Aggregation of the necessary information should also take a very short time. This all indicates the relevance of the maximum automation of the decision-making processes on the loan application.
Credit decision-making systems need to take into account many important components. This includes verification of the borrower, assessment of creditworthiness, assessment of potential profitability, and what marketing strategy to apply. By its nature, component-by-component optimizations may give rise to diverging solutions. For example, low-risk borrowers also show low returns. Moreover, a frequent problem (which the authors encountered in the practice of advising creditors) is a certain “detachment” of marketing strategies from the indicators of profitability and risk to customers. Marketing often focuses on certain socio-demographic and behavioral characteristics of borrowers. Indeed, many of these parameters call for effective differentiation of potential customers. For example, these are socio-demographic characteristics of age, place of residence and type of activity, etc. When handling behavioral characteristics, credit history is certainly key. Quite often there are cases when the borrower pays one creditor and does not pay another, having several loans at the same time.
However, in this segment of online lending, such parameters often cannot provide a high level of predictability for such indicators as CLV (customer lifetime value). Indeed, payment discipline may characterize a borrower as ideal in terms of repayment. However, from the CLV aspect, it can show a low effect. On the contrary, a high-risk borrower can generate a high level of CLV by constantly running late, and by using extensions. Recurrent loans are one of the important characteristics of the short-term lending segment, and payments from them form addends in the CLV formula.
To realize our vision, we used as a starting point the segmentation of the customer credit portfolio based on the whale curve. This approach fits very well with the CLV borrowers in the PDL segment. Then we constructed multi-layer scorings which assessed the probabilities of the applicant belonging to a particular part of the whale curve. For each of the segments, the analysis focused on the estimation of risk-return corresponding and marketing expenses, which were considered through the so-called “account-based approach” (Insider Intelligence 2022).
The main task that we analyze in this article is the following. A potential borrower who applies for a short-term loan (we applied data analysis from PDL loans) is evaluated according to the characteristics of each part of the whale curve. On this basis, an integral (considering risk and potential profitability) marketing solution is determined.
The scoring approach is the methodological basis for the assignment of a borrower to a particular segment, arising from the whale curve. The scoring approach is classically used to assess the level of credit risk. The application of scoring approaches in our research presents a multi-estimation of the borrowers belonging to different whale curve segments. The correctness of such an application would imply the use of a generalization such as the Softmax function. One of the main problems is the estimation of marketing costs for different borrowers.
Integrating the above-mentioned approaches, we have constructed a scheme for credit-decision rules, which provides the optimization of triple “risk–return-marketing efforts”.
The results of the research focus on customer relationship management (CRM) of online non-banking lenders in the following ways. The proposed optimization logic involves applying results to marketing-budget allocation. This marketing funding is directed to those types of customers who correspond to higher levels of CLV. Appling marketing in wider (financial) forms facilitates the strengthening of CRM.
Formed marketing strategies are focused on offering more favorable lending conditions to the borrower. This is the approach that can be implemented in CRM. The proposed model provides the automation of borrower type identification and associated CRM strategy application.
2. Materials and Methods
2.1. Related Works
The problem of customer relationship management and profitability analysis has been studied for banks by many scientists. In particular, the paper (Harvard Business Review Analytic Service 2019) investigates a comparison of current approaches to interact with customer realizing by traditional financial institutions and by fintech companies. Pobric (2014) focuses on existing client segmentation as a valuable marketing approach. Such segmentation is shown to be a strong analytical instrument as a pillar for elaborating effective marketing strategies. The machine learning approach for customer segmentation is used by (Storbacka 1997) and (Monil et al. 2020). Authors (Babenko et al. 2021), consider CRM as the process of acquiring, satisfying, retaining, and growing profitable customers.
Lending in the aspect of financial market development is discussed in (Patalano and Roulet 2020). To eliminate the shortcomings of the credit system, it is proposed to use the optimal combination of macroprudential and activity-based instruments in non-bank lending. An analysis of a random sample of the credit market during 2010–2015 (Anandanatarajan 2019) showed that non-bank lending is widespread, with 32% of all loans provided by non-banking institutions. Non-bank borrowers are more volatile than bank borrowers. Credit cyclicality for banks and non-banking institutions is studied by (Chernenko et al. 2019). The non-bank lending impact on bank efficiency is discussed in (Fleckenstein et al. 2020). The authors evidenced that increased non-bank financial intermediation might result in a reduction in bank profitability. The asset-pricing model for both bank and non-bank financial institutions was simulated by (Kondova and Bandyopadhyay 2019). The structural changes in global financial intermediation were considered in (Patalano and Roulet 2020). The authors demonstrate the rise of debt and non-bank credit intermediation
Distinctions in dealing with information scarcity between a bank and non-bank financial institutions were analyzed (d’Avernas et al. 2020). The influence of local information on pricing was also investigated (Han 2017). The authors came to the same conclusions as previous researchers.
Experience of nonbanking lending from different countries is presented in the following papers: (Bédard-Pagé 2019)—Canada, (Lee 2018)—Korea, (Rateiwa and Aziakpono 2017)—Egypt, Nigeria, and South Africa, (Vasileva 2019)—Bulgaria, (Soukal et al. 2021)—Czech Republic, (Tan 2019)—Asia and Latin America.
The roles of information technology in customer relationships and relationship spheres are present in an integrated manner (Eichholtz et al. 2020).
Our research is concerned with the trend of fintech development. The development of fintech is discussed widely in the academic literature (Caputo et al. 2019; Hacioglu 2019; Guryanova et al. 2020; Opare and Kim 2020; Yang et al. 2021). More narrowly, there are academic publications for the digitization of lending (Harvard Business Review Analytic Service 2019; Chappell et al. 2018). Moreover, this trend implies a digital approach to the transformation of business models involving the digital implementation of business processes (Fogoros et al. 2020).
In this context, our results are very much in accordance with the formation of a completely fintech (non-human) model of online non-bank lending.
2.2. Research Methodology
One of the initial assumptions in our research concerns that lender supplies only one product (type of loan). Another approach can be focused on the diversity of products which describes, as an example, in (Smith 1995). The research methodology was elaborated as a framework for designing the linkage of some well-developed concepts. Specifically, our elaboration included the concept of risk–return correspondence, the essence of which is to cover additional risk with an additional return (risk premium). This is shown clearly in the transition from the criterion of risk minimization to the optimization of the risk–return ratio (based on the maximization of the aggregate income). Among other things, this approach forms one of the characteristic features of non-bank lending. Bank lending typically emphasizes default risk-minimizing or limiting its level (establishing a maximum acceptable probability of default).
Another concept that we used was CLV. The task before us can be modeled very well within the framework of this concept. This is due to the specificity of the loans under consideration. Namely, their short term. As a result, CLV is generated by borrowers which take repeated loans. An additional element of it is the possibility of default on repeat loans. We substantiated the approach to incorporating the default of repeated loans into the CLV model.
The construction of a decision-making model and the optimization of risk–return-marketing efforts assume a relatively large portfolio of loans, containing enough informative statistics to calculate parameters. The starting step is the procedure of the segmentation of borrowers in the portfolio. We used the Storbacka approach, the graphical visualization of which is the whale curve. The typical curve for PDL lending is shown in Figure 1. The analogical curve for micro-enterprises is similar, but not so convex.

Figure 1.
Typical view of whale curve for PDL lending.
The whale curve illustrates the segmentation of borrowers based on cumulative income over a particular period (a quarter or a year). There are 4 basic segments of borrowers: A, B, C, and D. Their description is given in Table 1. To construct the curve, borrowers are ordered by the income brought in during the period under consideration.

Table 1.
Segments description.
Let us consider economic analysis A, B, C, and D in the context of the triple “risk–return-marketing”.
Segment A. This segment includes borrowers who return the body of the loan typically with an overpayment. This is due to two behavioral characteristics. The first is that these borrowers use credit rollover and pay penalties for late repayment of credit funds. The second is that such clients actively use recurrent loans (3+ credits per quarter or more). Collectively, this can generate large sums over a quarter. They are characterized by a high level of risk represented in their credit history.
Segment B. This segment is characterized by a relatively rare (as an example, 1–2 times per quarter) taking out loans. Their payments are in full and on time. As you can see, the whale curve for this segment is growing very slowly. This is because the payments from them include only interest payments. Such borrowers rarely use prolongation. They constitute the main part of the loan portfolio in terms of issued amounts. They are characterized by a low level of risk, represented by a good credit history.
Segment C. This segment is characterized by borrowers who pay only part of the loan amount. Debt is usually due to the inability to make payments due to a lack of money. Along with that, the contact data of the borrowers demonstrates a certain desire to repay the loan in the future. Our stats indicate that the average return is 45–55% of the lending body.
Segment D. Borrowers do not make any payments. Among such borrowers is a high percentage of those who did not originally plan to make payments.
Consider the backgrounds for the relationship between risk and return and the possible marketing strategies within the frameworks of the whale-curve-generated segments. The general logic is presented in Table 2.
Table 2.
Risk, return, and marketing in segments.
To explain the logic of marketing strategies based on Table 2, we can see that borrowers in segment A generated high payments. This income is increased logically through the offer of repeated loans with increased amounts. This strategy is very effective for several reasons. The main reason is income generation. The second is hedging the risk of default on recurrent loans. Indeed, if the borrower overpaid a lot on several recurrent loans, the default on the next loan can be covered by the income from the previous loan, i.e., CLV on the borrower will be positive. The main logic of marketing strategy A is to increase CLV and decrease the churn rate.
The marketing strategy for borrowers of type B shows that they pay fairly and squarely and that it is possible to move in two directions: recurrent loans and increasing loan amounts. Both strategies are poor. However, a more effective strategy is concerned with the proposal of recurrent loans with a discount. The low effectiveness of the loan amount can be explained by the fact that they take out credit on a clearly defined purchase.
The marketing strategies used are two-sided. The first side is individual CLV increasing. This is more useful for borrowers from segment A because they are in tune with overpayment. The second side is concerned with the level of the segment’s income. A high increment in an individual CLV may depart from the low increment in CLV for B because the number of borrowers in segment B is greater.
Borrowers from segments C and D are not attractive, and if D were to be precisely excluded, then C could be used as a strategy for granting a very low initial amount, in order not to lose a client.
The second part of our research methodology corresponds to a scoring-based approach for classifying input borrowers at the whale curve segmentation. Let us consider the borrower who applies to the lender for a short-term loan. The challenge is to assess him according to the segments (A, B, C, and D). The scoring approach in the aspect of the probabilistic estimation of the borrower’s belonging to the specified segments is complex. Firstly, the segments are characterized by risk, and scoring differentiation is significant in terms of risk. Secondly, the segments are distinguished by the profitability of the borrower. Thirdly, the segments differ in the application of marketing approaches to their clients. Thus, scoring can be used as a basis for correspondence between risk, return, and marketing approaches.
According to the approach, it is necessary to construct scoring functions of the client’s membership in the segments. That is, we mean to apply the procedure of the construction of a linear scoring function, based on the division of events “borrower belongs to segment A” and “borrower does not belong to segment A” (similar to segments B, C, D). In this case, it should be noted that for C and D this problem strongly correlates with the task on the construction of classical credit-risk scoring. The difference will be that borrowers in D do not pay, and borrowers from C pay something. The advantage of this approach is that by using certain additional services in lending, it is logical to test them on C (in addition to A, B). But it is accurate not to apply them to D because D borrowers in large part did not intend to repay the loan in the first place. In the classical construction of risk scoring, borrowers of class C and D are not separated (they are considered “bad”, collectively).
Thus, in line with our approach, 4 scoring models should be constructed by one of the well-known techniques (the most famous is logistic regression). Each scoring numerically estimates the level of the corresponding borrower against the “borrower types” of segments A, B, C, and D.
—is the scoring model which differentiates borrowers from segments “A” and “Not A”. This is a tool for the prediction of a potential client belonging to segment “A”.
—is the same for segments “B” and “Not B”.
—is the same for segments “C” and “Not C”.
—is the same for segments “D” and “Not D”.
We used traditional and alternative indicators for scoring model construction. By traditional indicators, we have in mind, in this case, those that are directly related to lending and social demographic characteristics (see Table 3, below). By the term “alternative” we are referring to characteristics from telecoms, behavior on the creditor’s website when applying for a loan, and others.
Table 3.
Information values for traditional characteristics of scoring models.
The characteristics of borrowers from different segments diverge significantly. Table 3 demonstrates information values (IV) for traditional characteristics from the analyzed database for PDL.
One of the results of our research is that for traditional characteristics, borrowers from segments A and D indicate higher informational values, and from segments B and C, lower values.
Using four scoring functions, each borrower i (making a credit request) produces a four-dimensional vector Considering the function of the probability of belonging to the segment (which is an integral part of the scoring model), we can obtain a vector of probabilities belonging to the segments: . Each term of this vector indicates the probability of belonging to the relevant segment. However, this vector cannot be understood as a probability distribution of the accessory into segments as a whole, because their sum is not equal to 1. Therefore, we applied the SoftMax tool and received a vector of probabilities:
This approach aligns the borrower with the vector of probabilities of belonging to segments.
It is necessary to note that we tested different approaches to scoring-construction (such approaches are presented in (Kaminskyi and Nehrey 2021). These were random forest (RF), eXtreme Gradient Boosting (XGBoost), and some others. However, we selected logistic regression because it is easier to implement and interpret, and very efficient for training.
3. Results
3.1. Expected Return Analysis and Triad “Risk–Return-Marketing” Optimization
Based on the estimation of the borrower using the probabilities vector it is possible to put in place the indicator of the expected return of the borrower. To do this, it is necessary to estimate the average return of the borrowers in each of the segments A, B, C, and D for a certain period, (for example, 1 quarter for PDL or 1 year for short-term loans for SME). If they are designated as , , , , then we can receive the mapping:
The first proposed approach is to apply for credit decisions. Specifically, borrower i should have a loan granted when condition takes place. Taking into account the fact that segment A corresponds to 20% of borrowers, which demonstrate higher profits, it is logical to divide the range of into three parts: (1) 20% higher values consider the borrower potentially belongs to segment A. (2) Other borrowers with but not in segment A correspond to segment B. (3) Inequality indicates potential borrowers as representatives of C and D segments.
Marketing efforts are logically concentrated on borrowers with .
It is necessary to note that there are differences in the credit decisions of this approach in comparison with the (classical) cut-off approach. The main difference is that the approach based on criterion is more adequate for profit-generation management (which is expressed in money, not in percentages). At the same time, the cut-off-based approach tends to return management (expressed in percentages). We provide the grounding of it using the calculation parameters , , , on the database. The following values were obtained: , . Four cut-off point variants were used for comparison: (, (, (, ( First of all, by constructing a pdf for returns with these cut-off points and for condition , we obtain a comparison of the type presented in Figure 2. As we can see, pdfs for cut-off strategies are placed on the right and, correspondingly, the average values of returns are higher. The leftmost graph follows the approach , and average values of it are 15.53%. Average values for corresponding distributions of cut-off variants are 42%, 36%, 33%, and 27%.
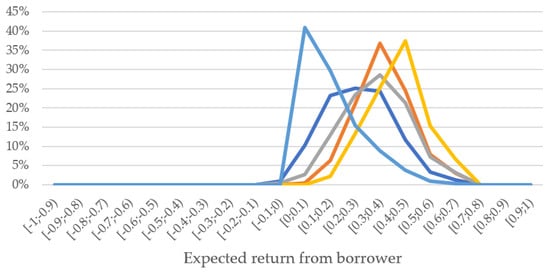
Figure 2.
Comparison of approach and cut-off approach.
However, on the other hand, if we consider this comparison from the profit point of view, we find the reverse situation. The graph in Figure 3 illustrates the percentage of profits of cut-off strategies in comparison with the profit at the strategy. The basic explanation lies in the high volume of rejected borrowers with positive expected returns; that is, the percentage of rejected borrowers who have a positive expected return varies from 70% to 95%. This means that cut-off strategies lose many good borrowers.

Figure 3.
Correspondence between expected returns and expected profits.
The economic nature of this difference lies in the fact that the approach is based on covering the risk by high returns, and the classical approach is based on bad-rate fixation. Here is the display of the significance of the differences between short-term non-banking lending and classical banking lending. The fact is that in bank lending the interest rate is relatively moderate, and there are no effects of repeated loans in the short term and overpayment. At the same time, in the segment of short-term loans, especially PDL, there are huge overpayments (which sometimes exceed the amount of credit) and recurrent loans.
Optimization procedures in the triad “risk–return-marketing” context are as follows:
Segment A: Marketing strategy which increases returns from borrowers from this segment. First, focus on recurrent loans and decrease churn rate.
Segment B: Marketing strategy which focuses on repeated loans and increasing credit amount.
Segment C: Risk management strategy to improve procedures of debt repayments.
Segment D: Risk management strategy based on constant improvement of verification procedures, the credit score (for new and recurring borrowers), and other risk-management tools.
The effectiveness of marketing strategies can be assessed through a sensitivity analysis, by analyzing the results of income gains when changing parameters , , , . It is logical to use deviations within 10%, not more. Because deviations of some parameters of more than 10% can cause essential changes in other parameters. The search for an optimal strategy, therefore, involves finding the option of maximizing income. In our case, this appears as shown in Figure 4.
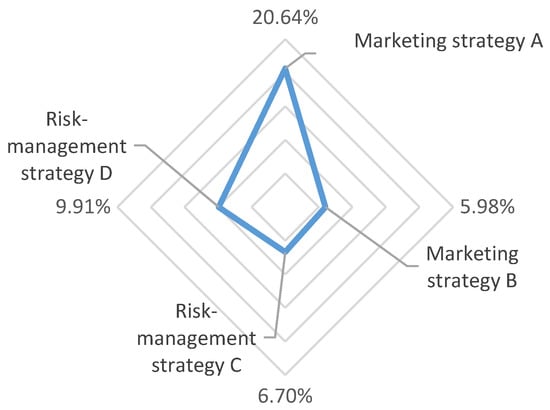
Figure 4.
Estimation of profit-increasing by sensitivity analysis.
The prioritization of strategies is as follows:
- (1)
- The increasing of segment A profitability;
- (2)
- Management risk improvement in segment D;
- (3)
- The improving management risk in segment C;
- (4)
- The increasing of segment B profitability.
As you can see, the most problematic for increasing profitability is segment B, which includes the largest number of borrowers.
3.2. The CLV Based Optimization Based for Repeated Loans
One of the main elements of profitability in the short-term lending space is the effect of recurrent borrowing. When considering recurrent loans from the point of view of our approach, it is logical to adapt the classic marketing concept of CLV to the loan-granting process. The adaptive element is the fact that the last element in the formula CLV can be either positive or negative. This is due to the fact that after taking a few recurrent loans, the borrower may be in partial or full default on the new credit. This loan will be the last (in the time-window under consideration) for such a borrower from this lender. In this case, CLV can be either positive or negative, and the borrower itself can be in A, B, or C.
Optimization procedures are determined by the profit from successive loans, relative to the default and churn rates after each granted loan. Recurrent borrowing generates components of CLV in the probabilistic time-proposition. The CLV for segments A and B is similar to the classical form, and the CLV for C and D has the last negative term. The analysis of recurrence loans reveals a fundamental difference between segments A and B, which is presented in Figure 5. Segment B consists of 75% of cases where the borrower has taken out only one loan.

Figure 5.
Comparison of recurrent loan-distribution for segments A and B.
The elaboration of the optimization model “risk–return-marketing” for recurrent loan-granting involves our structuring of profits/losses for classes “second loan”, “third loan”, and so on. Each class can be divided into four subclasses: (1) borrowers from the A segment; (2) borrowers from the B segment; (3) borrowers from modified segments , …; (4) borrowers from modified segments , …. These modified segments involve borrowers which go to partial (segment C) or full (segment D) default exactly on 2, 3, … loan. We consider CLV function segments A + B, an analog of CLV for (it will be adding losses from each class, “second loan”, “third loan”, and so on). Then we combine profits and losses and construct CLV for these values. The resulting CLV we constructed by combining results from the abovementioned subclasses. The results are illustrated in Figure 6 for the analyzed database for loans ordered 2, …, 7 (this is considered during a certain period. In our example, this period represents a quarter).
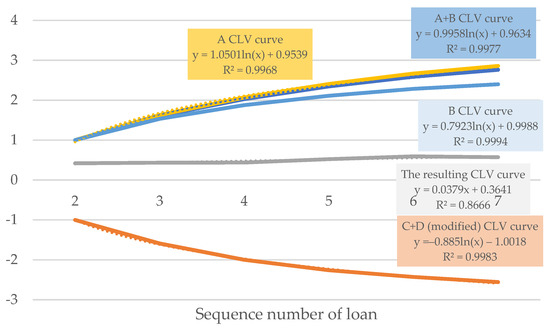
Figure 6.
Graphs of CLV for segments A, B, A+B, C+D and resulting CLV.
The CLV for the recurrent-loan segment exactly follows the logarithmic function exactly, in all cases. This entails the decreasing of the marginal increment of CLV, with a credit-number increase.
By bringing together the results of marketing it is possible to construct a generalized model which optimizes correspondence between risk, return and marketing efforts. It is necessary to note that our consideration of marketing efforts is grounded on an account-based approach. The logic of optimization is based on the assessment risk–return for the sequence of recurrent loans. The model for marketing-budget allocation is presented in Figure 7.
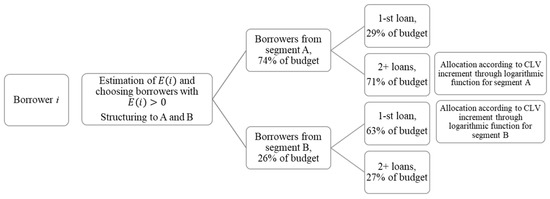
Figure 7.
Model for marketing-budget allocation.
Combining the blocks obtained as a result of this research, it is possible to form a conceptual scheme of the organization of short-term loan-granting, presented in Figure 8. The scheme reflects the realization of the triad “risk–return-marketing efforts” in the credit-business process in short-term loan segments.
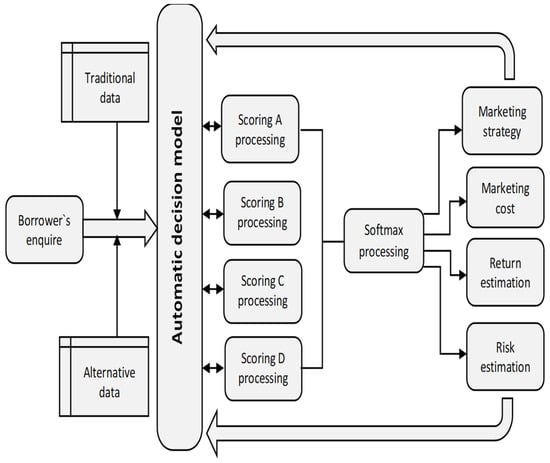
Figure 8.
Conceptual scheme of functioning short-term lending.
4. Discussion
The development of non-bank lending and the rapid penetration of online technologies into credit processes generates many discussions about the further development of credit relationships. One of the issues under active discussion is, of course, the adaptation of banks to the new conditions. Thus, a survey conducted among managers of financial institutions (Harvard Business Review Analytic Service 2019), indicates that 65% of survey respondents agree that fintech will become a significant threat by 2022. This raises questions about the modeling of the credit business. Thus, our study reflects the approach of “aggressive” coverage of risk by return. This is reflected, in particular, in the use of the indicator in the process of making credit decisions. It is suitable for non-banking lenders. But is the bank so active in managing the risk–return correspondence because it is operating using deposit resources? Perhaps banks still need to be more conservative in their strategy. However, there may be a loss of competitive advantage in the long term.
One of the discussion points is the application of the scoring approach used in our study. The problem is the dependence of scoring quality on the presence of significant characteristics. Without these, the quality of the borrower’s assessment may be insufficient and violate the proposed model. At the same time, obtaining additional data can reduce the competitive advantage of online lending. The solution may therefore be to increase the use of alternative data. Therefore, using databases is very relevant to constructing scoring models.
5. Conclusions
Short-term loan granting is distinguished by a set of characteristic special features. Those features, in particular the structure of return and risk, recurrent loans, and the focus of marketing strategies, have certain interrelationships and the credit-system construction should involve them. In this article, we offer an approach based on borrowers’ segmentation based on the whale curve. An incoming-stream borrower is evaluated by scoring functions for the probabilistic prediction of its belonging to a segment (A, B, C, and D). In addition, we use customer lifetime value for the respective segment to evaluate the borrower who takes out a new loan. Together, a marketing-budget allocation scheme has been built based on the obvious relationships between risk, profitability, and marketing costs.
We think that the development of fintech, including online consumer-lending, is one of the most pressing problems for banks. The problem has not yet been conceptualized, and approaches for solutions are not elaborated.
In addition, the increasing volume of data that can be used in the scoring models is a real point for data mining. This should increase the predictability of the scoring models.
An unconditional component of further research should be the development of customer-relationship management in the conditions of financial-services digitalization. The issues discussed in our study identify more financial aspects of marketing-budget allocation. At the same time, the forms of interaction with the customer under the conditions of digitalization are changing, and these changes, in our view, are an interesting object for study.
Author Contributions
Conceptualization, A.K. and M.N.; methodology, A.K., V.B. and G.Z.; software, M.N.; validation, A.K., M.N., V.B. and G.Z.; formal analysis, M.N.; investigation, A.K.; resources, M.N., V.B. and G.Z.; data curation, A.K.; writing—original draft preparation, A.K. and M.N.; writing—review and editing, M.N., V.B. and G.Z.; visualization, A.K.; supervision, A.K.; project administration, V.B.; funding acquisition, G.Z. All authors have read and agreed to the published version of the manuscript.
Funding
This research received no external funding.
Data Availability Statement
Data that support the findings of this study are available on request.
Conflicts of Interest
All the authors declare that we have no potential conflicts regarding the conduct of the research that may interrupt the publication process.
References
- Anandanatarajan, K. 2019. Customer Reationship Management–A Strategic Tool for Marketing. IJRAR 6. Available online: https://ssrn.com/abstract=3676830 (accessed on 17 August 2022).
- Babenko, Vitalina, Andriy Panchyshyn, Larysa Zomchak, Maryna Nehrey, Zoriana Artym-Drohomyretska, and Taras Lahotskyi. 2021. Classical machine learning methods in economics research: Macro and micro level example. WSEAS Transactions on Business and Economics 18: 209–17. [Google Scholar] [CrossRef]
- Bédard-Pagé, Guillaume. 2019. Non-Bank Financial Intermediation in Canada: An Update. Bank of Canada Staff Discussion Paper No. 2. Ottawa: Bank of Canada. [Google Scholar]
- Caputo, Francesco, Armando Papa, Valentina Cillo, and Manlio Del Giudice. 2019. Technology readiness for education 4.0: Barriers and opportunities in the digital world. In Opening Up Education for Inclusivity Across Digital Economies and Societies. Hershey: IGI Global, pp. 277–96. [Google Scholar]
- Chappell, Gerald, Holger Harreis, Andras Havas, Andrea Nuzzo, Theo Pepanides, and Kayvaun Rowshankish. 2018. The Lending Revolution: How Digital Credit is Changing Banks from the Inside. McKinsey & Company, August. Available online: https://www.mckinsey.com/business-functions/risk/our-insights/the-lending-revolution-how-digitalcredit-is-changing-banks-from-the-inside (accessed on 10 August 2022).
- Chernenko, Sergey, Isil Erel, and Robert Prilmeier. 2019. Nonbank lending. Dice Center Working Paper 2018-13. National Bureau of Economic Research. Available online: https://ssrn.com/abstract=3220527 (accessed on 22 August 2022).
- d’Avernas, Adrien, Quentin Vandeweyer, and Matthieu Darracq-Pariès. 2020. The growth of non-bank finance and new monetary policy tools. Research Bulletin 69: 1–4. [Google Scholar]
- Eichholtz, Piet, Nagihan Mimiroglu, Steven Ongena, and Erkan Yönder. 2020. Banks, Non-Banks, and the Incorporation of Local Information in CMBS Loan Pricing. Swiss Finance Institute Research Paper No. 19–58. Available online: https://ssrn.com/abstract=3481034 (accessed on 2 September 2022).
- Fleckenstein, Quirin, Manasa Gopal, German Gutierrez Gallardo, and Sebastian Hillenbrand. 2020. Nonbank Lending and Credit Cyclicality. New York: NYU Stern School of Business. [Google Scholar]
- Fogoros, Teodora Elena, Mihaela Maftei, Stelian Mircea Olaru, and Gabriela Elena Bitan. 2020. From Traditional to Digital: A Study on Business Models in The Context of Digitalization. Paper presented at the 3rd International Conference on Economics and Social Sciences, Bucharest, Romania, October 15–16; pp. 749–57. [Google Scholar] [CrossRef]
- Guryanova, Lidiya, Roman Yatsenko, Nadija Dubrovina, and Vitalina Babenko. 2020. Machine Learning Methods and Models, Predictive Analytics and Applications. Paper presented at the Machine Learning Methods and Models, Predictive Analytics and Applications 2020: Proceedings of the Workshop on the XII International Scientific Practical Conference Modern Problems of Social and Economic Systems Modelling (MPSESM-W 2020), Kharkiv, Ukraine, June 25, vol. 2649, pp. 1–5. Available online: http://ceur-ws.org/Vol-2649/ (accessed on 5 September 2022).
- Hacioglu, Umit, ed. 2019. Blockchain Economics and Financial Market Innovation: Financial Innovations in the Digital Age. Belin: Springer Nature. [Google Scholar]
- Han, Joong Ho. 2017. Does Lending by banks and non-banks differ? Evidence from small business financing. Banks & Bank Systems 12: 98–104. [Google Scholar]
- Harvard Business Review Analytic Service. 2019. In the Game: Traditional Financial Institutions Embrace Fintech Disruption. Available online: https://hbr.org/resources/pdfs/comm/mastercard/Fintech.pdf (accessed on 14 July 2022).
- Insider Intelligence. 2022. A look at Nonbank Loans and the Alternative Lending Industry Business Model in 2021. Available online: https://www.businessinsider.com/alternative-lending-nonbank-industry (accessed on 12 July 2022).
- Kaminskyi, Andrii, and Maryna Nehrey. 2021. Clustering approach to analysis of the credit risk and profitability for nonbank lenders. Paper presented at the CEUR Workshop Proceedings, Machine Learning Methods and Models, Predictive Analytics and Applications—13th Workshop on the International Scientific Practical Conference Modern Problems of Social and Economic Systems Modelling, MPSESM-W 2021, Kharkiv, Ukraine, April 9, vol. 2927, pp. 125–36. [Google Scholar]
- Kondova, Galia, and Trishit Bandyopadhyay. 2019. The Impact of Non-bank Lending on Bank Efficiency: Data Envelopment Analysis of European Banks. International Journal of Trade, Economics and Finance 10: 108–12. [Google Scholar] [CrossRef][Green Version]
- Lee, Mihye. 2018. Non-Bank Lending to Firms: Evidence from Korean Firm-Level Data. The Journal of Industrial Distribution & Business 9: 15–23. [Google Scholar]
- Monil, Patel, Patel Darshan, Rana Jecky, Chauhan Vimarsh, and B. R. Bhatt. 2020. Customer Segmentation Using Machine Learning. International Journal for Research in Applied Science and Engineering Technology (IJRASET) 8: 2104–8. [Google Scholar] [CrossRef]
- Opare, Edwin Ayisi, and Kwangjo Kim. 2020. A compendium of practices for central bank digital currencies for multinational financial infrastructures. IEEE Access 8: 110810–47. [Google Scholar] [CrossRef]
- Patalano, Robert, and Caroline Roulet. 2020. Structural Developments in Global Financial Intermediation: The Rise of Debt and Non-Bank Credit Intermediation. OECD Working Papers on Finance, Insurance and Private Pensions, No. 44. Paris: OECD Publishing. [Google Scholar] [CrossRef]
- Pobric, Amira. 2014. Measuring customer profitability: The applicability of different concepts in practice. Ekonomika Preduzeća 62: 187–200. [Google Scholar] [CrossRef]
- Rateiwa, Ronald, and Meshach J. Aziakpono. 2017. Non-bank financial institutions and economic growth: Evidence from Africa’s three largest economies. South African Journal of Economic and Management Sciences 20: 1–11. [Google Scholar] [CrossRef]
- Smith, Wendell R. 1995. Product differentiation and market segmentation as alternative marketing strategies. Marketing Management 4: 63. [Google Scholar] [CrossRef]
- Soukal, Ivan, Eva Hamplová, and Jiri Haviger. 2021. Effectiveness of Regulation of Educational Requirements for Non-Bank Credit Providers in Czech Republic. Social Sciences 10: 28. [Google Scholar] [CrossRef]
- Storbacka, Kaj. 1997. Segmentation based on customer profitability—Retrospective analysis of retail bank customer bases. Journal of Marketing Management 13: 479–92. [Google Scholar] [CrossRef]
- Tan, Lili. 2019. The Roles of Information Technology in Customer Relationship Performance, Employee User Satisfaction, Service Quality and Customer Satisfaction. Oxford: Oxford University Press. [Google Scholar]
- Vasileva, Valya. 2019. Development of Consumer Lending by Non-Bank Credit Companies in Bulgaria. Economic Archive 1: 65–76. [Google Scholar]
- Yang, Jinlei, Yuanjun Zhao, Chunjia Han, Yanghui Liu, and Mu Yang. 2021. Big data, big challenges: Risk management of financial market in the digital economy. Journal of Enterprise Information Management 35: 1288–304. [Google Scholar] [CrossRef]
Publisher’s Note: MDPI stays neutral with regard to jurisdictional claims in published maps and institutional affiliations. |
© 2022 by the authors. Licensee MDPI, Basel, Switzerland. This article is an open access article distributed under the terms and conditions of the Creative Commons Attribution (CC BY) license (https://creativecommons.org/licenses/by/4.0/).