Article

Assessment of Readiness of Croatian Companies to Introduce I4.0 Technologies

Croatian National Bank, Trg Hrvatskih Velikana 3, 10000 Zagreb, Croatia
*
Authors to whom correspondence should be addressed.
J. Risk Financial Manag. 2022, 15(12), 558; https://doi.org/10.3390/jrfm15120558
Submission received: 2 November 2022 / Revised: 23 November 2022 / Accepted: 25 November 2022 / Published: 28 November 2022

Abstract

:
The main topic of this paper is to estimate the possibility and inclination of Croatian companies towards technology and innovation as well as to analyze advantages, limitations and risks involved with this significant technological leap. We analyzed 7147 Croatian business entities operating in different industries in this paper. The starting point in this research is to identify subjects, which could be users of I4.0 or its elements, based on the similarity of indicators with indicators of a sample of 58 identified I4.0 companies. We developed a machine-learning model by using the eXtreme Gradient Boosting algorithm (XGBoost) for this purpose, an approach that has not been used in any similar research. This research shows that the main difference between I4.0 and traditional industry is mostly observable in significantly better business performance of investment indicators, cost efficiency, technical equipment and market competitiveness. We identified 141 companies (1.97% of total analyzed sample) as potential users of I4.0, which makes up around 27% of total assets of the analyzed sample and around 26% of revenues.

1. Introduction

This research estimates Croatian companies’ readiness to strengthen their technological and innovation potential, as well as the advantages, limitations and impact on company riskiness involved in the fourth industrial revolution. The paper analyzes the key business indicators and the risk characteristic to I4.0 companies (artificial intelligence, robotics and other technologies with a high degree of autonomy) in Croatia and compares them against “traditional” companies operating in the same or similar industries.
I4.0 affects the development of companies, the financial sector and thus the economy as a whole. Investments in new technologies have a positive impact on GDP growth through increased investment and productivity (competitiveness). Investing in technology requires substantial financial resources, which leads to an increase in demand for loans. The core of the fourth industrial revolution is artificial intelligence, i.e., the application of machine learning, and especially the so-called deep learning algorithms, for system state identification and autonomous decision making with the aim of process optimization. These are sophisticated devices that use artificial intelligence and technologies that shorten the duration of research and development projects in design (CAD), prototype development, simulations and process control in production or communication. The technology provided by I4.0 is one of the greatest opportunities for economic development today. This paper applies the deep learning model used by advanced I4.0 technology systems—deep machine learning—on a sample of registered users or manufacturers of I4.0 technology. More information about used method is in the Appendix A which is the part of this paper.
An analysis of previous research and a review of the literature revealed that there is a need for such research in order to estimate the readiness of companies and their potential for the introduction of I4.0 in the Republic of Croatia. The structure of the paper is such that the first, introductory chapter, is followed by the second chapter, which explains the concept and role of the fourth industrial revolution and provides an overview of theory and previous research. The third chapter deals with identifying the potential for I4.0 using machine learning. The analysis of results constitutes the fourth chapter. The concluding chapter elaborates on the implications for economics and economic policy, i.e., it establishes the interconnections between the main results of the paper (detected potentials) and policies that should be able to support the development of companies in terms of introducing new technological solutions of the fourth industrial revolution.

2. The Impact of Industry 4.0 on Company Operations

2.1. The Concept and Application of Industry 4.0

Industry 4.0, or I4.0 or I4, is based on automated technology networked via sensors and communication elements (Blunck and Werthmann 2017), which thus connects the real and virtual world in the form of a cyber-physical system, such as, e.g., autonomous robots. Unlike traditional production systems with centralized control, which consider each individual machine as an independent unit, the so-called 4.0 factory connects machines into a type of community that is interacting and collaborating autonomously and “intelligently”. The use of advanced prediction tools enables continuous processing of big data for the purpose of decision making that is based on all available information at all times, which is the basis for the development of artificial intelligence (AI).
There are different definitions of Industry 4.0, but what they have in common is that they include technologies that lead to the automation of certain processes in production and/or provision of services. These are (Dalenogare et al. 2018; Lu 2017; Wan et al. 2015; Posada et al. 2015, cited in Bai et al. 2020) 3D printing, artificial intelligence, augmented reality, robots, big data, Blockchain, cloud technology, “cobotic” systems involving human–robot cooperation, collaborative systems, cybersecurity and drones. Additionally, Global Positioning System (GPS), the Industrial Internet of Things, mobile technology, nanotechnology, RFID (technology that uses wireless communication and automatically tracks and identifies specific objects), sensors and simulations are related to Industry 4.0.
In this paper, companies that use certain elements of the fourth industrial revolution or plan to modify their business operations in line with the concept of Industry 4.0 are identified based on the following technologies (BCG 2020—Boston Consulting Group). These include big data and analytics, autonomous robots, simulations, horizontal and vertical system integration, the Industrial Internet of Things, cybersecurity, the cloud, 3D printing and augmented reality.
A holistic approach to the technologies it uses is important for determining whether a company is an I4.0 company. Certain companies use some of these technologies, but this does not mean that they are fully considered part of Industry 4.0. Depending on the degree of application of these technologies, we can conclude whether a certain company is on track to realize the I4.0 concept. Differences among companies can be significant, ranging from a fully automated company that uses robots to manufacture robots (Japan as a synonym for robots and robotics) to companies that are gradually embracing certain segments of the new industrial revolution.
The technology characteristic of each of the previous three industrial revolutions (steam engines, electricity and information technology) was an extraordinary discovery and advancement, which is also the case in the current revolution. These changes will affect a number of areas, such as business administration, finance, the health sector, energy, transport, industry, service activities, intellectual services and many other areas such as genetics and biotechnology. The research conducted by Frey and Osborne (2013) assesses the susceptibility of current jobs to technological development. According to that estimate, 47% of total US employment is in the high-risk category. The model applied in the aforementioned paper predicts a different trend of polarization of the labor market from the existing one. As technology advances, according to the aforementioned research on the future of employment, workers with a lower level of skills are reallocated to tasks that require creative and social intelligence. However, the changes will also affect highly educated professionals (the example of IBM Watson), which will influence the field of law or healthcare (diagnostics). Google has utilized artificial intelligence as Google Duplex, a virtual assistant that can schedule meetings or appointments by communicating with real people, even those who do not know the language well. Due to the topic of this paper, it is necessary to emphasize the area of creative artificial intelligence that can provide new creative technological solutions by processing big data. For example, in the aerospace industry, when designing profiles that are extremely strong and light (for example, the Airbus A-320 concept, which reduces the weight of certain components by up to 45% compared to traditional models, which in turn significantly reduces fuel consumption and CO2 and other GHG emissions, and in combination with the use of 3D printing, it also reduces the consumption of raw materials up to 95%).
Economic benefits cited as a kind of “drivers” of the fourth industrial revolution (McKinsey, cited in Blunck and Werthmann 2017) include using resources and optimizing business processes. An example of this is decreasing material costs due to real-time monitoring of the production process, reduction of waiting time between different production steps in manufacturing and acceleration of research and development processes, which result in increased productivity. Optimal utilization of assets, management of inventories, increased productivity, improvement of the quality of products and services, reducing the time to market, reducing the costs of aftersales and customer support, service and product maintenance using virtual assistants and the like are just some of the benefits of Industry 4.0.
The industrial revolution of the fourth generation is mostly characterized by technologies listed and shortly described below. Description of each technology is short and sufficient for the purpose of this paper.
Artificial intelligence is mostly used for interaction with the environment, image recognition (static or in motion), human speech and the state of the environment (temperature, humidity, position, speed, direction of movement, etc.) and processing of collected data in real time with the aim of autonomous and experientially optimized management of a process. There is no generally accepted definition of artificial intelligence. The widest application of artificial intelligence is in robotics, which is used mostly in production processes, transport, design, engineering, finance, IT and diagnostics, as well as increasingly in households and the entertainment industry.
Big data are becoming the standard in real-time support in decision making. Data are collected from multiple sources, such as production equipment and systems and company and customer management systems. In order for the use of big data to be meaningful in terms of utilization, it is necessary to consolidate and evaluate such data in an intelligent way (Sauter et al. 2015, p. 5, cited in Blunck and Werthmann 2017).
Robots interact with each other and operate “in collaboration” with people and learn from them. Costs will be lower and opportunities more plentiful than in today’s production. Robotics is one of the foundations of Industry 4.0, and robots and humans are increasingly becoming equal in business processes.
Simulation is mostly used to transpose the physical world to a virtual model for the purpose of reducing costs and increasing quality. They allow for operators to test and optimize machine settings for the next product before physical production.
Horizontal and vertical system integration allows for better cohesion between departments and functions, as comprehensive data networks develop automated value chains.
The Internet of Things (IoT) in Industry 4.0 means that computers will be integrated into devices in order to enable them to communicate with each other. Blunck and Werthmann (2017) describe it as an “ecosystem” of technologies monitoring the status of physical objects. At the same time, they capture meaningful data and communicate that information through networks to software applications. Each definition of the Internet of Things includes smart objects, machine to machine communication (M2M) and radio frequency technologies (Thrasher 2014, cited in Blunck and Werthmann 2017).
Cybersecurity is a necessity arising from increased connectivity and the use of standard communication protocols. Secure, reliable communications as well as identity and access management of machines are essential. According to the latest available European Investment Bank Activity Report (EIB 2018), the topic of cybersecurity was highlighted. The report points out that over the past period, cyber attacks have threatened thousands of companies and the data of billions of people.
Cloud technology enables connectivity in production and requires greater data exchange. The performance of cloud technologies will improve in terms of response time, resulting in the provision of more data services.
Furthermore, 3D printing is increasingly used due to its construction advantages for the production of prototypes and individual components or for the production of small batches of customized products. The possibilities of 3D printing are impressive, from utilizing it for NASA technology in the aerospace industry to manufacturing of organs (e.g., ear, kidney, etc.) using patient’s cells. The 3D printing of food is another economically interesting area.
Augmented reality supports a variety of services and provides real-time information. This technology can result in better decision making and/or performance.

2.2. Previous Research and Overview of Literature

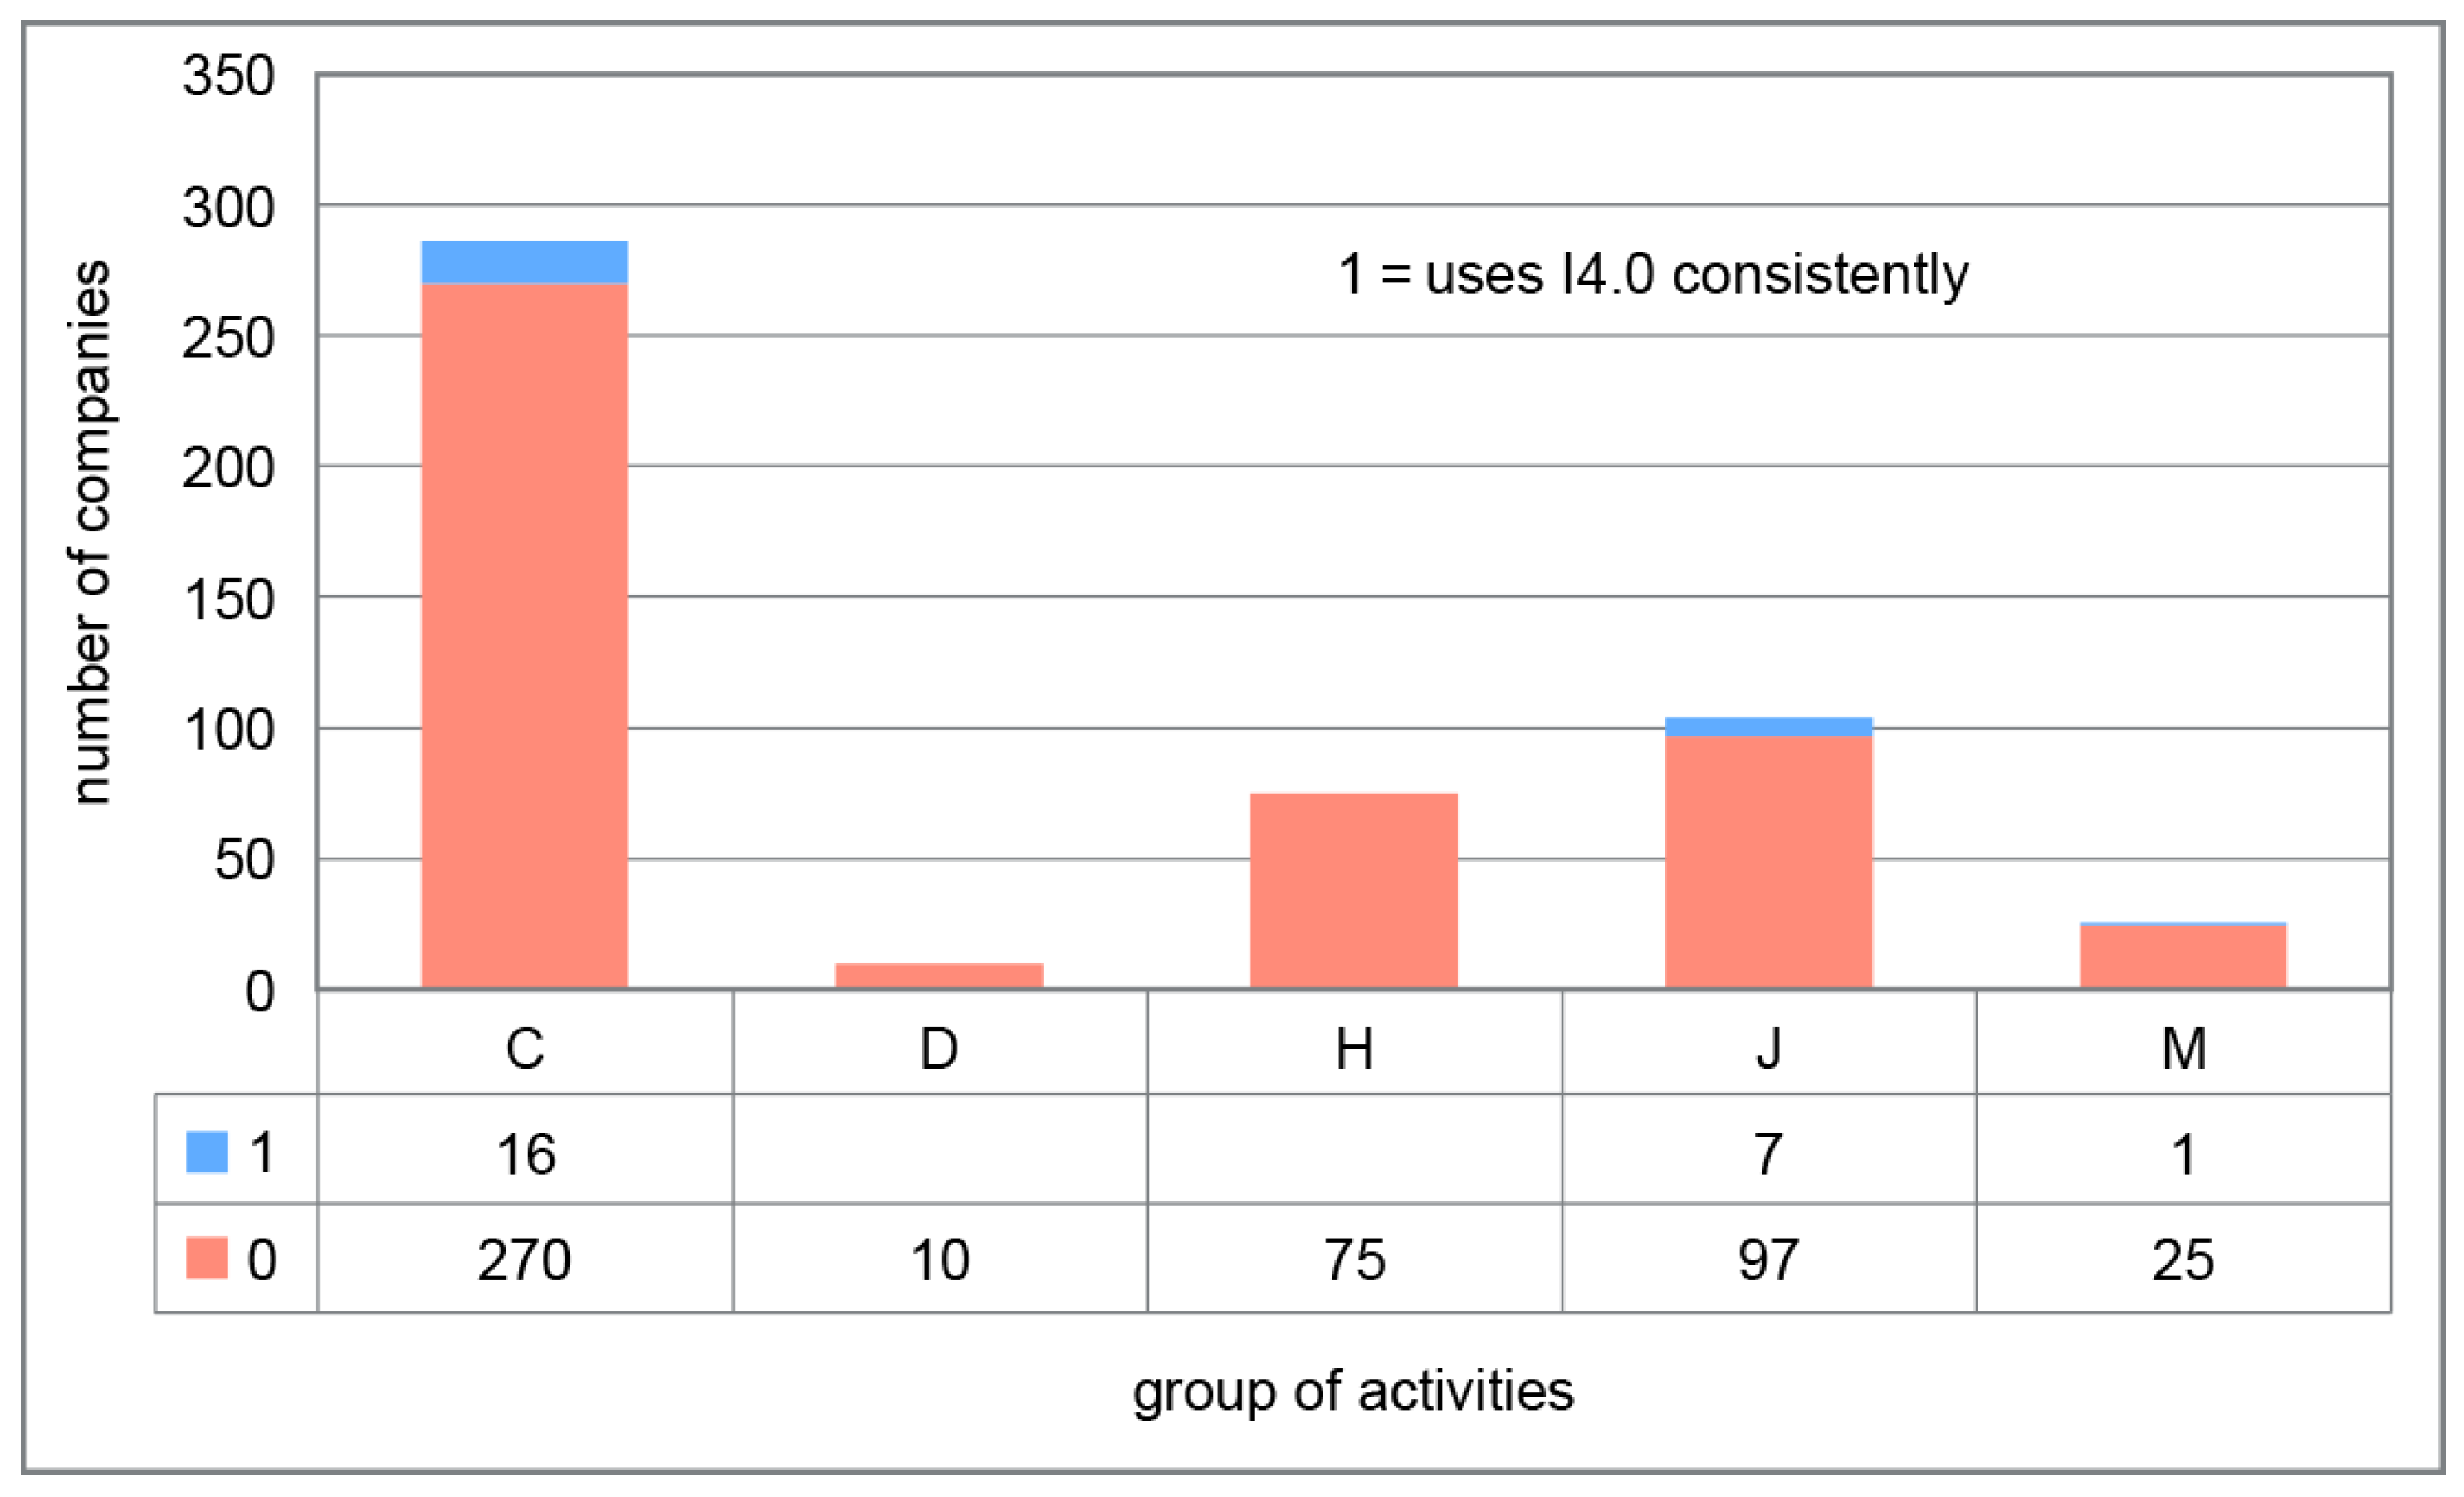
The study conducted by PwC (
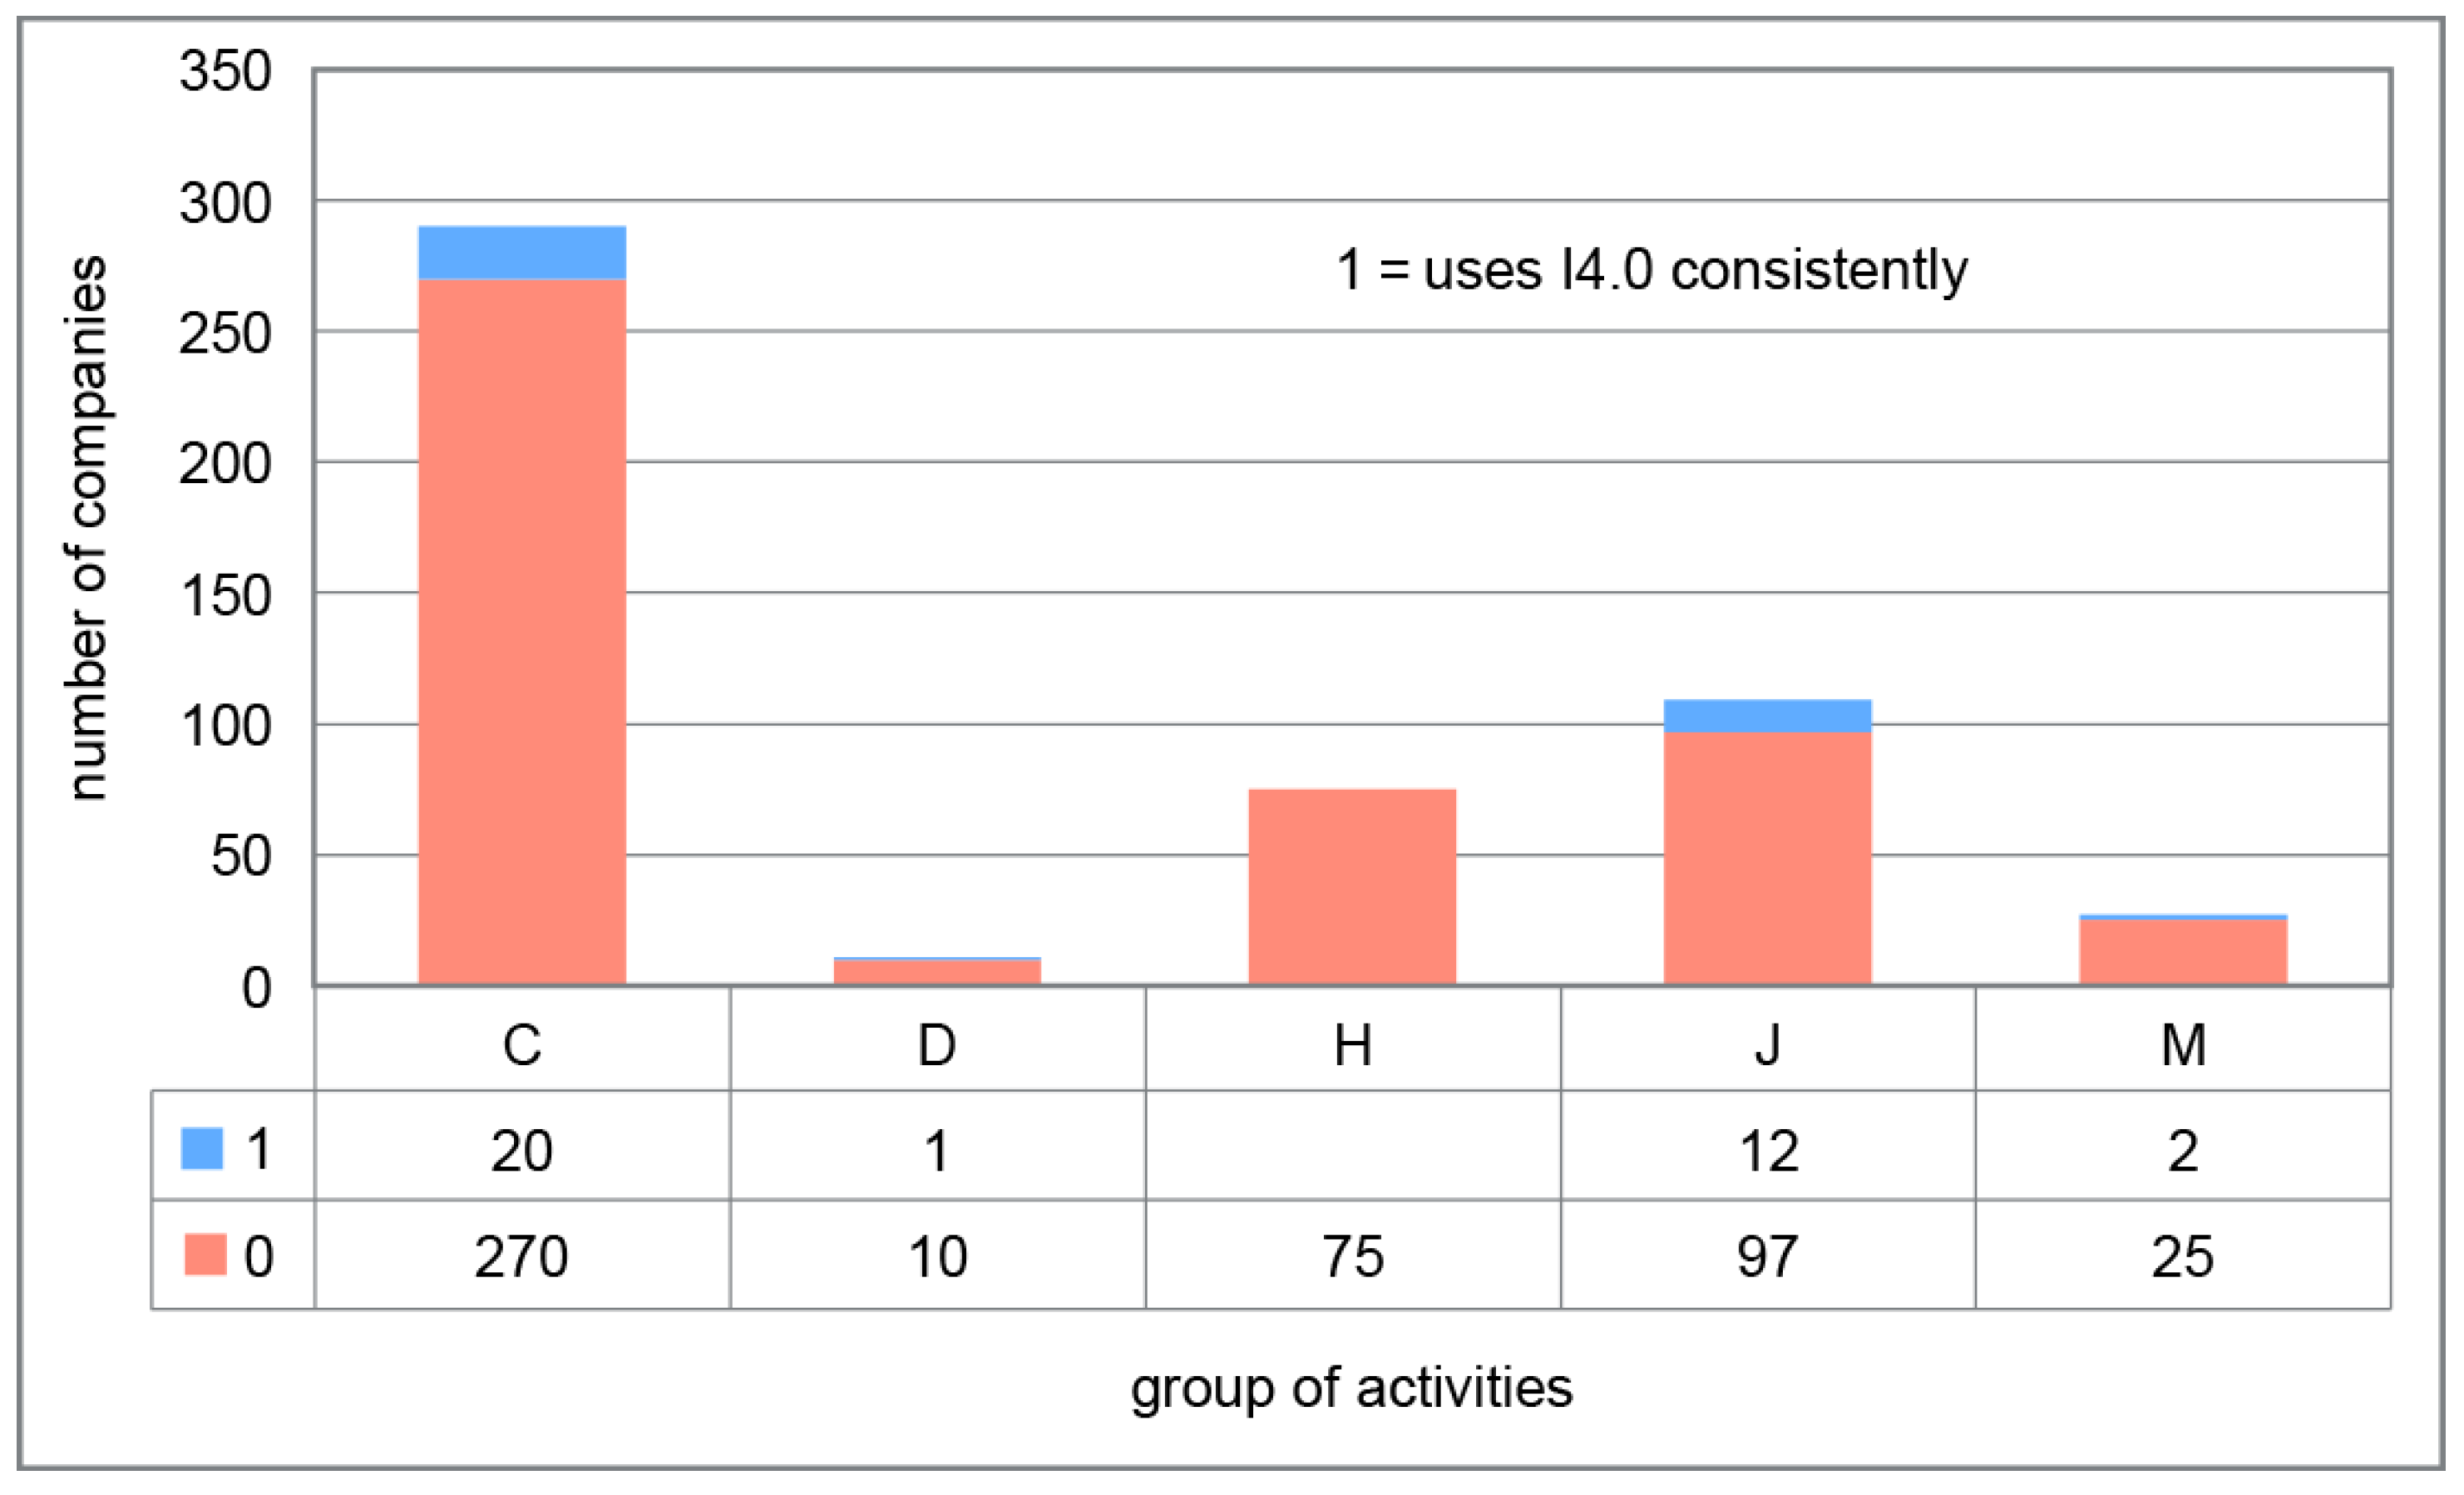
2014) not only demonstrates how industrial companies can create new opportunities for economic development using I4, but also discusses possible challenges. The study was conducted in the form of a survey of five core industrial sectors (C—manufacturing; D—electricity, gas, steam and air conditioning supply; H—transportation and storage; J—information and communication; and M—professional, scientific and technical activities, which are the activities in which advanced I4.0 technologies are introduced the most) using a database of 235 German industrial companies. The authors estimate that the share of investments in I4.0 technology will account for more than 50% of planned capital investments in the five-year period. Likewise, German industry will invest approximately 40 billion euro in I4 every year by 2020. The companies surveyed expect an 18% increase in productivity over the next five years. The Internet of Things or Services will contribute to an increase in revenues of 2% to 3% per year, which will represent an increase of 30 billion euro at the level of German industry.
The Cerved (2017) SMEs Report analyzes the Italian government’s plan for I4.0 to stimulate innovation, investment and research and development. A method of dividing companies into clusters based on the inclination of companies towards innovation and investments was applied, and companies that are inclined towards innovation generally generate higher revenue growth and better profit margins, while at the same time, they can face higher bankruptcy rates and higher labor turnover.
In addition to the aforementioned research on the future of employment (Frey and Osborne 2013), it is also important to point out the Acemoglu and Restrepo (2017) research. They examine the impact of robots and computer technology on the future of the labor market based on data on the increase in the use of robots between 1990 and 2007 in the US. By using a model in which robots compete against people in performing various jobs and tasks, they demonstrate that the introduction of robots can reduce employment and wages depending on the industry. Therefore, they conclude that automation, robotization and artificial intelligence have a strong adverse impact on the labor market. According to their estimates, the introduction of an additional robot per 1000 employees reduces the employment rate by 0.18–0.34% and wages by 0.25–0.5%.
Veža et al. (2018) examine the position of Croatian manufacturing companies in relation to Industry 4.0, i.e., “whether a company can survive in the market without taking strategic guidelines towards Industry 4.0 by 2020”. According to the research, the industrial maturity of Croatian companies is at a very low level (only slightly higher than the level of the second industrial revolution). A fundamental weakness was also expressed, namely insufficient monitoring of developments in technology due to the low level of employee training, established on the sample of surveyed companies (rarely more than five days per year). The results obtained are in line with the conclusion presented in the study by Roland Berger (cited in Veža et al. 2018), according to which Croatia has a very low Industry 4.0 readiness index (measured by the degree of production complexity of the business process, automation, innovation and knowledge—readiness of the labor force) and belongs to the group of hesitators, along with Bulgaria, Poland, Portugal, Estonia, Spain and Italy. Such a conclusion stems from the relationship between the share of manufacturing in GDP and the readiness of European countries to introduce Industry 4.0, of which only Bulgaria had a weaker result than Croatia.
The McKinsey study (Novak et al. 2018) mentions digitization as a new impetus in the development of Central and Eastern European (CEE) countries, which they call digital challengers. CEE is one of the most attractive regions for investments at the global level, providing an opportunity that Croatia must seize in order to reduce the gap with regard to developed Western European countries. The attractiveness of these countries stems from high mathematical literacy (which is almost identical to that of front-runner countries), a large STEM (science, technology, engineering and mathematics) talent pool and high-quality digital infrastructure with excellent 4G network coverage. They call the CEE region a “vibrant emerging digital ecosystem” and estimate that digitization could be a driver for the region, which could contribute 200 billion euro in additional GDP by 2025 (8.3 billion euro, or approximately 2000 euro of GDP per capita for Croatia (McKinsey 2018)).
Authors (Hughes et al. 2022) claim that “the technological choices facing the manufacturing industry are vast and complex as the industry contemplates the increasing levels of digitization and automation in readiness for the modern competitive age.” Additionally, changes related with Industry 4.0 offer “transformation challenges and opportunities, impacting a multitude of operational aspects of manufacturing organizations.”
According to authors (Grabowska and Saniuk 2022) who have been researching business models in the I4.0 environment, “Dynamic technological development and solutions implemented in modern companies result in a change in management paradigms and the need to build new business models based on maintaining a balance between the development of autonomous (intelligent) technology and remote communication systems and the quality of life, and recognized values in different societies”. Thus, we have the creation of new business models that allow for the “introduction of open innovations, rapid reorganization of processes and very flexible adjustment of the functioning of companies to new conditions and dynamically changing competitive and common environments.”
Hughes et al. (2022), in reference to perspective on the future manufacturing within the I4.0 era, said that “the concept of increasing levels of automation with a human in the loop seems to be the consensus within the literature where machines are likely to augment human skills and endeavours within the production environment. The successful migration towards I4.0 requires strategic institutional support and significant sector-wide financial investment.”
Researchers (Mourtzis et al. 2022) revealed three key issues that need to be addressed when bridging Society 5.0 and Industry 4.0, and they include the following: human-oriented action, sustainable development and the physical to digital to physical loop.

3. Identifying Potentials for I4.0 Using Machine Learning

This research estimates Croatian companies’ readiness to strengthen their technological and innovation potential, as well as the advantages, limitations and risks involved in the fourth industrial revolution. The analysis is based on the estimation of the potential for the introduction of I4.0 technologies in a wider set of Croatian companies. The potential for I4.0 is defined as the similarity of a company to companies that are autonomously identified as users of I4.0 technology. This section describes the set of data used and the method that was utilized.
The first challenge is to identify companies whose business operations or products (services) are related to the fourth industrial revolution (I4.0). There is no single systematic record of users of new generation high technology in Croatia. Companies that consistently use I4.0 technology were identified by individual verification of each entity from the list of companies that are users of high technology from various sources, according to the criteria described below.
The potential, i.e., the readiness of a company to introduce I4.0, was estimated probabilistically by applying the classification algorithm of supervised machine learning with a binomial dependent variable. Based on the model estimate of probability, the other observed companies are classified in group I4.0 (probability > 50%). This mean that they are very similar to companies that are unequivocally identified as users or producers of some of the listed technologies of the fourth industrial revolution or in the group of traditional companies (probability is lower or equal to 50%) if this is not the case.
New technologies are often associated with the perception of increased risk, which makes it difficult or at least further increases the cost of funding research and development projects. This paper demonstrates that there is no objective basis for the perception of higher riskiness of I4.0 companies, whose developmental path is based on high technology. On the contrary, investing in development and new technologies increases their competitiveness in increasingly demanding markets that set quality and reliability as the new standard ahead of price.

3.1. Data

Analysis of the potentials for the introduction of I4.0 takes into account companies that operate in five industries, including the following: C—manufacturing; D—electricity, gas, steam and air conditioning supply; H—transportation and storage; J—information and communication; and M—professional, scientific and technical activities.
The sample of companies consists of entities whose annual financial statements (source is the annual financial statements of companies from the database of the Financial Agency) were made public for 2017 and 2012, to which, depending on availability, financial indicators and certain items from the balance sheet and profit and loss statement for 2008 were also added (non-probabilistic sample). The non-probabilistic sample makes up for approximately 35% of the total number of companies operating in the analyzed industries, 88% of assets, 85% of operating income and 78% of the total number of employees in these branches of business activity.
These criteria were met by a total of 7147 companies (Table 1), of which 58 were identified by expert assessment as actively using or offering technology and services according to the criteria for I4.0. Expert assessment of the use of I4.0 technologies was conducted based on the available data from various sources (see references), with additional verification on the websites of the analyzed entities, thus identifying 110 companies, of which 58 were retained in the final non-probabilistic data set of “7147”.
It can be seen that the largest number of companies operates in industry C (manufacturing and industry) and industry M (professional, scientific and technical activities) (Table 2).

3.2. Hypothesis and Assumptions

The initial assumption is that companies whose financial performance indicators are similar to those of identified I4.0 users are at a similar level of technological equipment and organizational structure, which enables the identification of potential I4.0 users in a wider set of companies.
Since there is currently no systematic record of users of I4.0 technology (such as Cerved in Italy) in Croatia, the collected data on high-tech companies and users/producers of I4.0 technologies were verified for each entity individually. The criterion for designating a company an unequivocal user of I4.0 is to find evidence that the company uses or produces/provides products or services based on at least one technology of the fourth industrial revolution, such as big data and analytics, robots, simulation, horizontal and vertical system integration, the Internet of Things, cybersecurity, cloud technologies, 3D printing or augmented reality. Identifying other potential users of I4.0 technology relies on similarities in the structure of financial statements and indicators of such companies in relation to identified I4.0 companies, especially the share of intangible assets in fixed assets and investments in research and development, as applied, for example, in the Cerved (2017) research. The difference in relation to the mentioned research is that these indicators were not selected exclusively by expert assessment, but, among other indicators, were confirmed as statistically significant so that, in the final classification model, their branches have the highest information gain in classifying companies as I4.0 companies.
For this purpose, a binomial logistic (logit) classification model calculated using the Extreme Gradient Boosting (XGB) technique (see Chen and Guestrin 2016) of deep machine learning was used through the application of the supervised learning method. XGB has proven to be a superior model in binomial logistic classification in the area of risk assessment (Petropoulos et al. 2018) and among other deep learning algorithms in relation to logistic regression. Their results were tested empirically by comparative evaluation using logistic regression, which also resulted in somewhat weaker discriminant properties of the model compared to XGB.
Since very few companies in the entire sample were identified as I4.0 companies, model training and testing samples were made using random sampling from the non-probabilistic sample so that I4.0 companies were divided in a ratio of 60:40 in favor of the training sample, while the remaining candidate companies were selected at random (Figure 1).
The test sample was selected so that its structure by activities corresponds to the training sample (Figure 2).

3.3. The Model for Estimating the Potentials for I4.0 Application

The model for estimating the potentials for application of fourth industrial revolution technologies was subject to learning on the training sample, and it was verified using the test sample. In order to avoid excessive adaptation of the model to the training sample (overfitting), an iterative method of sampling from a non-probabilistic sample was applied for both samples—the training sample and the test sample—and the so-called bootstrapping method was used, which creates different samples from the initial sample through random selection and examines the performance of the out-of-sample model. The procedure was repeated 20 times, during which the companies entering the samples were replaced through random selection, and the set distribution of samples by groups of activities was retained. The XGBoost methodology uses several parameters for model evaluation. A binomial logistic objective function was applied, given the objective dependent variable that takes only two values—zero or one—and the result of the classification is the probability of using I4.0 technologies.
The results obtained are presented graphically (Figure 3), whereby the criteria for selecting the optimal parameters for model evaluation are the maximization of the discriminant power of the model measured by the Accuracy Ratio (AR or GINI) and the minimization of its standard deviation at the same time. The obtained average values of the Gini coefficient for 20 iterations with the given combinations of gamma and eta parameters and the corresponding standard deviations were ranked according to the optimization criteria. The average Gini coefficients were ranked from highest to lowest (highest = 1), while standard deviation was ranked from lowest to highest (lowest = 1). The total rank is the sum of these two ranks, and the best (lowest) rank is the optimum combination of gamma and eta parameters.
The optimal combination of gamma and eta parameters was obtained for gamma = 0 and eta = 0.75.
In the 20 iterations performed, the variables with the highest total information gain (sum of information gain in 20 iterations) are as follows: operating in high-technology industry (Eurostat classification); share of development expenditure in long-term assets; relative change in the share of concessions, patents and licenses in total long-term assets in the period 2012–2017; share of exports in income; relative change in the share of intangible assets in long-term assets in the period 2012–2017; ratio of market to nominal capitalization; age of the company; investments in new long-term assets per employee; long-term financial assets in total assets; and operating expenses in income, among others. Most of the relevant classification variables are of a structural nature (ratios in the balance sheet and profit and loss statement, such as share of research and development expenditure in long-term assets). The level of technological intensity of an industry is determined according to the Organization for Economic Cooperation and Development (OECD) and Eurostat (Eurostat 2016) classification of research and development intensity of individual industries as follows:
(a)
High technology (HT): C21—manufacture of basic pharmaceutical products and pharmaceutical preparations and C26—manufacture of computer, electronic and optical products.
(b)
Medium-high technology (MHT): C20—manufacture of chemicals and chemical products; C27—manufacture of electrical equipment; C28—manufacture of machinery and equipment; C29—manufacture of motor vehicles, trailers and semi-trailers; and C30—manufacture of other transport equipment.
(c)
Medium-low technology (MLT): C19, C22–C25 and C33—manufacture of coke and refined petroleum products, rubber and plastic products, mineral products and basic metals, repair and installation of machinery and equipment, respectively.
(d)
Low technology (LT): C10–C18 and C31–C32—manufacture of food products, tobacco products, beverages, textiles and wearing apparel, leather products, wood, paper and paper products, printing and reproduction of recorded media, manufacture of furniture and other manufacturing, respectively.

Model Evaluation Using Machine Learning

The model from the second iteration for gamma = 0 and eta = 0.75 was selected as the final model for estimating the potential for application of I4.0, in which model overfitting is the lowest (the highest discriminant power of the model on the test sample).
The variables with the highest information gain included in the model are the following (from the highest information gain to the lowest, Figure 4): share of development expenditure in long-term assets (positive effect); age of the company (positive effect); ratio of total expenses to operating income (negative effect); relative change in the share of intangible assets in long-term assets in the period 2012–2017 (positive effect); ratio of market to nominal capitalization (positive effect); operating in high-technology industry (indicator variable, positive effect); share of exports in income (positive effect); share of plant and machinery in long-term assets (positive effect); efficiency indicator—operating income per employee (positive effect); share of provisions for pensions, severance pay and similar liabilities in assets (positive effect); and the share of short-term assets (negative effect).
The high share of development expenditure (long-term intangible assets) in long-term assets is a consequence of significant initial investments in development and continuous improvement of high technologies. The results of such development expenditures are expected over a longer period of a company’s operations. The model shows that entities with a higher share of development expenditure in long-term assets have a greater inclination towards Industry 4.0. Since older high-technology companies started investing at an earlier date and invested more in high technology, according to this model, this sets them apart from traditional companies. These are larger companies that have stable business models and substantial investments in technology. Operating income arises from the core business, and according to the model, if total expenses of a company are lower than its operating income, there is a greater inclination towards Industry 4.0.
Companies that increased the share of intangible assets in long-term assets in the period under observation, between 2012 and 2017, show a greater inclination towards Industry 4.0 because intangible assets, inter alia, include the value of patents, software, licenses and various types of intellectual property. Market capitalization is considered to be the market value of company’s shares, and if it is higher than nominal capitalization, it is an indicator that the market has recognized the company in question as successful. Higher exports are a consequence of greater market competitiveness and innovation. Operating income per employee is a high-quality indicator of efficiency. The share of provisions for pensions, severance pay and similar liabilities in total assets in the model has a positive contribution.
The discriminant power of the model on the training sample is exceptional—the Gini coefficient is 0.95—while it is slightly lower on the test sample (0.8), with the highest obtained value in 20 iterations. The exceptionally high discriminant power of the model on the test sample, as well as on the training sample, confirms that there is no significant overfitting of data to the training sample, and the estimates obtained by the model can be considered unbiased.

4. Analysis of Results

Figure 5 shows the probability distribution density function of potential for I4.0 on the set of analyzed companies, defined as the probability that the model assigns the classification of I4.0 companies. The figure shows the highest concentration of companies is within the first 20% of probability, while already above 33% of probability (dotted line) and especially above 50% of probability (dashed line), the distribution density is very low, which indicates a very low readiness for the application of I4.0 technologies in Croatia. Of the 7147 companies analyzed, 141 companies (including 58 identified through expert assessment) were classified as companies with potential for I4.0, which makes up 1.97% of all analyzed entities.

4.1. Analysis of I4.0 Potential on the Whole Set

Table 3 shows the potentials of Industry 4.0, which include potentials identified through expert assessment and model-detected potentials by activities. The largest share by number of companies in the total potential for I4.0 has the group of activities C—manufacturing (44.7%), followed by the group of activities J—information and communication (42.6%). The share of activities of group M—professional, scientific and technical activities (9.9%); H—transportation and storage; and D—electricity, gas, steam and air conditioning supply (1.4% each) is significantly smaller.
According to this research, most of the companies that have the potential for Industry 4.0 in Croatia perform activity J-6201—computer programming activities (38 companies), activity C-2620—manufacture of computers and peripheral equipment (11 companies), activity J-6202—computer consultancy activities, activity J-6209—other information technology and computer service activities and activity M-7219—other research and experimental development on natural sciences and engineering (five entities in each category, Figure 6).
Figure 7 shows the marked and model-detected potentials according to the share of company size. The share of small enterprises (52%) in the potentials of the group is the greatest, while medium-sized (25%) and large-scale enterprises (23%) account for similar shares.
However, although the number of companies with the potential for I4.0 is not large, they account for approximately 27% of assets of the non-probabilistic sample (approximately 24% of the population of analyzed activities) and approximately 26% of the operating income (22% of the population of analyzed activities), as displayed in Table 4.
Most of the entities (48 companies) are grouped as having 11 to 50 employees. The lowest number of them are grouped as having less than 10 employees (16 companies), which can be explained by reference to having more difficulties regarding the availability of sources of funding for development/investment projects due to increased risk and lack of human resources for the implementation of complex, high-technology projects.
The number of companies that are estimated to have the potential for I4.0 is relatively small compared to the total number of companies performing the analyzed activities, but all of them exhibit a high degree of automation of production processes. The most technologically advanced countries apply various support mechanisms for the introduction of I4.0 technologies, such as tax reliefs, both in the introduction of technological infrastructure and for investing in education and training of employees (France); high (hyper) depreciation rates; and special funds for financing investment and development projects (Italy, Germany, Finland). Along with the direct financial support, developed countries additionally enable and encourage the launch of and investment in I4.0 in various manners. Construction and development of infrastructure is encouraged, and regulatory frameworks are adjusted to enable the establishment of start-ups, equal access to available data and the use of high I4.0 technology such as autonomous vehicles, drones and robots. An example of such a country is Estonia, and similar practices have been followed by Sweden, Norway and Finland.

4.2. Business Performance and Riskiness of I4.0 Companies

The main indicators showing differences in the potential of I4.0 companies and traditional companies in the analyzed sample are of a structural nature, such as share of intangible assets or business equipment and machinery in long-term assets, investment in research and development, share of short-term assets in total assets, etc. In addition to structural differences, financial statements of companies with I4.0 potential show significantly better business indicators, some of which are included in the model itself because they have a significant effect in distinguishing companies within the context of estimating potential (Figure 6). Significantly better business performance is most pronounced in terms of indicators of investments, cost efficiency, technical equipment and market competitiveness, while profitability indicators, although higher on average, are not significantly better.
Figure 8 shows the distribution of the marginal rate of technical substitution for I4.0 and traditional companies. Despite higher capital per employee (marginal rate of technical substitution), the average is not significantly different in relation to companies with traditional technical equipment, as shown by single-factor analysis of variance—ANOVA (Table 5).
The growth of the number of employees during 2017 and in the period 2012–2017 is slightly higher than the growth of the number of employees in traditional industry, but is not statistically significant, while salaries of employees of companies with I4.0 potential are higher, which is statistically significant (Table 6 and Figure 9). Although the application of high technologies shows negative effects on employment (so-called Keynes’ “technological unemployment”), this view ignores other, positive effects of technology, such as creating new (different, more complex) jobs, fostering innovation and productivity and other benefits, e.g., in healthcare, retail or security (Bughin et al. 2017).
Companies with potential for I4.0 are also more competitive in the international market, which is why their share of export revenues in operating income is significantly higher than that of traditional companies (Figure 10 and Table 7).
Companies with potential for I4.0 invest significantly more than traditional companies in research and development of new technologies in relation to the other long-term assets (average of 16% at I4.0 vs. 0.3% at traditional ones; Table 8). Figure 11 shows distributions of the share of research and development in long term assets both for I4.0 and traditional technology companies.
All of the advantages and positive effects resulting from development, investment and use of high technologies, according to I4.0 criteria, are reflected in the increase in the value of such companies in the capital market (analyzed for companies listed on official stock exchanges) relative to the nominal value of shares, which is also one of the indicators that was included in the model. Efficiency, competitiveness and development strategy are recognized by investors in the securities market, and this has a positive effect on the price thereof. Figure 12 shows the distribution of probability of default for I4.0 and traditional technology companies.
The riskiness of I4.0 companies is significantly lower than the riskiness of traditional companies (at the level of significance of 1%; Table 9) according to FINA’s probability of default (FINA 2019), unlike traditional companies.
Investing in development and application of new technologies opens new markets for such companies, increases the competitiveness of their products and services, raises the level of knowledge and ensures business stability and better profitability and efficiency in the long run.

5. Conclusions and Implications of Results in Terms of Economic Policy

Nine technologies (according to BCG criterion) constitute Industry 4.0 and, depending on their use, we can conclude whether a particular company is on track to realize the I4.0 concept. There are various motivations for the application of I4.0 technology, from increasing the efficiency and productivity of a company, reducing operating costs and increasing profitability in the long run, to market positioning, meeting higher standards regarding quality, etc. Balance sheets of such successful companies exhibit differences in asset structure and business indicators compared to traditional companies. The financial sector must also be ready to finance the development of Industry 4.0.
The initial hypothesis in this paper is that balance sheet structure and business indicators of companies that use I4.0 technologies are similar, which enables the identification of potential users of I4.0, or estimation of the probability that a company is already applying or is in the process of introducing I4.0 technologies. A binomial logistic (logit) classification model calculated using the Extreme Gradient Boosting (XGBoost) technique of deep machine learning was used through the application of supervised learning methodology. Of 7147 analyzed companies, 141 companies with potential for I4.0 (1.97% of analyzed entities) accounting for approximately 27% of assets of the non-probabilistic sample (approximately 24% of the population of analyzed activities) and approximately 26% of operating income (22% of the population of analyzed activities) were identified, of which the predominant share was that of large business entities.
The main indicators showing differences in the potential of I4.0 companies in relation to traditional companies are of a structural nature, such as the share of intangible assets or business equipment and machinery in long-term assets, investment in research and development, the proportion of short-term assets in total assets, etc. Significantly better business performance is most pronounced in terms of investment, cost efficiency, technical equipment and market competitiveness, while in this phase of the introduction of I4.0 technologies, which is still an early one, profitability indicators are higher on average, but the difference is not statistically significant. Although companies with potential for I4.0 have a higher capital-to-labor ratio (capital equipment of labor), the cost of their employee is almost twice as high as in traditional industry. Companies with potential for I4.0 are also more competitive in the international market, which is why their share of export revenues in operating income is significantly higher than that of traditional companies. Increasing cost efficiency, effectiveness and profitability requires significantly greater investment in research and development of new technologies, but due to the period of return on investment, the differences in relation to traditional companies at this stage of development are not significant. Furthermore, the business activity plays an important role, and most companies with I4.0 potential are grouped as companies performing computer-related activities, computer activities, data processing, etc., due to easier availability of I4.0 technology in the IT segment, i.e., the fact that they already operate within the scope of a certain segment of I4.0.
Investment in development and application of new technologies opens new markets for Croatian I4.0 companies; increases the competitiveness of their products and services; raises the level of knowledge; and ensures business stability, better profitability and efficiency in the long run, making them less risky and more stable than traditional companies. This has also been proven empirically and is reflected in the resulting structure of the model. The variables identified by the model that characterize I4.0 companies suggest a higher level of investment in development (higher share of development expenditure in long-term assets), higher relative change of share of intangible assets in long-term assets in the period 2012–2017 and a higher share of plant and machinery in long-term assets in relation to traditional companies. The model also proved that I4.0 companies are characterized by variables that show a positive effect of I4.0 on their competitiveness and efficiency: the ratio of market to nominal capitalization, share of exports in income and operating income per employee and a lower ratio of total expenses to operating income (they are more cost-efficient).
The results obtained show that an increase in labor efficiency can be expected (higher revenues per employee) with increased investments in research and development, procurement of new and modernization of existing plants and equipment and investments in software solutions for autonomous machine control or artificial intelligence. Boosting competitiveness and exports and a positive investment climate are very important for a small and open European economy that has the opportunity and capacity for development.
Given the stated advantages of I4.0 companies, it is desirable that the government encourages investment in research and development, i.e., in I4.0 technologies, whereby the approach used by developed countries can be applied. These include the establishment of special funds to finance investments and development projects as in Italy, Germany and Finland; adaptation of regulatory frameworks (encouraging the establishment of start-ups and regulating the use of I4.0 technology such as autonomous vehicles, drones and robots); and changes to and adaptation of the education system to new work skills that are needed and encouraging the application of new technologies. In a few years, a large part of the population will work in jobs that do not yet exist today. In order to make use of the potential of Croatian companies, it is necessary to create stimulating conditions for development and growth of companies whose activity is related to Industry 4.0, regardless of whether it is an activity that uses I4.0 in its production or produces products and services for Industry 4.0. As this research shows, the companies of the fourth industrial revolution are high-quality companies that, by engaging in this global development trend, have the potential to improve the growth and development of the entire economy, with this being possible if investments in such companies are increased and encouraged.

Author Contributions

Conceptualization, R.H. and T.G.; methodology, T.G.; software, R.H. and T.G.; validation, T.G.; formal analysis, T.G.; investigation, R.H.; resources, R.H.; data curation, T.G.; writing—original draft preparation, R.H.; writing—review and editing, R.H. and T.G.; visualization, R.H. and T.G.; supervision, R.H. and T.G.; project administration, R.H. and T.G. All authors have read and agreed to the published version of the manuscript.

Funding

This research received no external funding.

Conflicts of Interest

The authors declare no conflict of interest. The views expressed in this paper are not necessarily the views of the company where author(s) work.

Appendix A. The Methodology Used

Machine learning and data-based approaches are becoming increasingly important in recent years and are applied in many areas: process management and automation, computer science, security (pattern recognition), e-mail classification, fraud detection, anomaly detection, speech recognition, forecasts and process simulations (in finance, healthcare and transportation) and many other areas. There are two key factors on which successful application of machine learning depends: the use of efficient statistical models that reveal complex dependencies between different data and adaptive learning systems that learn from large data sets. Machine learning systems can be supervised and unsupervised. Supervised machine learning systems learn by input data for learning containing the target value of a variable, where the form of data is (input, output) = (x, y). The goal of machine learning is to find the functional connection f between input data x and the target value y: y = f(x). When y is a continuous variable, the use of regression is more appropriate, and when y is a discrete variable, the certain classification algorithm is more efficient.
There are several methods of machine learning that are applied in practice (decision tree, random forest, neural network, K-nearest neighbors, decision tree ensemble, support vector machines, gradient boosting, etc.), among which in recent times, eXtreme Gradient Boosting (XGB) stands out to a more significant degree (see Petropoulos et al. 2018; Chen and Guestrin 2016). The basis of XGB methodology is the algorithm for boosting a decision tree that builds new decision trees by learning from the errors of the previous tree using sequential learning, achieving higher algorithm speed (fewer iterations) and scalability that allows for lower processor and memory requirements even when dealing with big data.
The XGB method starts from the basic linear model (Chen and Guestrin 2016):
y ^ i = j w j x i j
that is, its logistical transformation given by the expression:
P r ( Y = 1 | X ) = 1 1 + e y ^ i
θ = { w j | j = 1 , , d }
The parameters of which are optimized so as to minimize the error on the training sample, but also on other data that are “unseen” by the model:
O b j ( θ ) = L ( θ ) + Ω ( θ )
In the objective function, Obj(Θ) L(Θ) represents the function of minimizing the error on the training data, while Ω(Θ) represents regularization, most often using the L2 Euclidean norm in order to “smooth” the regression and adjust it to “unseen” data. The applied form of the objective function is a binomial logistic function (objective = “binary:logistic”).
For K of decision trees, the model takes the form of
y ^ i = k = 1 K f k ( x i )
and it is similar for any t-th tree
y ^ i ( t ) = k = 1 t f k ( x i )
The loss function for binomial logistic classification takes the form of
L = 1 N i = 1 N ( y i log ( p i ) + ( 1 y i ) log ( 1 p i ) )
where yi is the target value and pi the predicted value. The regularization function for T number of leaves in a tree is defined by the form
Ω = γ T + λ 2 j = 1 T w j 2  
where γ is the minimum degree of loss reduction, the increase of which contributes to the conservatism of the model. XGB uses a gradient descent algorithm to minimize the objective function and tree branching, using the predicted value from the previous step, which is simplified into:
y ( t ) = y ( t 1 ) + η f t ( x i )
where η is the learning rate, which reduces the impact of each new tree in the iteration, and thus the overfitting of the model.
XGB uses a gradient descent for optimization. Gradient descent includes the theorem that the function f(x) at an extreme point (minimum) has a gradient ∇f(x) = 0, while at other points, the value of the gradient ∇f(x) corresponds to the direction of increase of the function. Starting from an initially selected point x, we can find the minimum of the function by an iterative procedure by updating the value of x in the direction opposite to the gradient ∇f until we approach zero at the given precision ε:
x n + 1 = x n η f ( x )
where η is the learning rate, for which, if too high, the procedure diverges, and if it is too low, the procedure converges slowly. If the function is convex, the minimum found is also the global minimum, otherwise it may be local.
XGB uses the decision tree ensemble, whereby the model is trained in an additive or boosting way, and XGB includes a greedy algorithm that greedily adds the ft function to the model, which improves the model the most with respect to the regularization function (see Chen and Guestrin 2016). Ensembles are a common method in building a machine learning algorithm within which a single meta-classifier is built by combining basic classifiers, which results in better classification properties and higher learning speed. The following brief example explains the algorithm of model training using an ensemble of trees, while a detailed explanation is available in the paper (Chen and Guestrin 2016).
Take this example (Chen and Guestrin 2016): we are seeking a model that will recognize whether a person likes computer games. The inputs are data on age, gender and occupation of a person. The algorithm checks different trees and greedily searches for the optimum for each tree and finally adds the best trees to the model, optimizing the objective function, consisting of the loss function l and the regularization function Ω:
O b j = i = 1 n l ( y i , y i ^ ) + k = 1 K Ω ( f k )
Figure A1. Tree ensemble. Source: Chen and Guestrin (2016).
Jrfm 15 00558 g0a1
Each leaf in the tree is assigned with a score. Boosting (additive) learning in each iteration t is contained in the sum of the functions retained in the previous iteration t − 1:
y ^ i ( 0 ) = 0 y ^ i ( 1 ) = f 1 ( x i ) = y ^ i ( 0 ) + f 1 ( x i ) y ^ i ( 2 ) = f 1 ( x i ) + f 2 ( x i ) = y ^ i ( 1 ) + f 2 ( x i ) y ^ i ( t ) = k = 1 t f k ( x i ) = y ^ i ( t 1 ) + f t ( x i )
The logistic cross-entropy loss function l is used in the research (see Equation (A7)), and the regularization function Ω is given by Expression (A8), with a learning curve η = 0.75 (Equation (A9) and Figure 3). If (A12) is included in the objective function (A11), with the inclusion of (A7) and (A8)), and after its approximation by the second-order Taylor polynomial, the objective function of the following form can be obtained (for details see Chen and Guestrin 2016):
O b j = 1 2 j = 1 T G j 2 H j + λ + γ T
where gi and hi denote the components of the gradient function of the Taylor polynomial.
Figure A2. Structure score calculation. Source: Chen and Guestrin (2016).
Jrfm 15 00558 g0a2
Consider ( g i = y ^ ( t 1 ) l ( y i , y ^ ( t 1 ) ) , h i = 2 y ^ ( t 1 ) l ( y i , y ^ ( t 1 ) ) ), while Gi and Hi are their sums. Trees are defined using leaf score vectors, and tree complexity is defined by leaf number and L2 score norm (A8). Optimal leaf division is obtained by linear scanning of instances from left to right, for example, for the age rule xj < a:
Figure A3. Optimal division by linear scanning. Source: Chen and Guestrin (2016).
Jrfm 15 00558 g0a3
Where information gain is
G a i n = G L 2 H L + λ + G R 2 H R + λ ( G L + G R ) 2 H L + H R + λ γ
The exact greedy algorithm for split finding is described in (Chen and Guestrin 2016), and XGB uses a version of this algorithm that includes missing values. In this manner, trees of shallower and deeper structures are built, which are then arranged in a tree ensemble, thus forming a network of learned knowledge. By choosing the right learning rate and depth of trees, a compromise can be reached between model overfitting and underfitting, which is most often checked by cross-validation: the model learns based on the learning set (training data), and it is checked using the validation set (test data). Since the classifier is not trained on the validation set data, we can estimate very well how the classifier will behave on unseen data, and the optimum of the model is one in which the empirical error and generalization error are the smallest.
Figure A4. Components of a supervised learning algorithm. Source: Šnajder and Dalbelo Bašić (2014) (adjusted from the authors).
Jrfm 15 00558 g0a4
Machine learning can be used today to analyze large amounts of data and find dependencies among them, even though their structures are too complex or seem insufficiently connected to draw a conclusion therefrom. Another problem that arises in the application of deep machine learning (excluding overfitting) is unclear interpretation of cause-and-effect and logical connections between data. However, precisely because of their complexity, machine learning techniques generally achieve better results, as evidenced by machine learning competitions, such as Kaggle, within which competitors often use ensembles of several different models that achieve greater precision at the cost of making the interpretation of causality more difficult. The problem is less pronounced in flatter structures, which do not branch too deeply, while individual trees ensure sufficient intelligibility for a segmented interpretation of cause-and-effect phenomena. Therefore, this research does not use too great a depth of learning, and at the same time achieves better results than the comparatively examined classical logistic regression.

References

  1. Acemoglu, Daron, and Pascual Restrepo. 2017. Robots and Jobs: Evidence from US Labour Markets. Available online: http://www.nber.org/papers/w23285 (accessed on 7 February 2019).
  2. Bai, Chunguang, Patrick Dallasega, Guido Orzes, and Joseph Sarkis. 2020. Industry 4.0 technologies assessment: A sustainability perspective. International Journal of Production Economics 229: 107776. [Google Scholar] [CrossRef]
  3. BCG. 2020. Embracing Industry 4.0 and Rediscovering Growth. Boston: Boston Consulting Group. Available online: https://www.bcg.com/capabilities/operations/embracing-industry-4.0-rediscovering-growth.aspx (accessed on 8 March 2020).
  4. Blunck, Erskin, and Hedwig Werthmann. 2017. Industry 4.0—An opportunity to realize sustainable manufacturing and its potential for a circular economy. Paper presented at the Dubrovnik International Economic Meeting, Dubrovnik, Croatia, October 12–14; vol. 3. [Google Scholar]
  5. Bughin, Jacques, Jacob Staun, Jens Riis Andersen, Martin Schultz-Nielsen, Peter Aagaard, and Thyge Enggaard. 2017. Digitally-Enabled Automation and Artificial Intelligence: Shaping the Future of Work in Europe’s Digital Front-Runners. Chicago: McKinsey & Company. Available online: https://www.mckinsey.com/featured-insights/europe/shaping-the-future-of-work-in-europes-nine-digital-front-runner-countries (accessed on 6 May 2019).
  6. Cerved. 2017. Cerved SMEs Report. Available online: https://know.cerved.com/imprese-mercati/2017-cerved-smes-report/ (accessed on 5 February 2019).
  7. Chen, Tianqi, and Carlos Guestrin. 2016. XGBoost: A Scalable Tree Boosting System. San Francisco: KDD. Available online: https://www.kdd.org/kdd2016/papers/files/rfp0697-chenAemb.pdf (accessed on 14 February 2020).
  8. Dalenogare, Lucas Santos, Guilherme Brittes Benitez, Néstor Fabián Ayala, and Alejandro Germán Frank. 2018. The expected contribution of Industry 4.0 technologies for industrial performance. International Journal of Production Economics 204: 383–94. [Google Scholar] [CrossRef]
  9. EIB. 2018. 2017 Activity Report. Luxembourg: European Investment Bank, EIB. [Google Scholar]
  10. Eurostat. 2016. Eurostat Indicators on High-Tech Industry and Knowledge—Intensive Services. Annex 3—High-Tech Aggregation by NACE Rev.2, Eurostat Reference Metadata in Euro SDMX Metadata Structure (ESMS). Available online: https://ec.europa.eu/eurostat/cache/metadata/Annexes/htec_esms_an3.pdf (accessed on 25 February 2019).
  11. FINA. 2019. Dokumentacija PD Modela i Metodologije za Izračun Kreditnog Rejtinga Poduzetnika u Skladu s Basel III Smjernicama ver. 2.1. [Documentation of the PD Model and Methodology for Calculating the Credit Rating of Enterprises in Accordance with the Basel III Guidelines v. 2.1]. Available online: https://www.fina.hr/documents/52450/138867/Dokumentacija+PD+modela+i+metodologije+za+izracun.pdf (accessed on 23 July 2020).
  12. Frey, Carl Benedikt, and Michael A. Osborne. 2013. The Future of Employment: How Susceptible Are Jobs to Computerisation? Oxford: University of Oxford. [Google Scholar]
  13. Grabowska, Sandra, and Sebastian Saniuk. 2022. Business Models in the Industry 4.0 Environment—Results of Web of Science Bibliometric Analysis. Journal of Open Innovation: Technology, Market, and Complexity 8: 19. [Google Scholar] [CrossRef]
  14. Hughes, Laurie, Yogesh K. Dwivedi, Nripendra P. Rana, Michael D. Williams, and Vishnupriya Raghavan. 2022. Perspectives on the future of manufacturing within the Industry 4.0 era. Production Planning & Control 33: 138–58. [Google Scholar] [CrossRef]
  15. Lu, Yang. 2017. Industry 4.0: A survey on technologies, applications and open research issues. Journal of Industrial Information Integration 6: 1–10. [Google Scholar] [CrossRef]
  16. McKinsey. 2018. Croatia—Emerging Digital Challenger Digitization as the New Growth Engine for Croatia. Presentation. Chicago: McKinsey & Company. Available online: https://digitalchallengers.mckinsey.com/files/Digital-Challengers-Perspective-on-Croatia.pdf (accessed on 19 January 2020).
  17. Mourtzis, Dimitris, John Angelopoulos, and Nikos Panopoulos. 2022. A Literature Review of the Challenges and Opportunities of the Transition from Industry 4.0 to Society 5.0. Energises 15: 6276. [Google Scholar] [CrossRef]
  18. Novak, Jurica, Marcin Purta, Tomasz Marciniak, Karol Ignatowicz, Kacper Rozenbaum, and Kasper Yearwood. 2018. The Rise of Digital Challengers: How Digitalization Can Become the Next Growth Engine for Central and Eastern Europe. Chicago: McKinsey. Available online: https://www.mckinsey.com/~/media/McKinsey/Featured%20Insights/Europe/Central%20and%20Eastern%20Europe%20needs%20a%20new%20engine%20for%20growth/The-rise-of-Digital-Challengers.ashx (accessed on 19 January 2020).
  19. Petropoulos, Anastasios, Vasilis Siakoulis, Evaggelos Stavroulakis, and Aristotelis Klamargias. 2018. A Robust Machine Learning Approach for Credit Risk Analysis of Large Loan Level Datasets Using Deep Learning and Extreme Gradient Boosting. Washington, DC: BIS. Available online: https://www.bis.org/ifc/publ/ifcb49_49.pdf (accessed on 22 March 2020).
  20. Posada, Jorge, Carlos Toro, Iñigo Barandiaran, David Oyarzun, Didier Stricker, Raffaele de Amicis, Eduardo B. Pinto, Peter Eisert, Jürgen Döllner, and Ivan Vallarino. 2015. Visual computing as a key enabling technology for industrie 4.0 and industrial internet. IEEE Computer Graphics and Applications 35: 26–40. [Google Scholar] [CrossRef] [PubMed]
  21. PwC. 2014. Industry 4.0—Opportunities and Challenges of the Industrial Internet. Available online: https://www.pwc.nl/en/assets/documents/pwc-industrie-4-0.pdf (accessed on 12 February 2019).
  22. Sauter, Ralf, Maximilian Bode, and Daniel Kittelberger. 2015. How Industry 4.0 Is Changing How W e Manage Value Creation. Controlling: Zeitschrift für erfolgsorientierte Unternehmenssteuerung. München: Beck, vol. 27, pp. 475–84. ISSN 0935-0381. ZDB-ID 649545-X. [Google Scholar]
  23. Šnajder, Jan, and Bojana Dalbelo Bašić. 2014. Strojno Učenje—Skripta (Machine Learning—Course Notes). Zagreb: Faculty of Electrical Engineering and Computing. [Google Scholar]
  24. Thrasher, James. 2014. A Primer On The Internet of Things & RFID. RFIDinsider. Available online: https://www.atlasrfidstore.com/rfid-insider/internet-of-things-and-rfid (accessed on 2 November 2022).
  25. Veža, Ivica, Nikola Gjeldum, and Marko Mladineo. 2018. Inovativno Pametno Poduzeće (Innovative Smart Company). Zagreb: Faculty of Mechanical Engineering and Naval Architecture. [Google Scholar]
  26. Wan, Jiafu, Cai Hu, and Keliang Zhou. 2015. Industrie 4.0: Enabling technologies. Paper presented at 2015 International Conference on Intelligent Computing and Internet of Things, Harbin, China, January 17–18; pp. 135–40. [Google Scholar]
Figure 1. Distribution of the training sample.
Jrfm 15 00558 g001
Figure 2. Distribution of the training sample.
Jrfm 15 00558 g002
Figure 3. Discriminant power and stability of the XGB model with regard to changes in gamma and eta parameters.
Jrfm 15 00558 g003
Figure 4. Information gain of variables of the final model.
Jrfm 15 00558 g004
Figure 5. I4.0 potential distribution density function.
Jrfm 15 00558 g005
Figure 6. Distribution of I4.0 potential across classes of activity.
Jrfm 15 00558 g006
Figure 7. I4.0 potentials according to company size. Source: FINA (author’s work).
Jrfm 15 00558 g007
Figure 8. Distribution of the marginal rate of technical substitution (MRTS).
Jrfm 15 00558 g008
Figure 9. Distribution of the marginal rate of technical substitution (MRTS).
Jrfm 15 00558 g009
Figure 10. Distributions of the share of exports in operating income.
Jrfm 15 00558 g010
Figure 11. Distributions of the share of research and development in long-term assets.
Jrfm 15 00558 g011
Figure 12. Distribution of probability of default (PD).
Jrfm 15 00558 g012
Table 1. Number of analyzed entities according to different samples.
Type of SampleNumber of Entities AnalyzedShare in the Non-Probabilistic Sample
Training sample5127.16%
Test sample5017.00%
Non-probabilistic sample7147100.00%
Table 2. Number of analyzed entities according to different activities.
IndustryNumber of Entities Analyzed
C—manufacturing 2803
D—electricity, gas, steam and air conditioning supply103
H—transportation and storage747
J—information and communication989
M—professional, scientific and technical activities2505
TOTAL7147
Table 3. Number and share of companies with potential for I4.0 across industries—non-probabilistic sample.
ActivityNumberShare (%)
C—manufacturing6344.7
Manufacture of electricity distribution and control apparatus42.8
Other manufacture (of tools, electric motors…)3827.0
Manufacture of pharmaceutical preparations32.1
Manufacture of instruments and appliances for measuring, testing and navigation21.4
Manufacture of communication equipment32.1
Computer activities, data processing, hosting and related activities117.8
Services (other software publishing, other information service activities, management activities…)21.4
D—electricity, gas, steam and air conditioning supply21.4
Electricity distribution and transmission21.4
H—transportation and storage21.4
Services (other software publishing, other information service activities, management activities…)21.4
J—information and communication6042.6
Wired and wireless telecommunications activities32.1
Computer activities, data processing, server services and related activities5337.6
Services (other software publishing, other information service activities, management activities…)42.8
M—professional, scientific and technical activities149.9
Engineering activities and related technical consultancy42.8
Other research and experimental development on natural sciences and engineering53.5
Services (other software publishing, other information service activities, management activities…)53.5
Total141100.0
Table 4. Industry 4.0 potentials.
Potential/SizeNumber of Employees in 2016Total Employees 2017Number of CompaniesShare in Sample AssetsShare in AssetsShare in Sample Operating IncomeShare in Operating Income (%)
Traditional227,256231,710700672.7%100.0%74.1%100.0
SMALL76,22378,470638312.5%17.2%17.3%23.35
≤1014,49114,40143933.8%5.2%4.1%5.59
11–5039,91341,19617407.4%10.1%10.2%13.78
51–25019,88520,8092441.4%1.9%2.9%3.89
>2501934206460.0%0.0%0.1%0.09
MEDIUM-SIZED65,07566,45649315.3%21.0%20.7%27.98
≤10634270.5%0.6%1.1%1.46
11–5021241938572.8%3.9%2.4%3.29
51–25046,73047,26938410.6%14.6%14.8%20.00
>25016,15817,207451.4%1.9%2.4%3.23
LARGE-SCALE85,95886,78413045.0%61.8%36.0%48.67
≤108810.6%0.9%0.1%0.16
11–5016413453.2%4.4%3.6%4.83
51–25026402720162.5%3.5%3.5%4.71
>25083,14683,92210838.6%53.1%28.9%38.97
I4.0 potential47,69648,37214127.3%100.0%25.9%100.0
SMALL19582132740.4%1.5%0.5%2.09
≤109692160.0%0.1%0.0%0.10
11–5011211203450.3%1.2%0.4%1.37
51–250741837130.1%0.3%0.2%0.62
MEDIUM-SIZED51465489351.6%5.7%1.5%5.72
11–5011012030.1%0.2%0.1%0.31
51–25028843157271.3%4.9%1.1%4.13
>2502152221250.2%0.6%0.3%1.27
LARGE-SCALE40,59240,7513225.3%92.8%23.9%92.19
51–25073678640.7%2.4%0.7%2.88
>25039,85639,9652824.6%90.4%23.2%89.32
Total274,952280,0827147100.0% 100.0%
Share of groups of activities C, D, H, J and M in the population 78.2%34.9%88.0% 84.5%
Source: (FINA 2019) (author’s work).
Table 5. ANOVA of the marginal rate of technical substitution.
ANOVA: Single Factor
SUMMARY
GroupsCountSumAverageVariance
I4.014195.65400.67841.6245
Traditional70062738.1780.390831.6031
ANOVA
Source of VariationSSdfMSFp-ValueF Crit
Between Groups11.4297111.42970.36850.54383.8428
Within Groups221,607.1714531.0157
Total221,618.57146
Table 6. ANOVA of average employee cost.
ANOVA: Single Factor
SUMMARY
GroupsCountSumAverageVariance
Traditional7006685,248,60397,8096,998,915,742
I4.014124,938,859176,87112,066,478,002
ANOVA
Source of VariationSSdfMSFp-ValueF Crit
Between Groups863,986,034,7811863,986,034,781121.71890.000003.8428
Within Groups50,716,711,694,67271457,098,210,174
Total51,580,697,729,4537146
Table 7. ANOVA of the share of exports in operating income.
ANOVA: Single Factor
SUMMARY
GroupsCountSumAverageVariance
Traditional70061195.7530.17070.0918
I4.014162.91780.44620.1243
ANOVA
Source of VariationSSdfMSFp-ValueF Crit
Between Groups10.4946011110.4946011113.4220870.000003.84276064
Within Groups661.10514271450.09252696
Total671.5997437146
Table 8. ANOVA of the share of investment in research and development in long-term assets.
ANOVA: Single Factor
SUMMARY
GroupsCountSumAverageVariance
Traditional635522.6705880.003570.00221
I4.014122.44469990.159180.07486
ANOVA
Source of VariationSSdfMSFp-ValueF Crit
Between Groups3.340313.3403885.29850.00003.8429
Within Groups24.502764940.0038
Total27.84306495
Table 9. ANOVA of probability of default.
ANOVA: Single Factor
SUMMARY
GroupsCountSumAverageVariance
Traditional1391.45470.01050.0002
I4.06994185.8754070.02660.0028
ANOVA
Source of VariationSSdfMSFp-ValueF crit
Between Groups0.035410.035312.70300.00043.8428
Within Groups19.858371310.0028
Total19.89377132
Publisher’s Note: MDPI stays neutral with regard to jurisdictional claims in published maps and institutional affiliations.

