1. Introduction
According to the World Bank’s World Development Indicators, the People’s Republic of China (here forward PRC) is the country with the second-largest economy, measured through the GDP in current prices, which has amounted to as much as 14.7 trillion US dollars in 2020. The size of the Chinese economy could be explained via the large amount and a long history of its open market and international trade agreements’ development (
Jiang 2010), since PRC is one of the most important producers in the world, producing and exporting diverse products for various price categories in multiple countries. Ten percent of Chinese households use e-commerce platforms (
The World Bank and International Bank for Reconstruction and Development 2021), partially engaging in the foreign trade of the country.
As such, international trade in the PRC is of the highest importance. Market openness and foreign trade usually contribute significantly to the economic growth of the countries, including China. A study that used both, quantitative and qualitative approaches to analyze the relationship between foreign trade and economic growth in China suggested that the exceptional economic performance of the country could be a result of its dynamic foreign trade policies (
Sun and Heshmati 2010). Other studies imply that the development of agricultural and industrial sectors in PRC, in line with its foreign trade had significantly impacted the economic development growth rate of the country (
Koo and Lou 2002).
Understanding the causal effects between imports, exports and national economic growth is essential for developing trade policies for the social and economic development of a country. Imports and exports are often seen as key contributors and enablers of economic development in catching up countries (
Utonga and Dimoso 2019). Such kinds of connections have always been one of the crucial problems of development economics. For example, if import trade does not promote economic growth, nations may be more enthusiastic to adopt import alternative trading policies. In some cases, a country may choose to promote exports to promote its development. Although the assent to import alternative trade policy may not promote economic growth, the export promotion strategy as a priority cannot guarantee growth. Many studies have observed the correlation between imports, exports, and economic growth (for instance,
Abdulla and Ali 2019;
Aluko and Adeyeye 2020;
Reddy 2020;
Shah et al. 2020). There is no consensus on the results of most studies, especially the direction and effectiveness of the causality effects of imports and exports on growth. The conflicting findings in the literature probes the importance of research that identifies the linkage between imports, exports, and growth, as the results cannot be pervasive to any country because of the diverse national characteristics used in the research.
As one of the leading exporter countries, Chinese export is large, but at the same time, the free trade agreements make foreign products more easily accessible for locals, thus increasing the imports. As import is one of the components of the GDP, the relationship between these two variables is interesting to observe.
On the one hand, the high volume of GDP could be explained by the increase in its components when measuring GDP by expenditure. Accordingly, an increase in consumer expenditure, gross capital formation, government expenditure, or exports will positively impact the GDP, while the increase in imports should have a negative impact on the GDP growth rate. As such, this research will examine the relationship between the import and the GDP in the PRC in recent years, covering a period from 2000 till 2021.
Macroeconomic variables are usually characterized by similar, simultaneous fluctuations. As such, some relationship between the indicators mentioned above is expected to exist. Macroeconomic factors that might affect the relationship between the imports and the GDP growth rate could include monetary indicators, such as the price level, measured by the Consumer Price Index (CPI), the exchange rate between the country and its trading partner, or the nominal/real effective exchange rate, the bank rate, and others.
Some of the indicators, mentioned above, are expected to directly impact the imports, while others might have an indirect impact on the variable. The exchange rate of the local currency to the trading partner’s currency is one of the key indicators that could directly impact the imports of the country since the prices of the imported products are depending on the exchange rate. Nevertheless, it is important to note that this variable affects the exports of the country at the same time.
Therefore, even though the strengthening of the local currency might suggest an increase in the imports of the country, the exports are expected to decrease at the same time, thus having a double decreasing effect on the Gross Domestic Product by decreasing the net exports. The final result depends on the structure and the type of the foreign trade policy of the country since import-dependent countries will most likely observe a decrease in their GDP caused via an increase in imports, while export-dependent countries will observe a reduction in their exports.
This paper is helpful to establish a knowledge system and clarify the relationship among imports and economic growth. The empirical evidence of the impact of participation in China’s economic growth should enlighten some policy makers as the country’s import strategy advances. While less research has been performed on the connection between imports and economic growth of China, little is identified about the influence on economic growth in terms of policy, and little is acknowledged about some of the significant effects of economic policies that inspire imports and national economic growth; moreover, the two-way causality linkage among imports and national economic growth indeed endures the benefits that China derives from policies that promote the key sectors; therefore, this paper bridges this gap by making the contribution of imports and national economic growth.
All in all, the relationship between imports and the Gross Domestic Product could be significant in countries, similar to PRC, which have high import to GDP ratios. Thus, observing how the import growth rate impacts the GDP growth rate in China could lead to some interesting findings.
This research is aiming to analyze the relationship between the imports and the gross domestic product (GDP) in China. For this reason, a quantitative research approach will use to determine the causality between the variables and their impact on the economy. The null hypothesis of the research implies that the import growth rate will have a significant impact on the GDP growth rate in China. This hypothesis was rejected through the Granger causality test, because the results shows that only a uni-directional relationship exists. However, further analysis will be conducted by applying a Vector Auto-Regression (VAR) model that includes leading macroeconomic variables, such as the inflation rate, the bank rate, and the exchange rate between the US dollar and Chinese yuan. The impulse responses of the model aligned with the economic theory and the results suggested that the import growth rate is negatively related to the GDP growth rate, while the GDP growth rate has an initial positive impact on the imports for the first three quarters, which later changes to a negative impact. This time lag suggests that while the impact between the variables is important, negative outcomes could be avoided if proper economic policy is implemented. The government of China should focus on policy implications that further promote export and substitute imported goods with domestic production
2. Literature Review
As mentioned in the introductory part of the paper, this research will focus on multiple leading macroeconomic indicators for the analysis. Such macroeconomic variables are suggested to have a time lag when impacting the economy (
Zhang et al. 2020) and this fact is characteristic of the PRC, as well as many other economies. The transfer mechanism of macroeconomic variable impulses is often slow, and has little or no effect in the short term, but shows a significant relationship in the long term. Therefore, different characteristics and relationships could be observed in the short and long term. This might even suggest that some relationships will be positive in the short term and become negative in the long term, and vice versa.
As suggested by the null hypothesis of the research, there is a strong relationship between the import growth rate and the GDP growth rate in PRC. Some studies suggest the existence of such relationships in several European countries, namely Belgium, France, Germany, Greece, Italy, and the Netherlands (
Michelis and Zestos 2004). The study performs Granger causality tests, confirming the existence of Granger causality from foreign sector to GDP.
Another study also finds bi-directional causality from GDP to imports, as well as exports for five of the six countries analyzed. Other studies find similar relationships in South Asian countries, outlining both short-, and long-term relationships between the trade variables and GDP in a set of countries, namely Bangladesh, India, Nepal, Pakistan, and Sri Lanka (
Din 2004). Again, the study shows bi-directional causality between the variables.
Lastly, a similar study conducted for the US economy showed the existence of bi-directional Granger causality between the exports of the US and its output, while the imports of the United States does not show Granger causality in the GDP growth, since only a single-directional relationship was found (
Guan and Hong 2012). Nevertheless, an earlier study, examining the relationship between the growth rates of imports, exports, and the economic growth in Canada and the US, suggested a stronger Granger causality in Canada, compared to the United States (
Zestos and Tao 2002).
Another study, though focusing on energy use in GDP and foreign trade, again use the Granger representation theorem to investigate the causality between the pairs of indicators (
Dedeoğlu and Kaya 2013). The study suggests the existence of co-integration between the energy use-GDP and energy use-imports with a two-way Granger causality between the pair.
Similar to the above-mentioned studies, this research will examine the relationship between imports and the GDP by similar approaches. Nevertheless, before moving to the analysis of other macroeconomic indicators, aside from the import of goods and services and the Gross Domestic Product of the PRC, the pre-selection of other indicators is necessary. One of the most obvious and important relationships is between imports and the inflation rate of a country.
Several papers suggest that the imports and consumer prices are related, even though some of them suggest distinct pass-through behavior in short- and long terms (
Alsamara et al. 2020;
Ali Nasir et al. 2020;
Junttila and Korhonen 2012). Therefore, inflation was considered as an important factor that could impact or be impacted by the imports.
Another important factor that could affect or be affected by the imports is the exchange rate. Several studies suggest the existence of the relationship between these two variables (
Wang and Yu 2021;
Fan et al. 2018;
Aziz and Ahmad 2018;
C. B. Kim 2017). Some researchers focus on the real or nominal effective exchange rate, while others suggest the existence of bidirectional causality between the imports and the exchange rate of local currency to the US dollar. Given the fact that the US dollar is an international currency that is used in most foreign trade operations, this study will focus on the latter.
Lastly, a discount rate, also known as the bank rate, is another leading macroeconomic variable that has a great impact on the economy. Studies suggest the existence of the relationship between the monetary policy and commodity imports and exports (
M. Kim 2022) and because the bank rate is one of the most important and efficient monetary policy tools, changes in the rate could potentially impact foreign trade. Moreover, the nominal interest rate directly affects economic activity and thus could play an important role in the fluctuation of the import growth rate.
Diverse econometric methodologies have been used to investigate the shock of global trade and economic growth.
Awokuse (
2008) examined the causality between exports, imports, and GDP growth through the Granger causality test and impulse response function to analyze how trade growth (such as exports and imports expansion) will promote economic growth, and the converse. The results of these methods show that imports contribute significantly to economic growth, while GDP growth stimulates growth, as in Colombia, Peru, and Argentina.
Shandre and Gulasekaran (
2006) used vector error correction model (VECM) to analyze the nine important Asian economies, and discovered that imports have a major influence on growth output as compare to exports. However, the results of growth-led export hypothesis on its VAR framework show that the Granger causality between Canada’s exports, regarding trade and GDP, is significant, a is export growth cause to GDP (
Irene and Perry 1996). Thus, although cointegration analysis emphasizes the long-term relationship, Granger causality test identifies the trend of causation linkage between imports, exports, and economic growth.
The novel corona virus epidemic (COVID-19) has greatly boosted the level of uncertainty in all aspects of day to day living (
Caggiano et al. 2020), and medical experts and immunologists remain in the dark about various phases of the virus (
Fauci et al. 2020). Nobody knows when the planet will back to ‘normal’ and it is uncertain when a serum is going to be accessible; this has provoked researchers to highlight the significance of international collaboration and its invention by the government, private, and non-profit entities (
Gates 2020;
Corey et al. 2020). Various nations have applied various forms of blockades and isolation procedures, which have enhanced trauma and fear (
Qiu et al. 2020). Scarcity of health materials, including masks and respirators, resulted in rivalry between various countries to conglomerate them, which prompted healthcare centers and medical facilities to allocate their stocks. These aspects have generated a surge in uncertainty globally.
Baker et al. (
2020) present proof that the present level of uncertainty is greater than throughout the Great Recession of 2008–2009, and nearer the level of the Great Depression in the USA. Furthermore, they state that much recent economic stagnation is an effect of the huge uncertainty caused by the novel corona virus epidemic.
Sharif et al. (
2020) also endorse that novel corona virus epidemic (COVID-19) has had a major impact on political and governing uncertainty.
Albulescu (
2020) also note that the regular published numbers of infections and number of deaths had a positive impact on the EPU level.
Işık et al. (
2020) discussed the effectiveness and influence of the economic policy uncertainty (EPU) index in forecasting the tourism demand (measuring tourism demand) of global tourists from Canada and Mexico to the USA from January 1996 to September 2017. The results showed that EPU is an important forecaster, because the growth of the EPU index will result in reductions in tourism demand in the USA. However, tourists from Canada seem to be more responsive to EPUs. The rise in the EPU index has led to a greater proportion of Canadian’s taking fewer holidays in the USA than Mexicans. In order to boost the explanatory power of models, uncertainty may be an important structure in theory, so it is essential to incorporate it when measuring demand model.
Jan et al. (
2019) examined the influence of import and export on Pakistan’s economic growth. They practiced annual data covering the time duration from 1981 to 2016 to prove that exports have a positive impact on long-run GDP growth, while imports, although not significant, have a negative relationship with Pakistan’s GDP.
Abdulla and Ali (
2019) explored the causality between Iraq’s economic growth, exports, and imports. They stated that, in the long term, imports and exports both have a positive impact on Iraq’s growth of economy.
Aluko and Obalade (
2020) reviewed the link between imports and economic growth of twenty-six (26) South African nations during 1990–2015 through the neoclassical production function framework. Practicing the Granger non causality test, which was introduced by (
Toda and Yamamoto 1995), their experimental outcomes show that there is no causal relationship between imports and economic growth in most of the economies in the model, consequently demonstrating that there is no causality between imports and economic development. Furthermore,
Aluko and Adeyeye (
2020) investigated the causality between imports and economic growth in forty-one (41) South African countries. Their empirical study demonstrates that, in addition to the one-way causation existing between imports and economic growth, and the one-way causation running between economic growth and imports of some economies, the neutral assumption is valid for most countries in the long and short term.
Shah et al. (
2020) revised the nexus between Pakistan’s economic growth, capital formation, exports, and imports on the basis of chronological data from 1976 to 2015. Their research findings elaborate that there is a long-run nexus between real GDP, gross fixed capital formation, exports, and imports. They also highlighted that, in the long run, GDP does not spur imports and exports, but imports and exports promote growth.
Empirical research by (
Reddy 2020) observed the link between India’s economic growth, imports, and exports from 1980 to 2019. The findings showed that there is a one-way causal correlation between economic growth and exports: export stimulates economic growth, exports cause imports, and there is a shock of imports on economic growth in the short term. In the long term, the researcher approved that there is a bi-directional causal linkage existing between economic growth and exports and exports and imports.
Therefore, it can be concluded that both exports and imports will promote India’s economic growth. Similarly,
Maitra (
2020) discussed the assumption of import-led growth in the previous transformation time of India. His analysis found that there is significant evidence (no matter in the short- or long run) to support the ILG assumption, demonstrating that imports have a vital sway on India’s economic growth.
Alam and Sumon (
2020) studied the causality between the trade openness and economic growth of 15 Asian countries from 1990 to 2017. They used panel cointegration and causation methods to indicate the existence of cointegration between variables. Moreover, their research results show the two-way causality between economic growth and trade openness of the surveyed countries.
Usman and Bashir (
2022) examined the causal nexus between imports and economic growth in China, India, and G7 economies. They used BC Granger causality analysis in the frequency domain of short (temporary) and long term (permanent) causality. Their empirical results suggested that there is a frequency domain (high and low) proof of the bi-directional causal nexus between imports and economic growth. The imports and economic growth in most economies seem to be long-term and short-term dependent.
Lawal et al. (
2022) examined the nexus between economic growth and exchange rate, remittances, trade, and agricultural output based on data sourced from 1980 to 2018 for 10 selected African economies. The study employed both the Dumitrescu and Hurlin time-domain Granger causality test and the Croux and Reusens frequency domain Granger causality test. However, the results from the time domain test suggest that causality only exists between economic growth and both exchange rate and trade, with no significant relationship between economic growth and both remittances and agricultural output. Moreover, the authors employed a frequency domain model in analysis; the results suggested that there is a bi-directional temporary and permanent causality between economic growth and exchange rate, trade, agriculture, and remittances. Their results suggest the validity of both the J-Curve and Marshall–Lerner hypotheses in the studied economies.
Therefore, these indicators will be used in the analysis; nevertheless, the study will start with causality analysis between the import growth rate and the Gross Domestic Product growth rate in PRC, and will later introduce a model that will include the upper-mentioned indicators.
3. Methodology
The relationship between macroeconomic variables, such as the imports and the Gross Domestic Product, could be observed via correlation testing. Nevertheless, the suggestion about the causation between such variables cannot be made based on correlation coefficients alone. Some researchers suggest that cause-and-effect relationship is of higher importance, giving spurious correlation examples and outlining the difference between correlation and causation, stating that “correlation is not causation” (
Barrowman 2014). Therefore, a debate about measuring less meaningful correlations arises within economists.
One of the reliable causation testing approaches is the Granger approach (
Granger 1969) that aims to determine whether an event causes another event to happen, what part, or amount of this second event could be explained by its own historical (lagged) values, and how much due to the historical values of the first event improve the explanation. The results of the test either determine the existence of causality, stating that an event is Granger-caused by another event, or vice-versa. Therefore, two-way causation is tested.
For this purpose, macroeconomic variables of PRC are investigated via Granger causality test. Particularly, the relationship between imports and the GDP will be tested. The research uses this method for two distinct lags of 4 and 8 quarters, suggesting that the import in PRC might influence its economy in either one or two years, considering that most macroeconomic variables are characterized by time lag. The regression equations of the analysis are given below:
where
is the lag coefficient with the condition that takes the values from 1 to 4, or from 1 to 8 and the GDP and Imports are the annual growth rates of the variables, represented as the first differences of their natural values. The reason for this is the fact that the upper-mentioned variables have different characteristics. The annual GDP growth rate series at level tended to be non-stationary, but stationary at the first difference, according to the Augmented Dickey–Fuller unit root tests. On the other hand, the annual import growth rate was stationary at both level and the first difference.
Even though Granger causality test is more reliable when examining macroeconomic variables, compared to correlation analysis, it only measures precedence and information content, rather than indicating more complex forms of causality. Macroeconomic indicators are usually related and mutual movements and a fluctuation between them is expected. Studies suggest the existence of such relationships (
Iyetomi et al. 2020). Therefore, a Vector Auto-Regression model is applied to further improve the reliability of the analysis by including other important, leading macroeconomic factors that might affect either of the variables.
For this reason, aside from the two major driving variables that are analyzed in this paper, other leading macroeconomic indicators, such as the interest rate, expressed via discount, or the bank rate, annual headline inflation, measured using Consumer Price Index (CPI) and the exchange rate of Chinese yuan to US dollar were added as factors that might influence the relationship. Thus, a VAR model was built to assess the two-way causality and the impact of the upper-mentioned indicators on Imports and economic growth in PRC.
This paper states empirical research using the vector autoregression (VAR) model introduced by (
Sims 1980). The VAR model uses an unstructured method to check multivariate chronological series variables, and establishes the link between variables in accordance with the analytical forms of data. It forms the framework by considering each endogenous variable in the system as a function of the lag value of all endogenous variables, so as to assess the vigorous relationship between joint endogenous variables other than any preceding restrictions. Therefore, this research study adopts VAR model.
4. Data Collection
The data of the two of the main indicators, the imports growth rate and the GDP growth rate, were collected from the Federal Reserve Bank of St. Louis database. The quarterly seasonally adjusted data for the Gross Domestic Product in current prices in the Chinese yuan were collected, covering a period from 1992 till 2021. The quarterly, seasonally adjusted imports data in local currency were collected from the same database, covering a similar period. Nevertheless, the sample analyzed included only a period from 2000 to 2021. Growth rates of the variables were calculated as a year over year changes in the quarterly data.
The inflation rate was derived from the Consumer Price Index. Monthly, not seasonally, adjusted data for Consumer Price Index on all items for China, the base year 2015, were again collected from the database of the Federal Reserve Bank of St. Louis, covering a period from 1993 to 2021. The quarterly inflation rate was calculated from the year-over-year changes in the average values of monthly CPI data.
The data about the monthly, not seasonally adjusted interest rates, or the discount rates in PRC, as a percent per Annum, were collected from the same database and averaged to create quarterly data, necessary for consistency. The period covered included the years 1990–2021.
Lastly, the exchange rate between the USD and Chinese yuan, collected from the Federal Reserve Bank of St. Louis database, covered a period from 1981 to 2021. The foreign exchange rate between the PRC and the United States expressed by Chinese yuan to one USD, monthly, not seasonally, adjusted data were averaged to create quarterly data and included in the analysis. As mentioned above, even though the data were available for earlier periods, for more reliability of the analysis, a sample period of 2000–2021 was analyzed, since the importance of foreign trade became higher since the start of the 21st century.
5. Results
As stated in the methodological part of the paper, at the first stage of the analysis, Granger causality tests were performed for the GDP and import annual growth rates series at first differences for two distinct time lags—four quarters and eight quarters. The observation includes data series from the first quarter of 2000 to the first quarter of 2021. The results of the analysis for the test with four quarter lags are represented (see
Table 1).
Two null hypotheses are tested as follows: 1. GDP annual growth rate does not Granger-cause import annual growth rate; 2. Import annual growth rate does not Granger-cause GDP annual growth rate. Based on the results shown in the
Table 1, the first null hypothesis can be rejected, suggesting that the GDP growth rate could be Granger-causing import growth rate. However, the second null hypothesis could not be rejected, thus rejecting the existence of Granger-causality of Imports to GDP.
While the analysis with four lags showed some Granger-causality, after including eight lags in the model, Granger-causality could no longer be observed. The analysis period is similar and includes data from the first quarter of 2000 to the first quarter of 2021. A similar test with similar null hypothesis is shown (see
Table 2): 1. GDP annual growth rate does not Granger-cause import annual growth rate; 2. Import annual growth rate does not Granger-cause GDP annual growth rate, none of which could be rejected when eight lags are included. Therefore, we could suggest that the GDP growth rate helps predicting import growth rate values over no more than four quarters. The current research results show that the positive causality relationship between economic growth and imports is consistent with the early research results of (
Aluko and Adeyeye 2020;
Aluko and Obalade 2020;
Shah et al. 2020;
Usman and Bashir 2022), which also presented significant causal relation from economic growth to imports. Our findings are contradictory to the results of (
Abdulla and Ali 2019;
Maitra 2020), who stated that imports have a positive impact on economic growth.
At the next stage, more complex analysis was completed using Vector Auto-Regression analysis. Annual imports growth rate, annual GDP growth rate, discount rate, inflation, and the exchange rate between the yuan and the USD series are included as endogenous variables, while constant serves as an exogenous variable. The model includes lag intervals of 1 and 2 for endogenous variables and the analysis covers the period from the first quarter of 2000 to the first quarter of 2021.
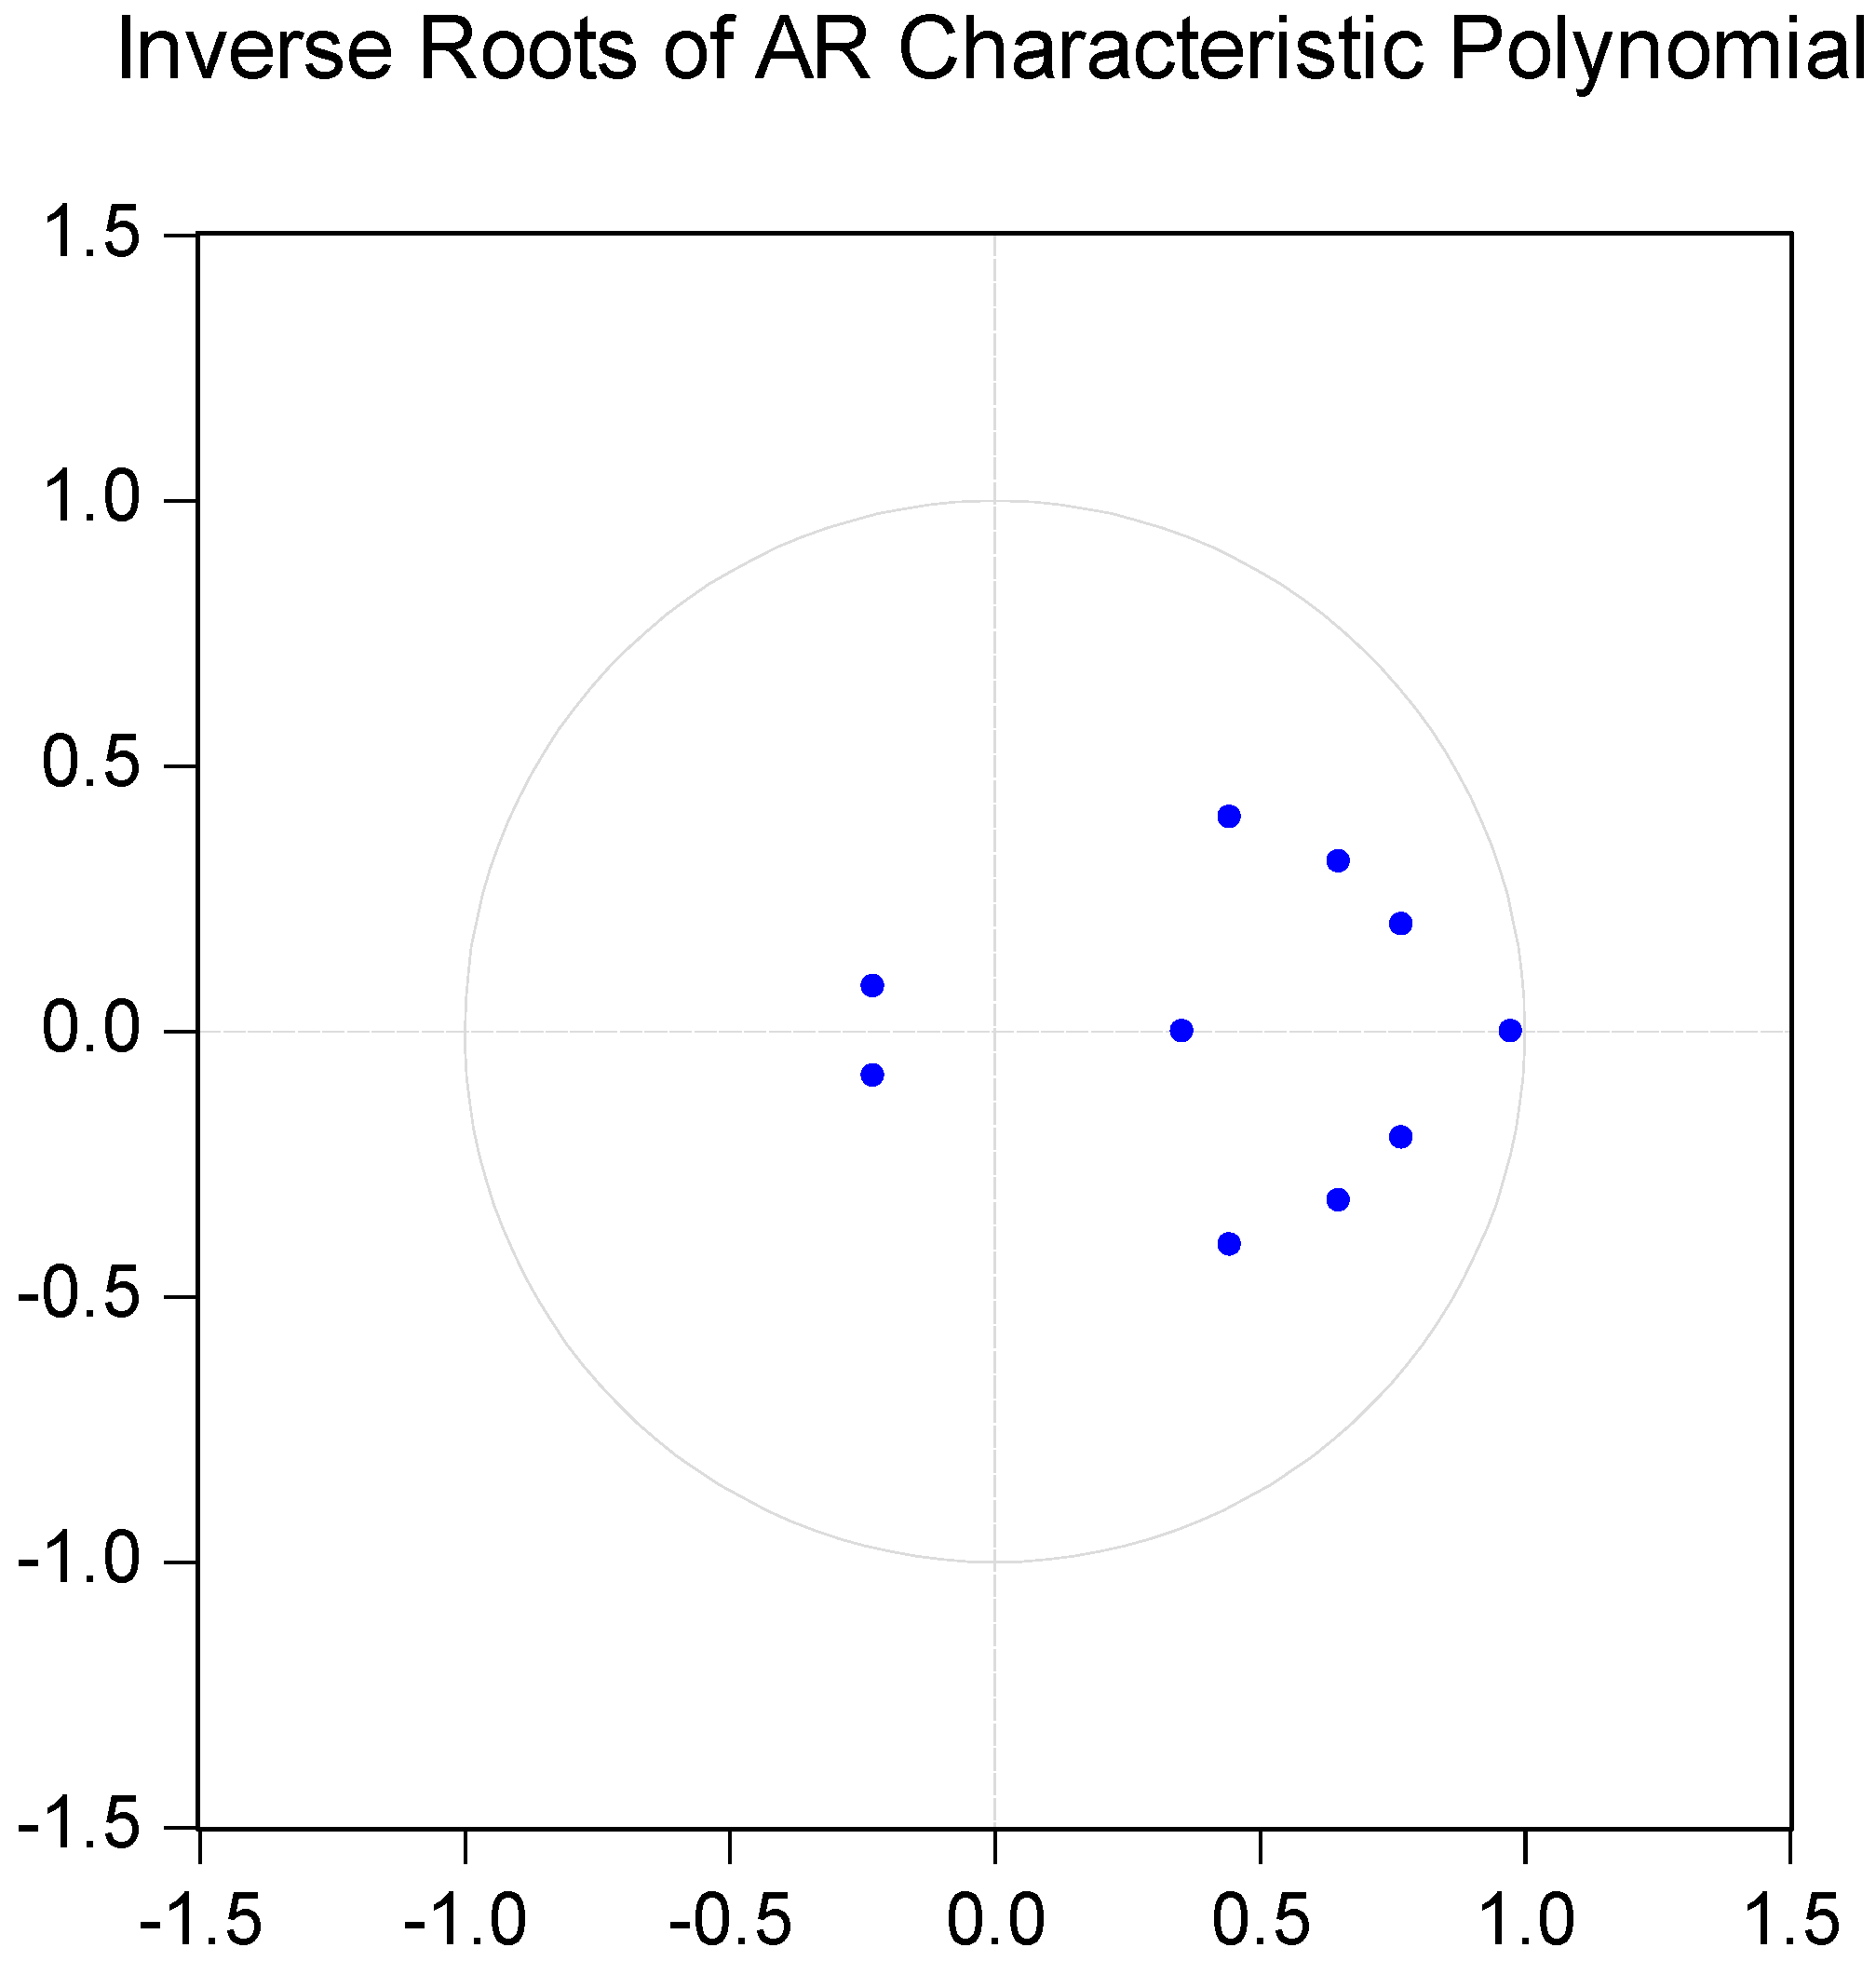
The results of the VAR model are given below. The unit root test results (see
Figure 1) outline the stability of the Vector Auto-Regression model. VAR model is stationary and satisfies the stability condition, as each root module is below 1.0 and no roots lie outside the unit circle.
The results of the VAR model estimation (see
Table 3) suggest that the model is sufficient with a coefficient of determination of 79.8 percent and the adjusted coefficient of determination of 77.1%. Therefore, we could suggest that the model is significant.
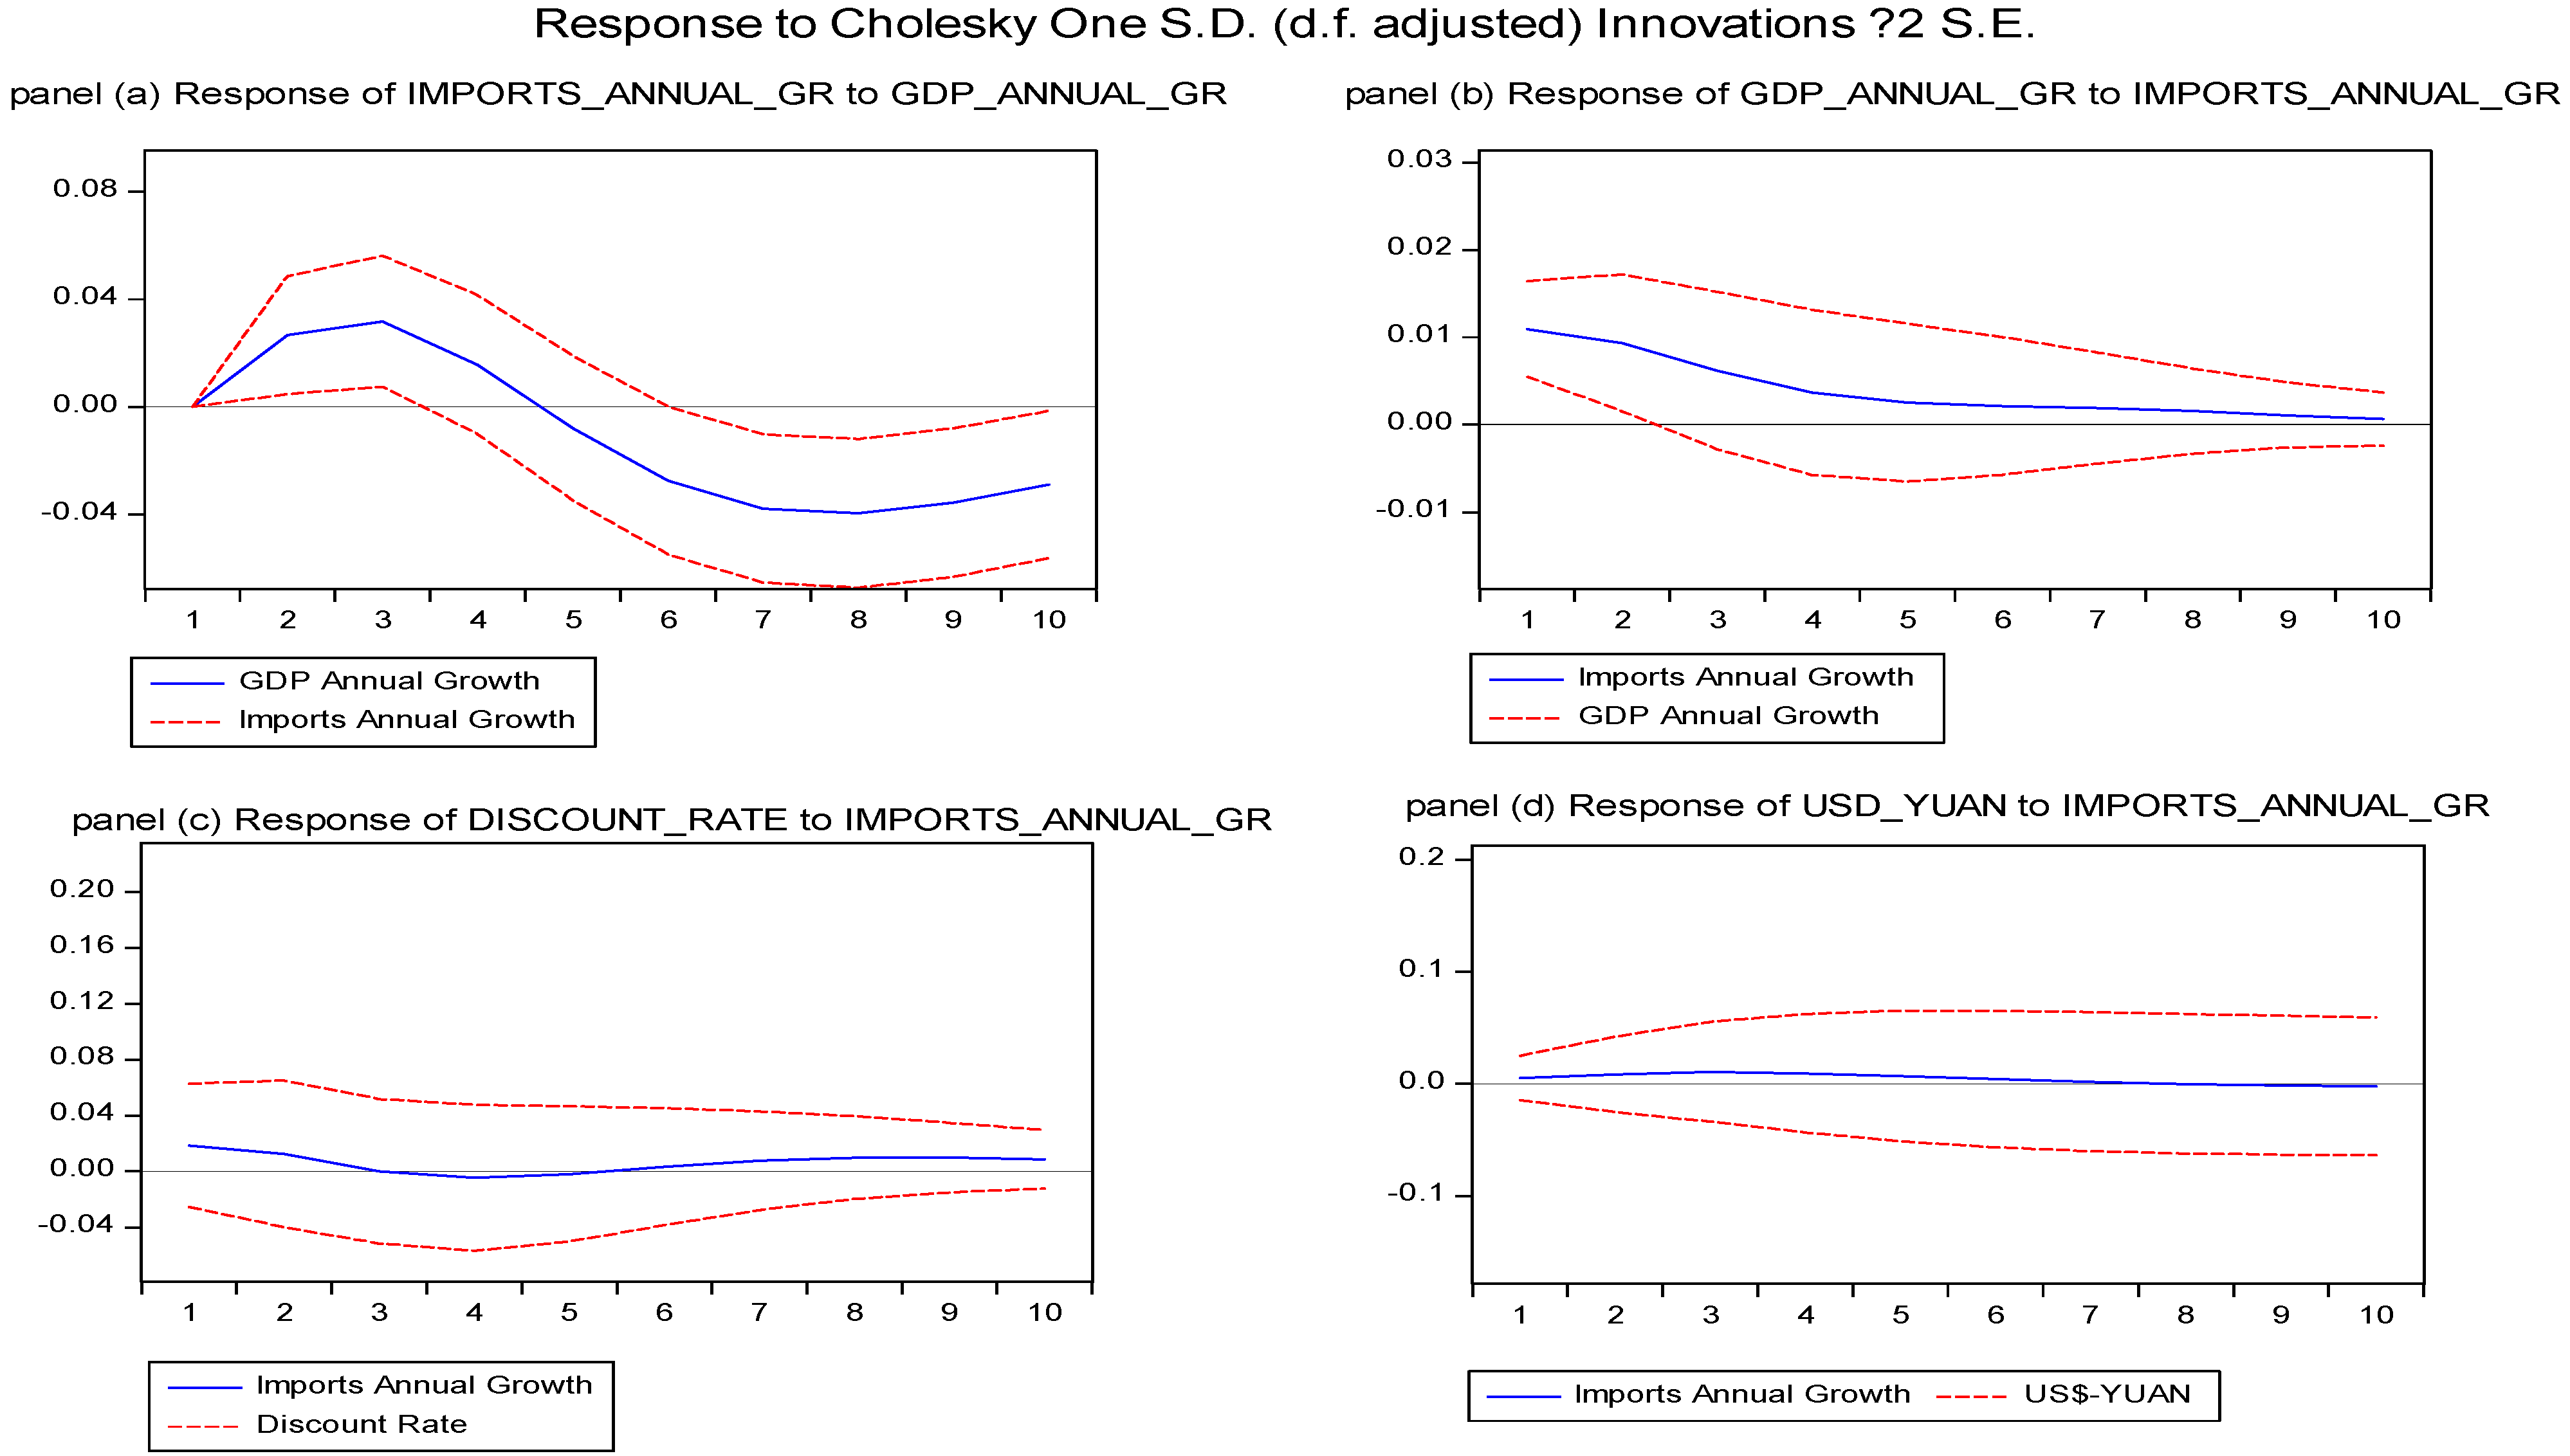
The impulse responses of the above-mentioned five leading macroeconomic variables included in the VAR model returned interesting results. The model suggests relationships and describes the impact from and the response of these variables between each pair, four of which are of the highest importance (see
Figure 2).
The first two charts (see
Figure 2, panel (a) and panel (b)) are of the highest importance for this research.
Figure 2 panel (a) suggests that the GDP growth rate has an impact on the import and the trend of the relationship is somewhat aligned with the economic theory. The import is initially impacted positively by the GDP growth rate, but the import growth rate tempo decreases from the second quarter and starts falling after the third quarter, after which a negative relationship continues (see
Figure 2, panel (a)). The initial increase could be explained by the fact that a larger economy could allow for larger imports. After the third quarter, however, the import growth rate starts decreasing, since the growth of GDP suggests an increase in local, domestic production, and PRC has a diverse market.
The direct, expected impact of the import growth rate on the GDP growth rate is suggested (see
Figure 2, panel (b)). The chart implies the negative impact of imports on GDP since import is the only component of GDP that reduces it via net exports.
The impact of imports on the discount rate and the exchange rate could also be observed. The relationship of the imports and the discount rate are of less importance and a defined trend cannot be observed (see
Figure 2, panel (c)). On the other hand, the impact of the import growth rate on the exchange rate between the USD/CNY pair in PRC can be observed (see
Figure 2, panel (d)). The increase in imports corresponds to the slight increase in the exchange rate between the USD and CNY, implying the strengthening of the US dollar and decreasing the value of the yuan since the direct quotation is used. Thus, this relationship aligns with the economic theory and could be deemed significant. In addition, it is recognized that the increase in economic growth has amplified imports, while real exchange rate for imports is contrarily proportional to imports at both stages. Basically, the country’s imports are a stimulant for growth. The results show that the government actions have double influence on economic indexes. Actually, though these actions are convoyed by a sharp rise in inflation, they greatly lowered the exchange rate. In addition, due to the rise in demand relative to supply, the rise in the number of affirmed cases caused a rise in inflation and decline in the exchange rate. Hence, extenuating the epidemic might avoid an economic crisis or create more worsened condition. Distress of fiscal and economic downfall caused enhanced demand and growth of foreign exchange by entities and industries.
6. Conclusions
The growing uncertainty is classified among the leading sensation of the present advance system of economy. It influences some macroeconomic parameters as well as transforms consumer’s behavior decisions to choose goods and services based on their basic preferences.
The study inspects the association between economic growth and imports from China, based on data sourced from 2000 to 2021. The two key variables that were tested within the scope of this research were the import growth rate and the Gross Domestic Product growth rate. The null hypothesis suggested that the import growth rate had an impact on the GDP growth rate in PRC. Based on the results of the Granger causality test, the null hypothesis was rejected, since only the opposite relationship was found to be significant. Nevertheless, a deeper analysis using the Vector Auto-Regression model showed that there is some relationship between the variables. The results showed that the import growth rate negatively impacts the GDP growth rate, while the GDP growth rate has a more complex impact on the imports, showing an initial increase followed by a negative relationship. Import growth rate of PRC did also impact the exchange rate and the discount rate of the country.
Several developing economies with flexible exchange rate frameworks and controllable foreign exchange exposure have the chance to additionally relax their monetary policy in the result of a decline in inflation, whereas availing the chance to carry financial and operational measures to enhance shareholder trust.
Furthermore, while the opening policy has enabled China to unify the global market and the exchange rate policy makes its currency depreciated in the theoretical equilibrium. As a consequence, this caused more expensive imports and foreign exchange restriction, as financial markets were intervened during most of the period considered.
In sum, in this study we offer an alternative view of one of the most controversial debates on the sources of China’s growth and its impact on economic growth in the related literature and the views of policymakers. In short, we show that imports are significant engine of economic growth; however, an appreciation of China’s currency would make imports cheaper and thus increase economic growth, helping China rebalance its sources of growth.
In conclusion, in this research, we delivered another perspective on the origin of China’s economic growth and its impact on one of the most controversial debates in the economic growth-related literature and policy makers’ views. In short, we show that imports are an important engine of economic growth. Therefore, the appreciation of the RMB will make imports cheaper, thus promoting economic growth and serving China redress its sources of growth.
Considering the vulnerability of Chinese economy and its macroeconomic indicators, this research has pointed out the urgent need to further integrate smart trade policies through the framework of national macroeconomic policies to curb the influence of imports on economic growth Forthcoming research can be carried out by integrating the limitation in the present study and further additional possible variables, such as globalization. Present intricate and uncertain world economies need this consideration more essentially than before. Moreover, empirical research may be required applying diverse methods and data including different countries of different regions.


