1. Introduction
Modern financial systems rely on safe assets. They facilitate financial transactions, which often entail a contractual requirement to post safe assets as collateral (e.g.,
Brunnermeier et al. 2017). In addition, safe assets allow market participants to transfer risks, including liquidity and market risks, without creating new risks, such as counterparty and credit risks, in return (
Giovanni 2013). To comply with liquidity regulations, banks need to hold safe assets to meet their funding needs in a stress scenario. Finally, central banks rely on safe assets when implementing monetary policies, exchanging central bank liquidity against non-cash safe assets (
Brunnermeier and Sannikov 2016).
1This article studies the quickly growing market of EU-issued bonds to assess their prospects for ultimately becoming a genuine supranational euro-denominated safe asset. Safe assets are characterized by three aspects (
Gorton 2017;
Brunnermeier et al. 2016,
2017;
Brunnermeier and Huang 2018;
Gorton and Ordonez 2022): first, a low default risk, or high asset “quality”; second, like a good friend, a safe asset retains its value during difficult times (“robustness”);
2 and third, a safe asset can be sold at or near current (robust) market prices in most market conditions (“liquidity”). To aid our assessment, we establish several stylized facts for EU bonds as a growing asset class below.
There is widespread agreement among policymakers that the euro area suffers from a relative lack of euro-denominated safe assets, particularly when compared to the United States (see, e.g.,
Gorton et al. 2012;
Juncker et al. 2015;
Brunnermeier et al. 2011,
2017;
Gossé and Mourjane 2021). For example,
Gossé and Mourjane (
2021) estimate that, in 2019, the supply of sovereign bonds rated AA or higher amounted to just 37% of the GDP in European Union (EU) member states, compared with 89% of the GDP in the United States. In addition, the market for sovereign bonds in the EU is fragmented across different sub-markets, and market participants’ perceptions about the relative risks of these sub-markets can change over time.
The lack and fragmentation of euro-denominated safe assets are unfortunate, since both can increase the risk of vicious bank-sovereign “doom loops” of high public borrowing costs in bad times, and of unwelcome flights-to-safety that increase financial fragmentation (
Brunnermeier et al. 2016,
2017). In the absence of a supranational euro-denominated (EU) safe asset, a flight-to-safety would be associated with capital leaving, say, Italy, while flowing into, say, Germany, raising Italian yields while lowering German yields. The BTP-Bund yield spread is one measure of financial fragmentation that is frequently commented on in the financial press. In addition, “doom loops” can be a consequence of weak banks holding a disproportionate share of flighty assets; see, e.g.,
Brunnermeier et al. (
2017) and
Leonello (
2018).
Almost all of the EU’s net bond issuance between 2020 and 2021 was closely connected to its “temporary Support to mitigate Unemployment Risks in an Emergency” (SURE) and the “Next Generation EU” (NGEU) policy initiatives. Both initiatives were proposed in the context of the EU’s response to the COVID-19 pandemic recession. Financial assistance of up to EUR 100 bn can be provided within SURE in the form of loans from the EU to affected member states, mainly to address sudden increases in public expenditure for the preservation of employment. In July 2020, the European Council agreed that the EU borrows up to EUR 750 bn (in 2018 prices), i.e., up to EUR 800 bn in 2021 (adjusted for inflation), to fund COVID-19 repair and recovery work through its NGEU instrument.
Our paper documents the following seven empirical findings on recently issued EU bonds. First, EU bonds are widely considered by market participants as low in default risk, owing to their guarantee structure and backing by EU member states. Rating agencies are in broad—but not entirely complete—agreement that EU bonds are of high credit quality. Second, EU-Bund yield spreads remained contained throughout the COVID-19 pandemic recession in 2020, suggesting that EU yields are robust to market downturns. Third, before the issuance of new SURE bonds in October 2020, EU bonds were subject to much lower market liquidity (i.e., wider bid–ask spreads) than large euro area member states’ sovereign bonds, including those of Germany, France, and Italy. Bid–ask spreads have decreased since then. Fourth, “tapping” previously issued EU bonds increased these bonds’ secondary market liquidity, and thus appears to be an expedient way to raise EU funding in the future. The average bond tap in our sample is associated with a decrease of 0.16 basis points (bps) in its bid–ask spread, from 2.78 bps on average pre-tap to 2.62 bps on average post-tap. This result remains similar if tapped bonds are matched to a control group of comparable non-tapped bonds. Fifth, changes in EU yields over time are most closely correlated with those of highly rated but less liquid German Kreditanstalt für Wiederaufbau (KfW) bonds, suggesting that liquidity risk premia are an important component of EU yields. Sixth, EU yield spreads over ten-year German benchmark bonds (Bunds) have decreased notably following recent, COVID-19-related SURE and NGEU bond issuances, suggesting that investors recognized the improved liquidity conditions. Finally, a safe asset’s market liquidity should be sufficiently high to accommodate central banks’ unconventional monetary policy operations. In this regard, we document that Eurosystem purchases and lagged holdings of EU bonds did not raise their bid–ask spreads, suggesting that the market is already sufficiently liquid to accommodate such monetary policy operations.
Summing up and weighing all these findings, we conclude that the EU bonds’ considerably improved but still somewhat sub-par market liquidity, along with the time-limited emergency nature of the EU’s SURE and NGEU policy initiatives, currently constitute the main obstacles to their long-run prospects for becoming a genuine euro-denominated safe asset. Looking forward, the factors that could further promote EU bonds’ status as a supranational safe asset include a permanently bond-financed EU budget and an increase in private market attention (e.g., in the form of inclusion in sovereign bond indices and the establishment of repo and futures markets). A permanently bond-financed EU budget is, however, subject to substantial legal and political obstacles.
2. Data and Market Structure
The data for our study were obtained from the European Commission’s website (bond characteristics and identifiers); Bloomberg and Refinitiv (outstanding volumes and bid-and-ask quotes); and Moody’s, S&P, Fitch, and DBRS (for credit ratings). Disaggregated Eurosystem purchase and holdings data at the bond level were obtained from an ECB-internal database and are confidential as of the time of writing.
The implementation of SURE and NGEU in 2020 and 2021 marked a watershed in the EU’s common fiscal policy regarding the sizable volumes and the independent funding structures. Historically, EU borrowing has taken place since the early 1980s and has traditionally been used to finance loans to individual EU member states and other entities. In the past, EU funds were typically lent to beneficiary countries in a back-to-back fashion, meaning that countries’ loan repayments to the EU were matched one-for-one with the EU’s coupon and principal payments. While this strategy successfully addressed smaller funding needs in the past, the much larger SURE and NGEU-related volumes have required more active liquidity management of the EU’s balance sheet. In April 2021, the practice of back-to-back lending was, therefore, not made a requirement for the NGEU initiative, giving way to a more flexible management of EU funds instead.
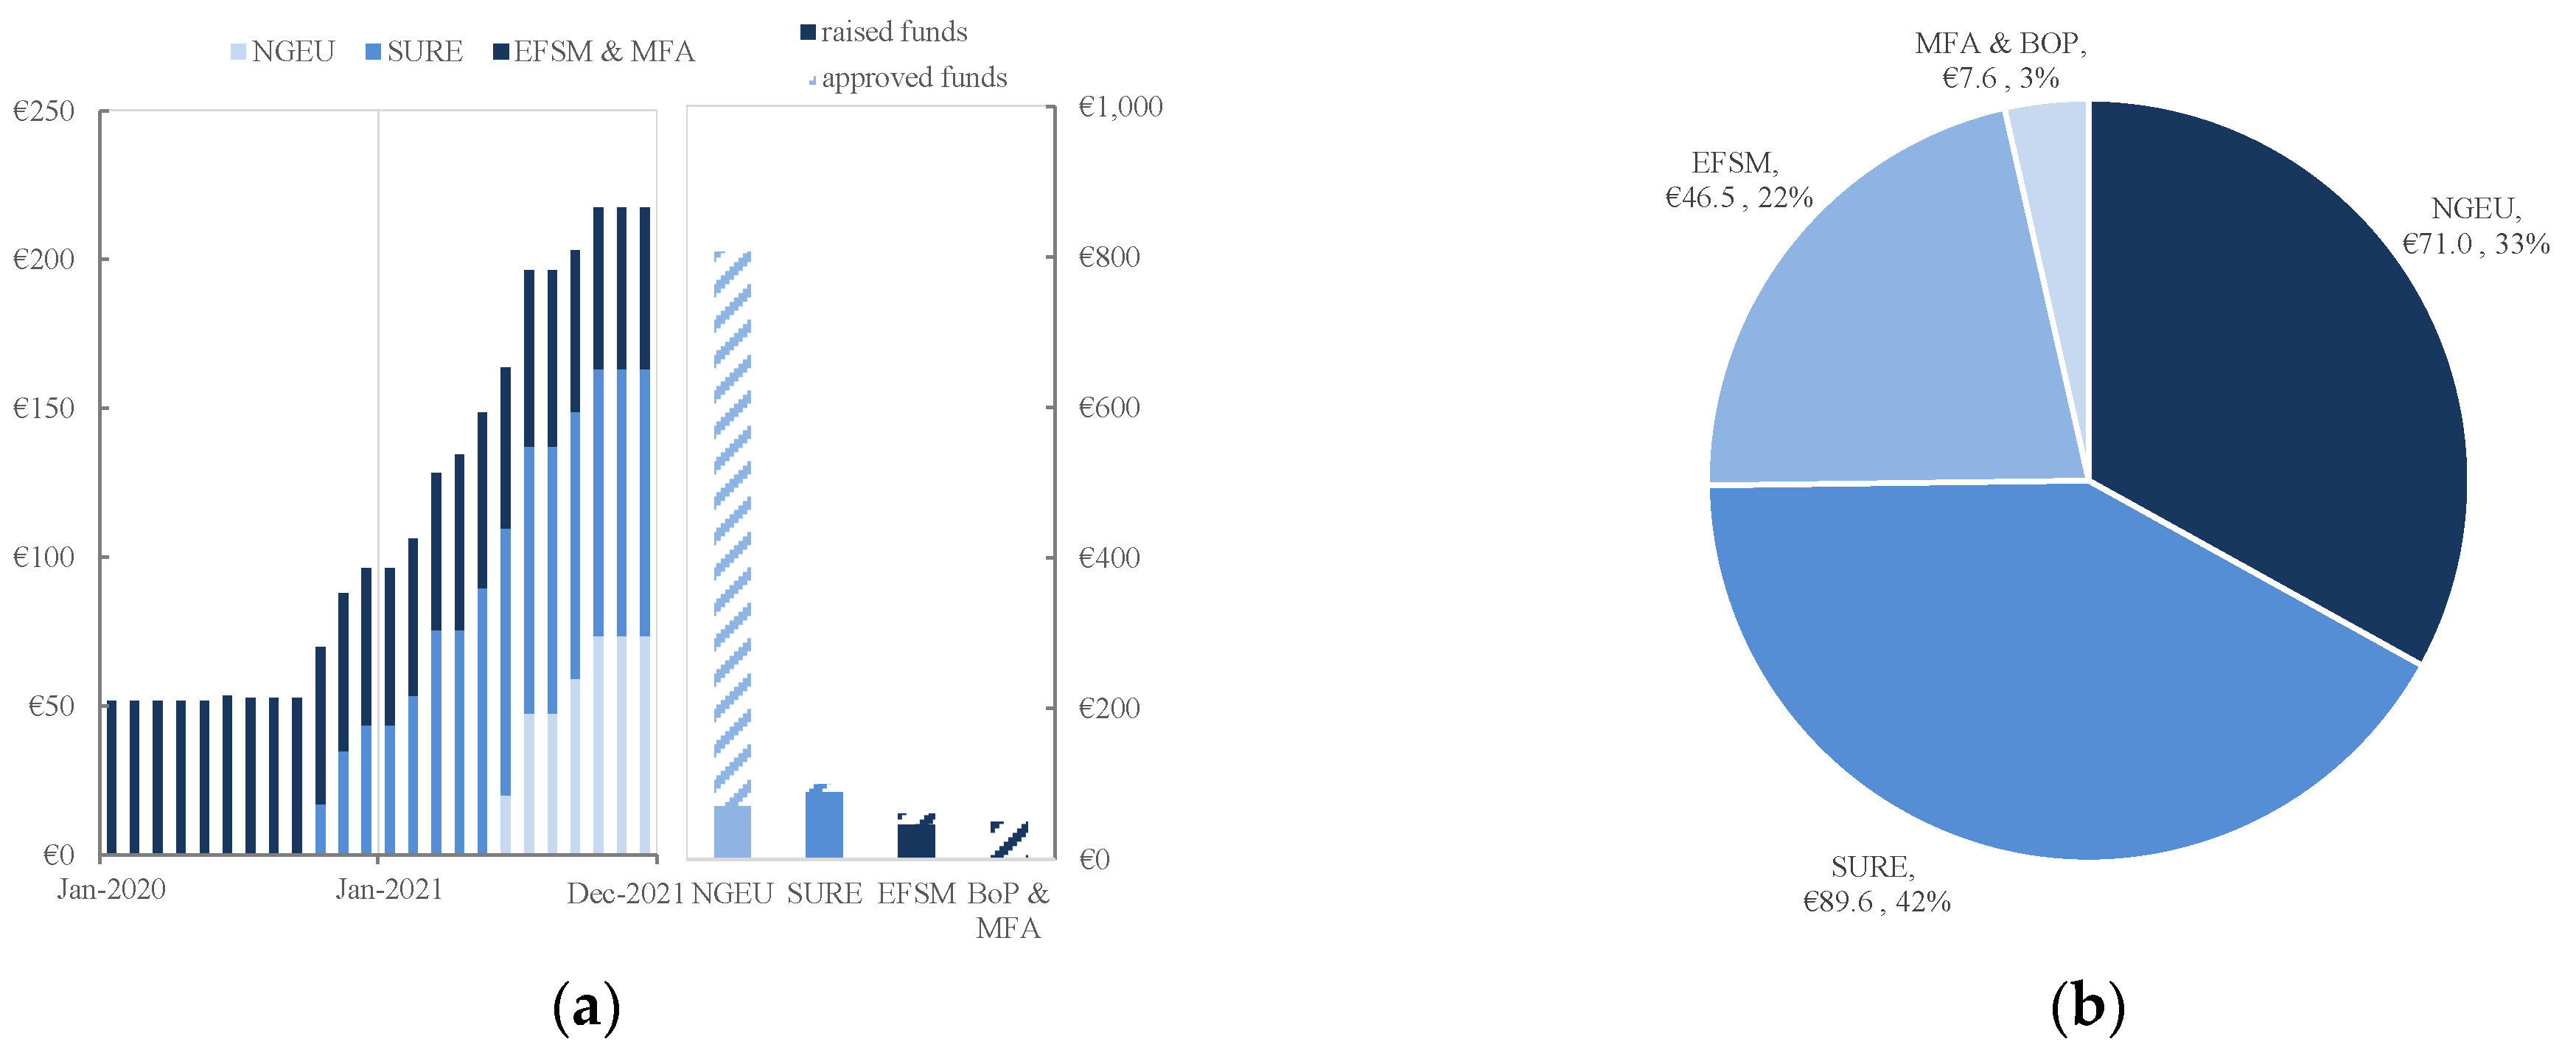
Figure 1 indicates that, as of December 2021, the amount of outstanding EU bonds has grown to EUR 215 billion (bn) in total. The outstanding volumes are mostly related to three initiatives: the European Financial Stability Mechanism (EFSM), SURE, and NGEU. The Macro-Financial Assistance (MFA) and Balance of Payment (BOP) Programs are smaller and play only a minor role in EU funding.
3 The first SURE bonds were issued in October 2020, while the first NGEU bonds were issued in June 2021. By December 2021, SURE and NGEU-related bonds accounted for three-quarters of all outstanding debt. By 2028, NGEU volumes are foreseen to reach EUR 800 bn, which is more than twelve times the December 2021 volume. Together with the approved funding for the SURE, EFSM, and BOP programs, with limits of EUR 100 bn, EUR 60 bn, and EUR 50 bn each, the total available amount of EU bonds is scheduled to exceed EUR 1 trillion by 2028. This amount corresponds to approximately 43% of Germany’s public debt in 2020, and approximately 65% of Spain’s.
3. Credit Risk
In bond markets, investors demand additional compensation relative to the safest assets for a range of risks, with default risk (i.e., the risk that the issuer does not repay their obligations) often being the most important.
4 Several institutional layers of debt-service protection render EU-issued bonds, including SURE and NGEU-related bonds, low in default risk. Legally, EU borrowings are direct and unconditional obligations of the EU. The EU is bound by the “Treaty on the Functioning of the EU” to service EU debt. The EU’s debt service is ensured based on multiple layers of debt-service protection. First, the EU services its debt with the payments it receives from the loan beneficiaries. These beneficiaries are EU member states, which have historically always serviced their debts to the EU. Second, in the event of a non-payment of a loan beneficiary, the EU budget helps ensure that the EU can honor its obligations. To this end, the EU can draw upon unprecedented financial resources from EU member states’ treasuries, of up to 2% of the EU gross national income (see the next paragraph). Finally, member states have provided additional guarantees to cover shortfalls from member states’ loan repayments. For example, guarantees worth EUR 25 bn were made available for the EUR 100 bn worth of SURE loans.
Following the ratification of the EU’s Own Resources Decision (ORD) in May 2021, the European Commission obtained an enhanced, direct recourse to EU member states’ national treasuries. The ratification of the ORD by all EU member states was a pre-condition for the launch of NGEU-related payments to those member states; therefore, the ORD was adopted at a remarkable speed between December 2020 and May 2021. According to the ORD, the maximum level of resources that the European Commission can request from member states’ treasuries rose permanently from 1.2% of the EU’s gross national income to 1.4%. An additional temporary increase in resources, worth a further 0.6% of the EU’s gross national income, was devoted exclusively to the financing of NGEU-related bonds (see, e.g.,
European Parliament 2021). The ORD provides the EU with a certain amount of financial autonomy and funding flexibility, further lowering credit-risk concerns associated with EU-issued bonds. To some extent, the ORD positively counterbalances the European Commission’s limited direct taxation powers (mostly relating to customs duties).
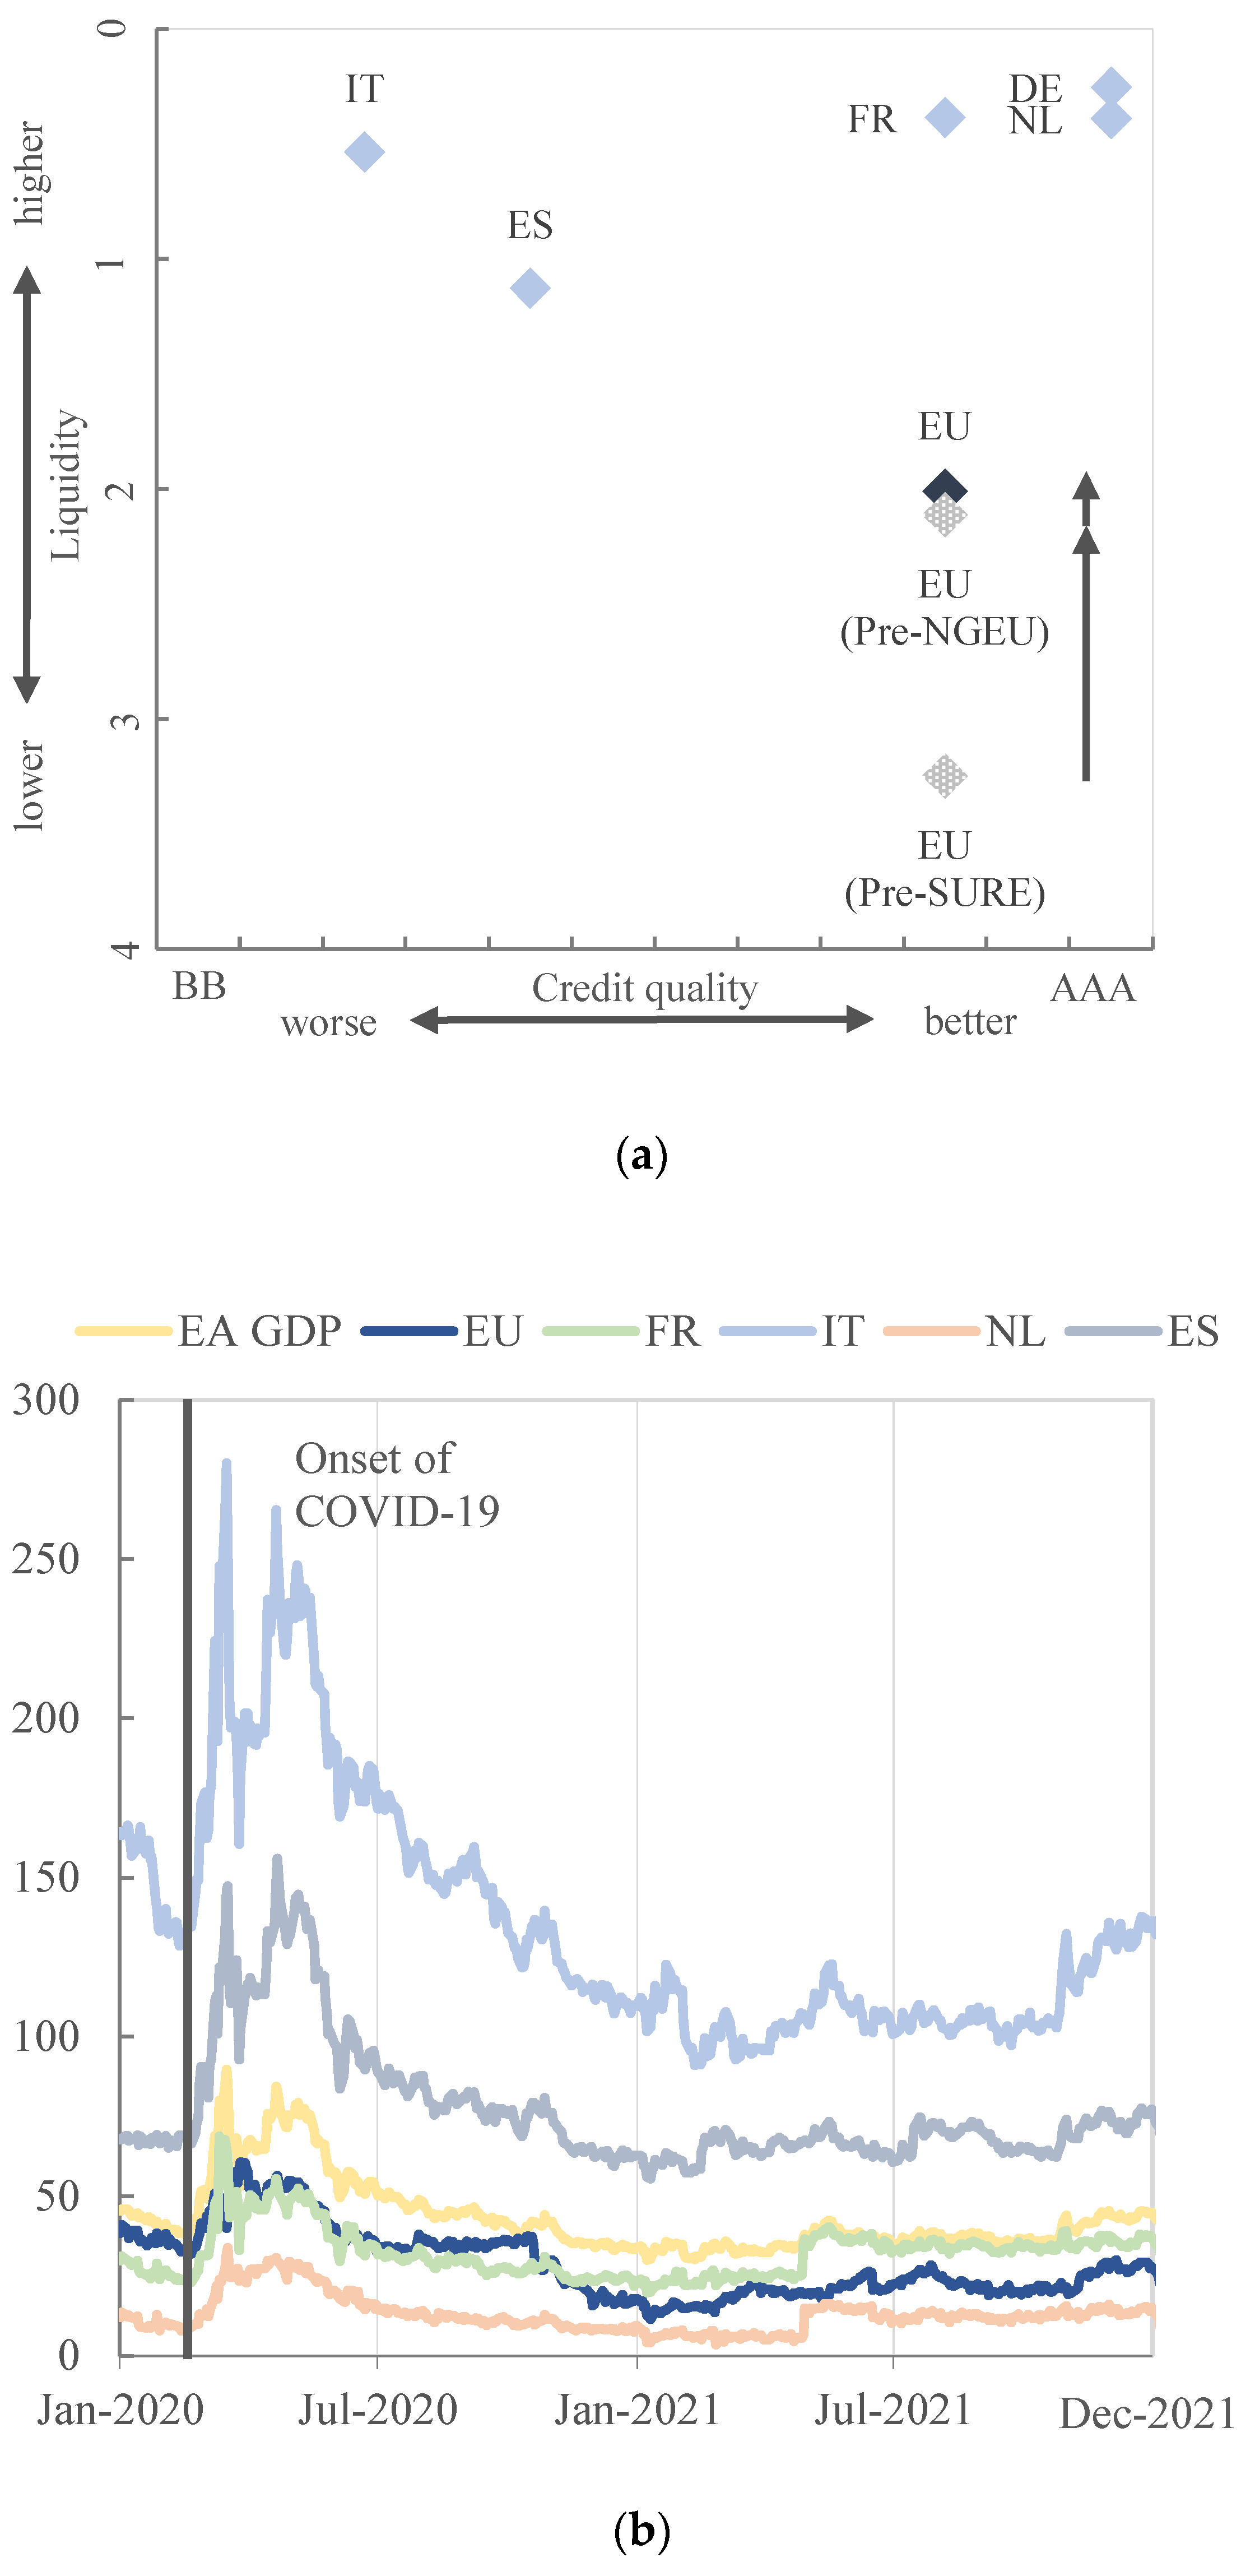
Rating agencies are in broad—but not yet entirely complete—agreement regarding the extent to which EU bonds are default risk-free. The initial rating commentaries date back to September 2020, when SURE bonds were about to be issued for the first time. Moody’s then confirmed its best long-term issuer rating (Aaa) for the EU, noting “the very high commitment of EU members to ensuring the continued soundness of the EU’s finances and their very high capacity to do so given the significant credit strength of the EU’s most highly rated members.” Moody’s further explained that, in their view, “the multiple layers of debt service protection, including explicit recourse to extraordinary support [through EU member states’ guarantees] … creates the equivalent of a joint and several undertaking and [an] obligation on the part of EU member states to provide financial support to the EU.” By contrast, Standard and Poor’s only provided a long-term issuer rating from its second-best rating bracket (AA), which is two notches below its top rating. They effectively acknowledged the presence of political risks in the EU by explaining that their long-term rating for the EU relies on “the capacity and willingness” of “only the wealthiest” EU members that are net contributors to the EU budget. The horizontal axis of
Figure 2a plots the minimal rating across four rating agencies, suggesting that rating agencies collectively consider EU bonds’ credit quality as very close but not (yet) entirely equal to those of, e.g., German Bunds.
Figure 2b presents ten-year yield spreads for the EU, the 2019 GDP-weighted euro area, and four large euro area countries, all relative to Bund yields. The figure suggests that the high credit quality of EU bonds is well-understood by market participants. EU bonds trade at tight spreads to German Bunds and below 2019 GDP-weighted average euro area yields. EU bond yields were closest to those of France between January 2020 and December 2021. This similarity is not only true at the ten-year maturity, but for other maturities as well (not shown).
Figure 2b further suggests EU yield spreads over the Bund rose only slightly during the onset of the COVID-19 pandemic recession in early 2020, and at a degree considerably less than Italian and Spanish spreads. The association of EU yields with French yields remained visibly close during the COVID-19 pandemic recession. This stability of EU yield spreads does not mean that EU bonds will automatically become a supranational euro-denominated safe asset. Like a good friend, however, EU bonds have shown their ability to retain their value during these demanding times.
4. Liquidity Risk
A safe asset is traded in liquid markets. Market liquidity ensures that investors can sell their assets at any time without greatly altering the market price. Liquidity risk is a second key risk (beyond default risk) for which investors demand compensation. This section studies EU bonds’ bid–ask spreads before discussing liquidity risk premia.
4.1. Market Liquidity
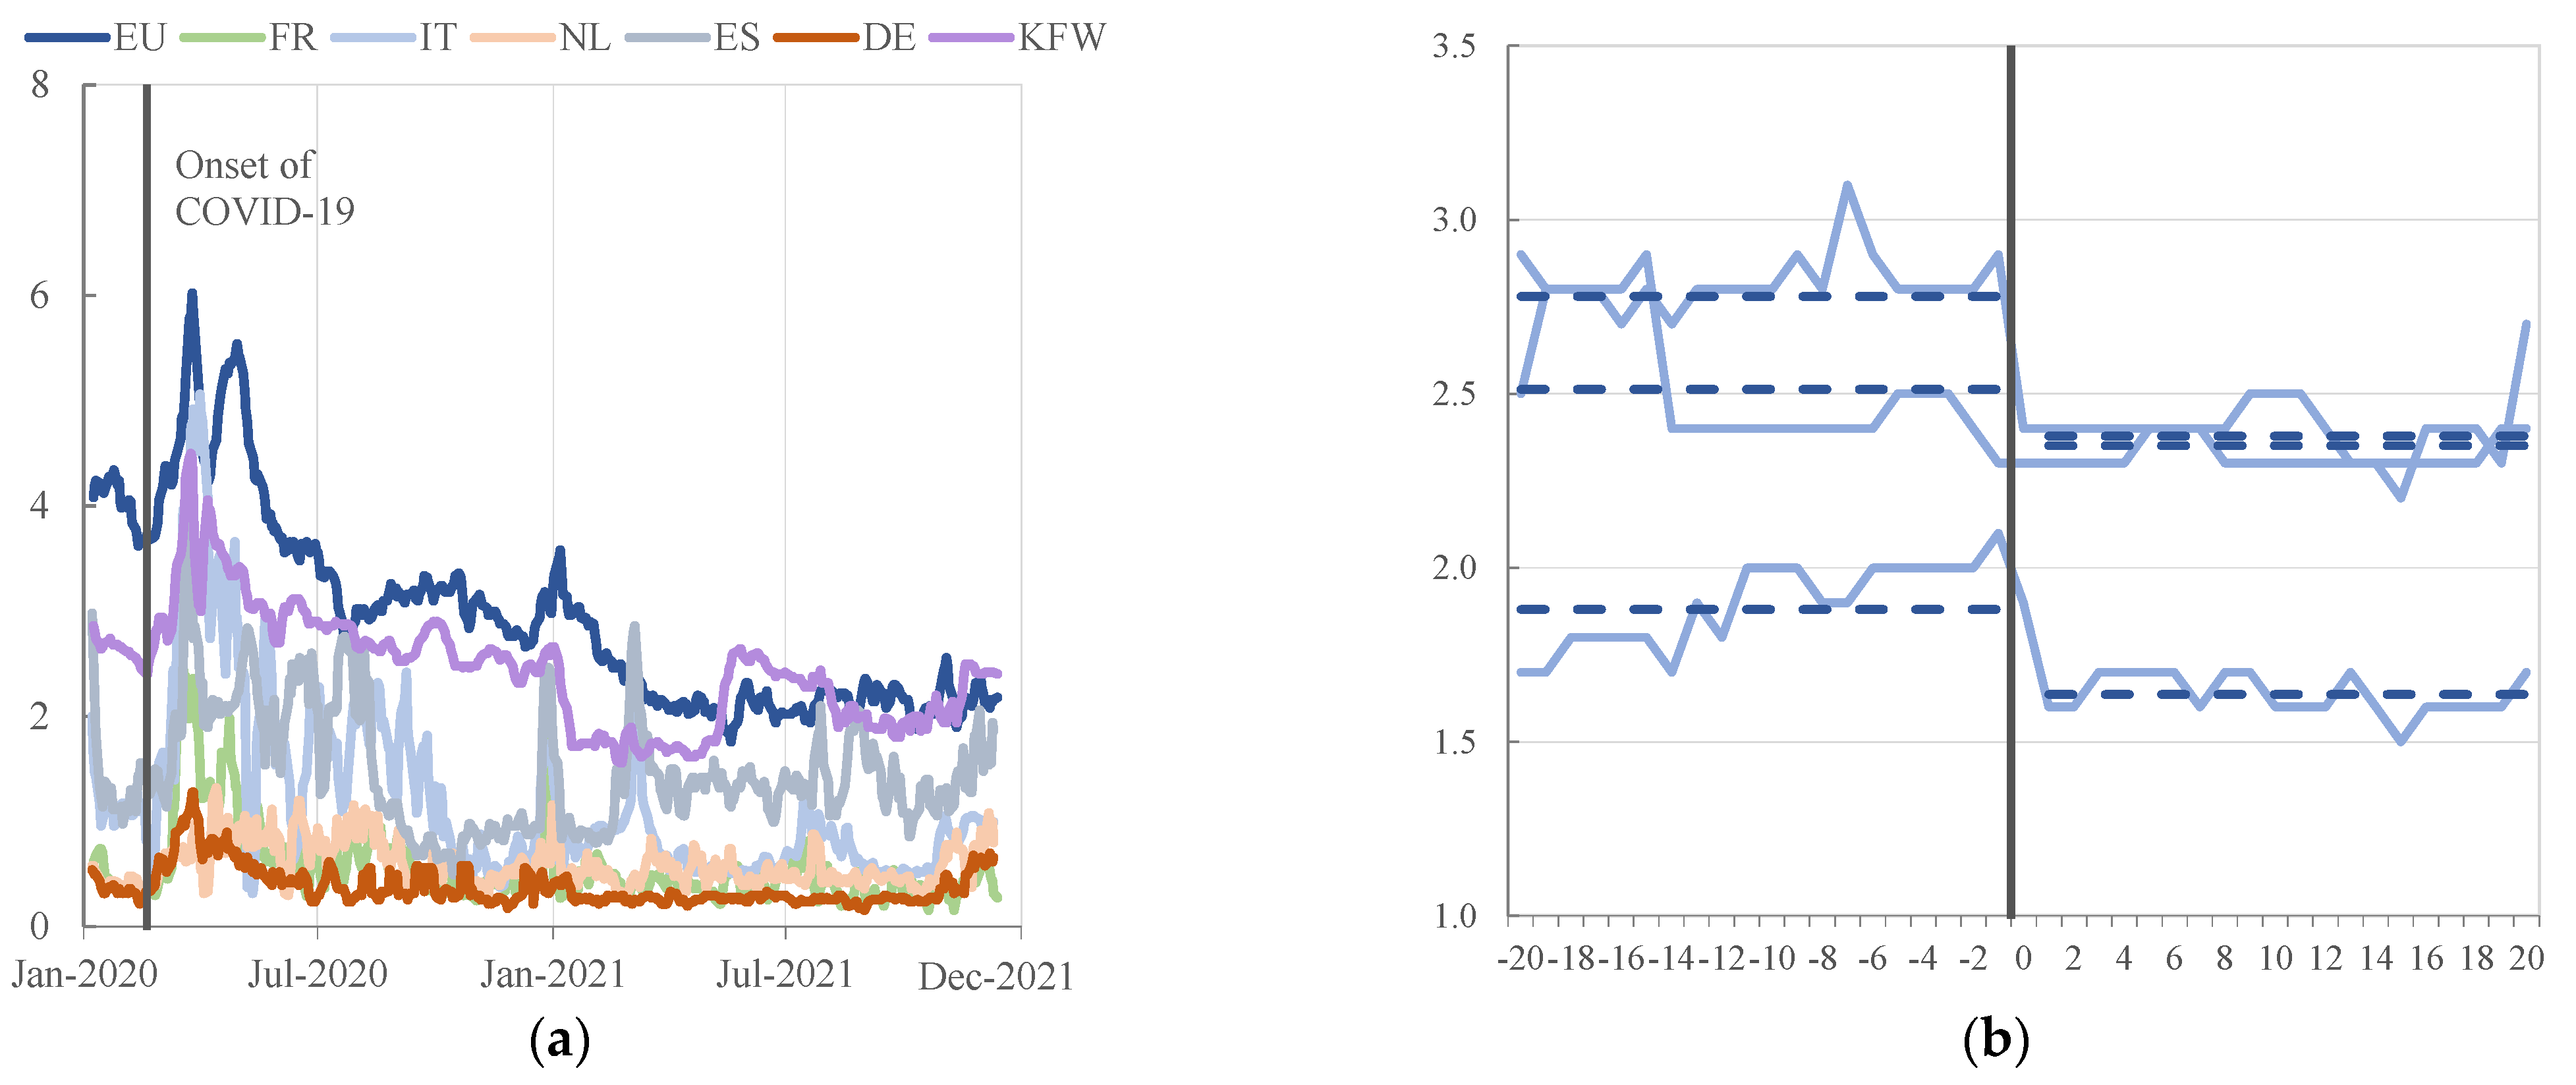
The spread between bid and ask quotes is, arguably, the most straightforward indicator of market liquidity, providing information on how costly a (round-trip) transaction in a bond can be expected to be on any given day. Bid–ask spreads are computed from bonds’ yields-to-maturities (in bps). Average bid–ask spreads varied between approximately 2 and 6 bps during our sample, see
Figure 3a.
5 Before the first issuance of SURE bonds in October 2020, EU bonds were subject to considerably lower market liquidity (i.e., a wider bid–ask spread) than large euro area member states’ sovereign bonds, including those of Germany, France, and Italy. This lower liquidity was probably related to their small outstanding volumes—see
Figure 1a.
Figure 3a suggests that EU bonds’ bid–ask spreads decreased substantially over time, from initially high levels between 4 and 6 bps in early 2020, to approximately 2 bps by December 2021, approximately to the level of Spanish sovereign bonds’ and German KfW agency bonds’ bid–ask spreads.
6In addition to new bond issuances, the practice of “tapping” already-issued EU bonds probably contributed to improving the market liquidity of the tapped bonds. To explain this phenomenon, the EU, like many other issuers, can raise funds in two complementary ways: by issuing a new bond, or by adding to the outstanding volume of an already existing bond. In a bond tap, an existing bond issue is “re-opened.” Tapped bonds are issued at the existing bond’s face value, maturity, and coupon rate, and are sold at their current market price. For the issuer, this practice avoids expensive transactions and legal costs. For investors, bond taps create opportunities to adjust portfolio holdings and learn about the market-clearing price for larger transactions.
Figure 3b plots the bid–ask-spreads for the first three EU SURE bonds that have been tapped since October 2020. The chart suggests that each bond has become more liquid following the tapping date, in line with the behavior observed for other issuers using taps. This pattern is encouraging, as it suggests that EU bonds’ market liquidity could improve further with time and new taps.
The visual impression from
Figure 3b is corroborated in a panel regression of tapped EU bonds’ bid–ask spreads (
) on bond/tap fixed effects (
) and a post-tap dummy variable (
), using the panel regression specification
where the bond fixed effects control for heterogeneity across
N = 17 tapped EU bonds issued between January 2017 and December 2021,
is the impact coefficient of interest,
is an appropriate error term, and time
t refers to a (−20, +20) day event window centered around each tap date (
T = 41). To allow for a control group, we also match each tapped bond to a corresponding non-tapped (i.e., not tapped in the same event window) but otherwise comparable EU bond (closest in terms of maturity, and thus similar in yield). This results in the panel regression specification
where
denotes the bid–ask spreads of the matched bonds.
Table 1′s column (1) suggests that on average, tapping a previously issued EU bond increases its secondary market liquidity. The average bond tap in our sample is associated with a 0.16 bps decrease in its bid–ask spread, from 2.78 bps on average pre-tap to 2.62 bps on average post-tap. Using log bid–ask spreads as a dependent variable instead suggests an average reduction of about 4% (column (2)).
The regression results associated with our matched regression specification suggest a slightly smaller average effect of a tap of approximately −0.14 bps (column (3)) or of, again, approximately −4% (column (4)). The regression results are robust to reasonable variations in the event window (using, say, ten trading days instead of 20). We conclude that tapping existing EU bonds appears to be an expedient way to raise EU funding in the future, in line with the EU’s announced plans to make regular use of tapping.
4.2. Liquidity Risk Premia
Given our previous discussion of market liquidity, we expect EU bonds’ liquidity risk premia to be like those of other high-quality but less liquid bonds, and to decline following SURE and NGEU-related issuances and taps.
Table 2 presents correlations between changes in sovereign and agency bonds’ yields. Two observations stand out. First, the yield changes of EU bonds from different programs are almost perfectly correlated with each other, suggesting that EU bonds form a coherent market segment no matter which program the bonds are formally associated with. Such coherence is typical for national sovereign bond markets, including existing safe assets. Second, changes in EU bond yields are most closely correlated with those of other highly rated but less liquid assets, suggesting that liquidity risk is an important pricing factor for EU yields. The highest correlations are observed for highly rated but less liquid agency bonds issued by the German KfW. The changes in EU bond yields correlate with those of KfW bonds to a similar extent as EU bonds correlate with each other (correlation of >0.98). German and, to a lesser extent, Dutch and French yields are also closely correlated. French OAT sovereign yields are a frequently used point of comparison; see, e.g.,
European Commission (
2022).
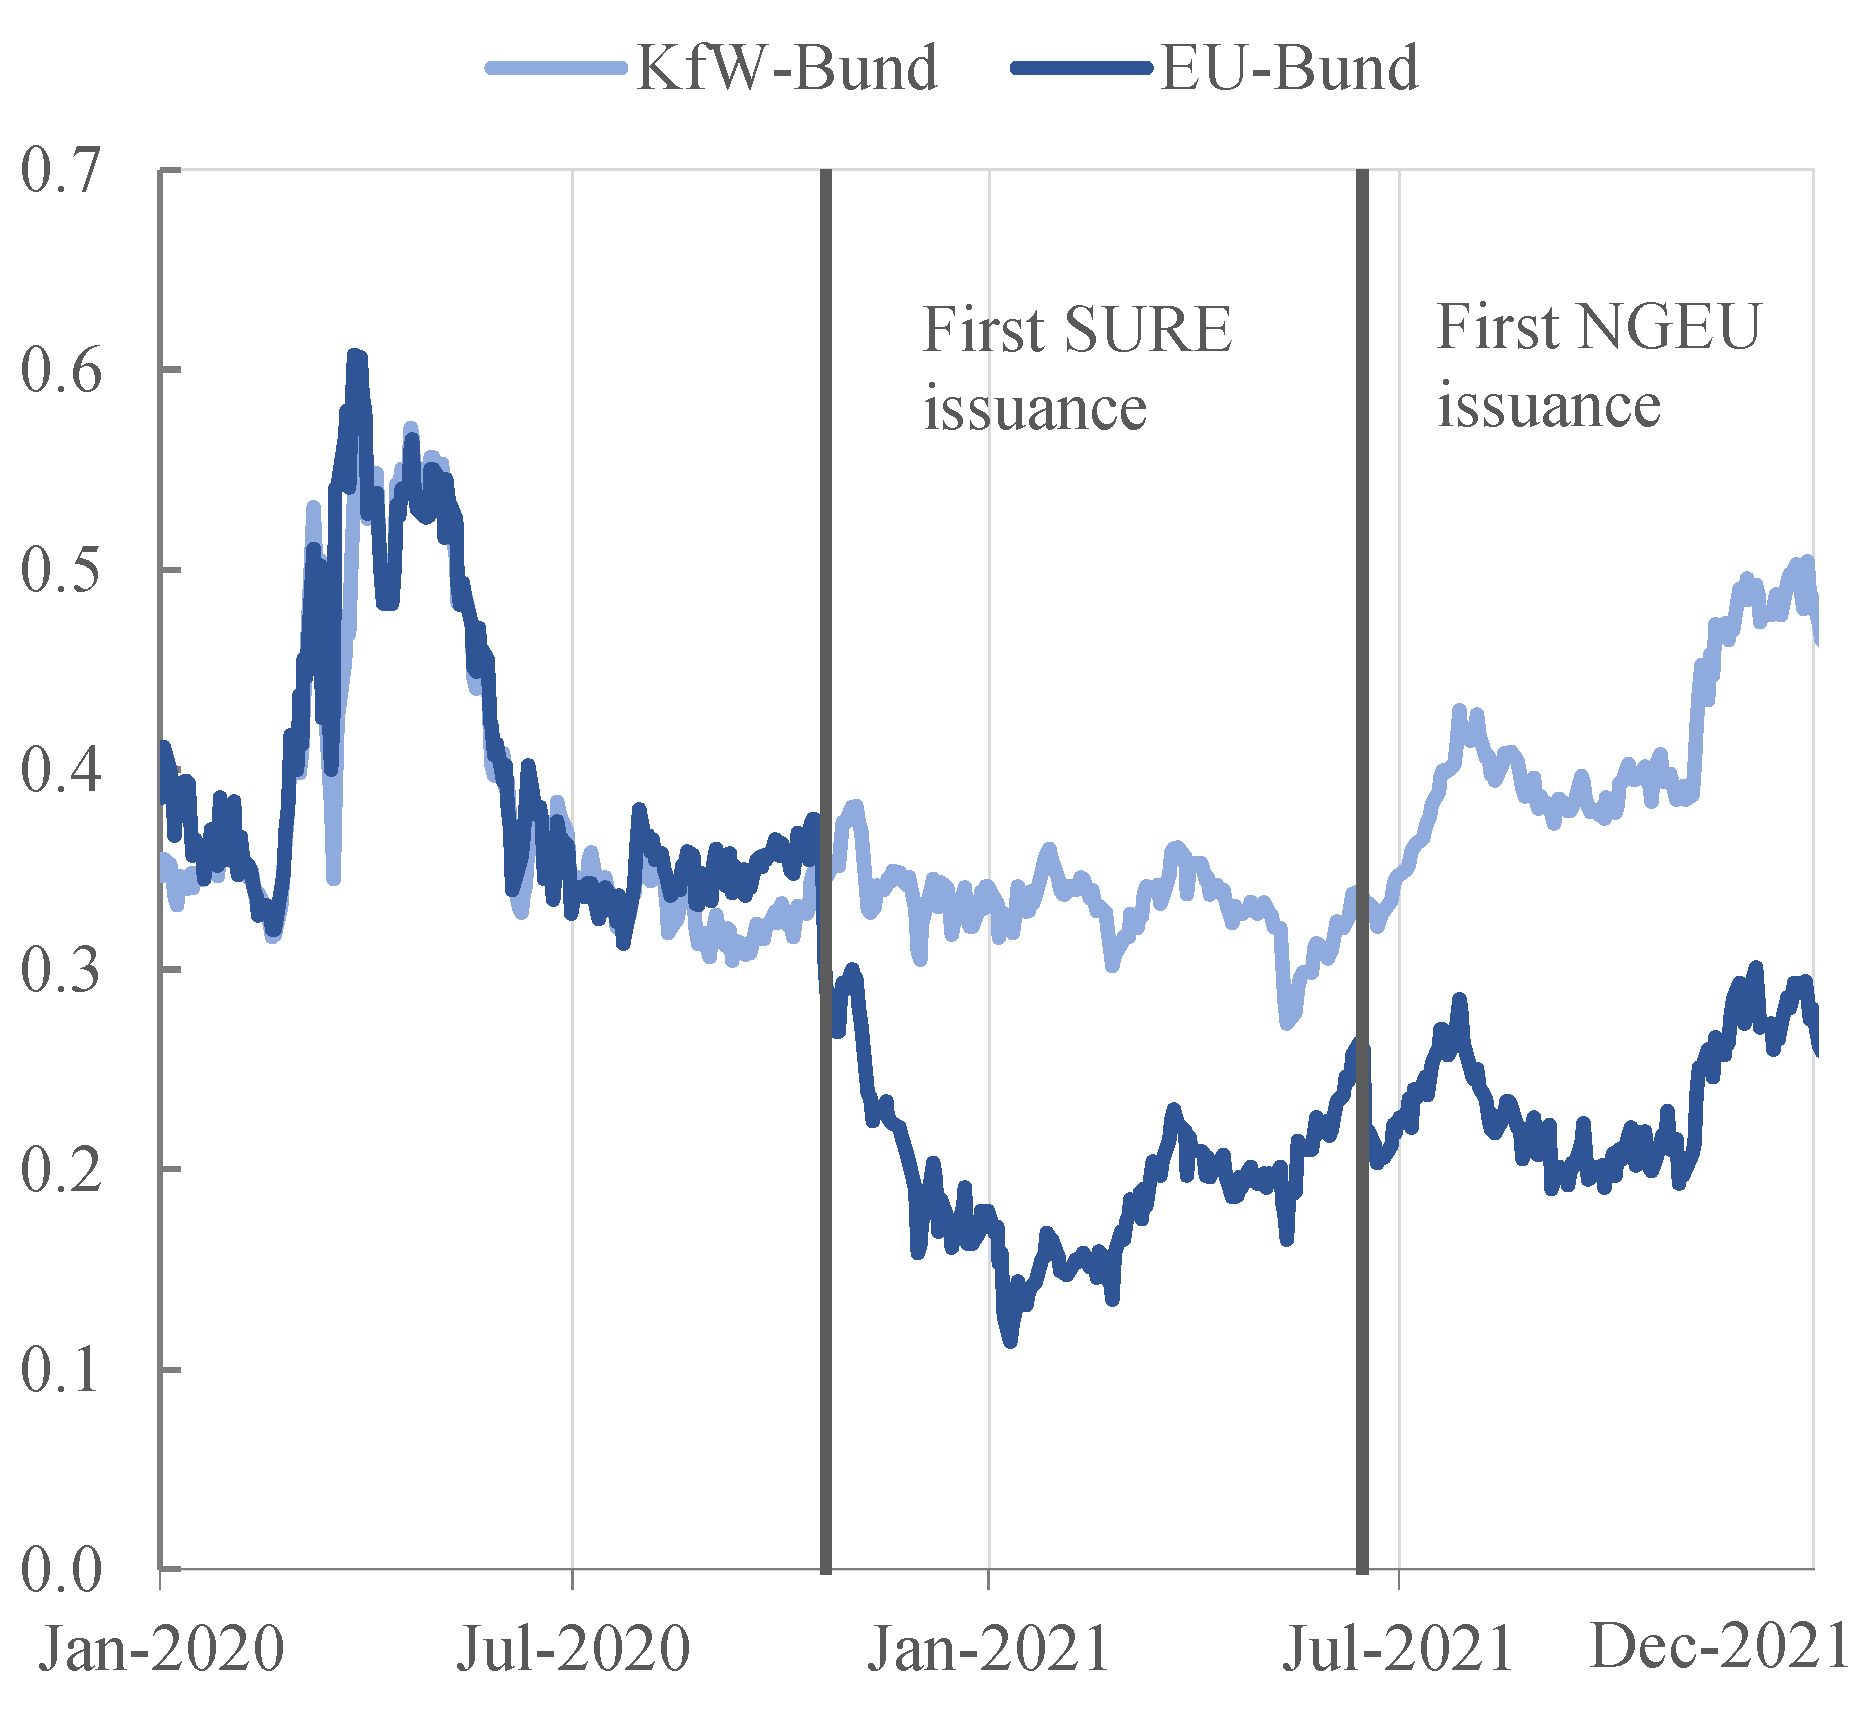
A clear improvement in EU bonds’ market liquidity can be observed in the decreasing yield spreads over other reference bonds.
Figure 4 compares the ten-year EU-Bund spread to the ten-year KfW-Bund spread over time. (The ten-year rates were obtained as constant-maturity rates from Bloomberg; the KfW-Bund spread is commonly known as being primarily liquidity-driven, see, e.g.,
Monfort and Renne 2014.) Both time series evolve almost identically up to the first issuance of EU SURE bonds on 20 October 2020. EU bonds’ total market volumes, and, therefore, their expected trading volumes as well, increased considerably following each SURE and NGEU issuance date. The divergence between the two yield spreads, particularly following the first SURE bond issuance, suggests that investors adequately incorporated the improved liquidity conditions into the yields of EU bonds.
5. The Liquidity Impact of Central Bank Bond Purchases
A safe asset’s market liquidity should be sufficiently high to accommodate central banks’ monetary policy operations. Specifically, central bank purchases (through flow effects) and asset holdings (through stock effects) should not inappropriately dry up a burgeoning market. This section studies EU bonds’ market liquidity, measured by bid–ask spreads, in relation to Eurosystem purchases within its Public Sector Purchase Program (PSPP) and Pandemic Emergency Purchase Program (PEPP).
The relationship between secondary market liquidity on the one hand, and central bank bond purchases and holdings on the other hand, is a priori unclear and could in principle go either way. For example, the central bank’s purchases could make it harder, or costlier, for private investors to acquire the same bond on the same trading day, thereby increasing their search costs. On the other hand, central bank purchase flows stimulate trading by affecting the overall demand for a bond. Eventually, trade volumes could increase by more, or by less, than what is implied by the central bank’s transaction itself, depending on whether private investors are crowded in or out. Regarding lagged holdings, central banks tend to hold on to their bonds for a long time, effectively retiring them on their balance sheets. This approach reduces the quantity of bonds that are available for trading to other investors, possibly reducing market turnover and thus liquidity. On the other hand, central banks’ initiatives to lend acquired assets back to the private sector (e.g., via the Eurosystem’s securities lending arrangements) are in place and designed to mitigate any undesired effects from withdrawing assets from the market. In addition, central banks’ actions probably also affect bonds’ yields and volatilities (see, e.g.,
Eser and Schwaab 2016;
Ghysels et al. 2017;
De Pooter et al. 2018), and, therefore, market risks, which could, in turn, positively affect market liquidity. As a result, the impact of central bank bond purchases and bond holdings on market liquidity is theoretically ambiguous and, therefore, mainly an empirical question.
We estimate the panel regression
where ln(
bait) is the natural logarithm of bond
i’s bid–ask spread at time
t in basis points,
is a bond fixed effect,
is a daily time fixed effect,
are Eurosystem purchases of bond
i on day
t,
are lagged purchases of bond
i on and between days
t − 4 and
t − 1,
denotes the Eurosystem’s holdings of bond
i one week earlier,
is a dummy variable indicating bond-level holdings above 40%, and
is the error term. Bond fixed effects are added to the regression specification to control for bond heterogeneity, for example, across maturities and/or coupons. Time-fixed effects are added to control for other common dynamics over time that affect all bonds’ liquidity equally. We distinguish three different samples: 20 October 2020 to 15 June 2021 (“SURE sample”), 16 June to 31 December 2021 (“NGEU sample”), and the union of the two (“full sample”).
The panel regression estimates in
Table 3 suggest that contemporaneous purchase flows do not raise bid–ask spreads (see the first coefficient row in
Table 3). If anything, they are associated with modestly lower bid–ask spreads in the full sample. Eurosystem purchases almost mechanically increase turnover, which could lower dealer banks’ inventory risks and thus bid–ask spreads. Lagged purchases do not have a positive effect on bid–ask spreads either (see the second coefficient row in
Table 3). The coefficients associated with lagged Eurosystem holdings are typically insignificant, except in the full sample, where additional holdings decrease bid–ask spreads (see the third coefficient row in
Table 3).
7 There is no evidence at the 5% significance level for a break in the regression slope at high holdings above 40%, suggesting that such a break is absent or too minor to be detected (see the fourth coefficient row in
Table 3).
8 We conclude that central banks’ purchase flows and asset holdings do not appear to have hindered the trading of EU bonds in economically significant ways.
6. Concluding Discussion
We conclude by summarizing and weighing our above findings to provide an (admittedly early) assessment of the safe asset potential of EU-issued bonds. Based on data sampled between January 2020 and December 2021, EU bonds score relatively high on the quality scale (low perceived default risk), while exhibiting improved but still sub-par market liquidity relative to German Bunds. However, market liquidity will probably be improved, to some extent, by new issuances and taps, in line with
Figure 1b,
Figure 3b and
Figure 4.
EU bonds’ prospects for becoming a genuine euro-denominated safe asset could potentially be hampered by the fact that both SURE and NGEU programs are foreseen to be one-off, time-limited COVID-19 emergency responses. After all, safe assets tend to trade in markets without a definite endpoint (think of, e.g., U.S. Treasuries or German Bunds), which renders the cost of setting up a dedicated trading infrastructure less important. By contrast, the final EU SURE bond is currently foreseen to mature in 2052 (at the latest, a thirty-year bond to be issued in 2022), and the final NGEU bond is currently foreseen to mature in 2058. Once the complete amount in each program has been raised, the EU’s debt will start to decline, with the average maturity foreseen to be shrinking to zero until 2058. This finite maturity may deter investors from establishing a long-term investment strategy in which EU bonds would be considered a permanent part of their portfolios.
At the time of writing, the devastating war of Russia against Ukraine has triggered a discussion among EU heads of state on whether to cushion some of the war’s detrimental impacts using an additional bond-financed EU budget. If realized, such a program could improve the safe asset status of EU bonds due to two reasons. First, even-higher outstanding volumes would almost mechanically contribute to a further improvement of market liquidity, in line with our assessment above. Second, responding to a new crisis again with additional EU bonds may signal an erosion in the political resistance against a permanently bond-financed EU budget.
The perception of EU bonds as safe assets will eventually also be hinged on their regulatory treatment. In that respect, EU bonds already benefit from a zero-percent risk weight in capital requirements for banks under Basel III and no capital charge for spread risk in solvency requirements for insurance companies under Solvency II. Furthermore, at the time of writing, EU bonds are eligible for purchase under the Eurosystem’s asset purchase programs and face favorable haircuts (yet somewhat higher than for sovereign bonds) when pledged by banks as collateral in refinancing operations.
Finally, while the lifetime and regulatory treatment of SURE and NGEU bonds are to some extent within the ambit of the EU member states, other determinants of secondary market liquidity depend primarily on private-sector actors. For instance, EU bonds are currently not included in sovereign bond indices. This exclusion restricts the demand for them from certain safe-asset funds. In addition, there is currently no direct derivative hedge instrument for EU bonds as there are for German, French, and Italian government bonds in the form of Eurex bond futures contracts. For such an instrument to be viable, a deep and liquid repo market would need to evolve first. Even though it is too early to judge whether private market participants will include EU bonds in sovereign bond indices or introduce futures contracts, both the recent improvement in market liquidity and the overall increasing attention gained by EU bonds offer some support for such steps.
Author Contributions
Conceptualization, T.B., W.G. and B.S.; methodology, T.B., W.G. and B.S.; software, W.G. and B.S.; validation, T.B., W.G. and B.S.; formal analysis, T.B., W.G. and B.S.; investigation, T.B., W.G. and B.S.; resources, T.B. and W.G.; data curation, W.G.; writing—original draft preparation, T.B., W.G. and B.S.; writing—review and editing, T.B., W.G. and B.S.; visualization, T.B., W.G. and B.S.; supervision, T.B., W.G. and B.S.; project administration, T.B., W.G. and B.S. All authors have read and agreed to the published version of the manuscript.
Funding
This research received no external funding.
Institutional Review Board Statement
Not applicable.
Data Availability Statement
Market data sources are as indicated in
Section 2. Market data are available against a fee from the data providers. Disaggregated (bond-level) holdings of EU-issued bonds by the Eurosystem are confidential at the time of writing.
Acknowledgments
We thank Benjamin Böninghausen, Alexander Düring, Peter Hoffmann, Wolfgang Lemke, Simone Manganelli, Fabian Schupp, and the ECB seminar participants for their comments. The views expressed in this paper are those of the authors and do not necessarily reflect the views of the European Central Bank.
Conflicts of Interest
The authors declare no conflict of interest.
Notes
| 1 | Cash is the most obvious safe asset. Non-cash safe assets form near substitutes to cash (quasi-money) but offer somewhat different risk–return profiles and can be held by a wider set of investors. |
| 2 | |
| 3 | The EFSM, together with the European Financial Stability Facility (EFSF), was a predecessor to the European Stability Mechanism (ESM). EFSM-related debt is issued, managed, and guaranteed by the EU, while the EFSF and ESM are separate issuers with independent credit ratings The EFSM debt is actively refinanced, with new bonds replacing older bonds. The currently outstanding EFSM bonds are associated with financial stability support extended to Ireland and Portugal during the fallout of the global financial crisis, and the commencing euro area sovereign debt crisis, around 2010. Each country was granted approximately two decades for paying back its respective loans. |
| 4 | Sovereign bonds denominated in domestic currency are often, but probably wrongly, considered to be free of default risk on the basis that sovereigns can rely on liquidity support from their central bank. This view is problematic for EU sovereigns for which central banks are expressly prohibited from sovereign debt monetization, and for euro area sovereigns that have surrendered their control over the “printing press” to the Eurosystem. |
| 5 | Bid–ask spreads depend, in principle, on all aspects of a transaction, i.e., the contracting counterparties, the trade size, trading venue, etc. The data studied here reflect indicative quotes for standard trade sizes posted on multilateral trading platforms. |
| 6 | This assessment is broadly in line with the European Council ( 2022, p. 3)’s own view that “… the liquidity of [EU] bonds approaches levels for core euro area sovereigns as measured by standard metrics.” |
| 7 | The coefficient estimate related to Eurosystem holdings remains non-positive in all samples if the data are lagged further (up to four weeks). Similarly, adding an age variable on the right-hand side, indicating the number of business days since a bond’s issuance or latest tapping date, does not majorly affect the empirical estimates. |
| 8 | Grimaldi et al. ( 2021) find detrimental effects on the market liquidity of Swedish government bonds once the Riksbank’s holdings exceed 40% of bonds’ outstanding volumes. |
References
- Brunnermeier, Markus K., and Lunyang Huang. 2018. A Global Safe Asset for and from Emerging Market Economies. Working Paper 25373. Cambridge: National Bureau of Economic Research. [Google Scholar]
- Brunnermeier, Markus K., and Yuliy Sannikov. 2016. The i Theory of Money. Working Paper 22533. Cambridge: National Bureau of Economic Research. [Google Scholar]
- Brunnermeier, Markus K., Luis Garicano, Philip R. Lane, Marco Pagano, Ricardo Reis, Tano Santos, David Thesmar, Stijn Van Nieuwerburgh, and Dimitri Vayanos. 2016. The sovereign-bank diabolic loop and ESBies. American Economic Review Papers and Proceedings 106: 508–12. [Google Scholar] [CrossRef]
- Brunnermeier, Markus K., Luis Garicano, Philip R. Lane, Marco Pagano, Ricardo Reis, Tano Santos, David Thesmar, Stijn Van Nieuwerburgh, and Dimitri Vayanos. 2011. European Safe Bonds (ESBies). Mimeo. Available online: https://personal.lse.ac.uk/vayanos/euronomics/esbies.pdf (accessed on 11 August 2022).
- Brunnermeier, Markus K., Sam Langfield, Marco Pagano, Ricardo Reis, Stijn Van Nieuwerburgh, and Dimitri Vayanos. 2017. ESBies: Safety in the tranches. Economic Policy 32: 175–219. [Google Scholar] [CrossRef]
- De Pooter, Michiel, Robert F. Martin, and Seth Pruitt. 2018. The liquidity effects of official bond market intervention. Journal of Financial and Quantitative Analysis 53: 243–68. [Google Scholar] [CrossRef]
- Eser, Fabian, and Bernd Schwaab. 2016. Evaluating the impact of unconventional monetary policy measures: Empirical evidence from the ECB’s Securities Markets Programme. Journal of Financial Economics 119: 147–67. [Google Scholar] [CrossRef]
- European Commission. 2022. The EU as an Issuer: The NextGenerationEU Transformation. Available online: https://ec.europa.eu/info/sites/default/files/about_the_european_commission/eu_budget/policy_brief_web_18.07.pdf (accessed on 11 August 2022).
- European Council. 2022. Semi-Annual Report on the Execution of the NextGenerationEU Funding Operations Pursuant to Article 12 of Commission Implementing Decision C(2021)2502. Brussels: European Council. [Google Scholar]
- European Parliament. 2021. National Ratification of the Own Resources Decision—Procedure Completed on 31 May 2021. European Parliamentary Research Services, Briefing on the 2021-2027 MFF, June 2021. Strasbourg: European Parliament. [Google Scholar]
- Ghysels, Eric, Julien Idier, Simone Manganelli, and Olivier Vergote. 2017. A high frequency assessment of the ECB Securities Markets Programme. Journal of the European Economic Association 15: 218–43. [Google Scholar] [CrossRef]
- Giovanni, Alberto. 2013. Risk-free assets in financial markets. In Sovereign Risk: A World without Risk-Free Assets? BIS Papers No. 72. Basel: Bank for International Settlements. [Google Scholar]
- Gorton, Gary B. 2017. The history and economics of safe assets. The Annual Review of Economics 9: 547–86. [Google Scholar] [CrossRef]
- Gorton, Gary B., and Guillermo Ordonez. 2022. The supply and demand for safe assets. Journal of Monetary Economics 125: 132–47. [Google Scholar] [CrossRef]
- Gorton, Gary B., Stefan Lewellen, and Andrew Metrick. 2012. The safe-asset share. American Economic Review Papers & Proceedings 102: 101–6. [Google Scholar]
- Gossé, Jean Baptiste, and Anass Mourjane. 2021. A European safe asset: New perspectives. Bulletin de la Banque de France. 234/6, March–April. Available online: https://publications.banque-france.fr/sites/default/files/medias/documents/821062_bdf234-6_en_actif-sur_vfinale.pdf (accessed on 11 August 2022).
- Grimaldi, Marianna, Alberto Crosta, and Dong Zhang. 2021. The Liquidity of the Government Bond Market—What Impact Does Quantitative Easing Have? Evidence from Sweden. Working Paper Nr. 402. Stockholm: Sveriges Riksbank. [Google Scholar]
- Juncker, Jean Claude, Donald Tusk, Jeroen Dijsselbloem, Mario Draghi, and Martin Schulz. 2015. Completing Europe’s Economic and Monetary Union. Five Presidents’ Report. Brussels: European Commission. [Google Scholar]
- Leonello, Agnese. 2018. Government guarantees and the two-way feedback between banking and sovereign debt crises. Journal of Financial Economics 130: 592–619. [Google Scholar] [CrossRef]
- Monfort, Alain, and Jean-Paul Renne. 2014. Decomposing euro area sovereign spreads: Credit and liquidity risks. Review of Finance 18: 2103–105. [Google Scholar] [CrossRef]
Figure 1.
EU debt and programs. (a): Total outstanding debt by EU program in EUR bn between January 2020 and December 2021. NGEU and SURE are COVID-19-related recovery initiatives. EFSM refers to the European Financial Stability Mechanism. MFA refers to Macro-Financial Assistance to non-EU countries. BOP refers to the EU’s Balance of Payments program. (b): EU debt in billion EUR and as percentages of total outstanding debt in December 2021.
Figure 2.
Credit risk indicators for EU bonds. (a): Scatterplot of market liquidity (average bid–ask spreads in basis points) vs. credit quality (minimum rating). Arrow origins refer to September 2020 (“Pre-SURE”) and May 2021 (“Pre-NGEU”). Arrow endpoints and all other diamonds refer to October 2021 (Post-NGEU’s first auction). Higher liquidity corresponds to tighter bid–ask spreads. The rating score on the horizontal axis is calculated from minimum issuer ratings across S&P, Moody’s, Fitch, and DBRS. (b): Ten-year yield spreads over German Bunds, in bps, between January 2020 and December 2021.
Figure 3.
Bid–ask spreads over time and around tapping events. (a): Five-day trailing moving average of bid–ask spreads for ten-year benchmark bonds (in bps) between January 2020 and December 2021. (b): Bid–ask spreads for the first three taps following the first issuance of SURE bonds (horizontal axis in bps; vertical axis −/+20 days from tap event). The vertical line indicates the respective tap day.
Figure 4.
EU-Bund vs. KfW-Bund spread. KfW-Bund and EU-Bund yield spread (in ppt). Sample from January 2020 to December 2021. Vertical lines refer to the first issuances of SURE and NGEU bonds.
Figure 4.
EU-Bund vs. KfW-Bund spread. KfW-Bund and EU-Bund yield spread (in ppt). Sample from January 2020 to December 2021. Vertical lines refer to the first issuances of SURE and NGEU bonds.
Table 1.
Impact of taps on an EU bond’s bid–ask spread. Panel regression results for N = 17 tapped bonds over a (−20, +20) day event window (T = 41). Each column uses a different left-hand-side variable: (1) bid–ask spreads of tapped bonds, (2) log bid–ask spreads of tapped bonds, (3) bid–ask spreads of tapped bonds minus the bid–ask spreads of matched non-tapped bonds, and (4) log bid–ask spreads of tapped bonds minus the log bid–ask spreads of matched non-tapped bonds. Standard errors are in brackets below and not clustered at the bond level (owing to the low number of observations). Each panel regression contains bond/tap fixed effects. *, **, and *** refer to 0.1, 0.05, and 0.01 statistical significance levels.
| Dependent Variable | (1)
Bid–Ask Spreads of Tapped Bonds (bps) | (2)
Log Bid–Ask Spreads of Tapped Bonds (Log bps) | (3)
Bid–Ask Spreads–Matched Spreads (bps) | (4)
Log (Spreads)–Log (Matched) (Log bps) |
|---|
| Post-tap dummy | −0.164 *** | −0.0370 *** | −0.137 *** | −0.0385 *** |
| | (−9.41) | (−5.09) | (−8.90) | (−6.56) |
| Constant | 2.788 *** | 0.884 *** | −0.0498 *** | −0.0279 *** |
| | (221.72) | (168.63) | (−4.51) | (−6.59) |
| Bond fixed effects | yes | yes | yes | yes |
| Number of observations | 684 | 684 | 684 | 684 |
| Adjusted R-squared | 0.971 | 0.967 | 0.704 | 0.697 |
Table 2.
Correlations between yield changes. Spearman correlations between changes in yields-to-maturity of ten-year bonds for selected euro area issuers.
Table 2.
Correlations between yield changes. Spearman correlations between changes in yields-to-maturity of ten-year bonds for selected euro area issuers.
| From: | 01/01/2020 | 23/10/2020 | 18/06/2021 |
| To: | 31/12/2021 | 31/12/2021 | 31/12/2021 |
| | EFSM | SURE | NGEU |
| SURE | 0.981 | | |
| NGEU | 0.981 | 0.996 | |
| DE | 0.946 | 0.939 | 0.963 |
| IT | 0.312 | 0.764 | 0.826 |
| FR | 0.847 | 0.922 | 0.954 |
| ES | 0.642 | 0.866 | 0.883 |
| NL | 0.935 | 0.936 | 0.964 |
| KFW | 0.983 | 0.974 | 0.982 |
Table 3.
Impact of Eurosystem purchases and holdings on market liquidity. Panel regression estimates of log bid–ask spreads on Eurosystem purchases and lagged holdings. Different columns indicate different estimation samples, namely, between 20 October 2020 and 15 June 2021 (“SURE”), between 16 June 2021 and 31 December 2021 (“NGEU”), and the union of the two (“Full sample”). Standard errors are in brackets below and clustered at the bond level (N = 37). *, **, and *** refer to 0.1, 0.05, and 0.01 statistical significance levels.
| Dependent Variable | Log Bid–Ask Spread (bps)
SURE: 20 October 2020–
15 June 2021 | Log Bid–Ask Spread (bps)
NGEU: 16 June 2021–
31 December 2021 | Log Bid–Ask Spread (bps)
Full: 20 October 2020–
31 December 2021 |
|---|
Purchases today
(relative to outstanding) | −0.123 | −1.861 * | −2.809 *** |
| | (−0.21) | (−2.55) | (−3.68) |
Purchases week
(relative to outstanding) | −0.043 | −1.171 * | −1.144 * |
| | (−0.15) | (−2.61) | (−2.34) |
Lagged holdings
(relative to outstanding) | 0.293 | −0.610 * | −0.924 ** |
| | (1.59) | (−2.26) | (−3.33) |
Lagged holdings
×40% Dummy | 0.216 * | −0.153 * | 0.185 * |
| | (2.37) | (2.23) | (2.62) |
| Constant | 0.706 *** | 0.828 *** | 1.131 *** |
| | (9.37) | (6.69) | (9.33) |
| Bond and time fixed effects | yes | yes | yes |
| Number of observations | 4135 | 5018 | 9153 |
| Adjusted R-squared | 0.88 | 0.91 | 0.85 |
| Publisher’s Note: MDPI stays neutral with regard to jurisdictional claims in published maps and institutional affiliations. |
© 2022 by the authors. Licensee MDPI, Basel, Switzerland. This article is an open access article distributed under the terms and conditions of the Creative Commons Attribution (CC BY) license (https://creativecommons.org/licenses/by/4.0/).


