Abstract
This paper explores the characteristics and inter-relationships of tax systems in the OECD countries over the period 2014–2020, i.e., from a relatively consolidated economic period until the end of the first year of the COVID-19 pandemic. A predictable tax system is essential for the proper functioning of the economy. One of our two main research objectives was to develop a composite indicator for taxation, consisting of tax rates and tax administration time. This composite indicator was then tested using multivariate statistical methods. Our second research objective was to explore the correlation between tax rates, tax burden indicators and macroeconomic indicators over the period 2014–2020, focusing on three years, 2014, 2019 and 2020. An important criterion for the choice of the study years was that 2014 was considered the first overall year of recovery from the crisis, 2019 the last year before the COVID-19 pandemic, and 2020 the first year affected by the pandemic. We investigated the significant differences between the composite indicator categories and the tax burden macroeconomic indicators, and examined and tested correlations between the variables under study (tax rates, tax burden and macroeconomic variables). We found that the amount of working time spent on tax administration is decreasing, presumably due to the increasingly digitalised environment, but this trend has been slightly interrupted by the pandemic. Furthermore, we found that countries with more complex tax systems with a high tax burden perform worse on certain macroeconomic indicators, mainly in southern Europe from a geographical perspective; however, these potentially more burdensome, higher-rate tax systems of more developed countries do not put these countries at a competitive disadvantage. This reflects on the fact that these countries rely on the monetarist school rather than the Keynesian school, a fact which was also compared and considered in our paper.
1. Introduction
The development of economic thinking has also shaped the economic aspects of taxation. A common feature of the views of economists is that they focus on the description of the tax structure and the choice between tax types, and hence the comparison of the views of the schools of economics is important for our topic.
In our introduction, we review the role of taxation in economic thinking, the role of tax regulation and the OECD, and the links between taxation and competitiveness.
According to Adam Smith’s ([1776] 2007) original theoretical framework related to the modern tax system, a good tax system is fair, considers the taxpayer’s ability to pay, is clear, predictable, and transparent. It requires the tax to be paid in a timely and appropriate manner, i.e., in a way that is appropriate for the taxpayer. In addition, it is economical to collect, that is the cost of taxation is minimal (Fellegi 2022). Moreover, it provides the state budget with timely and appropriate resources from which a secure state operation can be achieved.
Musgrave and Musgrave (1989) argue that a tax system is just if it can be operated with minimal deadweight loss and cost, facilitating stabilisation policy and efficient administration. Stiglitz (2000) argues that a tax system is economically efficient, simple to administer, flexible, fair, and politically and socially accountable. Classical economists (most notably Ricardo (2001) and Mill (2015) have argued that taxes can keep the economy normal under optimal conditions. In contrast, Keynes (1936) did not believe in the self-regulating capacity of the market and the hegemonic role of taxes, and argued in favour of an interventionist tax system, especially in years of crisis. The Keynesian school advocates progressive income taxation on the grounds of fairness to lower earners, as it does not believe in the full self-regulating capacity of the market. It envisages the proper functioning and regulation of the economy through the application of several tax concessions. In addition, for reasons of fairness, it advocates taxing wages on the same terms as capital income. According to Friedman (1980), the market is capable of self-regulation, even without strong central regulation. Accordingly, he recommends reducing the progressivity of income taxes to avoid holding back performance. That is why he recommends reducing taxes on capital, so as not to prevent capital formation. According to his point of view, a normative, simple tax system can be created by cutting discounts. Friedman also suggests focusing on consumption taxes, which are paid by all economic stakeholders, and also help to relieve progressivity. Table 1 highlights the key differences between the Keynesian and monetarist schools of economists’ views on taxation.

Table 1.
The Keynesian and monetarist schools of economists’ views on taxation.
The focus of research on taxation includes, among other things, tax regulation and optimal taxation. In the context of optimal taxation, the study by Mirlees (1986), who examined the problem of redistribution of labour income among individuals with different labour incomes, is noteworthy. Gerritsen et al. (2020) found that a tax on capital income promoted income redistribution. Tuomala and Weinzierl (2020) evaluated tax policies and tax preferences. They found that if taxation were to move from utilitarianism to priority prioritisation, several circularities needed to be modelled. Kanbur et al. (2018) evaluated the possibility of designing an optimal tax system in a country where only a linear tax rate could be applied to reduce poverty. As can be seen, optimal taxation mainly provides support for income taxation, but also helps to design a favourable tax mix.
The OECD plays an important role in the harmonisation of tax systems. Christensen and Hearson (2019) reviewed the OECD’s main measures for the appropriate regulation of taxation. In the early 2000s, tax avoidance was the focus, so after the 2008 crisis, tax base sharing was the focus. From 2013 onwards, tax avoidance was again dominant (Hearson and Prichard 2018; Lips 2018; Lesage et al. 2019), with the global minimum tax coming to the forefront of regulatory issues from the late 2010s.
The tax system must respond to crisis situations, as it did in the context of the 2007 global economic crisis (Christensen and Hearson 2019). Four key changes have been identified: state intervention, a shift towards emerging markets, austerity, and issues of populism and digitalisation.
Collier et al. (2020) examined the impact of the COVID-19 pandemic on taxation, with their main finding being that states should actively intervene in the crisis that emerged in the wake of the pandemic, in process.
An exhaustive study on the bibliographic analysis of taxation and competitiveness has been carried out by Mazurenko and Tiutiunyk (2021). The theoretical background of the tax-competitiveness nexus was presented by Boiko and Samusevych (2017), as presented in Table 2.
Table 2.
The development of research on tax competitiveness.
Another relevant source for our research is the study by Slemrod (2004), whose main finding was that the level of corporate tax revenue in each country is influenced by the tax rates applied in other countries. This thesis was confirmed by the studies of Podviezko et al. (2019a, 2019b), who found that tax competition in the EU started to emerge after the accession of new members, a process that was accompanied by a significant reduction in corporate tax rates in developed old EU member states. It was also pointed out that the reduction in tax rates has been accompanied by a reduction in tax revenues.
One of the effects of tax competition is that countries with lower tax rates are preferred in terms of investments. Barrios et al. (2009), Hines (2003) and Brys et al. (2016) found that the tax rate significantly influences the location of the investment and thus the inflow of working capital, since the burden present in countries with high tax rates increases the return on investment if there are no other discounts. According to Clausing (2007), the increase in unemployment reduces company incomes, thereby reducing corporate tax revenues, due to the lack of demand. Based on Gravelle’s (1994) opinion, if consumption taxes are increased, it puts the economy under inflationary pressure (Helcmanovská and Andrejovská 2021; Andrejovska and Pulikova 2018; Banociova and Tahlova 2019).
Helcmanovská and Andrejovská (2021) examined the evolution of corporate tax revenues in EU member states between 2004 and 2019. The EU member states were evaluated by newly acceded countries and by old member states (those that joined before 2004), and they concluded that the average effective tax rate had no effect on corporate tax revenues. At the same time, they found a relationship between unemployment and labour productivity and corporate tax revenues for countries that joined after 2004. Bénassy-Quéré et al. (2014) found that the relationship between tax rates and tax revenues was not clear-cut, with higher tax rates not necessarily associated with higher tax revenues. (Berens and Gelepithis 2019) found that tax increases and progressivity in income taxation were unpopular measures, yet welfare countries with higher redistributive capacity tended to finance their operations through less progressive tax systems.
The special literature findings presented above were used to formulate the hypotheses of the study presented in this paper. From the literature review, the main economic views on taxation were identified. In our empirical investigation, we have formulated two research objectives with two corresponding hypotheses:
- (1)
- We create a composite indicator of the sophistication and obscurity of the tax system in relation to the tax rates and the working time for preparing tax returns (by which we mean the over-regulation, complexity of the tax system and the variability of tax rates), which we name the “simple taxation composite indicator” (STCI for short: composite indicator. Three categories (AgCt) of the points of the composite indicator are formed, which we further investigate.
H1.
The categories created by the composite indicator show a significant difference in relation to macroeconomic variables.
- (2)
- Based on the special literature experience, we explore the relationship system regarding the tax rate, tax burden, and macroeconomic variables, using multivariate statistical methodology.
H2.
There is a correlation between tax rates, tax burden indicators and macroeconomic indicators.
The first hypothesis is tested using variance analysis, while the second hypothesis is tested by correlation analysis.
2. Materials and Methods
The source of the data used was the OECD database, the “t” in the variable names referring to the year under study. The time intervals used are 2014, 2019 and 2020. This is because 2014 was the first (generally consolidated) year of recovery from the subprime crisis in most of the OECD countries, 2019 is the last year before the COVID-19 pandemic, while 2020 is the first pandemic year. The choice of 2020 as the last year was also justified by the fact that it was currently the last year in which all audited data related to the variable under study were available. Based on the time interval considered, we have described the changes in taxes, indirectly inferring the chances of a stable fiscal operation.
Indicators for tax rate and number of taxes:
- –
- The maximum ceiling of the corporate tax rate (CTR)
- –
- Value added tax rate (VR)
- –
- Top personal income tax rate (TIR)
- –
- Corporate tax time expenditure (CorpTi)
- –
- Time expenditure on consumption taxes (ConTi)
- –
- Time expenditure on employment taxes (LabTi)
- –
- Number of taxes on businesses (PP)
- –
- Number of taxes on labour (LP)
Tax burden indicators:
- –
- Tax revenue as % of GDP (TTR)
- –
- Income and profit taxes as % of GDP (IPtaxes)
- –
- Social security contributions as % of GDP (SSC)
- –
- Employee taxes as % of GDP (Payroll)
- –
- Current taxes as % of GDP (TGS)-
Macroeconomic indicators:
- –
- Budget deficit of the central budget in % of GDP (GGdef)
- –
- Change in GDP per capita compared with the previous year (dGDPPpC)
- –
- Central budget debt in % of GDP (GGdebt)
- –
- Unemployment rate (HUR)
- –
- Consumer Price Index (CPI)
- –
- Change in labour productivity (GDPHRWKD)
- –
- Foreign direct investment (FDI)
- –
- Current balance of payments in % of GDP (BOP)
- –
- Central budget revenues in % of GDP (GGREV)
By using tax rates and time expenditure for tax administration, we aimed to measure the complexity of the tax system, and created our composite indicator (AgCt) using these variables.
With the tax burden variables, we aimed to show the fiscal impact of a given tax revenue. In addition, we show the relationship between tax burden variables and tax rates and macroeconomic variables. These variables were chosen based on our own ideas. Among the macroeconomic indicators, budget deficit on the central budget, the central government debt and central government revenue and balanced of payments were examined by Vörös (2011) in the context of the EU member states and tax rates. Reasons for the choice of the FDI variable are based on Barrios et al. (2009), Hines (2003) and Brys et al. (2016), the unemployment rate variable is based on Clausing’s (2007) study and the Consumer Price Index is based on Gravelle (1994) study.
During the development of the composite indicator, we considered the following indicators:
- The maximum ceiling of the corporate tax rate (CTR)
- Value Added Tax rate (VRt),
- Maximum income tax rate (TIRt)
- Corporate tax liability time expenditure (CorpTit)
- Sales tax time expenditure (ConTit)
- Time expenditure on taxes on labour (LabTit)
During the calculation of the composite indicator, we formed three categories from the above six variables. The basic principle of this was by comparison with the OECD average value. In the logic of the indicator, international tax follows the foundation index; however, this indicator does not standardize based on the standard deviation but considers the average as the starting point (Bunn and Asen 2021). During the development of the indicator, we strove for an approach based on relatively simple statistical foundations, and therefore, for the three created categories, we created a category above the OECD average, below the OECD average, and below 50% of the OECD average. The established categories follow the logic and delimitation of Vörös (2011). A value above the average received 3 points. If the value of the given indicator did not reach 50% of the OECD average, it received 1 point, and the intermediate value received 2 points. Accordingly, 1 point is low, 2 points medium, and 3 points high. The STCI indicator results from the sum of the values of the six indicators. When categorizing the countries based on STCI scores, countries were rated low between 6–10 points, medium between 11–14 and high between 15–18 points. In this regard, the categories were proportionally divided into thirds.
In connection with our first hypothesis, the obtained composite indicator (AgCt) was tested using the variance analysis method for the tax burden and macroeconomic variables in the three years examined (2014, 2019, 2020). Our aim was to reveal significant differences (Table 3).
Table 3.
Presentation of the research hypotheses.
3. Results
The empirical research presented in this study is divided into three subchapters: the descriptive statistical analysis of the composite indicator, the variance analysis related to the first hypothesis, and the correlation analysis related to the second hypothesis.
3.1. Descriptive Statistical Analysis of the Composite Indicator Variables
Table 4 presents the descriptive statistical analysis of the tax rates used for the composite indicator.
Table 4.
Descriptive statistical analysis of the variables used for the composite indicator I.
The evolution of the top corporate tax rate (CTR) shows that the average tax rate in the OECD countries was 25% in 2014. However, trends show a decrease in average tax rates in 2019 and 2020 compared with the base year 2014. The standard deviation rate has decreased from 7% in 2014 to 6% in 2019, which is below 30% compared with the average. This implies that there is no significant dispersion in the corporate tax rate of the OECD countries under study. In 2020, the median value is equal to the average, so the average is a good description of the characteristics of the countries under study. The minimum value has decreased compared to 2014, due to the introduction of the single rate of 9% in Hungary. The bottom quartile is 20% in all years under review, so a quarter of countries apply a lower rate. However, the upper quartile has been gradually decreasing. A striking trend is that by 2019, compared to 2014, 16 countries have opted for a tax cut, while five countries have increased their tax rate. The trend across the three years assessed is that corporate tax rates are being cut by policy makers, especially in countries where the top tax rate was exceptionally high.
The average value-added tax rate in the OECD countries was 19% in all years under review, while the standard deviation fell from 6% to 5% over the same period. The relative dispersion was 32% in 2014, shrinking to 26% in 2019, indicating a low degree of dispersion. The minimum, i.e., the lowest value added tax rate applied, increased over the period analysed. The highest value added tax rate was observed in Hungary, with a value of 27%, which remained unchanged over the period analysed. The lower quartile, as well as the minimum tax rates, showed an increase, while the upper quartile remained significantly unchanged. Looking at the trends further, we find that six countries have seen tax changes from 2014 to 2019. Without exception, the changes have been accompanied by an increase in tax rates. The typical tax increase was three percentage points. However, for 2020, two countries decided to change tax rates, with one reducing and one increasing the tax rate.
The average top personal income tax rate has followed a slight upward trend over the period under review, with the standard deviation remaining unchanged at 12%. The relative standard deviation, also for this indicator, is below the threshold of 30%. This means that there is no significant dispersion in the indicator under examination. The median value is higher than the average, with a typical deviation of 10%, which is not significant. The minimum value in 2014 was in Lithuania, while in 2019 and 2020 it was in Hungary, which had a single PIT rate of 15%. In eight cases, the parliaments of these countries decided to reduce the tax rate, while in the same number of cases they decided to increase it, with the overall result of the changes being positive. Then, in 2020, ten countries increased their tax rates, while eight decreased it; however, the result was also positive.
Another important element of tax liability is the amount of time spent, which measures the working time for the preparation of the given tax return expressed in hours per taxpayer. When analysing these data, the different deciles are more prominent.
As Table 5 shows, the average time spent on corporate tax returns is decreasing in the OECD countries. The relative standard deviation exceeds 30% in each year, resulting in a significant dispersion of values. There is also a strong dispersion of the data based on the value of the coverage, which measures the difference between the minimum and maximum. The largest decrease in the volume of time spent is observed between 2014 and 2019, and one obvious reason for this could be the longer comparison period. In 2020, some deciles, especially those above the median, show an increase of a few working hours, due to possible IT or regulatory difficulties in the wake of the pandemic. In several countries, it was necessary to postpone the filing deadlines, for example for Hungary the deadline for corporate tax returns was extended by five months.
Table 5.
Descriptive statistical analysis of the variables used for the composite indicator II.
Over the period under review, the corporate tax filing period has been on a downward trend or stagnant, except for the year 2020. This is not covered by our analysis, but it can be assumed that the decline in tax filing time may be due to the increasing role of digitalisation, both from the taxpayer’s and the tax administration perspectives. It can also be concluded that the reduction in the number of working hours spent on tax returns is mainly due to countries where the time needed to prepare tax returns was already lower.
The average time taken to prepare a tax return for labour taxes also shows a downward trend over the period, but the number of tax items leads to higher what-ifs and maximums. The relative standard deviation is also over 30%, while the median is within 10% of the average. From the analysis of the data, it can be deduced that the time needed to file returns is decreasing in all deciles, with a rare case of stagnation. The largest decrease in time is between 2014 and 2019, with a significant decrease in the time taken to complete a tax return, except for the top decile. Further decrease or stagnation is observed in the deciles after the corporate tax return, with a particularly significant decrease in the countries with higher time requirements by 2020.
The trend for sales taxes is that the average time taken to prepare a return has decreased for 2019, as has the standard deviation. The relative standard deviation value exceeds the 30% threshold for this indicator in all the years under review, with the median being more than 10% below the average. The trend for sales taxes is a decrease of four hours on average in 2019, but a slight increase in 2020. This is due to a four-hour increase in time taxes in the top decile category, which is considered the most complex, but a decrease in the top decile. The main reason is the increase in man-hours for the country with the highest time expenditure.
3.2. Examination of the Distribution of Categories Formed from Composite Indicators
In the following, we present the score obtained by the composite indicator for each country, based on the three categories described in the material and methodology chapter. The purpose of this is to present the classification of each country’s categories and its changes.
In the period under review, the composite indicator shows that the obscurantism of the tax system was low in two countries in 2014 and in 3–3 countries in 2019 and 2020, which is considered a positive result based on mainstream economic theories. The largest share of the tax system is of medium complexity, while it is typically considered complex at levels above 20% across the OECD countries. Our analysis concludes that Estonia and Switzerland had the most complex tax systems in 2014. Estonia retained this status in all three years, while Switzerland was considered to have the simplest tax system until 2019. Our analysis shows that in 2020 the US caught up with Switzerland.
Based on the analysis of the data, the countries with high obscurity tax systems showed a relative constancy; from 2019, Chile was included among the countries with such characteristics, but by 2020 it was already out of this circle. In the last examined year, Slovakia was included in the group of countries with highly obscure judicial tax systems, while Portugal was excluded from it. The indicator therefore showed a relatively significant stability, as the number of groups formed in each reviewed year was similar. In all three years, the following countries belonged to the group of high obscurity tax systems: Austria, Colombia, Germany, Greece, Italy, Slovenia, and Spain (Table 6).
Table 6.
Distribution of the categories of the composite indicator in the examined years.
The 36 countries surveyed were grouped into seven regions in our analysis to determine whether there are geographical characteristics of tax system sophistication. The analysis was performed using a cross-tabulation analysis, which found a significant correlation between the composite indicator category and geographic location for 2014 and 2019, as the Chi2 test value was below the 5% significance level, although it was only slightly below this threshold in 2014. The Chi2 test statistics conditions were met prior to the study (we highlighted only those variables where the Chi-square test was significant).
The strength of the relationship was stronger than medium for both years, based on Cramer’s V Indicator. Cramer’s coefficient V is an effect size measure for the chi-square test of independence. It measures how two categorical fields are associated. If the Cramer V indicator is above 0.5, a strong effect can be established. (Table 7).
Table 7.
Correlation analysis between territorial location and the categories of the composite indicator.
Figure 1 shows the most common composite indicator category for a given region. The complexity of the tax system is medium in northern and western Europe, as well as in North America and the EU Member States in eastern Europe, Asia, and Oceania. A tax system with low obscurity does not have a typical geographical characteristic, while a tax system with a high degree of sophistication was a feature mainly of southern Europe and, in 2019, South America.
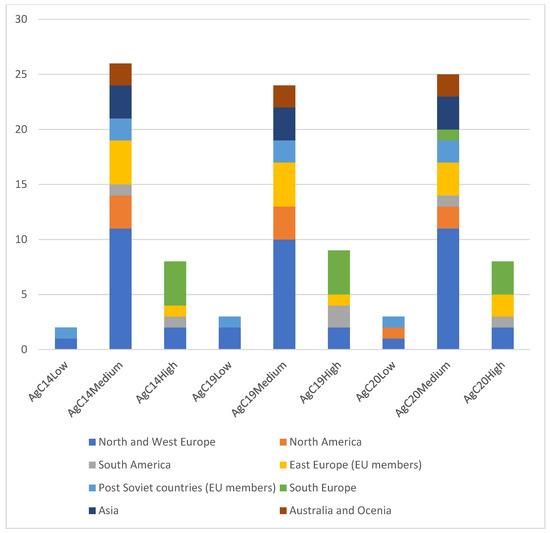
Figure 1.
Distribution of the composite indicator by region (Source: own research, 2022).
3.3. Evaluation of Differences between the Composite Indicator and the Investigated Variables
In the following, we project the effects of the composite indicator categories on macroeconomic and tax burden variables in the OECD countries. To do so, an analysis of variance is carried out among the composite indicator categories and between the tax burden and macroeconomic variables, to detect whether there is a significant difference between tax systems. All the variables presented in the chapter on materials and methodology were included in the analysis, but only 2 variables in each year showed significant differences. The source of the macroeconomic data was the OECD database (dependent variable). The independent variable was the composite indicator. For these results the assumptions of the analysis of variance were met.
The analysis shows that there was a difference in the unemployment rate (HUR) in each of the years under review. In 2014, there was a significant difference in the GDP share of taxes on labour (Payroll), in 2019 in the budget deficit to GDP (GGdef), while in 2020 there was a significant difference in the GDP growth rate (GDPgr) (Table 8).
Table 8.
Analysis of variance (ANOVA) table result.
We also examined the means plots that showed that countries with a high degree of sophistication in the tax system had a much higher unemployment rate than the other two categories in all years examined. This fact is mainly specific to southern European countries, which may be higher due to the conditions of employment and tax rates. In 2014, countries with less complex tax systems had the highest employee tax revenue as a share of GDP. The same pattern can be observed for the 2019 fiscal deficit, but the graph has a different meaning, as a simpler tax system is associated with a fiscal deficit. In 2020, GDP declined in all but three countries, mainly due to the impact of the pandemic. The rate of decline was significantly higher for countries with a sophisticated tax system.
3.4. Correlation Analysis
A correlation analysis was carried out among the variables examined, based on the average of the three years studied. These are summarised in Table 9. For reasons of visual simplification, we only show those relationships where a relevant correlation can be discovered at an appropriate level of significance.
Table 9.
Result of the correlation analysis.
The analysis shows that the relationship between the top corporate tax rate (CTR) and the value added tax rate (VR) is negative, i.e., inversely related, with a strength of less than medium. A striking example of this is Hungary, which has the highest value added tax rate among the OECD countries and one of the lowest corporate tax rates. The economic views discussed in the tax theory section illustrate this fact, as the Keynesian view in this respect favours taxes on income, while the monetarist view favours sales taxes. The logic of the monetarist view is confirmed in the OECD countries by the fact that there is a weaker than medium positive relationship between the top personal income tax rate (TIR) and the top corporate tax rate. The results show a stronger-than-medium negative relationship between the GDP growth rates and labour productivity and also between GDP growth rates and the corporate tax rate. It suggests that in countries with a high tax rate, GDP growth (GDPgr) and labour productivity (GDPHRWKD) are restrained, as a significant part of the profits is diverted, and firms are unable to invest significantly in efficiency gains.
The study revealed a weaker-than-average positive relationship between the general rate of value added tax (VR) and the GDP growth (GDPgr) and also between the general rate of value added tax (VR) and the budget deficit (GGdef). From this, we conclude that the choice of the tax rate has strong indirect economic and budgetary effects, since we examined no correlation between sales taxes and the GDP ratio (TGS).
The upper band of personal income tax also has a significant budgetary impact, which shows a stronger-than-average negative relationship with GDP growth (GDPgr), as well as with the consumer price index (CPI) and labour productivity (GDPHRWK), and at the same time a positive relationship with the level of public debt (GGdebt). The consequence that can be deduced from this is that if the top rate of personal income tax is high, it provides considerable budgetary room for manoeuvre and does not increase the consumer price index directly, but restrains work performance and thus presumably has an effect of inhibiting GDP growth.
There is a positive relationship between the number of taxes on labour (LP) and the number of taxes on profit (PP), suggesting that where there is a significant burden on business management, labour is taxed to a similar extent. The analysis also reveals a negative relationship between FDI (FDIFLOW) and the number of taxes on labour (LP), where the relationship is weaker than medium, suggesting that the number of taxes on labour negatively influences capital inflows into the country.
Based on the data, it can be concluded that there is a stronger-than-average positive relationship between total tax revenue (TTR) and taxes on income and profits (IPTAXES) and sales taxes (TGS), while there is a strong positive relationship between social security contributions (SSC) and total tax revenue relationship, as shown. The budgetary role of sales taxes, on the other hand, already shows a negative relationship with the consumer price index, but its level is weaker than average.
4. Discussion
We were able to partially support both of our hypotheses with the conducted empirical investigation. Regarding our first hypothesis, data from Table 8 on the analysis of variance illustrates how the categories formed from the composite index showed a significant difference in unemployment every year, but in 2019 the central budget balance and GDP growth revealed the tax systems with different obscurity factors (i.e., the complexity of the tax system, the level of tax rates) to have significant difference between countries, and thus we consider H1 to be partially accepted. Regarding these indicators, it can be stated that the macroeconomic indicators of countries with highly sophisticated tax systems are worse than those of the countries with less sophisticated tax systems, in both medium and low categories.
Our second hypothesis consisted of four sub-hypotheses, of which two have been accepted, and two have been rejected. The sub-hypothesis marked “a” of the second hypothesis was proven, by revealing a negative relationship between the upper rate of corporate tax and the rate of value added tax, as indicated by the data presented in Table 9. From this, we draw the conclusion that there is a choice between the theoretical tax views of the economic schools, and this consequence can be deduced from the negative relationship. This fact therefore leads to the conclusion that in the preferences of the examined countries, either turnover/consumption taxes or income taxes, i.e., taxes on the income of companies, are preferred. We accepted sub-hypothesis “c” of our second hypothesis also indicated in the data presented in Table 9, as the study revealed a negative relationship between labour productivity and tax rates on income and profit, which suggests that high tax rates result in withholding performance, in line with the views of the monetarist school of economics.
The study did not confirm the correlations found in the literature that there is a positive relationship between corporate tax rate and working capital flows, i.e., that working capital inflows are basically preferential to safe public finances rather than the corporate tax rate, nor did our study find a relationship between the value added tax rate and the consumer price index up to 2020. The corresponding data can also be found in Table 9.
The research found that a significant proportion of the countries surveyed cut corporate tax rates from 2014 to 2019, with the presumed aim of encouraging tax hikes and keeping companies in business to ensure prosperity, a trend that continued in 2020, even in the year affected by the pandemic.
In addition, the research shows the following new and novel results:
- Tax administration burdens have decreased in most countries. The trend was slightly interrupted by the impact of the pandemic for VAT and corporate tax.
- In terms of geographic characteristics, southern Europe and South America are considered as the most complex group of countries in terms of tax systems, based on composite indicator categories in our analysis.
- A more complex and burdensome tax system is associated with unfavourable macroeconomic and tax burden indicators in some respects.
- A possible increase in tax rates on income and profits may have a spill-over effect on GDP growth, while an increase in consumption taxes does not have such a spill-over negative effect, confirming the research of Bunn and Asen (2021).
5. Conclusions
As a general trend, taxes on corporate income have decreased, while taxes on consumption have increased in the OECD countries, and there has been a slight increase in personal income tax. At the time of starting our research, the year 2021 was not yet the subject of the study, but it can be concluded that the top rate of corporate tax is unchanged, i.e., countries have not changed their tax rates significantly. However, there have been tax cuts for some countries, such as France and Switzerland, and Greece. In the case of Turkey, an increase has been decided.
The VAT rate did not change in any country in 2021, suggesting that countries did not want to curb consumption. Top personal income tax rates are typically unchanged, but the picture is mixed. Three countries have seen tax cuts: Greece, Sweden and the The Netherlands. Turkey and Lithuania increased their top personal tax rates.
These factors suggest that there were no significant changes in the tax systems of OECD countries in 2021, and that where there were changes, they were typically made in order to cushion the effects of the crisis by cutting taxes, or to deal with the effects of rising inflation by raising taxes, in the case of Turkey (https://stats.oecd.org/, accessed on 11 October 2022). As a result of the pandemic, the trends identified have not changed significantly.
In our view, the pandemic and the post-pandemic situation will make it especially important to establish a well-functioning tax system that does not necessarily have a negative impact on the functioning of the economy, which is simple for taxpayers, and has low administrative costs for the tax authorities. On the other hand, the tax system has an important role to play in ensuring fiscal stability, and hence, policy makers need to consider a dual perspective when designing the appropriate tax mix. Based on our research, an interesting next step could be the development of an econometric model that would focus on assessing the predictability of tax systems.
Author Contributions
Conceptualisation, C.L.; methodology, S.H.; software, S.H.; validation, C.L. and V.N.; formal analysis, C.L. and S.H.; investigation, S.H.; resources, C.L. and S.H.; data curation, S.H.; writing—original draft preparation, C.L. and S.H.; writing—review and editing, V.N.; visualization, S.H.; supervision, V.N.; project administration, C.L. and V.N. All authors have read and agreed to the published version of the manuscript.
Funding
This research received no external funding.
Data Availability Statement
All data used in this paper can be downloaded from the OECD database (https://www.oecd.org, accessed on 11 October 2022).
Conflicts of Interest
The authors declare no conflict of interest.
References
- Andrejovska, Alena, and Veronika Pulikova. 2018. Tax Revenues in the Context of Economic Determinants. Montenegrin Journal of Economics, Economic Laboratory for Transition Research (ELIT) 14: 133–41. [Google Scholar] [CrossRef]
- Banociova, Anna, and Tahlova Slavomira. 2019. European States in a Bout of Corporate Tax Competition. Journal of Competitiveness 11: 19–34. [Google Scholar] [CrossRef]
- Barrios, Salvador, Per Iversen, Magdalena Lewandowska, and Ralph Setzer. 2009. Determinants of intra-euro area government bondspreads during the financial crisis. In European Economy—Economic Papers. Economic Papers. Brussels: European Commission, vol. 388, pp. 1–28. [Google Scholar]
- Bénassy-Quéré, Agnès, Alain Trannoy, and Guntram Wolff. 2014. Tax Harmonization in Europe. Paris: The French Conseil d’analyse économique. [Google Scholar]
- Berens, Sarah, and Gelepithis Margarita. 2019. Welfare state structure, inequality, and public attitudes towards progressive taxation. Socio-Economic Review 17: 823–50. [Google Scholar] [CrossRef]
- Boiko, Anton, and Iaryna Samusevych. 2017. The role of tax competition between the countries of the world and the features of determining the main tax competitors of Ukraine among the European countries. Financial Markets, Institutions and Risks 1: 72–79. [Google Scholar] [CrossRef][Green Version]
- Brys, Bert, Sarah Perreti, Alastair Thomasi, and Pierce O’Reillyi. 2016. Tax Design for Inclusive EconomicGrowth. OECD Taxation Working Papers, No. 26. Paris: OECD Publishing. [Google Scholar]
- Bunn, Daniel, and Elke Asen. 2021. International Tax Competitiveness Index 2021. Washington: Tax Foundation. [Google Scholar]
- Rasmus, Corlin Christensen, and Martin Hearson. 2019. The new politics of global tax governance: Taking stock a decade after the financial crisis. Review of International Political Economy 26: 1068–88. [Google Scholar] [CrossRef]
- Clausing, Kimberly A. 2007. Corporate tax revenues in OECD countries. International Tax and Public Finance 14: 115–33. [Google Scholar] [CrossRef]
- Collier, Richard, Alice Pirlot, and John Vella. 2020. Tax policy and the COVID-19 crisis. Intertax 48: 794–804. [Google Scholar]
- Delgado, Francisco J. 2013. Are Taxes Converging in Europe? Trends and Some Insights into the Effects of Economic Crisis. Journal of Global Economics 1: 24–26. [Google Scholar] [CrossRef]
- Fellegi, Miklós, ed. 2022. Taxation. Budapest: Saldo. [Google Scholar]
- Friedman, Milton R. 1980. Free to Choose: A Personal Statement. New York: Harcourt Brace, pp. 6–7. [Google Scholar]
- Gerritsen, Aart, Bas Jacobs, Alexandra Victoria Rusu, and Kevin Spiritus. 2020. Optimal Taxation of Capital Income with Heterogeneous Rates of Return. CESifo Working Paper, No. 8395. Munich: Center for Economic Studies and Ifo Institute (CESifo). [Google Scholar]
- Gordon, Roger H., and John D. Wilson. 2002. Expenditure Competition. Available online: http://www.econ.ucsd.edu/~rogordon/zoning6.pdf (accessed on 12 August 2022).
- Gravelle, J. 1994. The Economic Effects of Taxing Capital Income. Cambridge: MIT Press. [Google Scholar]
- Hearson, Martin, and Wilson Prichard. 2018. China’s challenge to international tax rules and implications for global economic governance. International Affairs 94: 1287–307. [Google Scholar] [CrossRef]
- Helcmanovská, Martina, and Alena Andrejovská. 2021. Tax Rates and Tax Revenues in the Context of Tax Competitiveness. Journal of Risk and Financial Management 14: 284. [Google Scholar] [CrossRef]
- Hines, James R. 2003. Sensible Tax Policies in Open Economies. Dublin. Journal of the Statistical and Social Inquiry Society of Ireland 33: 1–39. [Google Scholar]
- Kanbur, Ravi, Tulii Paukkeri, Jukka Pirttilä, and Tuomala Matti. 2018. Optimal taxation and public provision for poverty reduction. International Tax Public Finance 25: 64–98. [Google Scholar] [CrossRef]
- Kemp, Maynard. 1961. Foreign Investment and National Advantage. The Economic Record 28: 56–62. [Google Scholar] [CrossRef]
- Keynes, John. 1936. The General Theory of Employment, Interest and Money. London: Macmillan Cambridge University Press for Royal Economic Society. [Google Scholar]
- Lesage, Dries, Lips Wouter, and Matthias Vermeiren. 2019. The BRICs and International Tax Governance: The case of automatic exchange of information. New Political Economy 25: 1584168. [Google Scholar] [CrossRef]
- Lips, Wouter. 2018. Great powers in global tax governance: A comparison of the US role in the CRS and BEPS. Globalizations 16: 104–19. [Google Scholar] [CrossRef]
- Mazurenko, Oleksiy, and Inna Tiutiunyk. 2021. The International Tax Competitiveness: Bibliometric Analysis. Financial Markets, Institutions and Risks 5: 126–38. [Google Scholar] [CrossRef]
- Mill, John Stuart. 2015. Principles of Political Economy. Kindle Edition. Glasgow: Some Good Press. [Google Scholar]
- Mirrlees, James. 1986. The Theory of Optimal Taxation. Handbook Math. Econ. Available online: https://www.researchgate.net/publication/250754809_The_Theory_of_Optimal_Taxation (accessed on 12 August 2022).
- Musgrave, Penny B., and Richard A. Musgrave. 1989. Public Finance in Theory and Practice, 5th ed. New York: McGraw-Hill. [Google Scholar]
- Podviezko, Askoldas, Parfenova Lyudmilla, and Pugachev Andrey. 2019a. Tax Competitiveness of the New EU Member States. Journal of Risk Financial Management 12: 34. [Google Scholar] [CrossRef]
- Podviezko, Askoldas, Parfenova Lyudmilla, and Pugachev Andrey. 2019b. A historical analysis of tax competitiveness between EU member states. New Trends and Issues Proceedings on Humanities and Social Sciences [Online] 6: 25–36. Available online: www.prosoc.eu (accessed on 12 August 2022).
- Ricardo, David. 2001. On the Principles of Political Economy and Taxation. Kitchener: Batoche Books. [Google Scholar]
- Richman, P. 1963. Taxation of Foreign Investment Income. Baltimore: Johns Hopkins Press, p. 140. [Google Scholar]
- Slemrod, Joel. 2004. Are corporate tax rates, or countries, converging? Journal of Public Economics 88: 1169–86. [Google Scholar] [CrossRef]
- Smith, Adam. 2007. An Inquiry into the Nature and Causes of the. Wealth of Nations. Edited by S. M. Soares. MetaLibri Digital Library: p. 349. First published in 1776. [Google Scholar]
- Stiglitz, Joseph E. 2000. Economics of the Public Sector. New York: W.W. Norton & Company. [Google Scholar]
- Tiebout, Charles. 1956. A Pure Theory of Local Expenditures. Journal of Political Economy 64: 416–24. [Google Scholar] [CrossRef]
- Tuomala, Matti, and Matthiew Weinzierl. 2020. Prioritarianism and Optimal Taxation in Matthew Adler and Ole Norheim (2020) Prioritarianism in Practice. Cambridge: Cambridge University Press, pp. 1–21. [Google Scholar]
- Vörös, Gyula. 2011. The Impact of Taxes on Competitiveness in the European Union. Gödöllő: Szent István University. [Google Scholar]
- Zaynalov, Djaxongir R., and Zarif O. Ahronov. 2019. Modernization of the Tax Science: Methodology and New Paradigms. International Journal of Multidisciplinary and Current Research 7: 305–12. [Google Scholar] [CrossRef]
- Zodrow, George, and Peter Mieszkowski. 1986. Pigou, Tiebout, property taxation and the underprovision of local public goods. Journal of Urban Economics 19: 356–70. [Google Scholar] [CrossRef]
Publisher’s Note: MDPI stays neutral with regard to jurisdictional claims in published maps and institutional affiliations. |
© 2022 by the authors. Licensee MDPI, Basel, Switzerland. This article is an open access article distributed under the terms and conditions of the Creative Commons Attribution (CC BY) license (https://creativecommons.org/licenses/by/4.0/).