Article

Earnings Management and Corporate Performance in the Scope of Firm-Specific Features

by
Dominika Gajdosikova
*,
Katarina Valaskova
* and
Pavol Durana
Department of Economics, Faculty of Operation and Economics of Transport and Communications, University of Zilina, Univerzitna 1, 010 26 Zilina, Slovakia
*
Authors to whom correspondence should be addressed.
J. Risk Financial Manag. 2022, 15(10), 426; https://doi.org/10.3390/jrfm15100426
Submission received: 16 August 2022 / Revised: 7 September 2022 / Accepted: 19 September 2022 / Published: 23 September 2022

Abstract

:
Various models have been created all around the world to identify enterprises that manipulate their earnings. These earnings management techniques aid businesses in enhancing their financial performance or gaining some competitive advantages. The primary goal of this article was to identify the firm-specific characteristics that affect how businesses manage their earnings using a sample of 15,716 businesses from various economic sectors in the Slovak environment during a 3 year period. The level of earnings management was measured by discretionary accruals using the Kasznik model. In this paper, a correspondence analysis using the chi-square distance measure was applied to find the dependence between the earnings management practices and firm-specific features (firm size, legal form, and sectoral classification). The results of the study indicate that aggressive (income-increasing) earnings management practices are typical of small enterprises with a public limited ownership structure, mostly in sectors R and M (using the NACE sectoral classification). Conservative (income decreasing) practices can be observed in enterprises in the sectors J or F, and they are also used by medium-sized enterprises and those with private limited ownership structure. The results revealed that large enterprises do not tend to manipulate their earnings, as well as enterprises operating in sector K. The insights of this study may provide important and useful information for shareholders and regulators in evaluating determinants that are effective in mitigating earnings management practices. Authorities, regulators, analysts, and auditors may find the importance of the discovered variances helpful in identifying various strategies and techniques for earnings manipulation that may differ among industries according to their typical characteristics.

1. Introduction

It is not easy to find a single and completely accurate definition of earnings management. Different experts have various opinions on the definition of the issue, which is why several definitions have been created over time. However, they all agree that when using earnings management, companies achieve specific goals by being able to adjust and, to some extent, manipulate their financial results. In history, a large number of examples of different adjustments to financial results in companies can be found. In most cases, the adjustments were made because of financial problems that engulfed the entire company. If the company wanted to continue operating and did not want to lose its reputation, it was necessary to adjust its financial statements. Managers are aware that, by using earnings management models and tactics, they have to accept a certain loss of future cash flow in order to achieve the desired values of short-term indicators and maintain appropriate corporate performance (Guluma 2021).
The models, which are commonly used to detect earnings management practices, use the calculation of accruals, which was proven to be a successful measure of earnings manipulation (Beslic et al. 2015). The method of detecting possible manipulation of accounting statements via accruals was created by Jones (1991). A nondiscretionary accrual is a compulsory expense that has not yet been realized but is already recorded in the accounting book. A discretionary accrual is an optional expense that has not yet been realized but is already recorded in the accounting book. Using these mandatory and optional expenses not yet realized, the management of the company can manipulate statements for the purpose of the already mentioned income smoothing (Mantone 2013). Jones (1991) claimed that, as nondiscretionary accruals increase, discretionary accruals decrease, and vice versa. The value of nondiscretionary accruals can be compared with the total value of assets, and, if this comparison shows a lower value of nondiscretionary accruals in some periods compared to other periods, this indicates an increase in discretionary accruals compared to other periods and, therefore, possible manipulation of financial statements. Many other models and methods dealing with the issues of creative accounting, earnings management, and financial statement manipulation are based on the explanatory power of accruals, in addition to the Jones model of nondiscretionary accruals. Sloan (1996), Teoh et al. (1998), Jeter and Shivakumar (1999), Kasznik (1999), Key (1999), Dechow and Dichev (2002), and their modifications of the original model can be included among the most important. Siekelova et al. (2021) investigated the detection power of the modified Jones model, industry model, and the Kothari model in the conditions of the Visegrad countries. Analyzing the enterprises in the context of the country and firm size, they proved that the modified Jones model or its modifications achieve the best results in this environment.
Thus, the primary aim of this article was to identify the association between firm-specific features and earnings management behavior (neutral, aggressive, or conservative earnings management practices) measured by discretionary accruals using a sample of 15,716 Slovak businesses with total assets of at least 300,000 EUR during a 3 year period (2017–2019). The COVID-19 pandemic-affected years were not included in the analysis because they would have potentially skewed the findings. To make sure that the selection of businesses was not just dependent on the size or volume of turnover, purposeful sampling was used; thus, a limitation on total assets was set. By adopting the Kasznik model (1999), discretionary accruals were used to gauge the level of earnings management. In numerous investigations, the Kasznik model’s use was successful (e.g., Veronica and Bachtiar 2005; Merdani et al. 2020; Parwar et al. 2021). Beslic et al. (2015) applied models for earnings management detection in the Serbian economic context, stating that this model had the best industrial sector explanatory power. The Kasznik model was utilized by Nazir and Afza (2018) to analyze the relationship among reported earnings manipulation, corporate governance, and business value. Analysis of the situation in Slovakia was undertaken as a result of prior studies mapping the relationship between firm-specific features and earnings management techniques (e.g., Bassiouny et al. 2016; Alareeni 2018; Das et al. 2018; Saona et al. 2020; Valaskova et al. 2021).
Thus, the originality of the study can be perceived on two levels: (i) the study maps the situation in Slovak conditions where the earnings management phenomenon has not been sufficiently explored yet and the results may be useful for all parties concerned; (ii) the robust sample of enterprises with different firm-specific characteristics enables thorough investigation of earnings management practices. The study also presents the results of the practical application of the Kasznik model and the use of a multivariate statistical technique in the process of earnings management detection, which is its main contribution to the field. The paper’s practical contribution is the evidence of the substantial disparities in earnings management practice, which are associated with specific firm features. However, a review of previously published research papers revealed that earlier research mostly concentrated on certain factors that affect earnings management behavior in various national contexts. The investigation in the central European area is underdeveloped (e.g., Durana et al. 2022a; Kliestik et al. 2021); therefore, this paper aimed to fill this knowledge gap by demonstrating associations between earnings management practices and firm-specific features in the Slovak environment.
The paper is divided as follows: the first section of the paper underlines the most relevant and significant references devoted to the research field. The data and methodology section introduces the sample of analyzed enterprises, as well as the method of correspondence analysis used to find the relationship between the firm-specific features and earnings management practices. The results and discussion section presents the findings (analytical and graphical findings) and compares the findings in the context of other international studies. The conclusions section offers theoretical contributions and practical implications of the research.

2. Literature Review

Authors from all over the world have concentrated on various factors of earnings manipulation and attempted to reveal the most important determinants (Alhadab and Al-Own 2019). Not only intra-company characteristics, but also factors at the national level have a significant effect. Both macro- and micro-economic impacts were examined by Poradova and Siekelova (2020) and Saona and Muro (2018). They discovered that dividend payouts and ownership structure had a beneficial impact on the manipulation of profitability; Nguyen and Duong (2020) reported comparable findings. Gonzalez and Garcia-Meca (2014) examined the significance of the mutual link between discretionary accruals and ownership structure, and they asserted that it was nonlinear. Susanto et al. (2019) used data from 132 nonfinancial enterprises listed on the Indonesia Stock Exchange to show that institutional ownership and tax aggressiveness have a positive and significant impact on earnings management, whereas firm size, director independence, audit quality, and managerial ownership have no bearing. However, the results of this study were in contrast with those of Tran and Dang (2021), who proved the impact of firm size, financial leverage, profitability, and audit quality on earnings management practices. Supardi and Asmara’s (2018) findings demonstrated that firm size has no discernible impact on earnings management, which was demonstrated using a sample of businesses registered on the Indonesia Stock Exchange. Generally speaking, stock options worsen earnings management in highly competitive and expanding enterprises (Hussain et al. 2020; Postula and Raczkowski 2020). The study of Costa and Mota (2021) in the Portuguese environment confirmed that the main determinants of earnings manipulation are debt level, return on assets, and firm size. The research of Ngo and Le (2021), Salehi and Dashtbayaz (2020), and Ajina et al. (2016) was characterized by the revelation of a substantial relationship between firm size and earnings value. Yasser and Mamun (2017) found that firm size influences the quality of financial reports, and that older companies are associated with worse financial reports and, thus, greater potential for earnings manipulation. As a crucial component of managing earnings, debt structure was also mentioned (Thanh et al. 2020). Their investigation of 432 nonfinancial Vietnamese listed companies revealed two nonlinear effects of debt ratio on earnings management: one connected to a low-debt regime (positive) and the other connected to a high-debt regime (negative). A few accuracy-based financial ratios also contribute significantly to the process of identifying unintended accounting errors (Papik and Papikova 2021).
Additionally, all forms of earnings management are more constrained in countries with higher levels of financial development (Enomoto et al. 2018). Li (2010) used logit models to examine the relationship between enterprise-specific traits and managerial perceptions of earnings. The study emphasized the significance of cross-sectional variances, which authorities and practitioners should take into account while analyzing the wage threshold. The sector of operation, shareholder structure, capital nationality, and audit company repute were all identified as major financial and nonfinancial indications of profits manipulation (Carp and Georgescu 2015). Das et al. (2018) discovered that, in Indian firms, prospects for corporate growth, financial performance, institutional ownership, and company age had a negative impact on earnings management behavior. In their investigation of the relationship between pre-managed profits and discretionary accruals, Chen et al. (2012) argued that company age and industry had an impact on the amount of discretionary accruals.
On the basis of the previous literature, the following hypothesis was developed:
H1: 
There is a statistically significant relationship between earnings management practices (measured by discretionary accruals) and firm-specific features.
Using stock options as compensation, Meek et al. (2007) showed that enterprise size is a significant factor in earnings manipulation. These authors also showed that earnings management practices can be found in large enterprises. The study by de Souza et al. (2013) emphasized the meager influence of firm size, debt, and ownership structure on earnings management. Contrary to what Cudia et al. (2021) discovered, these findings showed that firm size is a statistically significant earnings management determinant. Contrarily, the results of de Souza et al. (2013) revealed that firm size, debt, and ownership structure only had a weak influence on earnings management, analyzing a sample of Brazilian delisting enterprises. In Vietnamese conditions, Nguyen et al. (2021) investigated that corporate financial performance, size, and leverage affect earnings manipulation in a negative way; the same factors were investigated in the study by Shoaib et al. (2021), highlighting their significance in corporate practice. Githaiga et al. (2022) enriched previous findings in the field by proving that firm size can moderate the relationship between ownership structure and earnings manipulation (analyzing companies listed in the East African Community), which are the same findings as those of Sanchez-Ballesta and Yagua (2022) achieved in Spanish conditions. Nonetheless, discretionary accrual is often positive for small enterprises, which is associated with an active approach to earnings management. This is due to the fact that it is advantageous for them to appear more successful if they are looking for investors (Durana et al. 2021b). Medium-sized businesses use conservative earnings management to cut back on discretionary accruals, which supports the findings of Sanchez-Ballesta and Yagua (2022) and Bansal (2021). This method is employed to receive specific benefits and avoid paying taxes (Svabova et al. 2020a). Large companies do not need to manage discretionary accruals (Wuryani 2012). Shaoib and Siddiqui (2022) confirmed and endorsed the significance of company size as a factor in earnings manipulation.
H1a: 
There is a statistically significant relationship between earnings management practices (measured by discretionary accruals) and firm size.
Setyoputri and Mardijuwono (2020) focused on the impact of corporate attributes on earnings management and detected that the ownership structure and level of debt affect earnings manipulation, while the firm size has no effect when analyzing Indonesian manufacturing companies. Burgstahler et al. (2006) documented that private enterprises reported higher degrees of earnings manipulation compared to public ones, which may have been caused by different responses of these ownership structures to macro and micro institutional factors. Moreover, Kaldonski et al. (2020) confirmed that enterprises with stable ownership do not manipulate and overproduce earnings. Several studies also declared the important effect of ownership concentration on the use of accrual earnings management (Aldahab et al. 2020; Piosik and Genge 2020; Zainuldin and Lui 2020; Wasan and Mulchandani 2020). The outputs of the research by Chen et al. (2020) confirmed that enterprises with limited partnership are more engaged in earning management practices compared to limited partnership as they are forced to generate consistent flow of earnings. A significant role is played by the ownership structure in the context of earnings management, as some structures and legal forms help reduce these practices (Al-Duais et al. 2022) and enhance the quality of financial reports (Bever et al. 2019).
H1b: 
There is a statistically significant relationship between earnings management practices (measured by discretionary accruals) and legal form/ownership structure.
Zhong et al. (2022) found that industry growth may enhance earnings management, while industrial competition weakens it. Baatwah et al. (2021) also reported that specific industry expertise can result in earnings manipulation reduction. The economic sector has a significant impact on how enterprises handle their earnings. Moreover, research by Li (2010) and Carp and Georgescu (2015, pp. 2146–58) supported the beneficial impact of the sector of operation on earnings management. Zhong et al. (2022) measured the impact of industrial environment on earnings management activities and revealed that industry growth may increase these activities. Perafan-Pena et al. (2022) also provided evidence demonstrating the significance of the sector in the relationship to earnings management. The study of Thoppan et al. (2021) confirmed the relevance of sectoral operation, declaring that services businesses provide earnings manipulation at a considerably greater rate than manufacturing enterprises. The industrial policy of enterprises and associated activities are crucial factors that may help stakeholders recognize earnings management practices (Perafan-Pena et al. 2022; Durana et al. 2021a) and provide relevant information for their investment decisions and regulation revisions (Lee and Chou 2020)
H1c: 
There is a statistically significant relationship between earnings management practices (measured by discretionary accruals) and industry/sector.
Thus, the previously mentioned studies can be perceived as proof of the importance of national conditions in which an enterprise operates (Goncalves et al. 2022), underlining the relevance of country case studies. Earnings management is a common practice, but it needs to be stopped since businesses are required to give their creditors, business partners, or authorities financial statements that reflect actual performance (Sun and Sun 2008).

3. Materials and Methods

At the beginning of the research, a dataset containing economic information on 17,992 companies with headquarters in the territory of the Slovak Republic was built (using the Orbis database supported by Moody’s Analytics). The selected enterprises met the condition that the value of their total assets was at least 300,000 EUR in the monitored period, to obtain the enterprises with the same performance background. The final sample, after the removal of unavailable and outlying values, consists of 15,716 enterprises. It should be underlined that the given set, which was utilized to determine the discretionary accruals, constituted a representative sample of business entities (Slovak Business Agency 2021). Table 1 summarizes the individual representation of enterprises in the following categories: company size, NACE classification, and legal form (ownership structure).
Enterprises were divided into four groups in terms of size: small, medium-sized, large, and very large. Medium-sized enterprises were most represented, for which the following applied: 1 million EUR in goods and production sales; 2 million EUR in total assets.
According to the NACE classification, most companies operated in category G—wholesale and retail trade; repair of motor vehicles and motorcycles, influenced by the fact that the Slovak Republic is a country of car production. Their subsequent sale and provision of service is closely related to the production of cars. On the contrary, the fewest enterprises in the sample were in category O—public administration and defense; compulsory social security, influenced by the fact that this sector is not the most profitable and, therefore, not attractive enough for entrepreneurs.
According to the legal form, the most represented companies were limited-liability companies. This type of legal form is the most widespread due to its simple establishment (it can be established by an individual or a maximum of 50 natural persons), a relatively low share of capital (5000 EUR), and a guarantee only by the company’s assets or by the unpaid contributions of partners. The second most widespread legal form in the dataset was a joint-stock company. The company can be founded either by two natural persons or by one legal entity. The share capital is 25,000 EUR, and it is also guaranteed only by the company’s assets.
To meet the main aim of this paper and to determine which firm-specific features influence earnings management practices, the below methodological steps were followed.
  • The dataset’s discretionary accruals were estimated using the Kasznik model (1999), which improved the Jones model by including the annual change in cash flows as a significant element (see Equation (1)).
    N D A i t A i t 1 = T A i t A i t 1 = α 0 1 A i t 1 + α 1 Δ R E V i t A i t 1 + α 2 P P E i t A i t 1 + α 3 Δ C F O i t A i t 1 + ε i t ,
    where NDAit is the nondiscretionary accrual in a year t, Tait is the total accrual in the year t, Ait−1 is the total assets in the year t − 1, ΔREVit is the annual change of revenues in the year t, PPEit is the long-term tangible assets in a year t, ΔCFOit is the annual change of operating CF in the year t, α0, α1, α2, and α3 are regression coefficients, i is the firm index (i = 1, 2, …, N), t is the period index (t = 1, 2, …, T), and εit is the prediction error.
  • To determine if the mean values of discretionary accruals were different from zero, a sample t-test was performed annually. A hallmark of neutral accounting practice is when the mean value of discretionary accruals is equal to zero. A positive value of discretionary accruals, on the other hand, represents aggressive earnings management activity, while a negative value describes conservative accounting operations.
  • The dataset was examined using correspondence analysis. Its principle consists of the creation of a contingency table, while the data used can also be displayed in a graph or a correspondence map. In our case, a two-factor contingency table was used. Only one variable from each of the following factors was compared in a contingency table: the firm size, sectoral classification (NACE classification), or the legal form of the business. The second factor was the level of discretionary accruals of businesses in the analyzed periods. To measure the association between factors, a dependency between the given variables was tested using Pearson’s chi-square test (at a significance level of 0.05). The following hypotheses were established:
    H20: 
    There is no statistically significant relationship between the given variables (discretionary accrual category and a company descriptive factor).
    H21: 
    There is a statistically significant dependency between the given variables.
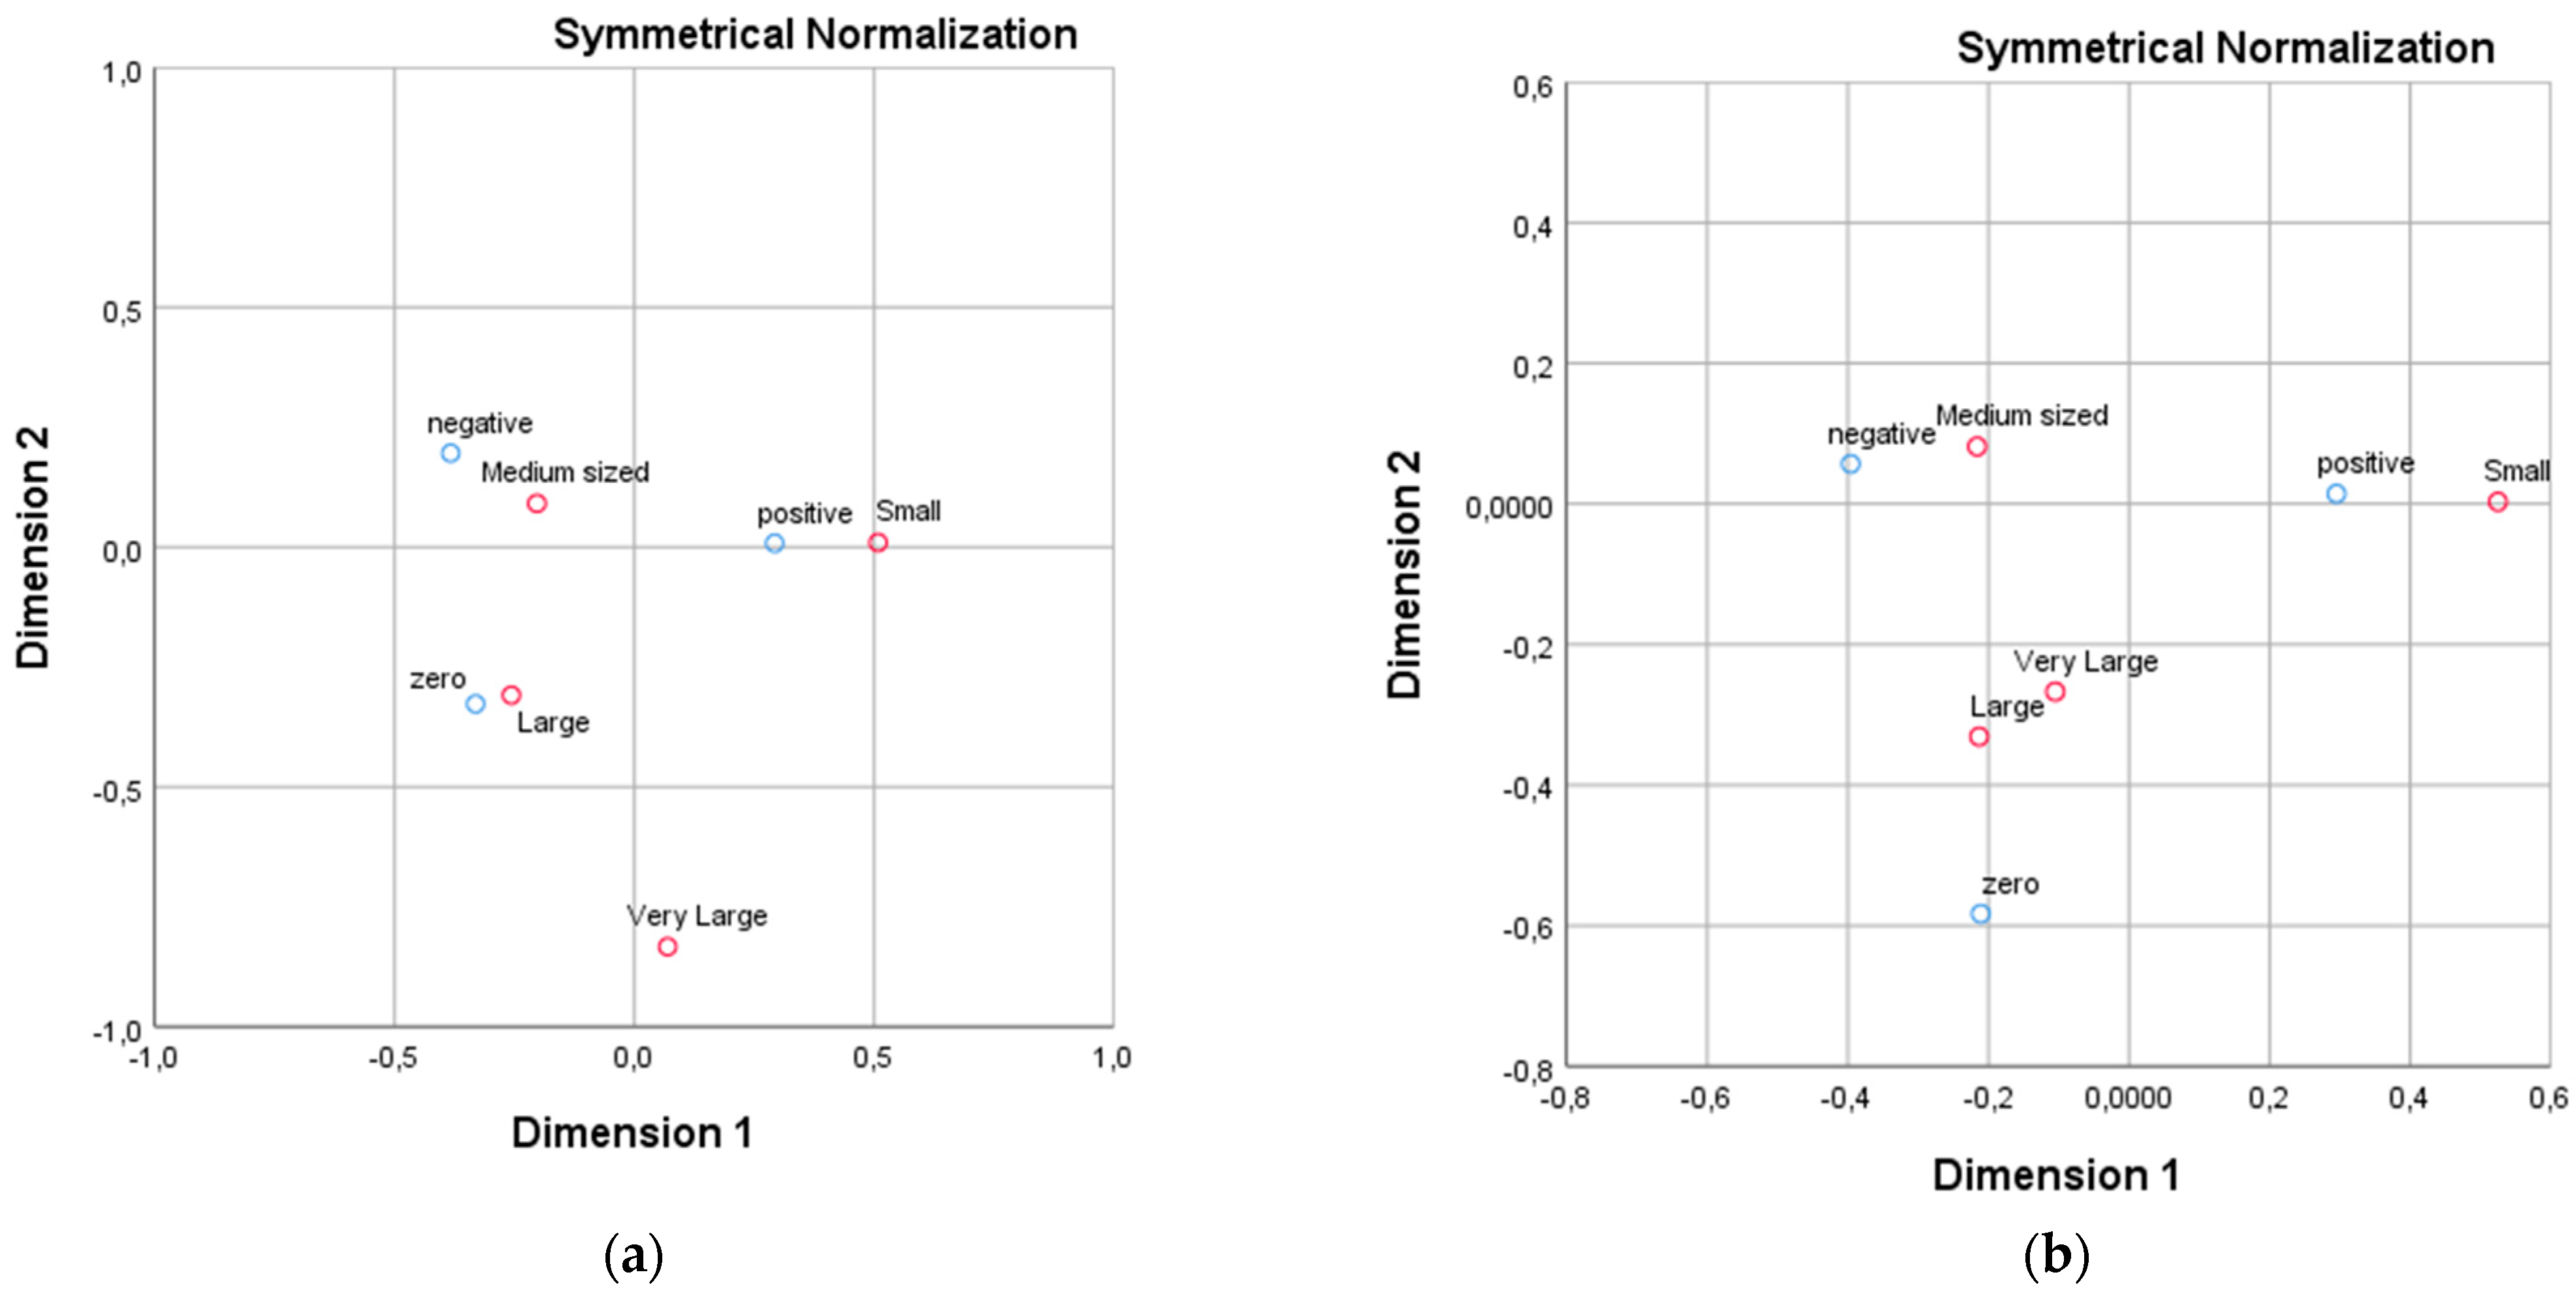
  • If the alternative hypothesis H1 was accepted, the associations between the categories of the variables could be investigated by transforming the results from the contingency table into a correspondence map using points. The points in the correspondence map represent the relative frequencies of the contingency table. The position of the points indicates the similarity between the individual row and column categories and, at the same time, the mutual relationship between them. To display the individual points on the map, it is necessary to determine a measure that would correspond to how well the points are drawn on the correspondence map. The degree of variability is reflected by the total inertia. In general, a closer value of the total inertia to 1 indicates a higher quality of the created correspondence map and a higher explanatory power (Greenacre 2017). All correspondence maps were created using the chi-square distance measure.

4. Results and Discussion

First, it was tested whether the company size factor affected the discretionary accrual in the period 2017–2019. After developing the contingency table, the null hypothesis H0 was rejected on the basis of the Pearson chi-square test. It follows that there was a statistically significant dependence between the size of the company and the value of the discretionary accrual (Table 2).
As the alternative hypothesis was confirmed, the data from the pivot table could be displayed in a correspondence map (Figure 1a,b). The value of total inertia for all categories of variables was equal to 1; therefore, the correspondence map could be evaluated.
Small businesses tended to have a positive discretionary accrual in both periods, linked to an aggressive form of earnings management. This is because, if they are asking for funds, it is more advantageous for them to look more profitable (Durana et al. 2021b).
Medium-sized enterprises resorted to reducing the value of discretionary accruals (conservative earnings management), which confirms the outputs of Sanchez-Ballesta and Yagua (2022), and Bansal (2021). This practice is used to avoid tax obligations and get certain allowances (Svabova et al. 2020a). Large businesses have no need to handle discretionary accruals (see also the finding of Wuryani 2012). Their values were not significantly different from zero. As can be seen in the figures, the same groupings were determined in both periods; hence, the assumptions about the manipulation of the discretionary accrual upward and downward based on firm size were revealed. The importance of firm size as a determinant of earnings manipulation was confirmed by Shaoib and Siddiqui (2022), who found patterns in the relationship between corporate performance and capital structure. Garfatta (2021) used a modified Jones model to reveal earnings management practices in Saudi Arabian companies and marked corporate performance, firm size, financial leverage, and ownership as crucial control variables. However, contrary to these findings, Husanuddin et al. (2021) explained that, in Indonesian conditions, the firm size and leverage ratio do not contribute to earnings quality, but liquidity plays an important role. The same results were explained by Salah (2018), declaring that firm size is not a moderating factor of earnings manipulation.
As a part of determining the dependence between industries (sectoral NACE classification of enterprises) and discretionary accruals, in both periods, the results of the Pearson´s chi-square test were at the level of 0.000, indicating acceptance of the alternative hypothesis H1, i.e., the analyzed variables were dependent (Table 3).
The relationships among the individual categories of variables are portrayed in the correspondence map (Figure 2a,b); its informative value was verified on the basis of the total inertia. In this case, it was equal to one for all categories of both variables. According to the correspondence map, the industries most prone to manipulation or non-manipulation of financial statements could be identified.
In the first period, positive discretionary accruals were reported in the sectors R (art, entertainment, and recreation) and M (professional, scientific, and technical activities). By improving reports, companies try to attract business partners or competitors to the industry (Gregova et al. 2021) or present themselves in a positive light in relation to business partners (Svabova et al. 2020b; Michalkova et al. 2021). Zero discretionary accrual manipulations were observed primarily in the following sectors: E (water supply; sewerage; waste management and remediation activities), C (manufacturing), and B (mining and quarrying). All these industries are to some extent connected with the provision of public services, and there is a constant interest in these activities. It is surprising to find that the sector O (public administration and defense; compulsory social security) was closer to the negative than the zero value of discretionary accruals. Companies operating in the sectors J (information and communication) and F (construction) manipulated the most in the negative direction. For the J sector, the claim behind the reduction of discretionary accruals may be that, if these enterprises show negative values within the business, the state should support them (Siekelova et al. 2020; Kovacova et al. 2022). In sector F (construction), by managing the values of crucial financial indicators, they can try to get certain tax or other allowances. Mapping the situation in the second period, the largest movements in a positive direction were recorded in the sectors R and M; the same behavior was also detected in the previous period. Minimal to zero changes within the discretionary accrual were observed in sector K (financial and insurance activities). Thus, the summary of the monitored periods is as follows: the only industries tending to the positive manipulation of discretionary accruals were the same in both periods. Within the framework of zero discretionary accrual, the number of industries not only decreased but also changed completely. In the first period, this category included sectors E and C (later described by negative discretionary accruals). Sector B, also marked by zero discretionary accrual in the first period, moved toward manipulative behavior. Within the framework of negative discretionary accruals, this kind of manipulation was typical of sector J in both periods. Goel and Kapoor (2021) used panel data to examine the importance of sector classification in the context of earnings management behavior. The study demonstrated that the relative structure of the industry has a significant impact on how much earnings management is practiced by enterprises. Earnings management practices take different forms in the context of the market economy, country specificities, and business sector, and these effects must be considered by policymakers and stakeholders (Mutuc et al. 2019; Gavana et al. 2022).
Lastly, the last firm factor was analyzed, i.e., the legal form of Slovak enterprises, and the association among the categories of variables was investigated. As in the previous cases, the dependence among variables was tested using Pearson’s chi-square test (Table 4). The results indicate that there was a statistically significant dependence between firm size and discretionary accruals.
As the main purpose was to reveal the bonds among the categories of variables, these parameters were used again as input data in the correspondence analysis. The total inertia of all categories was 1, which means that the correspondence map, using the chi-square distance measure, could thoroughly describe the associations (Figure 3a,b).
In both periods, aggressive earnings management practices (positive discretionary accrual) were demonstrated by companies with the legal form of public limited company. The motive may be to attract new shareholders on the basis of successful financial results (Kliestik et al. 2022). However, a different situation was seen with private limited companies, as the results of the analysis indicated negative discretionary accruals and, so hence, earnings manipulation. No changes and, thus, zero discretionary accrual were found for partnerships, where at least one business partner is liable for the firm’s debts. Different studies pointed to the importance of the ownership structure in the context of earnings management (e.g., Mardly et al. 2021; Valaskova et al. 2021; Saona et al. 2020; Dong et al. 2020, etc.).

Overall Assessment

In the case of a positive discretionary accrual, enterprises tend to use their reserves, which causes an overestimation of profit, which can be described as aggressive behavior. In the period of 2017/2018, positive discretionary accruals were observed in connection with small enterprises, enterprises falling into NACE category R or M according to SK NACE, and public limited companies. Among all enterprises, 8697 enterprises showed a positive discretionary accrual, representing 55.34% of the total. Compared to the previous period, in 2018/2019, all variable categories remained the same, but the total number of enterprises showing a positive discretionary accrual increased by 1.02% to 8786 enterprises. Reporting zero discretionary accruals means that the values of discretionary accruals are not significantly different from zero, and there is no proof of earnings management practices. According to the results of the correspondence analysis, it can be stated that only 17.59% of enterprises did not manipulate their earnings in the first period with the highest representation of large enterprises and those business units operating in sector B. In the second period, only 816 companies showed zero discretionary accrual, which was a decrease of 70.49% compared to the previous period (mostly large enterprises and those operating in sector K). The last option is the report of a negative discretionary accrual when enterprises can, for example, overestimate costs, which causes an underestimated profit (conservative accounting practices). In the 2017/2018 period, the conditions were as follows: negative discretionary accruals were typical of a medium-sized enterprise operating in sectors J or F according to SK NACE, with the legal form of a private limited company. Among all enterprises, 4254 enterprises showed a negative discretionary accrual (62.04% were medium-sized enterprises, and 85.50% were private limited companies). The analysis was also performed for the 2018/2019 period, when 6114 enterprises used this accounting practice. Similarly to the previous period, medium-sized enterprises used conservative accounting practices to the greatest extent (61.71%), as did the business units operating in sectors E and J and with a private limited ownership structure (85.5%).
In order to design measures, it is important to know how many enterprises met all the specified categories in both periods. A total of 298 enterprises met the conditions for positive discretionary accrual. In both periods, 1.90% of companies used aggressive accounting practices. There was not a single company in our sample that met the specified conditions of neutral accounting practices (described by zero discretionary accruals) in both years. In the observed 3 year period, 139 enterprises reported negative discretionary accruals and the fulfillment of other conditions. As the analyzed dataset is robust, our results are quite accurate and reliable in the given conditions. According to the results of the correspondence analysis, stakeholders who are interested in entering into any relationship with the company are recommended to request corporate financial statements to check the performance (Durana et al. 2022b). It is necessary to focus on the values of discretionary accruals. If the company shows extreme values of discretionary accruals in several consecutive periods, it does not matter whether they are positive or negative, as long as they are the same in the periods (only positive or only negative), it is appropriate to find out if these values are caused by the real situation between the company and the market or if the company modified these data for various reasons (Papik and Papikova 2020). Increased attention should also be paid if the company meets several established categories for individual values of discretionary accruals. Our results affirmed that private limited companies have the greatest tendency to use earnings management practices, which is consistent with other international studies (Che and Langli 2015; Haga et al. 2015; O’Callaghan et al. 2018 or Borralho et al. 2020).
However, as indicated in several studies (e.g., Wijayanti and Irwandi 2014; Mendes et al. 2012; or Goel and Kapoor 2021), the sector in which an enterprise operates influences its earnings management behavior. Table 5 shows the ratio of enterprises in each sector and their manipulative practices; each period is discussed individually.
Firstly, we focused on the period of 2017–2018, when slightly over 82% of enterprises reported discretionary accruals different from zero, indicating the use of earnings management. Specifically, 27.07% of enterprises had a negative value of discretionary accrual, which means that they artificially reduced the value of the achieved profit. The largest manipulations were observed in sector H, up to 50.38%. This industry includes passenger transport and postal services enterprises; hence, they could resort to reducing profits in order to obtain financial support from the state, as they provide services to the citizens of Slovakia. On the contrary, the smallest inclinations toward negative profit manipulation were in sector L. Only 17.59% of business entities had zero discretionary accrual or discretionary accrual with values that were not significantly different from zero. The highest value was observed in sector K (financial and insurance activities—30.43%). On the other hand, the lowest values were in sector P. This means that, of all sectors, this sector had the greatest tendency for earnings manipulation as only 8.77% of the companies did not manipulate their reports. Income-increasing activities, measured by positive discretionary accrual, were typical for 55.34% of all business units in the sample. Sector L (77.55%) tried the hardest to increase profits to look more competitive and creditworthy for their business partners, shareholders, or financial institutions (Gashi Ahmeti and Fetai 2021; Paun and Pinzaru 2021). The lowest occurrence of this accounting practice could be found in sector H, confirming the assumption that these enterprises would rather reduce their profits in order to achieve certain concessions and be supported by the state grants.
Table 6 summarizes the situation in the second period, where almost 95% of enterprises recorded signs of earnings manipulation in the context of the calculated discretionary accrual.
The highest and lowest values of negative and positive discretionary accrual were observed for the same industries as in the previous period. However, the total number of enterprises increased in both cases to the level of 38.90% for negative discretionary accrual and 55.90% for positive discretionary accrual. Furthermore, 5.19% of the dataset belonged to the group of enterprises with zero discretionary accruals, which was a significant decrease compared to the previous period.
In this period, there was an increase in the number of companies that manipulate their statements, which caused a decrease in the number of companies with no manipulation. Analyzing the enterprises with negative discretionary accrual, the highest increase in the number of enterprises was observed in sector E by 21.43% as a consequence of various projects and provided to enterprises by the state authorities. On the contrary, the smallest increase was observed in sector L (by 4.48%). Within a positive discretionary accrual, the biggest increase occurred in sector B, and the highest decrease occurred in enterprises from NACE sector P. Considering the development of enterprises with neutral accounting practices, there was no significant increase in this group over the years. The largest decrease was observed in sector B, where the increase in positive discretionary accruals was confirmed. This is a logical conclusion given that each sector has some distinctive traits and specifications, employing various manipulation tactics or approaches, and our investigation showed that certain economic sectors have aggressive or conservative practices that are unique to them.
On the basis of the analyses, it was confirmed that there is a dependence of whether a company uses earnings management practices on firm-specific features (firm size, legal form, and also sectoral classification by NACE). It was then possible to clearly determine the key determinants of earnings management in Slovak enterprises. Thus, for business partners and stakeholders, it is important to focus on the data of a longer timeseries, not exclusively 1 year, as well as examine not only the corporate financial statements but also the overall performance of the company to prevent unpleasant situations and financial risks that may arise in the future due to distorted financial data reporting.

5. Conclusions

As reported profits are significant in financial statements, there has long been a strong interest in earnings management in the accounting literature. It serves as a crucial indicator for the accuracy and quality of financial information that enterprises provide to stakeholders and society. Different industry sectors and ownership frameworks of enterprises employ various strategies for earning manipulation.
This study’s purpose was to discover the firm-specific factors that influence how companies manage their earnings using a sample of Slovak companies from a variety of economic sectors. The Kasznik approach of discretionary accruals was applied to reveal the degree of earnings management. The methodology of correspondence analysis using the chi-square distance metric was applied to determine the relationship between the firm-specific characteristics and the earnings management techniques. The study’s findings show that small businesses with a public limited ownership structure, particularly those in the sectors of professional, scientific, and technical activities and of arts, entertainment, and recreation, frequently provide aggressive (income-increasing) earnings management strategies. Enterprises in the sectors of information and communication or of construction are known to utilize conservative (income-decreasing) strategies, as are medium-sized businesses and those with a private limited ownership structure. The findings confirmed that large businesses and those operating in the sector of financial and insurance activities do not often alter their earnings. The findings of this study may offer significant and practical information to regulators and shareholders in assessing factors that may effectively reduce the usage of earnings management strategies. The study’s originality and implication can be revealed in the fact that it mapped the situation in Slovak conditions, where the earnings management phenomenon has not yet been sufficiently explored on a robust sample of enterprises, thus making it possible to investigate earnings management techniques in depth and eliminate the risk that all parties concerned have to face.
Despite the fact that the study was only confined to one nation and to a certain era, which is perceived as a limitation, the analysis outputs reveal intriguing conclusions that match those of previous studies published worldwide. However, because of distinct economic, political, and social patterns, as well as special legislative and regulatory norms applied to national environments, research focused on a given country is more fruitful in mapping earnings management issues. Additionally, the time horizon is a significant factor since macroeconomic changes backed by state and federal actions during certain economic cycles affect the market’s overall growth and, consequently, how businesses behave. The research of how businesses managed their earnings during and after the COVID-19 pandemic is an outstanding task. Future studies will use panel data analysis, which can permit many observations on each sampling unit, and sophisticated statistical approaches to overcome the study’s geographical and temporal constraints. Other significant factors, such as the size of the board, the amount of debt, the corporate life cycle, or the accounting standards adopted by enterprises, might also develop the firm-specific characteristics examined in this study. The significance of the detected differences may be useful for authorities, regulators, analysts, and auditors in recognizing different tactics and practices of earnings manipulation that may vary across industries depending on their regular features.

Author Contributions

Conceptualization, K.V. and D.G.; methodology, P.D.; software, K.V.; validation, D.G., K.V. and P.D.; formal analysis, D.G.; investigation, P.D.; resources, K.V.; data curation, D.G. and K.V.; writing—original draft preparation, D.G., K.V. and P.D.; writing—review and editing, D.G., K.V. and P.D.; visualization, D.G.; supervision, K.V.; project administration, P.D.; funding acquisition, K.V. All authors have read and agreed to the published version of the manuscript.

Funding

This research was financially supported by the Slovak Research and Development Agency—VEGA 1/0121/20: Research of transfer pricing system as a tool to measure the performance of national and multinational companies in the context of earnings management in conditions of the Slovak Republic and V4 countries.

Data Availability Statement

The data presented in this study are available on request from the corresponding author.

Conflicts of Interest

The authors declare no conflict of interest.

References

  1. Ajina, Aymen, Mhamed Laouiti, and Badreddine Msolli. 2016. Guiding through the fog: Does annual report readability reveal earnings management? Research in International Business and Finance 38: 509–51. [Google Scholar] [CrossRef]
  2. Alareeni, Bahaaeddin. 2018. The impact of firm-specific characteristics on earnings management: Evidence from GCC countries. International Journal of Managerial and Financial Accounting 10: 85–104. [Google Scholar] [CrossRef]
  3. Aldahab, Mohammad, Modar Abdullatif, and Israa Mansour. 2020. Related party transactions and earnings management in Jordan: The role of ownership structure. Journal of Financial Reporting and Accounting 18: 505–31. [Google Scholar] [CrossRef]
  4. Al-Duais, Shaker Dahan, Mazrah Malek, Mohammad Abdul Hamid, and Amal Mohammed Almasawa. 2022. Ownership structure and real earnings management: Evidence from an emerging market. Journal of Accounting in Emerging Economies 12: 380–404. [Google Scholar] [CrossRef]
  5. Alhadab, Mohammad, and Bassam Eshiwi Al-Own. 2019. Earnings management and equity incentives: Evidence from the European banking industry. International Journal of Accounting and Information Management 27: 244–61. [Google Scholar] [CrossRef]
  6. Baatwah, Saeed Rabea, Waddah Kamal Omer, and Khaled Salmen Aljaaidi. 2021. Outsourced internal audit function and real earnings management: The role of industry and firm expertise of external providers. International Journal of Auditing 25: 206–32. [Google Scholar] [CrossRef]
  7. Bansal, Manish. 2021. Influence of firm size and firm age on classification shifting: An empirical study on listed firms in India. Journal of Financial Reporting and Accounting 19: 772–92. [Google Scholar] [CrossRef]
  8. Bassiouny, Sara, Mohamed Moustafa Soliman, and Aiman Ragab. 2016. The impact of firm characteristics on earnings management: An empirical study on the listed firms in Egypt. The Business and Management Review 7: 91–101. [Google Scholar]
  9. Beslic, Ivan, Dragana Beslic, Deajn Jaksic, and Mirko Andric. 2015. The Detection of Earnings Management of the Companies in the Industrial Sector of the Republic of Serbia. Industrija 43: 55–79. [Google Scholar] [CrossRef]
  10. Bever, Anne, Ilan Guttman, and Ivan Martinovic. 2019. Earnings management and earnings quality: Theory and Evidence. The Accounting Review 94: 77–101. [Google Scholar]
  11. Borralho, Joao Miguel, Dolores Gallardo Vazquez, and Remedios Hernandez-Linares. 2020. Earnings management in private family versus non-family firms. The moderating effect of family business generation. Spanish Journal of Finance and Accounting 49: 210–33. [Google Scholar] [CrossRef]
  12. Burgstahler, David, Luzi Hail, and Christian Leuz. 2006. The importance of reporting incentives: Earnings management in European private and public firms. Accounting Review 81: 983–1016. [Google Scholar] [CrossRef]
  13. Carp, Mihai, and Iuliana Georgescu. 2015. Study on the factors that influence the degree of management of the financial earnings reported by BSE-quoted companies. In Innovation Vision 2020: From Regional Development Sustainability to Global Economic Growth. Edited by Khalid S. Soliman. Norristown: International Business Information Management Association, pp. 2146–58. [Google Scholar]
  14. Che, Limei, and John Christian Langli. 2015. Governance structure and firm performance in private family firms. Journal of Business Finance & Accounting 42: 1216–50. [Google Scholar]
  15. Chen, Changling, AlanGuoming Huang, and Ranjini Jha. 2012. Idiosyncratic return volatility and the information quality underlying managerial decision. Journal of Financial and Quantitative Analysis 47: 873–89. [Google Scholar] [CrossRef]
  16. Chen, Haiwei, Surendranath Jory, and Thanh Ngo. 2020. Earnings management under different ownership and corporate governance structure: A natural experiment with master limited partnerships. Quarterly Review of Economics and Finance 76: 139–56. [Google Scholar] [CrossRef]
  17. Costa, Rui Augusto, and Jorge Mota. 2021. Earnings management in hospitality firms: Evidence from Portugal. Tourism 69: 578–94. [Google Scholar] [CrossRef]
  18. Cudia, Cynthia, Aeason L. Dela Cruz, and Naddeleine B. Estabillo. 2021. Effect of firm characteristics and corporate governance practices in earnings management: Evidence from publicly listed property sector firm in the Philippines. Vision-The Journal of Business Perspective 25: 77–87. [Google Scholar] [CrossRef]
  19. Das, Ramesh Chandra, Chandra Sekhar Mishra, and Prabina Rajib. 2018. Firm-specific parameters and earnings management: A study in the Indian context. Global Business Review 19: 1240–60. [Google Scholar] [CrossRef]
  20. Dechow, Patricia, and Ilia Dichev. 2002. The Quality of Accruals and Earnings: The Role of Accrual Estimation Errors. The Accounting Review 77: 35–59. [Google Scholar] [CrossRef]
  21. Dong, Nanyan, Fangjun Wang, Junrui Zhang, and Jian Zhou. 2020. Ownership structure and real earnings management: Evidence from China. Journal of Accounting and Public Policy 39: 106733. [Google Scholar] [CrossRef]
  22. Durana, Pavol, Katarina Valaskova, Anna Siekelova, and Lucia Michalova. 2022a. Appraisal of earnings management across the sectors. Journal of Business Economics and Management 23: 399–425. [Google Scholar] [CrossRef]
  23. Durana, Pavol, Lucia Michalkova, Andrej Privara, Josef Marousek, and Milos Tumpach. 2021a. Does the life cycle affect earnings management and bankruptcy? Oeconomia Copernicana 12: 425–61. [Google Scholar] [CrossRef]
  24. Durana, Pavol, Roman Blazek, Veronika Machova, and Miroslav Krasnan. 2022b. The use of Beneish M-scores to reveal creative accounting: Evidence from Slovakia. Equilibrium-Quarterly Journal of Economics and Economic Policy 17: 481–510. [Google Scholar] [CrossRef]
  25. Durana, Pavol, Romualdas Ginevicius, Mariusz Urbanski, Ivana Podhorska, and Milos Tumpach. 2021b. Parallels and Differences in Earnings Management of the Visegrad Four and the Baltics. Journal of Competitiveness 13: 39–55. [Google Scholar] [CrossRef]
  26. Enomoto, Masahiro, Fumihiko Kimura, and Tomoyasu Yamaguchi. 2018. A cross-country study on the relationship between financial development and earnings management. Journal of International Financial Management Accounting 29: 166–94. [Google Scholar] [CrossRef]
  27. Garfatta, Riadh. 2021. Corporate social responsibility and earnings management: Evidence from Saudi Arabia after mandatory IFRS adoption. Journal of Asian Finance Economics and Business 8: 189–99. [Google Scholar]
  28. Gashi Ahmeti, Hana, and Besnik Fetai. 2021. Determinants of Financing Obstacles of SMEs in Western Balkans. Management Dynamics in the Knowledge Economy 9: 331–44. [Google Scholar]
  29. Gavana, Giovanna, Pietro Gottardo, and Anna Maria Moisello. 2022. Related party transactions and earnings management: The moderating effect of ESG performance. Sustainability 14: 5823. [Google Scholar] [CrossRef]
  30. Githaiga, Peter Nderitu, Paul Muturi Kabete, and Tirisa Caroline Bonareri. 2022. Board characteristics and earnings management. Does firm size matter? Cogent Business & Management 9: 2088573. [Google Scholar]
  31. Goel, Sandeep, and Nimish Kapoor. 2021. Is earnings management related to board independence and gender diversity? Sector-wise evidence from India. International Journal of Disclosure and Governance, early access. [Google Scholar]
  32. Goncalves, Tiago, Victor Barros, and Goncalo Serra. 2022. Political elections uncertainty and earnings management: Does firm size really matter? Economic Letters 214: 110438. [Google Scholar] [CrossRef]
  33. Gonzalez, Jesus Saenz, and Emma Garcia-Meca. 2014. Does Corporate Governance Influence Earnings Management in Latin American Markets? Journal of Business Ethics 121: 419–40. [Google Scholar] [CrossRef]
  34. Greenacre, Michael. 2017. Correspondence Analysis in Practice. New York: Taylor & Francis Group. [Google Scholar]
  35. Gregova, Elena, Lubos Smrcka, Lucia Michalkova, and Lucia Svabova. 2021. Impact of tax benefits and earnings management on capital structures across V4 countries. Acta POlytechnica Hungarica 18: 221–44. [Google Scholar] [CrossRef]
  36. Guluma, Tolossa Fufa. 2021. The impact of corporate governance measures on firm performance: The influences of managerial overconfidence. Future Business Journal 7: 50. [Google Scholar] [CrossRef]
  37. Haga, Jasper, Henrik Hoglund, and Dennis Sundvik. 2015. Real Earnings Management in UK Private and Public Firms. SSRN Electronic Journal, forthcoming. [Google Scholar]
  38. Husanuddin, Rusdiah, Darman Darman, Muhammad Ybnu Taufan, Agus Salim, Muslim Muslim, and Aditya Halim Perdana Kusuma Putra. 2021. The effect of firm size, debt, current ratio, and investment opportunity set on earnings quality: An empirical study in Indonesia. Journal of Asian Finance Economics and Business 8: 179–188. [Google Scholar]
  39. Hussain, Iqbal Hafezali, Sebastian Kot, Fakarudin Kamarudin, and Wong Che Mun. 2020. The nexus of competition freedom and the efficiency of microfinance institutions. Journal of Competitiveness 12: 67–89. [Google Scholar] [CrossRef]
  40. Jeter, Debra, and Lakshmanan Shivakumar. 1999. Cross-sectional estimation of abnormal accruals using quarterly and annual data: Effectiveness in detecting event-specific earnings management. Accounting and Business Research 29: 299–319. [Google Scholar] [CrossRef]
  41. Jones, Jennifer. 1991. Earnings management during import relief investigations. Journal of Accounting Research 29: 193–228. [Google Scholar] [CrossRef]
  42. Kaldonski, Michal, Tomasz Jewartowski, and Jacek Mizerka. 2020. Capital market pressure, real earnings management, and institutional ownership stability—Evidence from Poland. International Review of Financial Analysis 71: 101315. [Google Scholar] [CrossRef]
  43. Kasznik, Ron. 1999. On the association between voluntary disclosure and earnings management. Journal of Accounting Research 37: 57–81. [Google Scholar] [CrossRef]
  44. Key, S. 1999. Toward a new theory of the firm: A critique of stakeholder theory. Management Decision 37: 317–28. [Google Scholar] [CrossRef]
  45. Kliestik, Tomas, Alena Novak Sedlackova, Martin Bugaj, and Andrej Novak. 2022. Stability of profits and earnings management in the transport sector of Visegrad countries. Oeconomia Copernicana 13: 475–509. [Google Scholar] [CrossRef]
  46. Kliestik, Tomas, Jaroslav Belas, Katarina Valaskova, Elvira Nica, and Pavol Durana. 2021. Earnings management in V4 countries: The evidence of earnings smoothing and inflating. Economic Research–Ekonomska Istrazivanja 34: 1452–70. [Google Scholar] [CrossRef]
  47. Kovacova, Maria, Vladimir Krajcik, Lucia Michalkova, and Roman Blazek. 2022. Valuing the interest tax shield in the Central European economies: Panel data approach. Journal of Competitiveness 14: 41–59. [Google Scholar] [CrossRef]
  48. Lee, Chia-Hao, and Pei-I Chou. 2020. Industry competition, earnings management and leader-follower effects. Applied Economics 52: 388–99. [Google Scholar] [CrossRef]
  49. Li, Sherry Fang. 2010. Determinants of management’s preferences or an earnings threshold. Review of Accounting and Finance 9: 33–49. [Google Scholar]
  50. Mantone, Pamela. 2013. Using Analytics to Detect Possible Fraud: Tools and Techniques. Hoboken: Wiley, Wiley Corporate F&A. [Google Scholar]
  51. Mardly, Zukaa, Zinab Badran, and Sulaiman Mouselli. 2021. Earnings management and audit quality at Damascus securities exchange: Does managerial ownership matter? Journal of Financial Reporting and Accounting 19: 725–41. [Google Scholar] [CrossRef]
  52. Meek, K. Gary, Ramesh Rao, and Christopher J. Skousen. 2007. Evidence on factors affecting the relationship between CEO stock option compensation and earnings management. Review of Accounting and Finance 6: 304. [Google Scholar] [CrossRef]
  53. Mendes, Araujo, Lima Rodrigues, and Parte Esteban. 2012. Evidence of earnings management using accruals as a measure of accounting discretion. Tékhne–Review of Applied Management Studies 10: 3–14. [Google Scholar] [CrossRef]
  54. Merdani, Mehdi, Naghi Fazeli, and Khosro Faghani Makrani. 2020. Evaluating the role of company life cycle for an appropriate model in predicting the quality of discretionary accruals (abnormal) based on Dickinson cash flow model approach. International Journal of Finance and Managerial Accounting 4: 75–91. [Google Scholar]
  55. Michalkova, Lucia, Vojtech Stehel, Elvira Nica, and Pavol Durana. 2021. Corporate management: Capital structure and tax shields. Marketing and Management of Innovations 3: 276–95. [Google Scholar]
  56. Mutuc, Eugene Burgos, Jen-Sin Lee, and Fu-Sheng Tsai. 2019. Doing good with creative accounting? Linking corporate social responsibility to earnings management in market economy, country and business sector contexts. Sustainability 11: 4568. [Google Scholar] [CrossRef]
  57. Nazir, Mian Sajid, and Talaf Afza. 2018. Does managerial behavior of managing earnings mitigate the rela-tionship between corporate governance and firm value? Evidence from an emerging market. Future Business Journal 4: 139–56. [Google Scholar] [CrossRef]
  58. Ngo, Diem Nhat Phuonng, and Anh Thi Hong Le. 2021. Relationship between the audit committee and earning management in listed companies in Vietnam. Journal of Asian Finance Economics and Business 8: 135–42. [Google Scholar]
  59. Nguyen, Anh Huu, and Chi Thi Duong. 2020. Provincial governance quality and earnings management: Empirical evidence from Vietnam. Journal of Asian Finance Economics and Business 7: 43–52. [Google Scholar] [CrossRef]
  60. Nguyen, Huu Anh, Quynh Lien Le, and Thi Kim Anh Vu. 2021. Ownership structure and earnings management: Empirical evidence from Vietnam. Cogent Business & Management 8: 1908006. [Google Scholar]
  61. O’Callaghan, Steve, John Ashton, and Lynn Hodgkinson. 2018. Earnings management and managerial ownership in private firms. Journal of Applied Accounting Research 19: 648–668. [Google Scholar] [CrossRef]
  62. Papik, Mario, and Lenka Papikova. 2020. Detection models for unintentional financial restatements. Journal of Business Economics and Management 21: 64–86. [Google Scholar] [CrossRef]
  63. Papik, Mario, and Lenka Papikova. 2021. Application of selected data mining techniques in unintentional accounting error detection. Equilibrium-Quarterly Journal of Economics and Economic Policy 16: 185–201. [Google Scholar] [CrossRef]
  64. Parwar, Muhammad Adnan, Shahzad Hussain, Abdul Waheed, Qaisar Ali Malik, and Muddasir Mehboob. 2021. Institutional ownership heterogeneity and earnings management practices: Empirical evidence from Pakistan. Journal of Asian Finance Economics and Business 8: 267–75. [Google Scholar]
  65. Paun, Tatiana, and Florina Pinzaru. 2021. Advancing Strategic Management through Sustainable Finance. Management Dynamics in the Knowledge Economy 9: 279–91. [Google Scholar]
  66. Perafan-Pena, Hector Fabio, Belen Gill-De-Albornoz, and Begona Giner. 2022. Earnings management of target firms and deal premiums: The role of industry relatedness. British Accounting Review 54: 101038. [Google Scholar] [CrossRef]
  67. Piosik, Andrzej, and Ewa Genge. 2020. The influence of a company´s ownership structure on upward real earnings management. Sustainability 12: 152. [Google Scholar] [CrossRef]
  68. Poradova, Monika, and Anna Siekelova. 2020. Analysis of factors with impact on earnings and their management in commercial companies. In International Scientific Conference on Hradec Economic Days. Edited by Pavel Jedlicka, Petra Maresova, Krysztof Firlej and Ivan Soukal. Hradec Kralove: University of Hradec Kralove, pp. 649–65. [Google Scholar]
  69. Postula, Marta, and Konrad Raczkowski. 2020. The impact of public finance management on sustainable development and competitiveness in EU Member States. Journal of Competitiveness 12: 125–44. [Google Scholar] [CrossRef]
  70. Salah, Wafaa. 2018. The effect of firm characteristics on earnings quality: The moderating role of firm size. Paper presented at International Conference of Industrial and Service Organizations Management, Hurghada, Egypt, September 1–3. [Google Scholar]
  71. Salehi, Mahdi, and Mahmoud Lari Dashtbayaz. 2020. The mediating effect of audit quality on the relationship between earnings and earnings valuation in Iran. Ekonomski Vjesnik 33: 25–38. [Google Scholar]
  72. Sanchez-Ballesta, Juan Pedro, and Jose Yagua. 2022. Social capital and earnings management in small and medium firms. Accounting Forum 46: 191–214. [Google Scholar] [CrossRef]
  73. Saona, Paolo, and Laura Muro. 2018. Firm- and country- level attributes as determinants of earnings management: An analysis for Latin American firms. Emerging Markets Finance and Trade 54: 2736–64. [Google Scholar] [CrossRef]
  74. Saona, Paolo, Laura Muro, and Maria Alvardo. 2020. How do the ownership structure and board of directors’ features impact earnings management? The Spanish case. Journal of International Financial Management & Accounting 31: 98–133. [Google Scholar]
  75. Setyoputri, Lusi Shintia, and Agus Widodo Mardijuwono. 2020. The impact of firm attributes on earnings management. Polish Journal of Management Studies 22: 502–12. [Google Scholar] [CrossRef]
  76. Shaoib, Adnan, and Muhammad Ayub Siddiqui. 2022. Earnings management and theoretical adjustment in capital structure performance pattern: Evidence from APTA economies. Borsa Istanbul Review 22: 20–36. [Google Scholar] [CrossRef]
  77. Shoaib, Adnan, Muhammad Ayub Siddiqui, and Muhammad Bilal Saeed. 2021. Leverage, firm fundamentals and earnings management under nonlinear assumptions: Evidences from APTA economies. Singapore Economic Review 9: 1–30. [Google Scholar] [CrossRef]
  78. Siekelova, Anna, Armenia Androniceanu, Pavol Durana, and Katarina Frajtova Michalikova. 2020. Earnings management (EM), initiatives and company size: An empirical study. Acta Polytechnica Hungarica 17: 41–56. [Google Scholar] [CrossRef]
  79. Siekelova, Anna, Jaroslav Belas, Ivana Podhorska, and Pavol Durana. 2021. Accrual-based earnings management: A Case study in V4 focusing on mining and quarrying sector. Acta Montanastica Slovaca 26: 70–83. [Google Scholar]
  80. Sloan, Richard G. 1996. Do Stock Prices Fully Reflect Information in Accruals and Cash Flows about Future Earnings? The Accounting Review 71: 289–315. [Google Scholar]
  81. Slovak Business Agency. 2021. Atlas MSP na Slovensku. Mapovanie vývoja MSP v priestore a čase. Available online: http://www.sbagency.sk/sites/default/files/atlas-msp.pdf (accessed on 8 July 2022).
  82. Souza, Joao Antonio Slavador, Wando Bellffi Costa, Jose Elias Feres Almeida, and Patricia Maria Bortolon. 2013. Determinants and consequences of delisting in earnings management. Revista Evidenciacao Contabil & Financas 1: 38–57. [Google Scholar]
  83. Sun, Wang, and Jiang Sun. 2008. Analysis on Factors Influencing Managers’ Earnings Management Intentions. In Logistic research and practice in China. Edited by Henry Zhang and Ruimei Zhao. Marrickville: Orient Academic Forum. [Google Scholar]
  84. Supardi, Supradi, and Eka Noor Asmara. 2018. Financial factors, corporate governance and earnings management: Evidence from Indonesian manufacturing industry. In Proceedings of the 1st International Conference on Economics, Business, Entrepreneurship, and Finance. Edited by Ade Gafar Abdullah, Meta Arief, Chairul Furqon, Vanessa Gaffar, Heni Mulyani, Yana Setiawan and Alfira Sofia. Paris: Atlantis Press, pp. 727–36. [Google Scholar]
  85. Susanto, Yulius Kurnia, Kashan Pirzada, and Sheryl Adrianne. 2019. Is tax aggressiveness an indicator of earnings management? Polish Journal of Management Studies 20: 516–27. [Google Scholar] [CrossRef]
  86. Svabova, Lucia, Katarina Kramarova, Jan Chutka, and Lenka Strakova. 2020a. Detecting earnings manipulation and fraudulent financial reporting in Slovakia. Oeconomia Copernicana 11: 485–508. [Google Scholar] [CrossRef]
  87. Svabova, Lucia, Katarina Valaskova, Pavol Durana, and Tomas Kliestik. 2020b. Dependency analysis between various profit measures and corporate total assets for Visegrad Group’s business entities. Organizacija 53: 80–90. [Google Scholar] [CrossRef]
  88. Teoh, Siew Hong, Ivo Welch, and T. J. Wong. 1998. Earnings management and the long-run market performance of initial public offerings. The Journal of Finance 53: 1935–74. [Google Scholar] [CrossRef]
  89. Thanh, Su, Nguyen Canh, and Nguyen Tran Thai Ha. 2020. Debt structure and earnings management: A non-linear analysis from an emerging economy. Finance Research Letters 35: 101283. [Google Scholar] [CrossRef]
  90. Thoppan, Jose Joy, Robert Nathan, and Vijay Victor. 2021. Impact of improved corporate governance and regulations on earnings management practices—Analysis of 7 industries from the Indian National Stock Exchange. Journal of Risk and Financial Management 14: 454. [Google Scholar] [CrossRef]
  91. Tran, Manh Dung, and Ngoc Hung Dang. 2021. The Impact of Ownership Structure on Earnings Management: The Case of Vietnam. Sage Open 11: 21582440211047248. [Google Scholar] [CrossRef]
  92. Valaskova, Katarina, Peter Adamko, Katarina Frajtova Michalikova, and Jaroslav Macek. 2021. Quo Vadis, earnings management? Analysis of manipulation determinants in Central European environment. Oeconomia Copernicana 12: 631–69. [Google Scholar] [CrossRef]
  93. Veronica, Sylvia, and Yanici Bachtiar. 2005. Corporate governance, information asymmetry, and earnings management. Jurnal Akuntansi dan Keuangan Indonesia 2: 77–106. [Google Scholar] [CrossRef]
  94. Wasan, Pratibha, and Kalyani Mulchandani. 2020. Corporate governance factors as predictors of earnings management. Journal of General Management 45: 71–92. [Google Scholar] [CrossRef]
  95. Wijayanti, Herlina, and Soni Agus Irwandi. 2014. The effect of real earnings management through operating cashflow approach on company performance. The Indonesian Accounting Review 4: 43–52. [Google Scholar]
  96. Wuryani, Eni. 2012. Company size in response to earnings management and company performance. Journal of Economics, Business, and Accountancy Ventura 15: 491–506. [Google Scholar] [CrossRef]
  97. Yasser, Qaiset Rafique, and Abdulah Al Mamun. 2017. The impact of ownership concentration on firm performance: Evidence from an emerging market. Emerging Economy Studies 3: 34–53. [Google Scholar] [CrossRef]
  98. Zainuldin, Mohd Haniff, and Tze Kiat Lui. 2020. Earnings management in financial institutions: A comparative study of Islamic banks and conventional banks in emerging markets. Pacific-Basin Finance Journal 62: 101044. [Google Scholar] [CrossRef]
  99. Zhong, Xi, Liuyang Ren, and XiaoJie Wu. 2022. Founder domination, industry environment, and family firms’ earnings management. Baltic Journal of Management, early access. [Google Scholar]
Figure 1. Correspondence map: (a) 2017/2018; (b) 2018/2019.
Jrfm 15 00426 g001
Figure 2. Correspondence map: (a) 2017/2018; (b) 2018/2019.
Jrfm 15 00426 g002
Figure 3. Correspondence map: (a) 2017/2018; (b) 2018/2019.
Jrfm 15 00426 g003
Table 1. Firm specific characteristics of the sample.
CountrySK
Legal form and ownership structure%
Private limited companies82.14
Public limited companies13.57
Partnerships4.12
Other legal forms0.17
Firm size%
Small32.0
Medium-sized55.0
Large12.0
Very large1.00
Economic sector (NACE classification)%
A. Agriculture, forestry, and fishing6.54
B. Mining and quarrying0.31
C. Manufacturing15.52
D. Electricity, gas, steam, and air conditioning supply1.98
E. Water supply; sewerage, waste management, etc.0.96
F. Construction6.78
G. Wholesale and retail trade, repair of motor vehicles/motorcycles25.68
H. Transportation and storage4.65
I. Accommodation and food service activities2.28
J. Information and communication2.90
K. Financial and insurance activities0.48
L. Real estate activities12.82
M. Professional, scientific, and service activities10.32
N. Administrative and support service activities6.18
O. Public administration and defense; compulsory social security0.04
P. Education0.34
Q. Human health and social work activities0.97
R. Arts, entertainment, and recreation0.93
S. Other service activities0.32
Source: own elaboration.
Table 2. Chi-square test (firm size vs. discretionary accruals).
ValuedfAsymptotic Significance (2-Sided)
Pearson chi-square2017/2018191.18960.000
2018/2019202.61460.000
Likelihood ratio2017/2018192.43260.000
2018/2019204.91760.000
N of valid cases 15,716
Source: own elaboration.
Table 3. Chi-square test (sectoral classification vs. discretionary accruals).
ValuedfAsymptotic Significance (2-Sided)
Pearson chi-square2017/2018835.491360.000
2018/2019752.490360.000
Likelihood ratio2017/2018845.803360.000
2018/2019786.993360.000
N of valid cases 15,716
Source: own elaboration.
Table 4. Chi-square test (legal form vs. discretionary accruals).
ValuedfAsymptotic Significance (2-Sided)
Pearson chi-square2017/2018102.96660.000
2018/201966.65560.000
Likelihood ratio2017/2018102.97660.000
2018/201963.17760.000
N of valid cases 15,716
Source: own elaboration.
Table 5. Discretionary accrual levels across the sectors (period 2017/2018).
NACE ClassificationNegativeZeroPositive
A. Agriculture, forestry, and fishing28.67%20.43%50.90%
B. Mining and quarrying23.53%27.45%49.02%
C. Manufacturing29.56%21.83%48.61%
D. Electricity, gas, steam, and air conditioning supply22.48%20.17%57.35%
E. Water supply; sewerage, waste management, etc.27.38%22.02%50.60%
F. Construction32.78%16.9%50.32%
G. Wholesale and retail trade, repair of motor vehicles/motorcycles26.32%19.77%53.91%
H. Transportation and storage50.38%18.24%31.38%
I. Accommodation and food service activities14.36%11.70%73.94%
J. Information and communication38.00%15.78%46.22%
K. Financial and insurance activities28.26%30.43%41.30%
L. Real estate activities13.22%9.23%77.55%
M. Professional, scientific, and service activities24.97%14.50%60.53%
N. Administrative and support service activities27.87%14.75%57.38%
O. Public administration and defense; compulsory social security37.50%12.50%50.00%
P. Education29.82%8.77%61.40%
Q. Human health and social work activities25.15%20.47%54.39%
R. Arts, entertainment, and recreation24.26%14.71%61.03%
S. Other service activities26.92%17.31%55.77%
Source: own elaboration.
Table 6. Discretionary accrual levels across the sectors (period 2018/2019).
NACE ClassificationNegativeZeroPositive
A. Agriculture, forestry, and fishing39.43%6.36%54.21%
B. Mining and quarrying39.22%3.92%56.86%
C. Manufacturing46.53%5.90%47.57%
D. Electricity, gas, steam, and air conditioning supply37.75%4.32%57.93%
E. Water supply; sewerage, waste management, etc.48.81%5.95%45.24%
F. Construction42.70%4.50%52.80%
G. Wholesale and retail trade, repair of motor vehicles/motorcycles39.00%6.13%54.87%
H. Transportation and storage61.61%4.97%33.42%
I. Accommodation and food service activities28.72%2.39%68.88%
J. Information and communication48.00%4.67%47.33%
K. Financial and insurance activities45.65%10.87%43.48%
L. Real estate activities17.70%3.78%78.52%
M. Professional, scientific, and service activities34.73%4.74%60.53%
N. Administrative and support service activities40.28%2.58%57.14%
O. Public administration and defense; compulsory social security50.00%0.00%50.00%
P. Education36.84%8.77%54.39%
Q. Human health and social work activities36.84%8.77%54.39%
R. Arts, entertainment, and recreation30.88%4.41%64.71%
S. Other service activities44.23%5.77%50.00%
Source: own elaboration.
Publisher’s Note: MDPI stays neutral with regard to jurisdictional claims in published maps and institutional affiliations.

