
Financial Market Reaction to Patent Lawsuits against Integrated Circuit Design Companies

Abstract
1. Introduction
2. Literature Review
3. Research Method and Materials
3.1. Event Study
3.2. Market Model
3.3. Abnormal Return
- (1)
- Abnormal return
- (2)
- Average abnormal return
- (3)
- Cumulative abnormal return
3.4. Cross-Sectional Multiple Regression
- (1)
- Debt ratio (DEBT)
- (2)
- Firm size (SIZE)
- (3)
- Trading volume (VOL)
4. Empirical Results
5. Conclusions
Author Contributions
Funding
Institutional Review Board Statement
Informed Consent Statement
Data Availability Statement
Acknowledgments
Conflicts of Interest
References
- Agostini, Lara, Fedrico Caviggioli, Roberto Filippini, and Anna Nosella. 2015. Does Patenting Influence SME Sales Performance? A Quantity and Quality Analysis of Patents in Northern Italy. European Journal of Innovation Management 18: 238–57. [Google Scholar] [CrossRef]
- Arora, Ashish, and Andrea Fosfuri. 2003. Licensing the Market for Technology. Journal of Economic Behavior and Organization 52: 277–95. [Google Scholar] [CrossRef]
- Arora, Ashish, Marco Ceccagnolib, and Wesley Cohenc. 2008. R&D and the Patent Premium. International Journal of Industrial Organization 26: 1153–79. [Google Scholar]
- Bai, Qing, and Shainan Tian. 2020. Innovate or die: Corporate innovation and bankruptcy forecasts. Journal of Empirical Finance 59: 88–108. [Google Scholar] [CrossRef]
- Bailey, Warren, G. Andrew Karolyi, and Carolina Salva. 2006. The economic consequences of increased disclosure: Evidence from international cross-listings. Journal of Financial Economics 81: 175–213. [Google Scholar] [CrossRef]
- Beamon, Benita M. 1998. Supply Chain Design and Analysis: Models and Methods. International Journal of Production Economics 55: 281–94. [Google Scholar] [CrossRef]
- Bessen, James E., and Michael J. Meurer. 2006. Patent Litigation with Endogenous Disputes. American Economic Review 96: 77–81. [Google Scholar] [CrossRef]
- Bhagat, Sanjai, and Roberta Romano. 2002a. Event studies and the law: Part I: Technique and corporate litigation. American Law and Economics Review 4: 141–68. [Google Scholar] [CrossRef]
- Bhagat, Sanjai, and Roberta Romano. 2002b. Event studies and the law: Part II: Empirical Studies of Corporate Law. American Law and Economics Review 4: 380–423. [Google Scholar] [CrossRef]
- Bukovina, Jaroslav. 2016. Social Media Big Data and Capital Markets—An Overview. Journal of Behavioral and Experimental Finance 11: 18–26. [Google Scholar] [CrossRef]
- Chang, Hsiu Yun, Woan Lih Liang, and Yanzhi Wang. 2019. Do institutional investors still encourage patent-based innovation after the tech bubble period? Journal of Empirical Finance 51: 149–64. [Google Scholar] [CrossRef]
- Chauvet, Marcelle, Stauart Gabriel, and Chandler Lutz. 2016. Mortgage Default Risk: New Evidence from Internet Search Queries. Journal of Urban Economics 96: 91–111. [Google Scholar] [CrossRef]
- Chen, Chien Wei, Min Hsien Chiang, and Chi Lin Yang. 2014. New product preannouncements, advertising investments, and stock returns. Marketing Letters 25: 207–18. [Google Scholar] [CrossRef]
- Chen, Yi Min, Hsin Hsien Liu, Yu Siang Liu, and Huei Ting Huang. 2016. A Preemptive Power to Offensive Patent Litigation Strategy: Value Creation, Transaction Costs and Organizational Slack. Journal of Business Research 69: 1634–38. [Google Scholar] [CrossRef]
- Cohen, Lauren, Umit G. Gurun, and Scott D. Kominers. 2019. Patent trolls: Evidence from targeted firms. Management Science 65: 5461–86. [Google Scholar] [CrossRef]
- Conner, Kathleen R. 1991. A Historical Comparison of Resource-based Theory and Five Schools of Thought within Industrial Organization Economics: Do We Have a New Theory of the Firm? Journal of Management 17: 121–54. [Google Scholar] [CrossRef]
- Corea, Francesco. 2015. Why Social Media Matters: The Use of Twitter in Portfolio Strategies. International Journal of Computer Applications 128: 25–30. [Google Scholar] [CrossRef]
- Das, Somnath, Pradyot K. Sen, and Sanjit Sengupta. 1998. Impact of strategic alliances on firm valuation. Academy of Management Journal 41: 27–41. [Google Scholar]
- Demirer, Riza, Ali M. Kutan, and Chun Da Chen. 2010. Do investors herd in emerging stock markets? Evidence from the Taiwanese market. Journal of Economic Behavior and Organization 76: 283–95. [Google Scholar] [CrossRef]
- Fama, Eugene F. 1970. Efficient capital markets: A review of theory and empirical work. Journal of Finance 25: 383–417. [Google Scholar] [CrossRef]
- Fama, Eugene F., Lawrence Fisher, Michael C. Jensen, and Richard Roll. 1969. The adjustment of stock prices to new information. International Economic Review 10: 1–21. [Google Scholar] [CrossRef]
- Fang, Lily H., Josh Lerner, and Chaopeng Wu. 2017. Intellectual Property Rights Protection, Ownership, and Innovation: Evidence from China. Review of Financial Studies 30: 2446–77. [Google Scholar] [CrossRef]
- Fisher, Kenneth L., and Meir Statman. 2000. Investor Sentiment and Stock Returns. Financial Analysts Journal 56: 16–23. [Google Scholar] [CrossRef]
- Goyal, Vidhan K., Kenneth Lehn, and Stanko Racic. 2002. Growth opportunities and corporate debt policy: The case of the US defense industry. Journal of Financial Economics 64: 35–59. [Google Scholar] [CrossRef]
- Graham, Stuart, and Deepak Somaya. 2004. The use of patents, copyrights and trademarks in software: Evidence from litigation. In Patents, Innovation and Economic Performance: OECD Conference Proceedings. Paris: OECD Publishing, pp. 265–88. [Google Scholar] [CrossRef]
- Grossman, Sanford J., and Robert J. Shiller. 1981. The determinants of the variability of stock market prices. The American Economic Review 71: 222–27. [Google Scholar]
- Hall, Bronwyn H., and Rosemarie Ham Ziedonis. 2001. The Patent Paradox Revisited: An Empirical Study of Patenting in the U.S. Semiconductor Industry. 1979–1995. RAND Journal of Economics 32: 101–28. [Google Scholar] [CrossRef]
- Hillman, Amy J., Gerald D. Keim, and Douglas Schuler. 2004. Corporate Political Activity: A Review and Research Agenda. Journal of Management 30: 837–57. [Google Scholar] [CrossRef]
- Hong, Harrison, and Jeremy C. Stein. 1999. A unified theory of underreaction, momentum trading, and overreaction in asset markets. The Journal of finance 54: 2143–84. [Google Scholar] [CrossRef]
- Hsu, David H., Po Hsuan Hsu, Tong Zhou, and Arvids A. Ziedonis. 2021. Benchmarking US university patent value and commercialization efforts: A new approach. Research Policy 50: 104076. [Google Scholar] [CrossRef]
- Kafouros, Mario, Murod Aliyev, and Sorin M. Krammer. 2021. Do firms profit from patent litigation? The contingent roles of diversification and intangible assets. Research Policy 50: 104263. [Google Scholar] [CrossRef]
- Keller, Kevin Lane, and David A. Aaker. 1992. The effects of sequential introduction of brand extensions. Journal of Marketing Research 29: 35–50. [Google Scholar] [CrossRef]
- Keller, Kevin Lane, and Donald R. Lehmann. 2003. How do brands create value? Marketing Management 12: 26. [Google Scholar]
- Kim, Bongsun, Eonsoo Kim, Douglas J. Miller, and Joseph T. Mahoney. 2016. The Impact of the Timing of Patents on Innovation Performance. Research Policy 45: 914–28. [Google Scholar] [CrossRef]
- Koku, Paul Sergius, Anique A. Qureshi, and Aigbe Akhigbe. 2001. The effects of news on initial corporate lawsuits. Journal of Business Research 53: 49–55. [Google Scholar] [CrossRef]
- Krammer, Sorin M. 2015. Do Good Institutions Enhance the Effect of Technological Spillovers on Productivity? Comparative Evidence from Developed and Transition Economies. Technological Forecasting and Social Change 94: 133–54. [Google Scholar] [CrossRef]
- Langinier, Corinne, and Philippe Marcoul. 2009. Contributory Infringement Rule and Patents. Journal of Economic Behavior and Organization 70: 296–310. [Google Scholar] [CrossRef][Green Version]
- Lanjouw, Jean O., and Josh Lerner. 2001. Tilting the Table? The Use of Preliminary Injunctions. Journal of Law and Economics 44: 573–603. [Google Scholar] [CrossRef]
- Lanjouw, Jean O., and Mark Schankerman. 2001. Characteristics of Patent Litigation: A Window on Competition. RAND Journal of Economics 32: 129–51. [Google Scholar] [CrossRef]
- Lee, Jun-De, Yi-Hsien Wang, Ching-Wen Lin, and Hsin-Ham Lin. 2013. Information Value of Patent Litigation and Industry Competition in Taiwan. Technological and Economic Development of Economy 19: 593–605. [Google Scholar] [CrossRef]
- Leiponen, Aija, and Henry Delcamp. 2019. The anatomy of a troll? Patent licensing business models in the light of patent reassignment data. Research Policy 48: 298–311. [Google Scholar] [CrossRef]
- Lemley, Mark A., and Carl Shapiro. 2007. Patent Holdup and Royalty Stacking. Texas Law Review 85: 2163–73. [Google Scholar]
- Lerner, Josh. 1995. Patenting in the Shadow of Competitors. Journal of Law and Economics 38: 463–95. [Google Scholar] [CrossRef]
- Liu, Shuming. 2015. Investor Sentiment and Stock Market Liquidity. Journal of Behavioral Finance 16: 51–67. [Google Scholar] [CrossRef]
- Luo, Xueming, and Chitra Bhanu Bhattacharya. 2006. Corporate social responsibility, customer satisfaction, and market value. Journal of Marketing 70: 1–18. [Google Scholar] [CrossRef]
- Marco, Alan C. 2005. The Option Value of Patent Litigation: Theory and Evidence. Review of Financial Economics 14: 323–51. [Google Scholar] [CrossRef]
- Mayer, Kyle J., Deepak Somaya, and Ian O. Williamson. 2012. Firm-specific, Industry-specific, and Occupational Human Capital and the Sourcing of Knowledge Work. Organization Science 23: 1311–29. [Google Scholar] [CrossRef]
- Michaelides, Alexander, Andreas Milidonis, George P. Nishiotis, and Panayiotis Papakyriakou. 2015. The adverse effects of systematic leakage ahead of official sovereign debt rating announcements. Journal of Financial Economics 116: 526–47. [Google Scholar] [CrossRef]
- Nam, Sangjun, Changi Nam, and Seongcheol Kim. 2015. The impact of patent litigation on shareholder value in the smartphone industry. Technological Forecasting and Social Change 95: 182–90. [Google Scholar] [CrossRef]
- Nerkar, Atul, Srikanth Paruchuri, and Mukti Khaire. 2007. Business Method Patents as Real Options: Value and Disclosure as Drivers of Litigation. Advances in Strategic Management 24: 247–74. [Google Scholar]
- Nicholas, Barberis, Andrei Shleifer, and Robert Vishny. 1998. A model of investor sentiment. Journal of Financial Economics 49: 307–43. [Google Scholar]
- Park, Inchae, and Byungun Yoon. 2014. A Semantic Analysis Approach for Identifying Patent Infringement Based on a Product–Patent Map. Technology Analysis & Strategic Management 26: 855–74. [Google Scholar]
- Peterson, Pamela P. 1989. Event studies: A review of issues and methodology. Quarterly Journal of Business and Economics 28: 36–66. [Google Scholar]
- Piñeiro-Chousa, Juan, Marcos Vizcaíno-González, and Ada Maria Pérez-Pico. 2017. Influence of Social Media over the Stock Market. Psychology & Marketing 34: 101–8. [Google Scholar]
- Raghu, T. S., Wonseok Woo, S. B. Mohan, and H. Raghav Rao. 2008. Market reaction to patent infringement litigations in the information technology industry. Information Systems Frontiers 10: 61–75. [Google Scholar] [CrossRef]
- Reed, Markum. 2016. A Study of Social Network Effects on the Stock Market. Journal of Behavioral Finance 17: 342–51. [Google Scholar] [CrossRef]
- Reitzig, Markus, and Stefan Wagner. 2010. The Hidden Costs of Outsourcing: Evidence from Patent Data. Strategic Management Journal 31: 1183–201. [Google Scholar] [CrossRef]
- Reitzig, Markus, Joachim Henkel, and Christopher Heath. 2007. On sharks, trolls, and their patent prey—Unrealistic damage awards and firms’ strategies of being infringed. Research Policy 36: 134–54. [Google Scholar] [CrossRef]
- Reitzig, Markus, Joachim Henkel, and Ferdinand Schneider. 2010. Collateral damage for R&D manufacturers: How patent sharks operate in markets for technology. Industrial and Corporate Change 19: 947–67. [Google Scholar] [CrossRef]
- Sakakibara, Mariko, and Lee Branstetter. 2001. Do Stronger Patents Induce More Innovation? Evidence from the 1988 Japanese Patent Law Reforms. RAND Journal of Economics 32: 77–100. [Google Scholar] [CrossRef]
- Schliessler, Paula M. 2015. Patent litigation and firm performance: The role of the enforcement system. Industrial and Corporate Change 24: 307–43. [Google Scholar] [CrossRef]
- Sharpe, William F. 1964. Capital asset prices: A theory of market equilibrium under conditions of risk. Journal of Finance 19: 425–42. [Google Scholar]
- Somaya, Deepak. 2012. Patent Strategy and Management an Integrative Review and Research Agenda. Journal of Management 38: 1084–114. [Google Scholar] [CrossRef]
- Somaya, Deepak, and Christine A. McDaniel. 2012. Tribunal Specialization and Institutional Targeting in Patent Enforcement. Organization Science 23: 869–87. [Google Scholar] [CrossRef]
- Somaya, Deepak, David Teece, and Simon Wakeman. 2011. Innovating in Multi-invention Contexts: Mapping Solutions to Technological and Intellectual Property Complexity. California Management Review 53: 47–79. [Google Scholar] [CrossRef]
- Son, Insung, Hankyung Lee, and Jinsu Kim. 2015. Preannouncement effects on apple’s supply chains: Using the event study based on iPhone 6 and 6 Plus. Advanced Science and Technology Letters 84: 73–78. [Google Scholar]
- Su, Chong-Zhe. 2002. Introduction to IP insurance (1) Talking from the American system. Science & Technology Law Review 11: 41–51. [Google Scholar]
- Subramani, Mani, and Eric Walden. 2001. The impact of e-commerce announcements on the market value of firms. Information Systems Research 12: 135–54. [Google Scholar] [CrossRef]
- Thaler, Richard H. 1999. Mental accounting matters. Journal of Behavioral Decision Making 12: 183–206. [Google Scholar] [CrossRef]
- Tu, Jhih-Hao. 2021. MediaTek ranks among the world’s top ten semiconductors. Commercial Times. February 21. Available online: https://ctee.com.tw/news/tech/419037.html (accessed on 10 July 2021).
- Wang, Yi-Hsien, Wan-Rung Lin, Shu-Shian Lin, and Jui-Cheng Hung. 2017. How does patent litigation influence dynamic risk for market competitors? Technological and Economic Development of Economy 23: 780–93. [Google Scholar] [CrossRef]
- Yang, Qian-Min. 2012. Patent layout and strategic alliance of high-tech industry. Taiwan Patent Attorneys Journal 11: 116–20. [Google Scholar]
- Zhou, Yan-Peng. 2006. Tiger and Fox Intelligence. Commonwealth Publishing 3: 419–21. [Google Scholar]
- Ziedonis, Rosemarie Ham. 2004. Don’t Fence Me In: Fragmented Markets for Technology and the Patent Acquisition Strategies of Firms. Management Science 50: 804–20. [Google Scholar] [CrossRef]


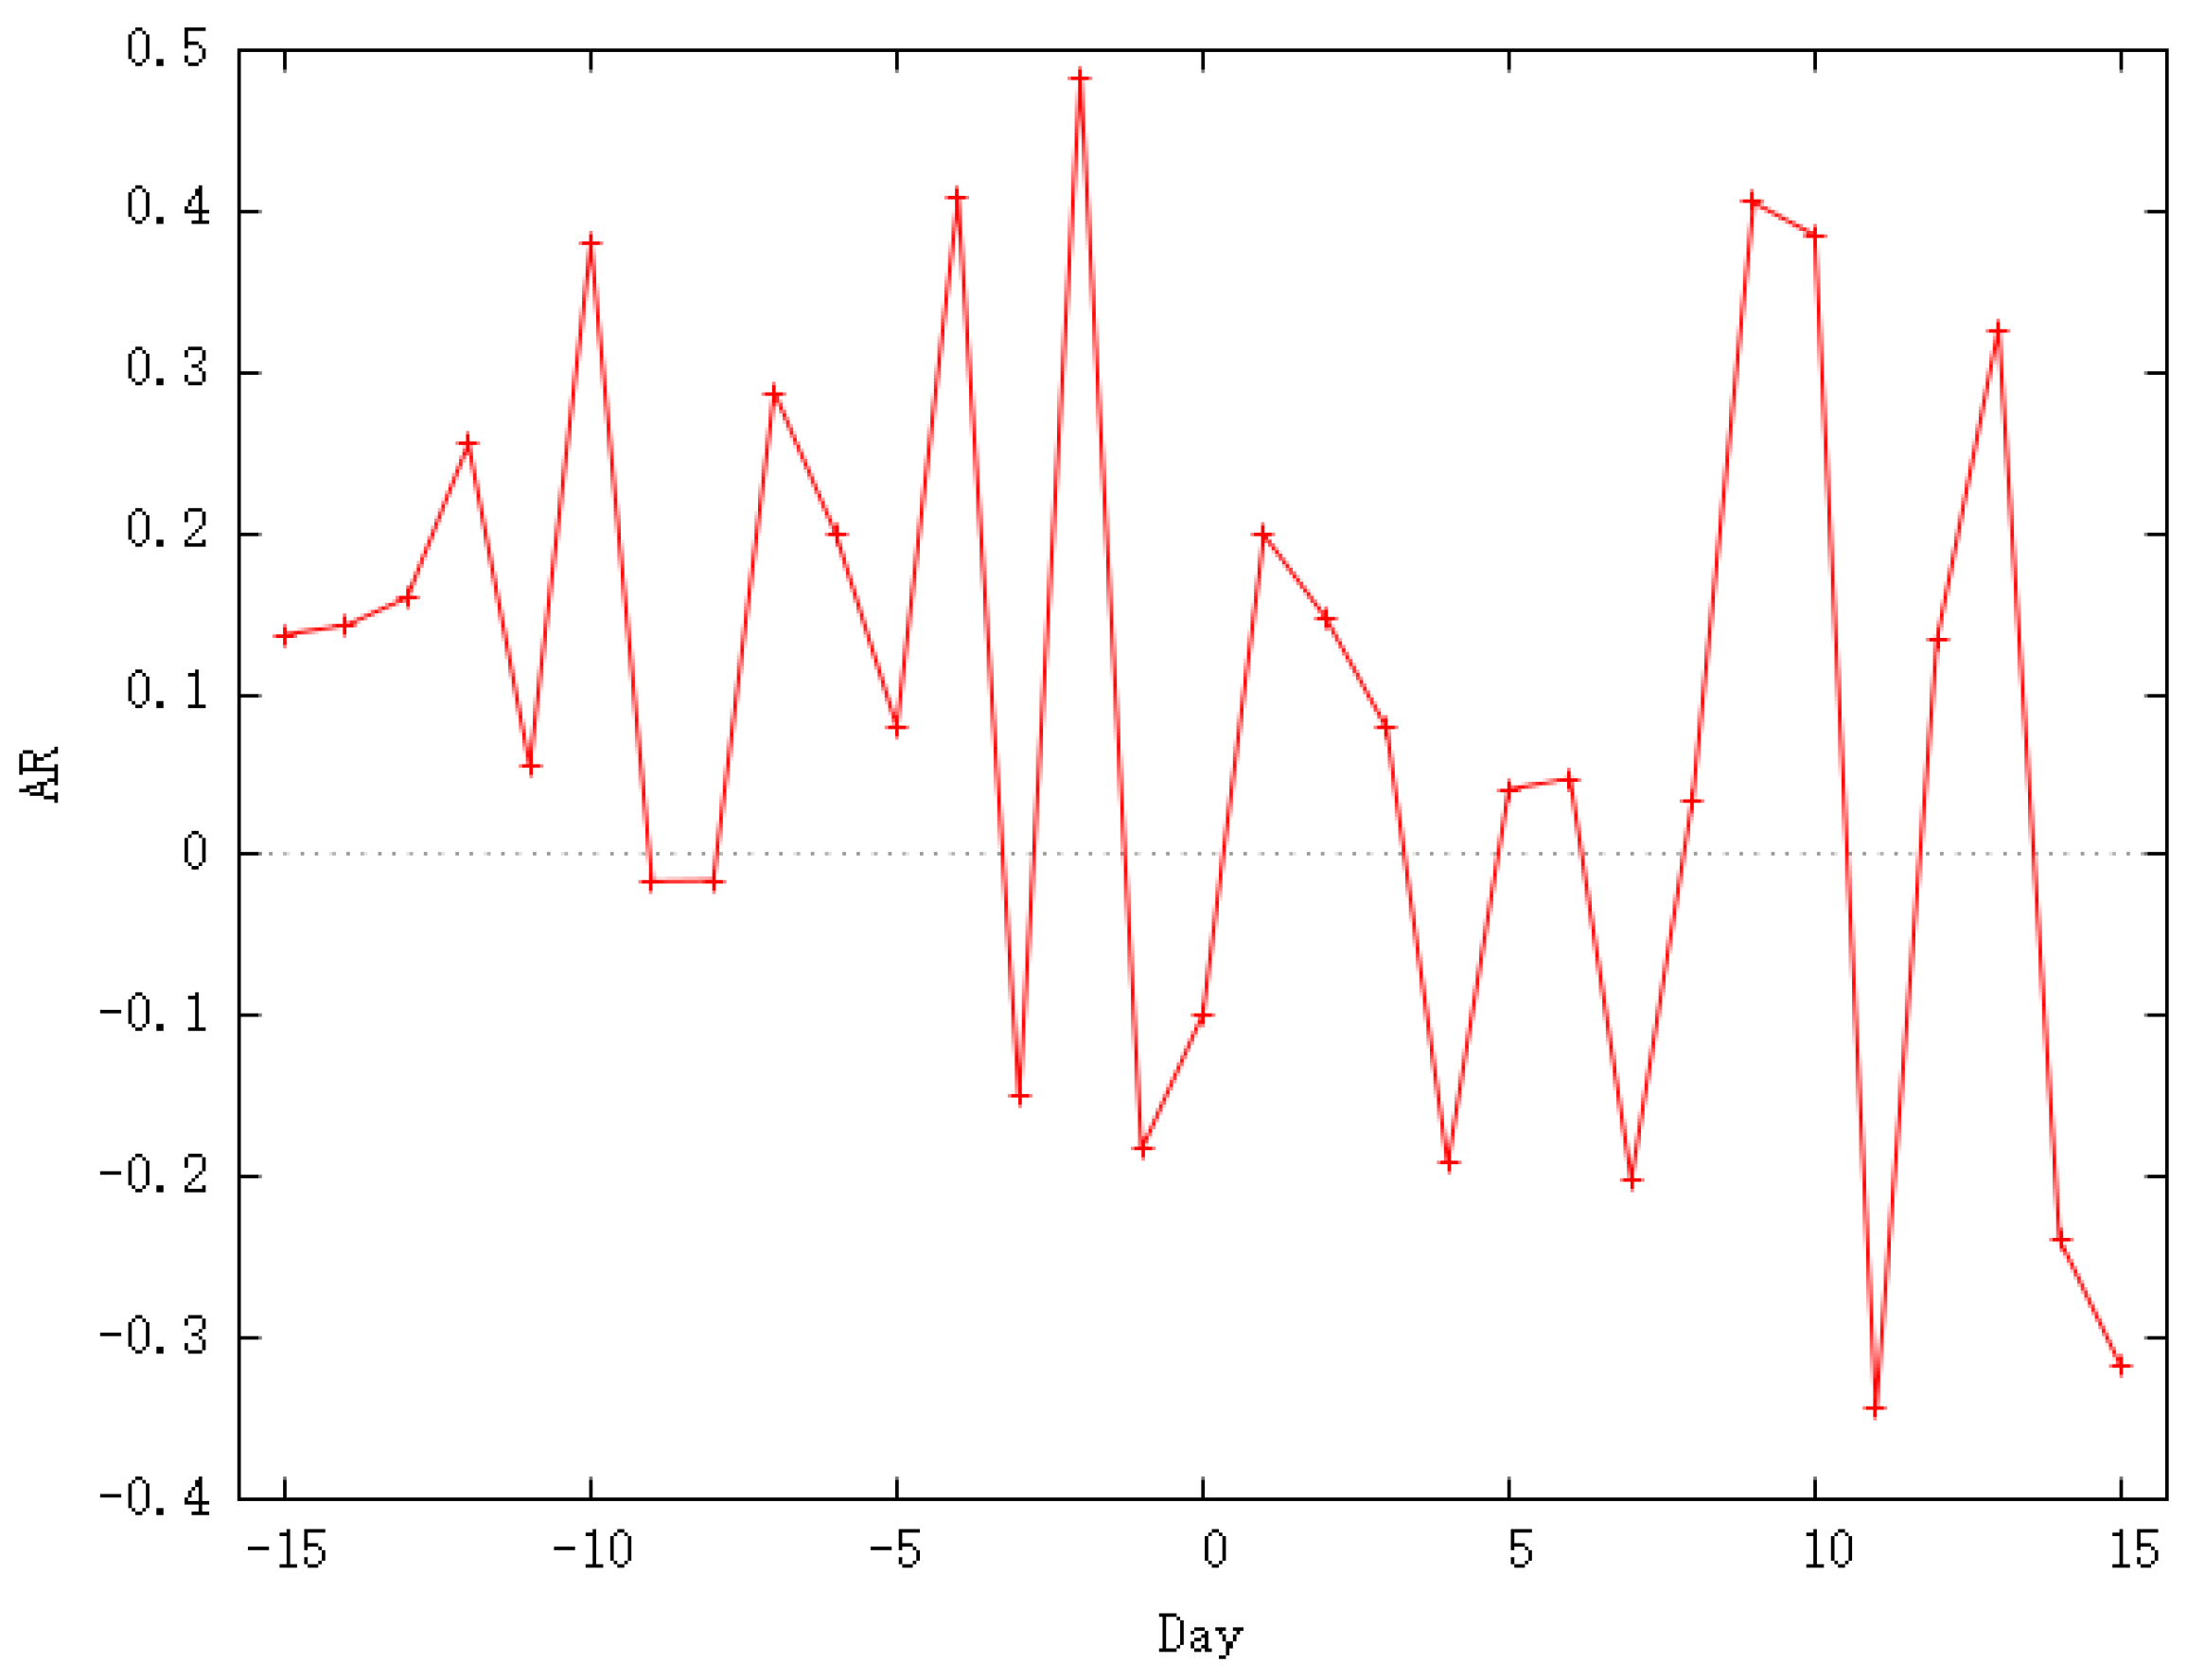
| AR | p-Value | AR | p-Value | ||
|---|---|---|---|---|---|
| −15 | 0.137 | 0.572 | 1 | 0.199 | 0.413 |
| −14 | 0.143 | 0.556 | 2 | 0.148 | 0.542 |
| −13 | 0.160 | 0.510 | 3 | 0.079 | 0.745 |
| −12 | 0.256 | 0.292 | 4 | −0.191 | 0.431 |
| −11 | 0.056 | 0.818 | 5 | 0.041 | 0.866 |
| −10 | 0.380 | 0.118 | 6 | 0.048 | 0.845 |
| −9 | −0.016 | 0.947 | 7 | −0.201 | 0.407 |
| −8 | −0.016 | 0.948 | 8 | 0.034 | 0.890 |
| −7 | 0.287 | 0.236 | 9 | 0.405 * | 0.095 |
| −6 | 0.200 | 0.410 | 10 | 0.385 | 0.113 |
| −5 | 0.080 | 0.742 | 11 | −0.343 | 0.157 |
| −4 | 0.408 * | 0.093 | 12 | 0.134 | 0.580 |
| −3 | −0.151 | 0.535 | 13 | 0.327 | 0.178 |
| −2 | 0.483 ** | 0.046 | 14 | −0.239 * | 0.325 |
| −1 | −0.183 | 0.451 | 15 | −0.317 | 0.191 |
| 0 | −0.099 | 0.684 |
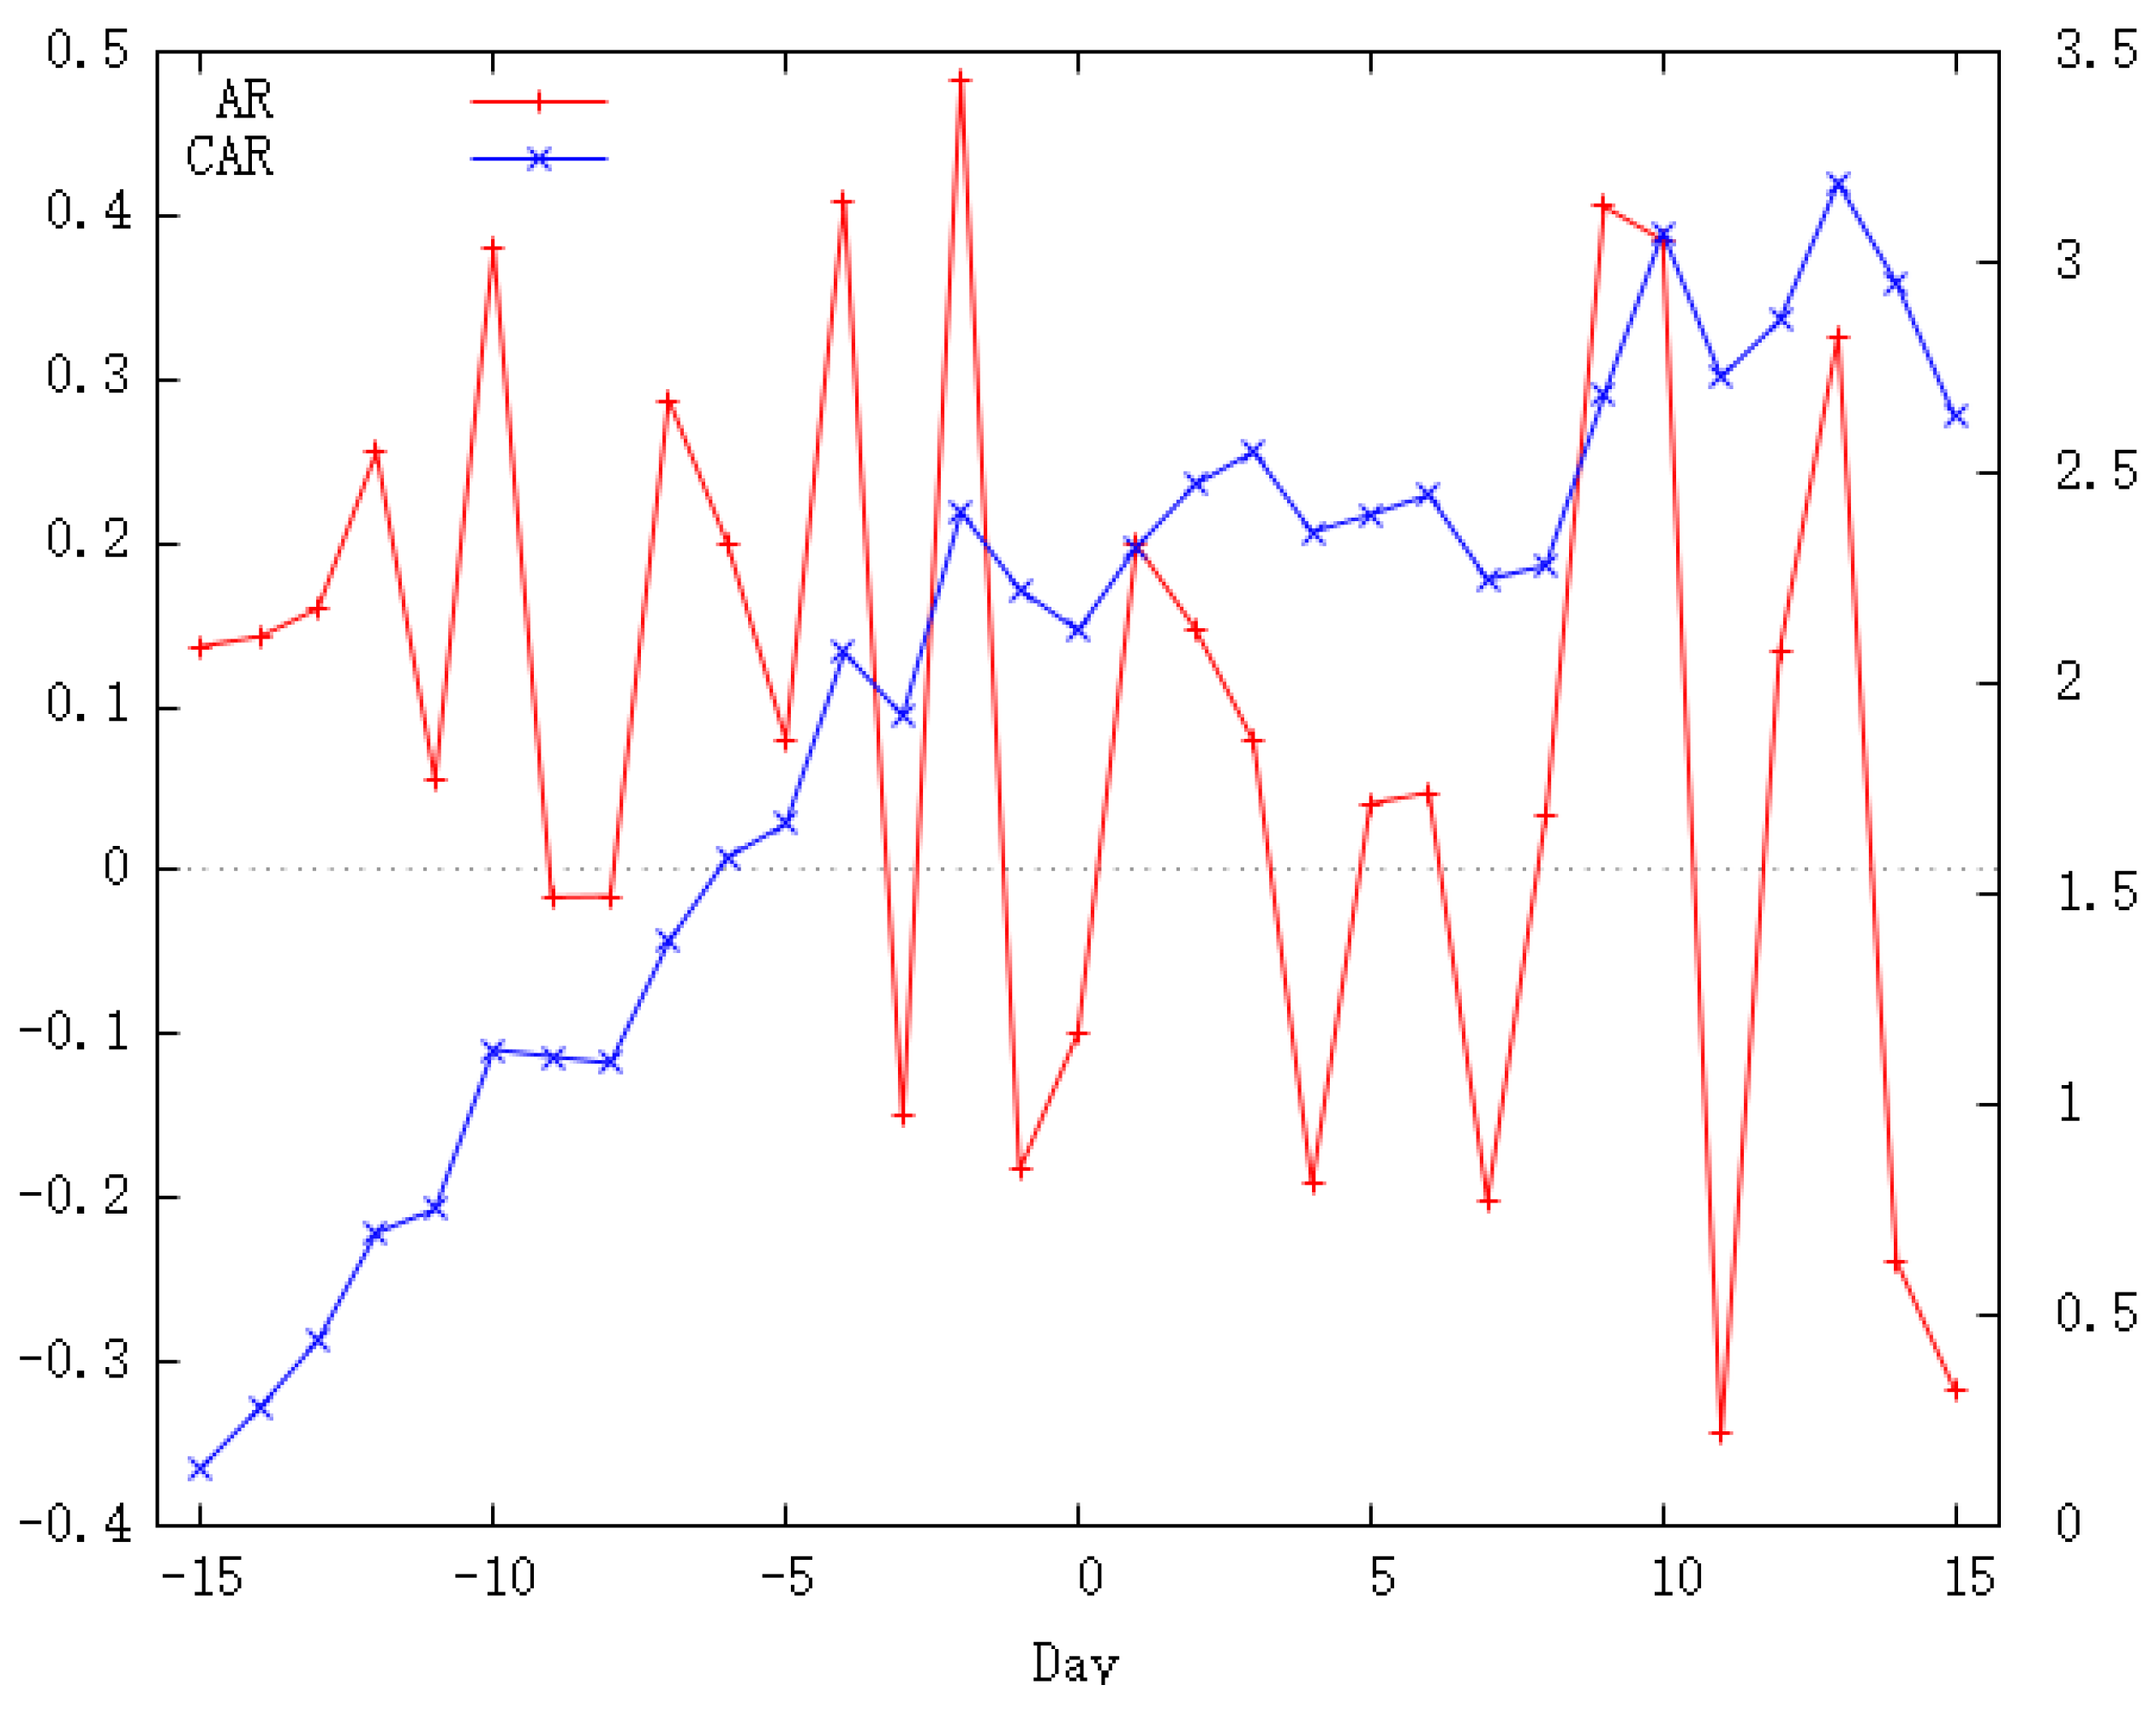
| CAR | p-Value | CAR | p-Value | ||
|---|---|---|---|---|---|
| −15 | 0.137 | 0.572 | 1 | 2.324 ** | 0.020 |
| −14 | 0.280 | 0.415 | 2 | 2.472 ** | 0.016 |
| −13 | 0.440 | 0.295 | 3 | 2.551 ** | 0.016 |
| −12 | 0.696 | 0.152 | 4 | 2.359 ** | 0.030 |
| −11 | 0.751 | 0.166 | 5 | 2.400 ** | 0.031 |
| −10 | 1.131 | 0.057 | 6 | 2.448 ** | 0.032 |
| −9 | 1.115 | 0.083 | 7 | 2.247 * | 0.054 |
| −8 | 1.099 | 0.109 | 8 | 2.280 * | 0.055 |
| −7 | 1.386 * | 0.057 | 9 | 2.686 ** | 0.027 |
| −6 | 1.586 ** | 0.039 | 10 | 3.070 ** | 0.013 |
| −5 | 1.666 ** | 0.038 | 11 | 2.727 ** | 0.031 |
| −4 | 2.074 ** | 0.014 | 12 | 2.862 ** | 0.026 |
| −3 | 1.923 ** | 0.028 | 13 | 3.188 ** | 0.015 |
| −2 | 2.407 *** | 0.008 | 14 | 2.949 ** | 0.027 |
| −1 | 2.224 ** | 0.018 | 15 | 2.632 * | 0.051 |
| 0 | 2.125 ** | 0.029 |
| Period | (−1,0) | (0,1) | (−5,5) | (−3,0) | (−2,1) | (−2,2) |
|---|---|---|---|---|---|---|
| CAR | −177.860 *** | 58.120 *** | 11.522 | −9.045 | −0.488 | 12.382 |
| T-value | −16.806 | 5.492 | 0.464 | −0.604 | −0.033 | 0.740 |
| CAR (−1,0) | CAR (0,1) | ||||
|---|---|---|---|---|---|
| Variable | Coefficient | t-Statistics | Variable | Variable | Coefficient |
| Intercept term | 1.038 | 0.8418 | Intercept term | 1.869 | 1.328 |
| Debt ratio | 0.0263 | −0.6741 | Debt ratio | −0.0136 | −0.3810 |
| Firm size | 1.132 × 10⁻⁶ | −1.622 | Firm size | −3.240 × 10⁻⁷ | 0.2467 |
| Trading volume | 9.564 × 10⁻⁵ | 0.1192 | Trading volume | −0.000 *** | −2.705 |
| R-squared | 0.0586 | R-squared | 0.0706 | ||
| Sum squared resid | 234.204 | Sum squared resid | 320.086 | ||
| F(3,52) | 1.060 | F(3,52) | 3.0214 | ||
| White’s test | 23.369 | White’s test | 5.284 | ||
| with p-value | 0.00542 | with p-value | 0.809 | ||
Publisher’s Note: MDPI stays neutral with regard to jurisdictional claims in published maps and institutional affiliations. |
© 2021 by the authors. Licensee MDPI, Basel, Switzerland. This article is an open access article distributed under the terms and conditions of the Creative Commons Attribution (CC BY) license (https://creativecommons.org/licenses/by/4.0/).
Share and Cite
Yu, S.-C.; Shih, K.-H. Financial Market Reaction to Patent Lawsuits against Integrated Circuit Design Companies. J. Risk Financial Manag. 2021, 14, 433. https://doi.org/10.3390/jrfm14090433
Yu S-C, Shih K-H. Financial Market Reaction to Patent Lawsuits against Integrated Circuit Design Companies. Journal of Risk and Financial Management. 2021; 14(9):433. https://doi.org/10.3390/jrfm14090433
Chicago/Turabian StyleYu, Su-Chen, and Kuang-Hsun Shih. 2021. "Financial Market Reaction to Patent Lawsuits against Integrated Circuit Design Companies" Journal of Risk and Financial Management 14, no. 9: 433. https://doi.org/10.3390/jrfm14090433
APA StyleYu, S.-C., & Shih, K.-H. (2021). Financial Market Reaction to Patent Lawsuits against Integrated Circuit Design Companies. Journal of Risk and Financial Management, 14(9), 433. https://doi.org/10.3390/jrfm14090433