
Are Foreign Banks Disadvantaged Vis-À-Vis Domestic Banks in China?


Abstract
:1. Introduction
2. Theory and Hypotheses Development
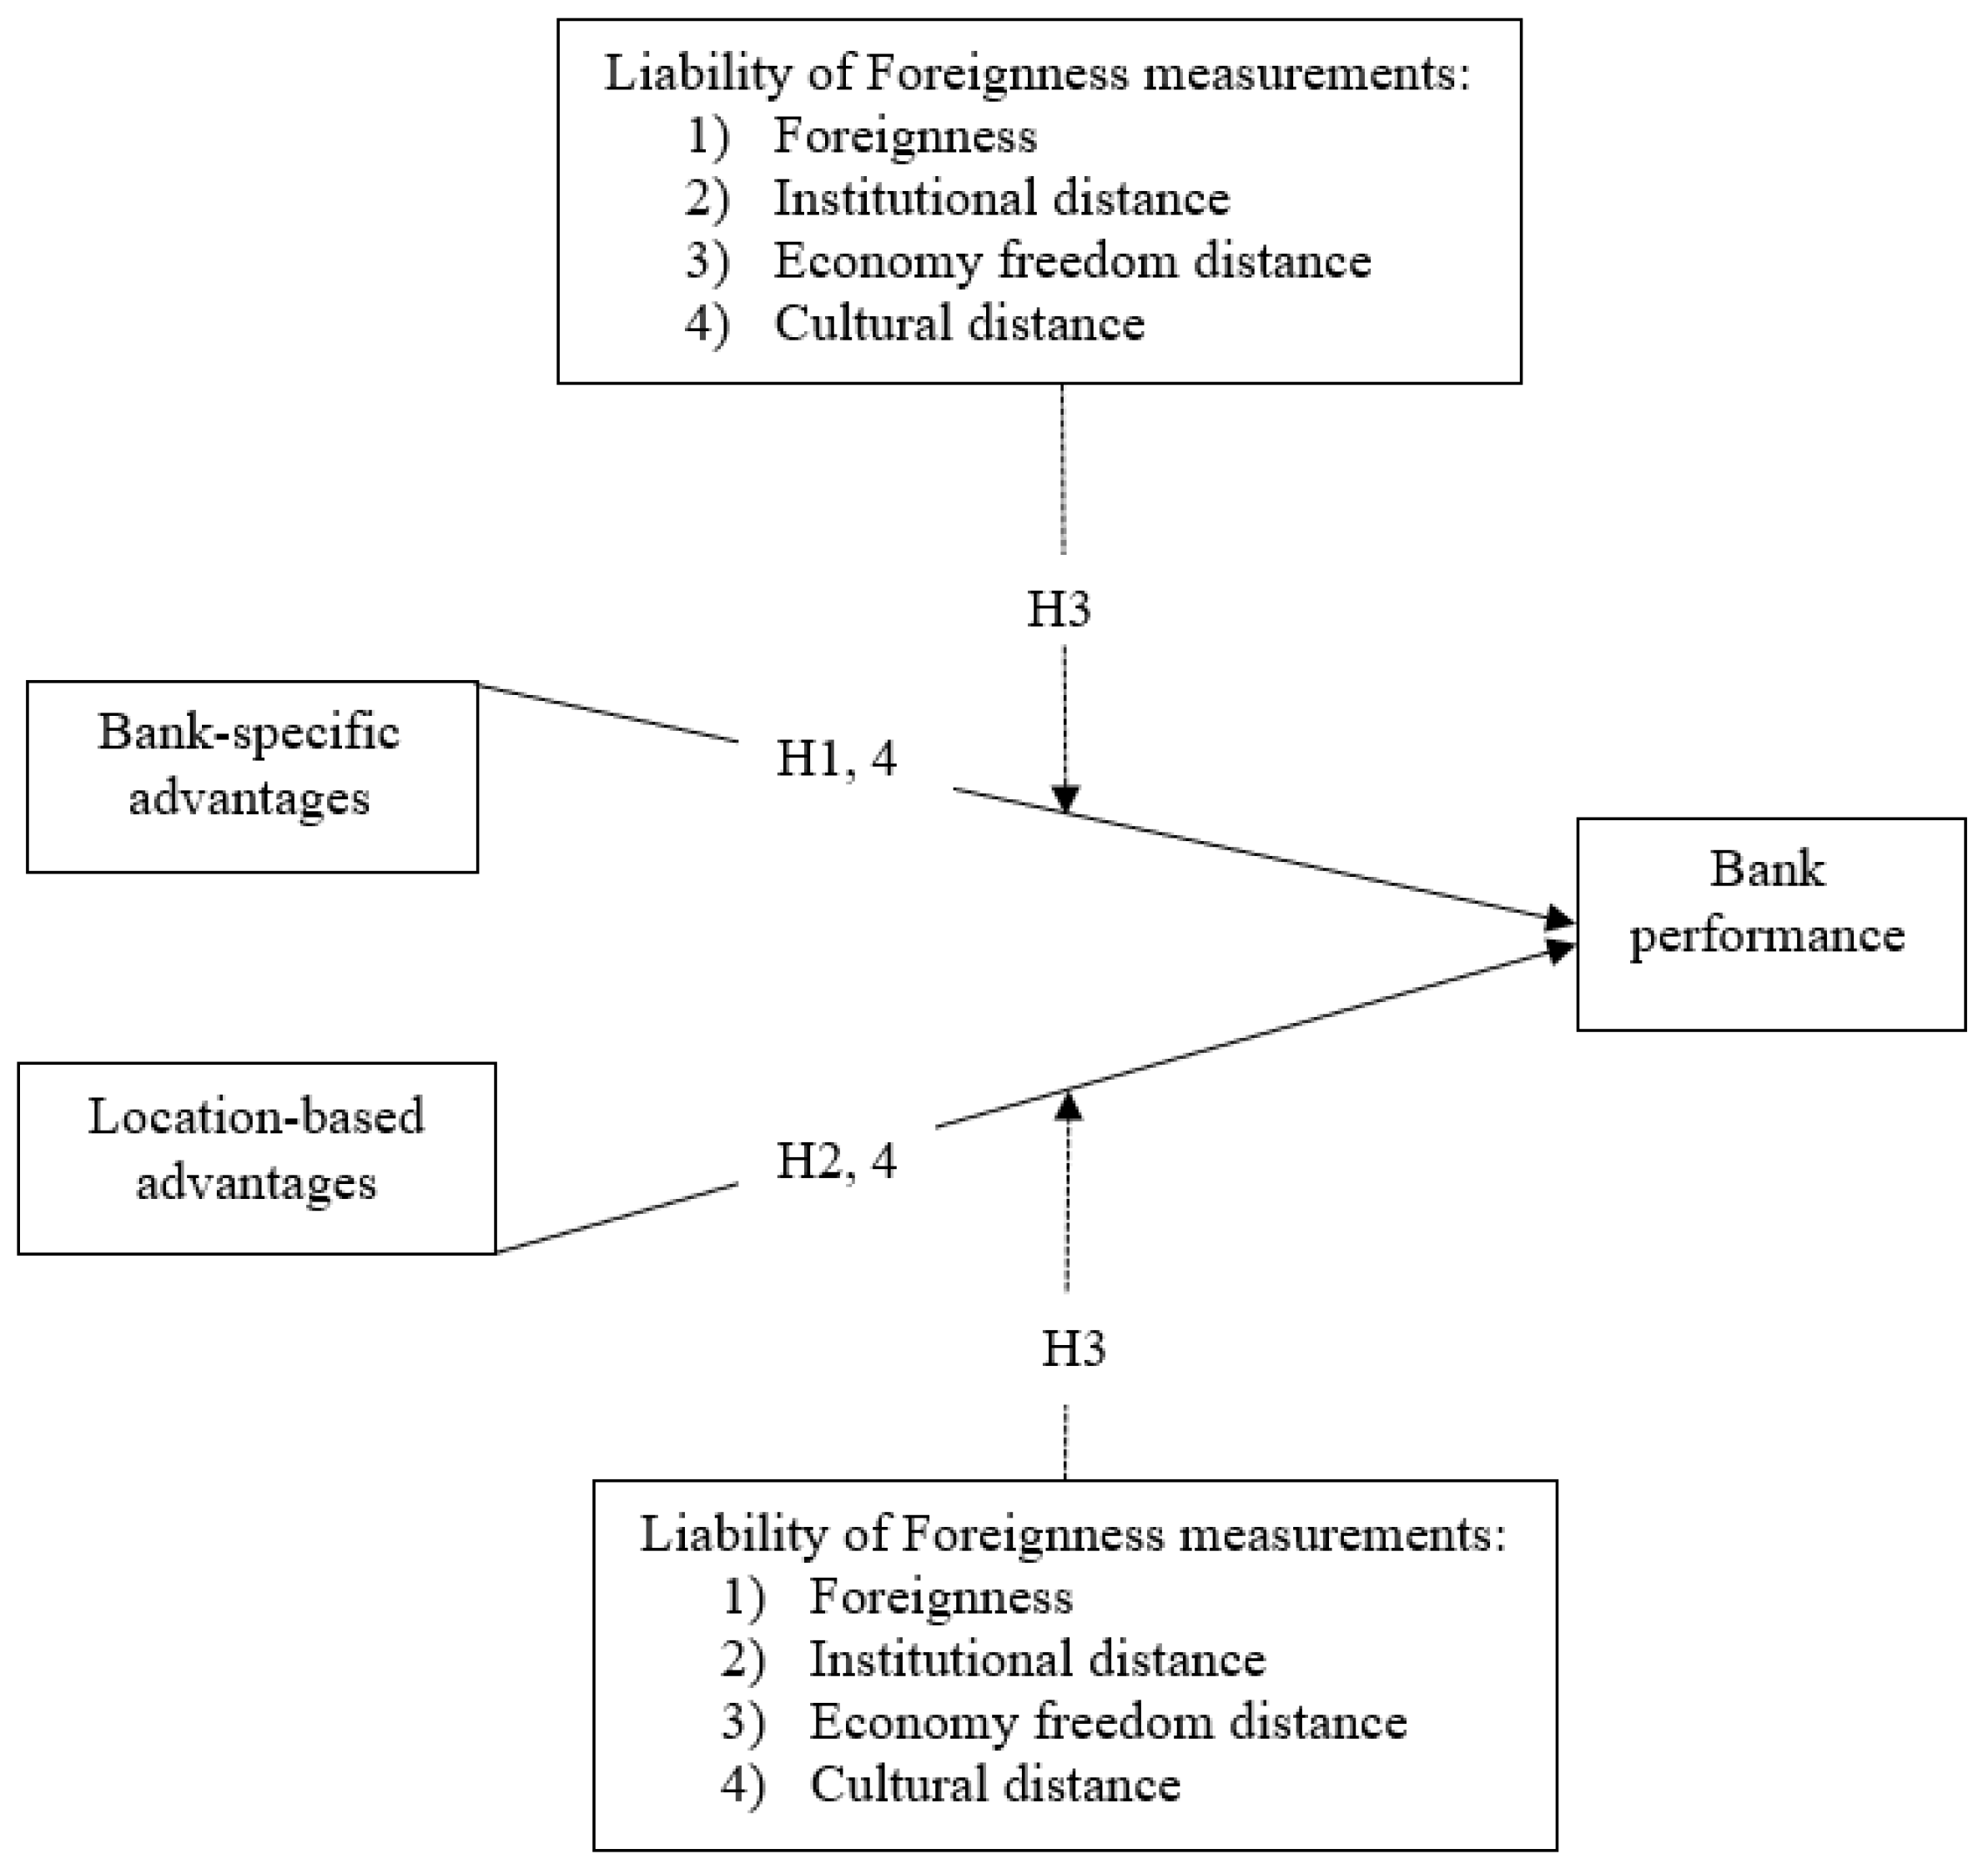
2.1. Conceptual Framework
2.2. Hypothesis Development
2.2.1. Foreign Bank-Specific Advantage Hypothesis
2.2.2. Location-Based Advantage Hypothesis
2.2.3. Mediating Effects of Liability of Foreignness
Foreignness
Institutional Distance
Economic Freedom Distance
Cultural Distance
Dynamics of the LOF
3. Data and Methodology, Variables
3.1. Data and Methodology
3.2. Variables
- Bank-specific advantage × Foreignness
- Location-based advantage × Foreignness
- Bank-specific advantage × Cultural Distance
- Location-based advantage × Cultural Distance
- Bank-specific advantage × Institutional distance
- Location-based advantage × Institutional distance
- Bank-specific advantage × Economic freedom distance
- Location-based advantage × Economic freedom distance
3.3. Method
4. Empirical Test Results and Discussion
4.1. Summary Statistics
4.2. Main GMM Analysis Findings
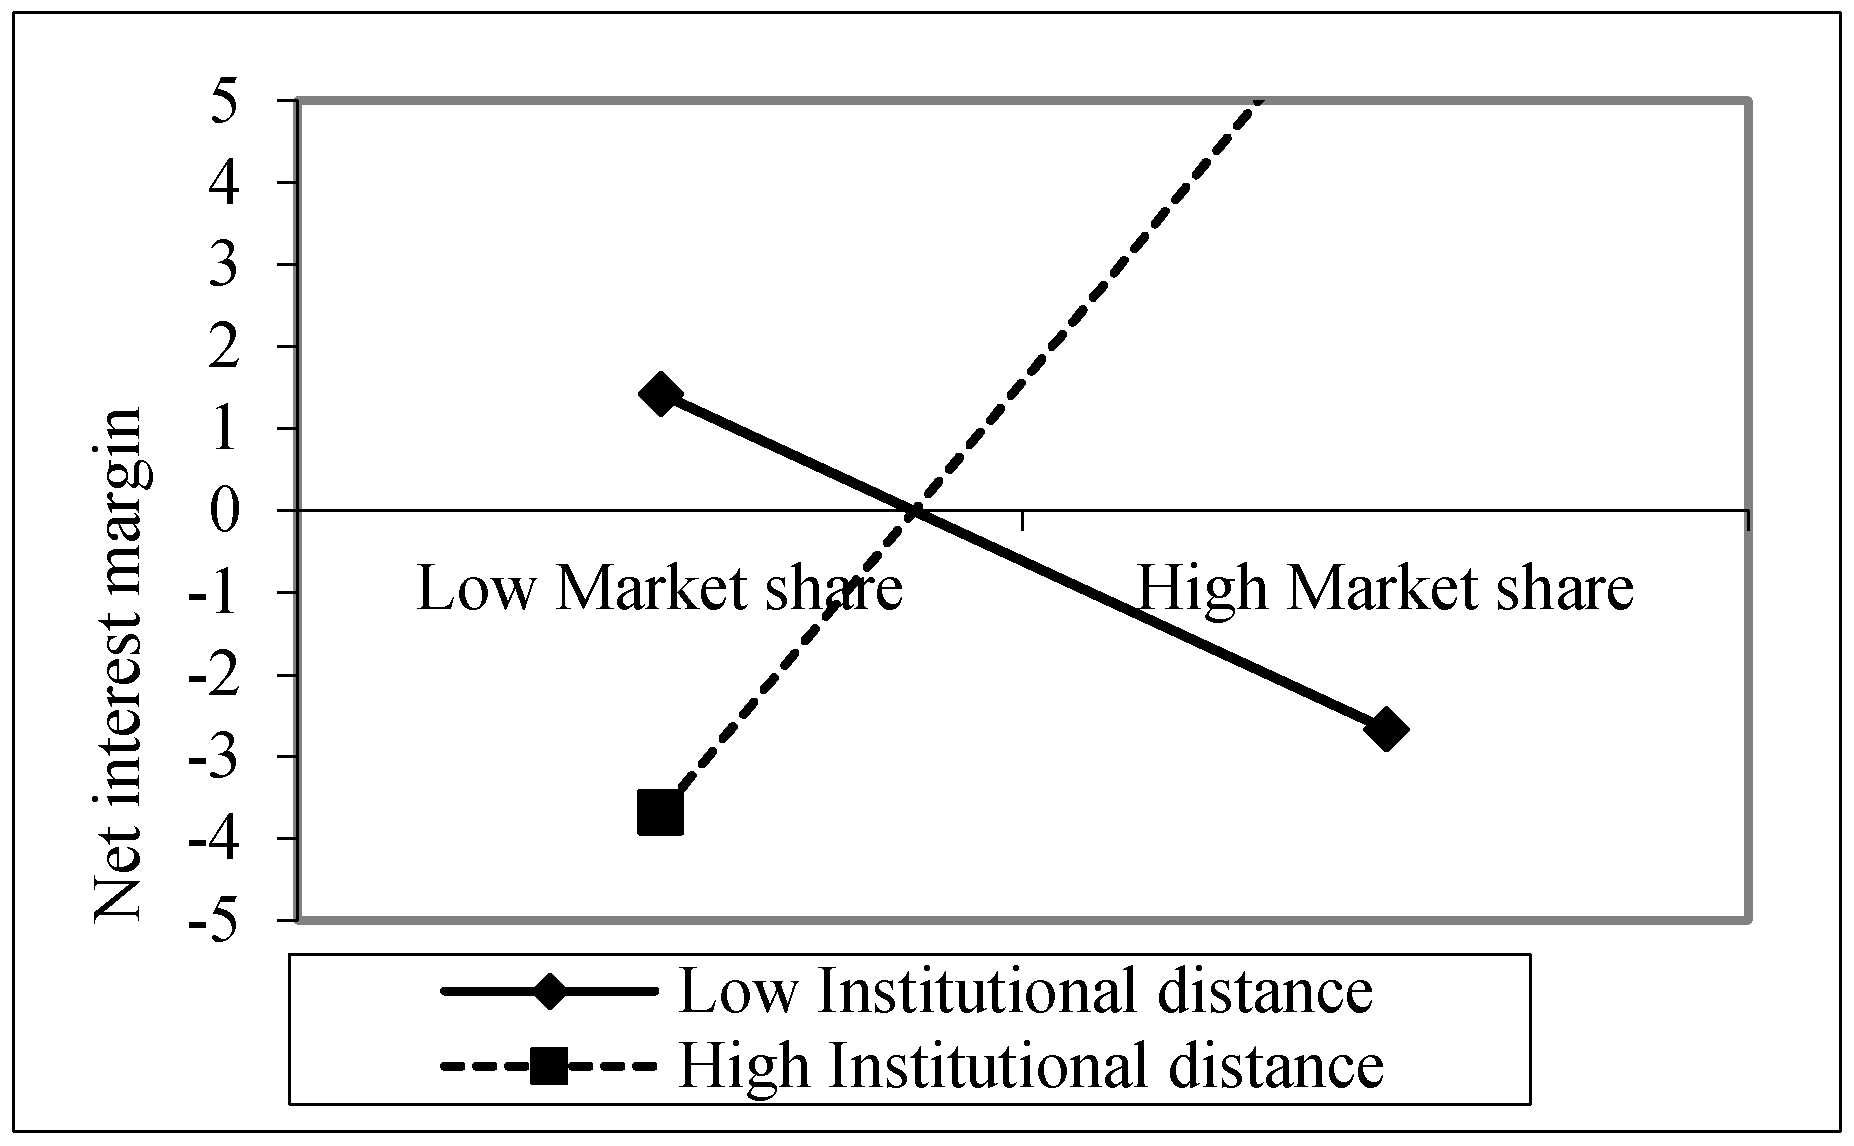
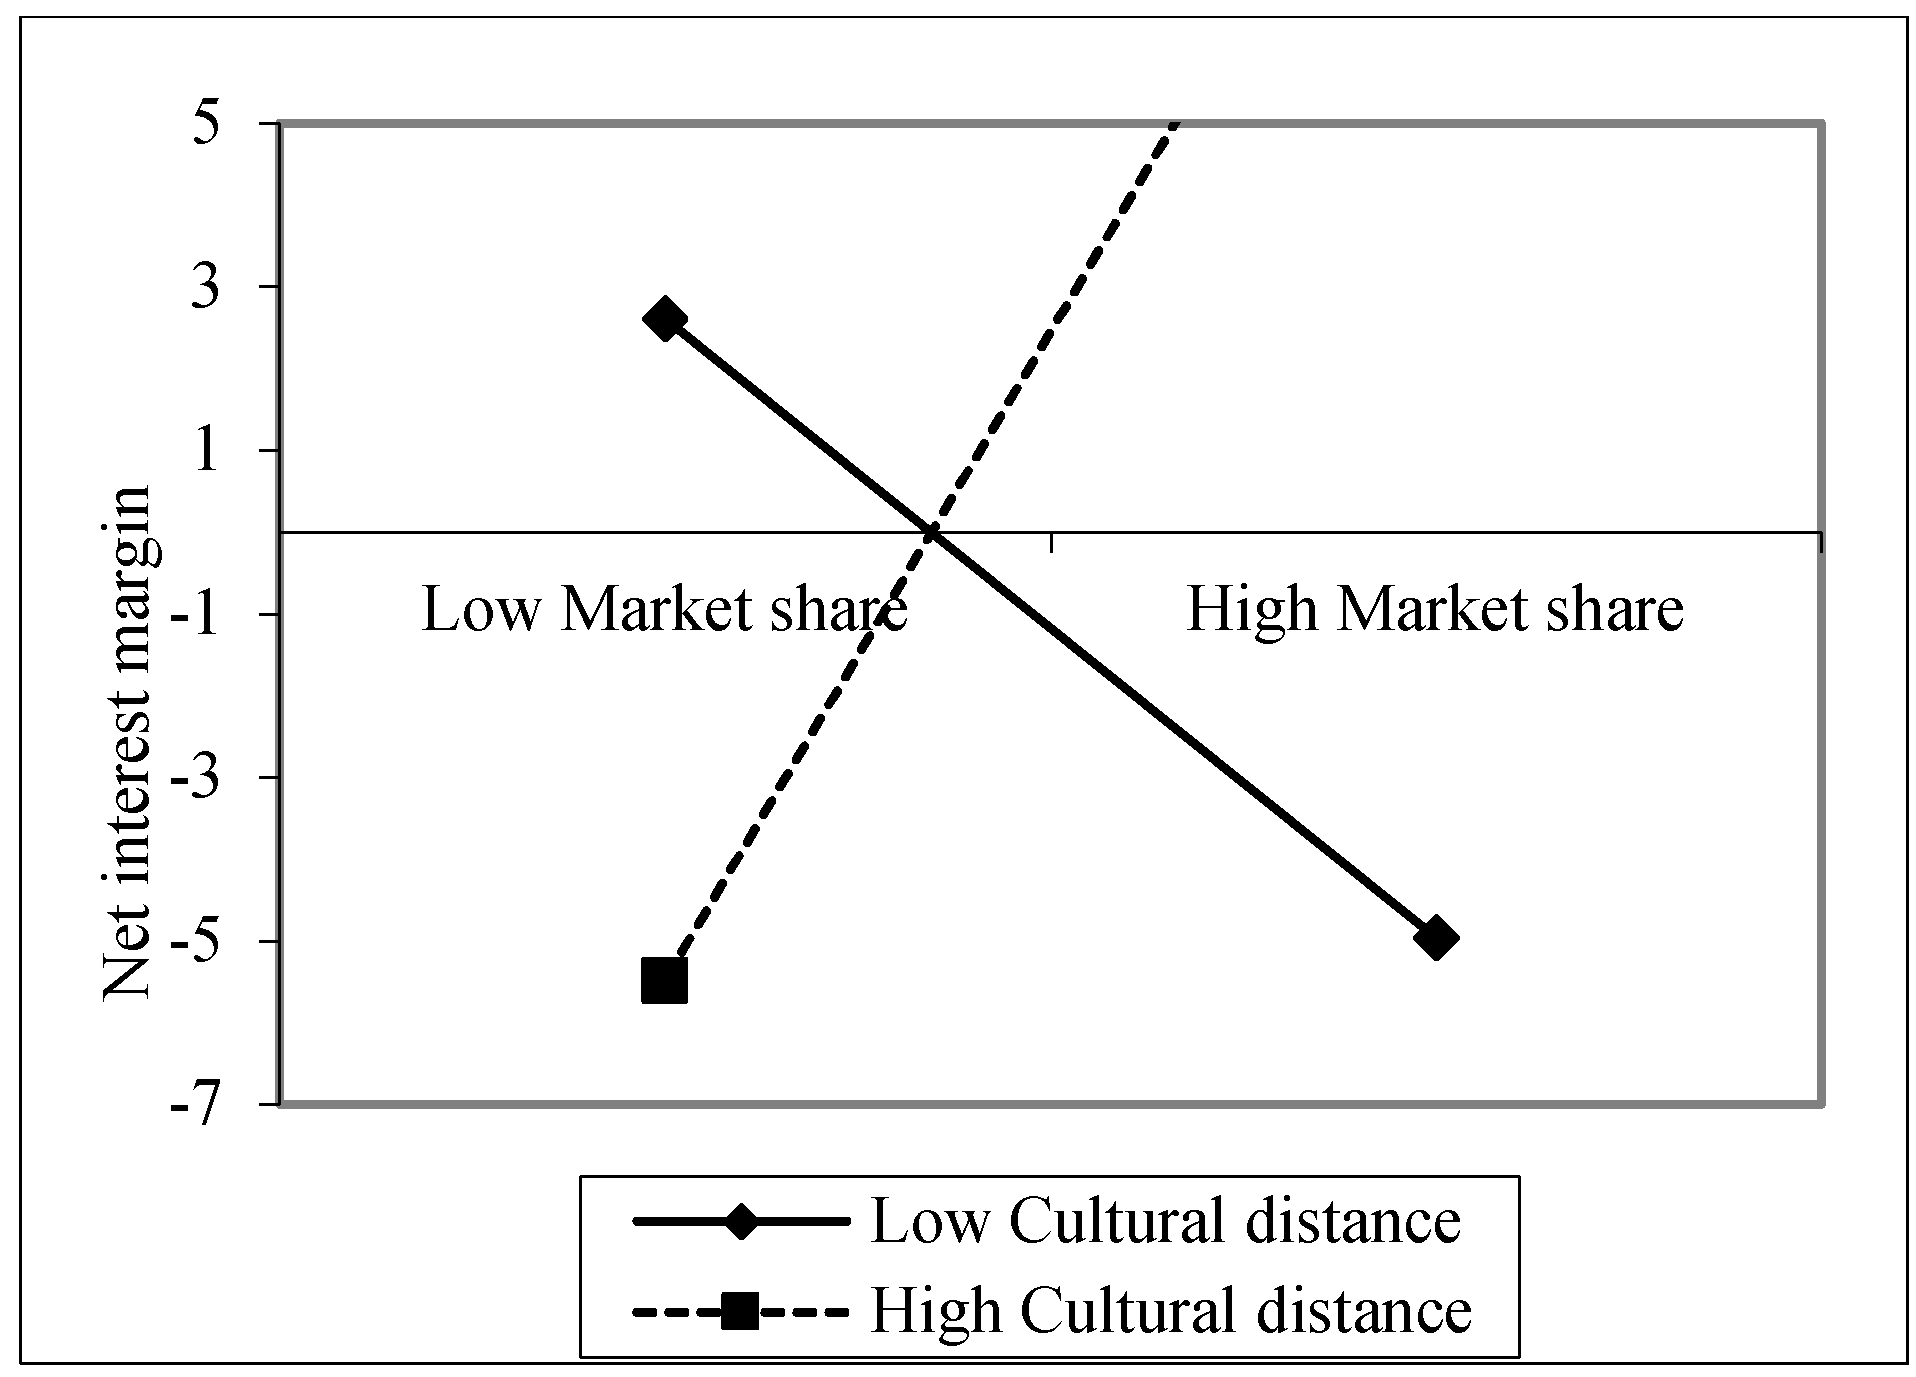
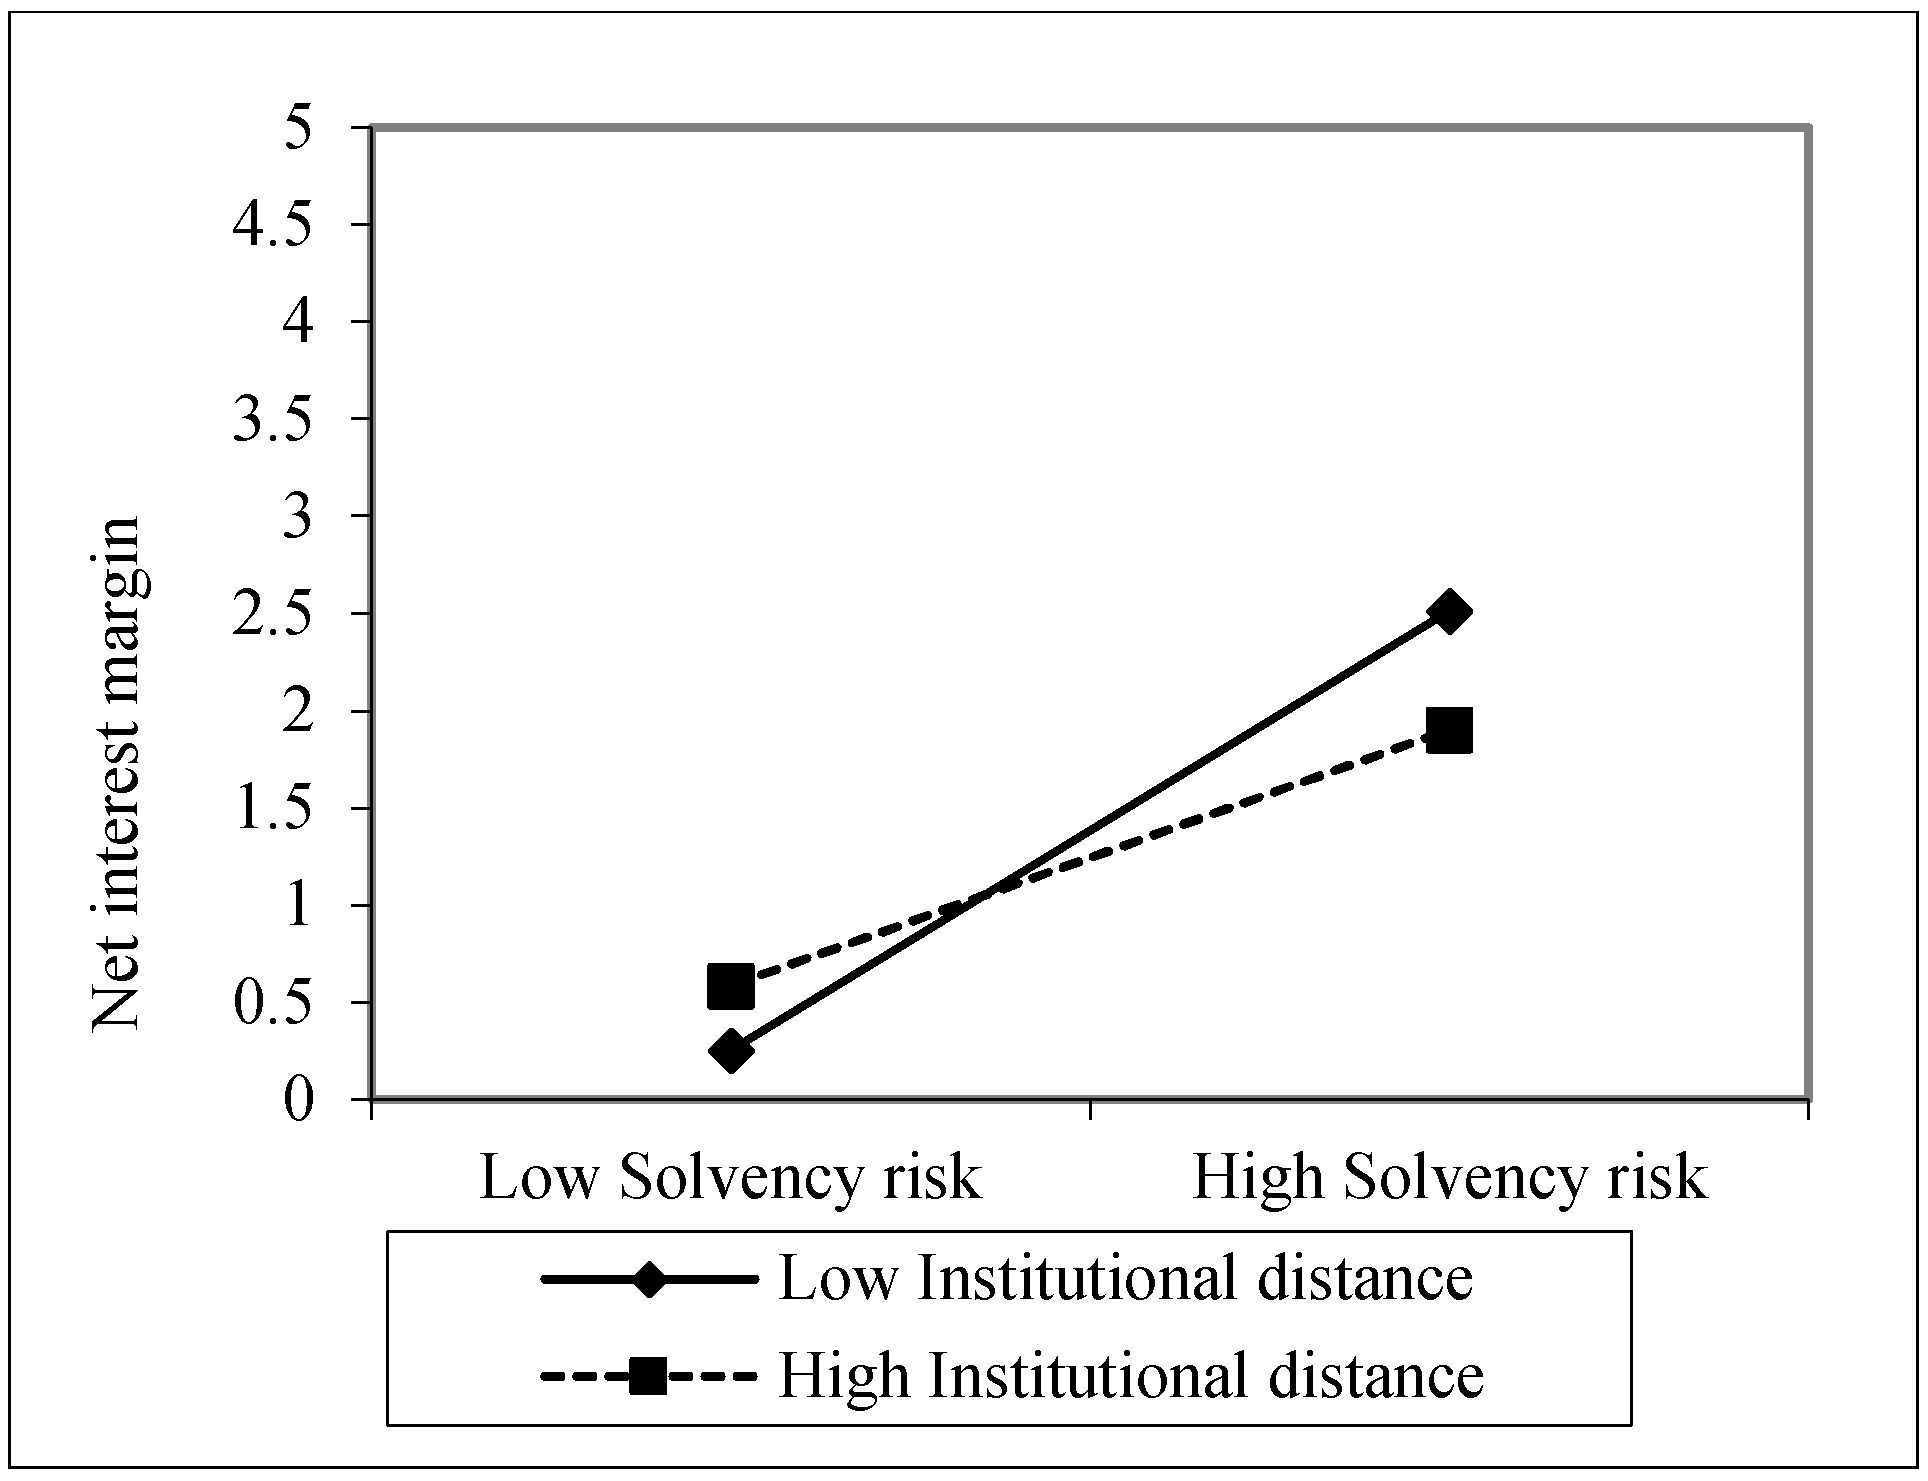
4.3. Further Analysis
5. Conclusions
Author Contributions
Funding
Institutional Review Board Statement
Informed Consent Statement
Data Availability Statement
Conflicts of Interest
References
- Allen, Franklin, Qian Jun, and Gu Xian. 2017. An overview of China’s financial system. Annual Review of Financial Economics 9: 191–231. [Google Scholar] [CrossRef]
- Arellano, Manuel, and Olympia Bover. 1995. Another Look at the Instrumental Variable Estimation of Error-Components Model. Journal of Econometrics 68: 29–51. [Google Scholar] [CrossRef] [Green Version]
- Baik, Bok, Jun-Koo Kang, Jin-Mo Kim, and Joonho Lee. 2013. The liability of foreignness in international equity investments: Evidence from the US stock market. Journal of International Business Studies 44: 391–411. [Google Scholar] [CrossRef]
- Bell, R. Greg, Igor Filatotchev, and Abdul A. Rasheed. 2012. The liability of foreignness in capital markets: Sources and remedies. Journal of International Business Studies 43: 107–22. [Google Scholar] [CrossRef] [Green Version]
- Benston, George J., Gerald A. Hanweck, and David P. Humphrey. 1982. Scale economies in banking. Journal of Money, Credit, and Banking 14: 435–56. [Google Scholar] [CrossRef]
- Berger, Allen N. 2007. International comparisons of banking efficiency. Financial Markets, Institutions & Instruments 16: 119–44. [Google Scholar]
- Berger, Allen N., Iftekhar Hasan, and Mingming Zhou. 2009. Bank ownership and efficiency in China: What will happen in the world’s largest nation? Journal of Banking & Finance 33: 113–30. [Google Scholar]
- CBRC. 2003. China Banking Regulatory Commission, Annual Report. Available online: https://www.cbirc.gov.cn/en/view/pages/ItemDetail.html?docId=1138 (accessed on 15 August 2018).
- Claessens, Stijn, and Neeltje Van Horen. 2012. Being a foreign among domestic banks: Asset or liability? Journal of Banking & Finance 36: 1276–90. [Google Scholar]
- Claessens, Stijn, Aslι Demirgüç-Kunt, and Harry Huizinga. 2001. How does foreign entry affect domestic banking markets? Journal of Banking & Finance 25: 891–911. [Google Scholar]
- Demirgüç-Kunt, Asli, Ross Levine, and Hong-Ghi Min. 1998. Opening to foreign banks: Issues of stability, efficiency, and growth. In The Implications of globalization of World Financial Marrket. Edited by by Allan Meltzer. Seoul: Bank of Korea, pp. 83–105. [Google Scholar]
- Eden, Lorraine, and Stewart R. Miller. 2004. Distance matters: Liability of foreignness, institutional distance and ownership strategy. In Advances in International Management. Edited by Joseph L. C. Cheng and Michael A. Hitt. New York: Elsevier, vol. 16, pp. 187–221. [Google Scholar]
- Elyasiani, Elyas, and Rasoul Rezvanian. 2002. The comparative multiproduct cost study of foreign-owned and domestic-owned US banks. Applied Financial Economics 12: 271–84. [Google Scholar] [CrossRef]
- Evans, Justin W. 2008. Challenging Confucius: Western banks in the Chinese credit care market. Business Horizons 51: 519–27. [Google Scholar] [CrossRef]
- Foo, Jennifer, and Dorota Witkowska. 2014. An efficiency comparison of Chinese banks: A multidimensional analysis. International Journal of Business 19: 44–62. [Google Scholar]
- Gaur, Ajai Singh, Vikas Kumar, and Ravi Sarathy. 2011. Liability of Foreignness and Internationalisation of Emerging Market Firms. In Dynamics of Globalization: Location-Specific Advantages or Liabilities of Foreignness? Advances in International Management. Edited by Christian Geisler Asmussen, Torben Pedersen, Timothy Devinney and Laszlo Tihanyi. Bingley: Emerald Group Publishing Limited, vol. 24, pp. 211–33. [Google Scholar]
- Goldberg, E. S. 1983. Size, growth, and transnationality among the world’s largest banks. Journal of Business 56: 187–201. [Google Scholar]
- Gischer, Horst, and D. Johannes Juttner. 2003. Global competition, fee income and interest rate margins of banks. Kredit und Kapital 36: 368–94. [Google Scholar]
- Heritage Foundation. 2013. Index of Economic Freedom. Washington, DC: The Heritage Foundation. [Google Scholar]
- Hofstede, Geert. 2001. Culture’s Consequences: Comparing Values, Behaviors, Institutionas and Organiztions across Nations, 2nd ed. Thousands Oaks: Sage. [Google Scholar]
- Howson, Nicholas C., and Lester Ross. 2003. Foreign minority equity investments in Chinese Commercial Banks. The China Business Review 30: 18–23. [Google Scholar]
- Hymer, Stephen H. 1976. The International Operations of National Firms: A Study of Direct Investment. Cambridge: MIT Press. First published 1960. [Google Scholar]
- Jiang, Fuming, Lixian Liu, and Bruce W. Stening. 2014. Do foreign firms in Chian incur a liability of foreignness? The local Chinese firm’s perspective. Thunderbird International Business Review 56: 501–18. [Google Scholar] [CrossRef] [Green Version]
- Johanson, Jan, and Jan-Erik Vahlne. 1977. The internationalization process of the firm: A model of knowledge development and increasing foreign market commitments. Journal of International Business Studies 8: 23–32. [Google Scholar] [CrossRef]
- Kogut, Bruce, and Harbir Singh. 1988. The effect of national culture on the choice of entry mode. Journal of International Business Studies 19: 411–32. [Google Scholar] [CrossRef]
- Kumbhakar, Subal C., and Dan Wang. 2007. Economic reforms, efficiency and productivity in Chinese banking. Journal of Regulatory Economics 32: 105–29. [Google Scholar] [CrossRef]
- Leung, Man-Kwong. 1997. Foreign banks in the People’s Republic of China. Journal of Contemporary China 6: 365–76. [Google Scholar] [CrossRef]
- Leung, Man-Kwong, and Ricky Y. K. Chan. 2006. Are foreign banks sure winners in post-WTO China? Business Horizons 49: 221–34. [Google Scholar] [CrossRef]
- Leung, Man-Kwong, and Trevor Young. 2002. China’s entry to the WTO: Managerial implications for foreign banks. Managerial and Decision Economics 23: 1–8. [Google Scholar] [CrossRef]
- Levine, Ross. 1996. Foreign banks, financial development, and economic growth. In International Financial Markets. Edited by Claude E. Barfied. Washington, DC: AEI Press. [Google Scholar]
- Lin, Huidan. 2011. Foreign bank entry and firms’ access to bank credit: Evidence from China. Journal of Banking and Finance 35: 1000–10. [Google Scholar] [CrossRef]
- Liu, Lixian, and Milind Sathye. 2019. Bank interest rate margin, portfolio composition and institutional constraints. Journal of Risk and Financial Management 12: 121. [Google Scholar] [CrossRef] [Green Version]
- Lu, Qing, and Peter Hwang. 2010. The impact of liability of foreignness on international venture capital firms in Singapore. Asia Pacific Journal of Management 27: 81–97. [Google Scholar] [CrossRef]
- Luo, Yadong. 2007. From foreign investors to strategic insiders: Shifting parameters, prescriptions and paradigms for MNCs in China. Journal of World Business 42: 14–34. [Google Scholar] [CrossRef]
- Luo, Yadong, Oded Shenkar, and Mee-Kau Nyaw. 2002. Mitigating liabilities of foreignness: Defensive versus offensive approaches. Journal of International Management 8: 283–300. [Google Scholar] [CrossRef]
- Mehra, Ajay. 1996. Resource and market based determinants of performance in the U.S. banking industry. Strategic Management Journal 17: 307–22. [Google Scholar] [CrossRef]
- Meyer, Klaus E., Saul Estrin, Sumon Kumar Bhaumik, and Mike W. Peng. 2009. Institutions, resources and entry strategies in emerging economies. Strategic Management Journal 30: 61–80. [Google Scholar] [CrossRef] [Green Version]
- Miller, Stewart R., and Arvind Parkhe. 2002. Is there a liability of foreignness in global banking? An empirical test of banks’ X-efficiency. Strategic Management Journal 32: 55–75. [Google Scholar] [CrossRef]
- Miller, Stewart R., and Lorraine Eden. 2006. Local density and foreign subsidiary performance. Academy of Management Journal 49: 341–55. [Google Scholar] [CrossRef] [Green Version]
- Nachum, Lilach. 2003. Liability of foreignness in global competition? Financial service affiliates in the city of London. Strategic Management Journal 24: 1187–208. [Google Scholar] [CrossRef]
- Nachum, Lilach. 2010. When is foreignness an asset or a liability? Explaining the performance differential between foreign and local firms. Journal of Management 36: 714–39. [Google Scholar] [CrossRef]
- Ngai, Joseph Luc, John Qu, and Nicole Zhou. 2016. What is next for China’s booming fintech sector? In Disruption and Connection: Cracking the Myths of China Internet Finance Innovation. Beijing: McKinsey Greater China FIG Practice, July. [Google Scholar]
- Okuda, Hidenobu, and Suvadee Rungsomboon. 2006. Comparative cost study of foreign and Thai domestic banks in 1990–2002: Its policy implications for a desirable banking industry structure. Journal of Asian Economics 17: 714–37. [Google Scholar] [CrossRef] [Green Version]
- Saluja, Sushil. 2015. How Can China’s Banks Open up. World Economic Forum. Available online: https://www.weforum.org/agenda/2015/02/how-can-chinas-banks-open-up/?share=custom-1427468035 (accessed on 14 September 2020).
- Shaffer, Sherrill. 1989. Competition in the U.S. banking industry. Economics Letters 29: 321–23. [Google Scholar] [CrossRef]
- Shukla, Ravi K., and Gregory B. van Inwegen. 1995. Do locals perform better than foreigners? An analysis of US and US mutual fund managers. Journal of Economics and Business 47: 241–54. [Google Scholar] [CrossRef]
- Taussig, Markus. 2017. Foreignness as both a global asset and local liability: How host country idiosyncrasies and business activities matter. Journal of International Business Studies 48: 498–522. [Google Scholar] [CrossRef]
- Tschoegl, Adrian E. 1983. Concentration among international banks: A note. Journal of Banking and Finance 6: 567–78. [Google Scholar] [CrossRef]
- UNCTAD. 2005–2010. World Investment Report, Various Years. New York: United Nations. [Google Scholar]
- Walder, Andrew G. 1996. China’ transitional economy. In Studies on Contemporary China. Oxford: Oxford University Press. [Google Scholar]
- Walker, David A. 1983. U.S. banking regulations and foreign banks’ entry into the United States. Journal of Banking & Finance 7: 569–80. [Google Scholar]
- Williams, Barry. 2007. Factors determining net interest margins in Australia: Domestic and foreign banks. Financial Markets, Institutions & Instruments 16: 145–65. [Google Scholar]
- Yu, Jisun, and Sung Soo Kim. 2013. Understanding liability of foreignness in an Asian business context: A study of the Korean asset management industry. Asia Pacific Journal of Management 30: 1191–217. [Google Scholar] [CrossRef]
- Zaheer, Srilata. 1995. Overcoming the liability of foreignness. Academy of Management Journal 38: 341–63. [Google Scholar]
- Zaheer, Srilata, and Elaine Mosakowski. 1997. The dynamics of the liability of foreignness: A global study of survival in financial services. Strategic Management Journal 18: 439–64. [Google Scholar] [CrossRef]


| Variables | Descriptions |
|---|---|
| Dependent Variables: | |
| Net-interest Margin | Interest incomes to total assets |
| ROA | Return on assets |
| ROE | Return on equity |
| Control Variables: | |
| Bank size | Natural logarithm of total assets |
| Bank age | Years of operation since establishment |
| Location-based advantage (home-based advantage) variables: | |
| Bank Branches | Total number of branches of the bank in China. |
| Market Concentration | Measured by HHI |
| Market Share | Bank assets to total assets of all banks in the industry |
| Bank-specific advantage variables: | |
| Financial strength: | |
| Capital Strength | Tier 1 Capital Ratio |
| Liquidity risk | Total loans to Assets |
| Credit Risk | Loan loss provisions to total loans. |
| Solvency Risk | Total equities to total assets |
| Impaired Loan Ratio | Impaired loans to gross loans |
| Scale and Productivity Benefit | Overhead expenses to total assets |
| Non-Traditional Activity | Non-interest income to gross revenues |
| Intensity of International Activity | Off-balance-sheet activities to total assets |
| Liability of foreignness characteristics variable: | |
| Foreignness: | |
| Local or Foreign Bank | 1 for foreign banks, otherwise 0 |
| Cultural Distance | The difference between the host country (China) to the other 14 foreign countries and districts |
| Institutional Distance | The difference between the host country’s (China) governance index to the other 14 foreign countries and districts |
| Economic Freedom Distance | The difference between the host country’s (China) economic freedom index and the other 14 foreign countries and districts |
| Net Interest Margin | Bank Age | Bank Size (Million CNY) | Bank Branches | Market Share | Market Concentration | Capital Strength | Liquidity Risk | Credit Risk | Solvency Risk | Impaired Loan Ratio | Non-Traditional Activity | Scale and Productivity Benefit | Intensity of International Activity | |
|---|---|---|---|---|---|---|---|---|---|---|---|---|---|---|
| 5 Large State-Controlled Commercial Banks | ||||||||||||||
| Mean | 2.398 | 38.378 | 5,665,252.000 | 17,024.560 | 0.105 | 1307.016 | 9.067 | 0.556 | 0.007 | 5.151 | 9.478 | 16.350 | 0.013 | 0.143 |
| Standard Deviation | 0.689 | 29.563 | 5,326,544.000 | 9000.379 | 0.037 | 382.247 | 2.332 | 0.068 | 0.003 | 2.845 | 10.941 | 14.156 | 0.011 | 0.075 |
| Minimum | 0.963 | 2.000 | 38,511.500 | 105.000 | 0.034 | 420.632 | 4.770 | 0.442 | 0.001 | −13.710 | 0.860 | −19.220 | 0.004 | 0.025 |
| Maximum | 6.941 | 104.000 | 22,200,000.000 | 36,138.000 | 0.189 | 1794.081 | 13.480 | 0.732 | 0.016 | 10.190 | 39.600 | 56.920 | 0.070 | 0.322 |
| Count | 112 | 119 | 119 | 52 | 63 | 63 | 44 | 119 | 87 | 119 | 66 | 112 | 116 | 84 |
| 32 Joint-Stock Commercial Banks | ||||||||||||||
| Mean | 2.522 | 14.282 | 716,341.100 | 337.066 | 0.010 | 1341.417 | 21.515 | 0.496 | 0.006 | 7.710 | 3.928 | 14.642 | 0.014 | 0.223 |
| Standard Deviation | 1.018 | 10.655 | 1,205,403.000 | 349.235 | 0.010 | 358.022 | 61.245 | 0.129 | 0.041 | 8.412 | 9.656 | 48.286 | 0.013 | 0.135 |
| Minimum | −1.415 | 0.000 | 476.514 | 1.000 | 0.000 | 420.632 | −1.470 | 0.091 | −0.692 | −1.320 | 0.000 | −829.550 | 0.001 | 0.000 |
| Maximum | 8.102 | 61.000 | 6,298,325.000 | 1787.000 | 0.037 | 1794.081 | 446.000 | 0.793 | 0.069 | 64.800 | 99.300 | 124.720 | 0.105 | 1.175 |
| Count | 382 | 401 | 401 | 168 | 282 | 282 | 204 | 401 | 296 | 401 | 257 | 382 | 384 | 256 |
| 80 Urban Commercial Banks | ||||||||||||||
| Mean | 2.964 | 12.135 | 102,896.000 | 87.045 | 0.001 | 1291.627 | 10.596 | 0.485 | 0.009 | 6.276 | 2.764 | 14.420 | 0.011 | 0.185 |
| Standard Deviation | 1.125 | 5.269 | 176,587.400 | 63.601 | 0.001 | 368.140 | 3.453 | 0.111 | 0.007 | 2.374 | 6.925 | 14.372 | 0.004 | 0.115 |
| Minimum | 0.396 | 1.000 | 20.213 | 4.000 | 0.000 | 420.632 | 0.780 | 0.168 | −0.002 | −6.420 | 0.000 | −5.640 | 0.004 | 0.000 |
| Maximum | 8.560 | 30.000 | 1,844,909.000 | 362.000 | 0.009 | 1794.081 | 39.150 | 0.792 | 0.059 | 23.590 | 100.000 | 79.430 | 0.037 | 0.872 |
| Count | 767 | 786 | 786 | 289 | 717 | 717 | 525 | 786 | 704 | 785 | 557 | 767 | 768 | 530 |
| 32 Rural Commercial Banks | ||||||||||||||
| Mean | 3.107 | 7.600 | 135,646.900 | 317.831 | 0.001 | 1189.962 | 11.544 | 0.499 | 0.009 | 7.021 | 3.276 | 15.206 | 0.011 | 0.065 |
| Standard Deviation | 0.853 | 9.374 | 148,645.100 | 444.878 | 0.001 | 346.254 | 2.357 | 0.080 | 0.008 | 2.140 | 4.586 | 14.434 | 0.003 | 0.085 |
| Minimum | 1.098 | 0.000 | 2559.946 | 16.000 | 0.000 | 420.632 | 3.180 | 0.235 | −0.008 | 0.530 | 0.130 | 0.000 | 0.005 | 0.000 |
| Maximum | 5.597 | 65.000 | 716,805.200 | 1771.000 | 0.004 | 1794.081 | 16.260 | 0.667 | 0.066 | 12.220 | 22.990 | 71.280 | 0.021 | 0.506 |
| Count | 166 | 170 | 170 | 71 | 170 | 170 | 97 | 170 | 156 | 170 | 112 | 166 | 168 | 104 |
| 41 Foreign-Owned Banks | ||||||||||||||
| Mean | 2.210 | 11.269 | 45,137.290 | 23.866 | 0.000 | 1233.323 | 35.800 | 0.477 | 0.004 | 20.922 | 1.793 | 24.783 | 0.015 | 0.200 |
| Standard Deviation | 0.959 | 10.952 | 62,832.110 | 62.894 | 0.001 | 378.065 | 45.450 | 0.188 | 0.011 | 16.919 | 7.533 | 52.017 | 0.008 | 0.158 |
| Minimum | 0.026 | 1.000 | 68.900 | 1.000 | 0.000 | 420.632 | 10.500 | 0.000 | −0.075 | 4.740 | 0.000 | −85.090 | 0.000 | 0.000 |
| Maximum | 7.244 | 58.000 | 425,764.000 | 504.000 | 0.003 | 1794.081 | 394.000 | 0.891 | 0.076 | 94.710 | 79.890 | 833.330 | 0.053 | 0.949 |
| Count | 313 | 316 | 316 | 231 | 303 | 303 | 209 | 315 | 303 | 316 | 212 | 313 | 312 | 257 |
| Total 190 Banks | ||||||||||||||
| Mean | 2.708 | 13.775 | 602,465.100 | 1227.052 | 0.007 | 1278.637 | 17.565 | 0.492 | 0.007 | 9.177 | 3.257 | 16.532 | 0.013 | 0.183 |
| Standard Deviation | 1.073 | 13.064 | 2,025,150.000 | 4720.142 | 0.022 | 368.924 | 34.766 | 0.129 | 0.020 | 9.983 | 7.942 | 33.690 | 0.008 | 0.131 |
| Minimum | −1.415 | 0.000 | 20.213 | 1.000 | 0.000 | 420.632 | −1.470 | 0.000 | −0.692 | −13.710 | 0.000 | −829.550 | 0.000 | 0.000 |
| Maximum | 8.560 | 104.000 | 22,200,000.000 | 36,138.000 | 0.189 | 1794.081 | 446.000 | 0.891 | 0.076 | 94.710 | 100.000 | 833.330 | 0.105 | 1.175 |
| Count | 1740 | 1792 | 1792 | 811 | 1535 | 1535 | 1079 | 1791 | 1546 | 1791 | 1204 | 1740 | 1748 | 1231 |
| Pairwise Groups | Net Interest Margin | Bank Size (Million CNY) | Bank Branches | Market Share | Market Concentration | Capital Strength | Liquidity Risk | Credit Risk | Solvency Risk | Impaired Loan Ratio | Non-Traditional Activity | Scale and Productivity Benefit | Intensity of International Activity |
|---|---|---|---|---|---|---|---|---|---|---|---|---|---|
| Joint stock vs. State-controlled | 1.16 | −31.48 *** | −46.05 *** | −78.75 *** | 0.27 | 2.28 | −4.55 *** | −0.54 | 3.09 ** | −5.24 *** | −0.41 | 0.5 | 5.05 *** |
| Urban vs. State-controlled | 5.45 *** | −38.05 *** | −49.39 *** | −92.05 *** | −0.25 | 0.29 | −5.67 *** | 1.09 | 1.37 | −6.61 *** | −0.56 | −3.2 | 2.9 ** |
| Rural vs. State-controlled | 5.19 *** | −31.98 *** | −41.35 *** | −83.23 *** | −1.57 | 0.39 | −3.86 ** | 0.9 | 1.67 | −5.12 *** | −0.45 | −2.2 | −4.18 *** |
| Foreign vs. State-controlled | −1.67 | −35.16 *** | −48.71 *** | −87.87 *** | −1.45 | 4.83 *** | −5.74 *** | −1.32 | 17.56 *** | −7 *** | 2.29 | 2.28 | 3.63 ** |
| Urban vs. Joint stock | 6.7 *** | −7.04 *** | −1.1 | −14.67 *** | −0.98 | −4.02 ** | −1.29 | 2.71 | −3.04 ** | −1.78 | −0.19 | −5.86 *** | −3.86 ** |
| Rural vs. Joint stock | 5.51 *** | −4.76 *** | −0.06 | −10.92 *** | −2.79 | −2.58 | 0.32 | 1.9 | −1.48 | −0.5 | −0.11 | −3.5 ** | −10.81 *** |
| Foreign vs. Joint stock | −4 ** | −6.27 *** | −1.33 | −13.36 *** | −2.82 | 4.25 *** | −1.83 | −1.16 | 20.57 *** | −2.81 ** | 3.84 ** | 2.53 | −2.03 |
| Rural vs. Urban | 0.83 | 0.25 | 0.8 | 0.28 | −2.39 | 0.23 | 1.35 | −0.06 | 0.74 | 0.81 | 0.03 | 0.75 | −8.95 *** |
| Foreign vs. Urban | −10.95 *** | −0.55 | −0.31 | −0.98 | −2.44 | 9.22 *** | −0.89 | −4.14 *** | 26.3 *** | −1.57 | 4.59 *** | 8.44 *** | 1.5 |
| Foreign vs. Rural | −8.71 *** | −0.62 | −0.99 | −0.98 | 0.29 | 6.13 *** | −1.83 | −2.91 | 18.58 *** | −1.84 | 3.32 ** | 5.52 *** | 9.25 *** |
| (1) | (2) | (3) | (4) | (5) | (6) | (7) | (8) | (9) | (10) | (11) | (12) | (13) | (14) | (15) | (16) | (17) | (18) | ||
|---|---|---|---|---|---|---|---|---|---|---|---|---|---|---|---|---|---|---|---|
| Net Interest Margin | (1) | 1 | |||||||||||||||||
| Bank Age | (2) | −0.046 | 1 | ||||||||||||||||
| Bank Size | (3) | −0.122 * | 0.480 * | 1 | |||||||||||||||
| Bank Branches | (4) | 0.007 | 0.484 * | 0.816 * | 1 | ||||||||||||||
| Market Share | (5) | −0.060 * | 0.566 * | 0.583 * | 0.673 * | 1 | |||||||||||||
| Market Concentration | (6) | −0.108 * | −0.142 * | −0.259 * | 0.027 | 0.032 | 1 | ||||||||||||
| Capital Strength | (7) | 0.018 | −0.052 | −0.324 * | −0.391 * | −0.071 * | −0.031 | 1 | |||||||||||
| Liquidity Risk | (8) | 0.177 * | 0.008 | −0.062 * | 0.209 * | 0.066 * | 0.364 * | −0.370 * | 1 | ||||||||||
| Credit Risk | (9) | 0.066 * | −0.008 | 0.051 * | 0.106 * | −0.008 | −0.045 | −0.355 * | 0.088 * | 1 | |||||||||
| Solvency Risk | (10) | 0.029 | −0.095 * | −0.480 * | −0.571 * | −0.120 * | −0.045 | 0.797 * | −0.173 * | −0.206 * | 1 | ||||||||
| Impaired Loan Ratio | (11) | −0.120 * | 0.058 * | 0.017 | 0.193 * | 0.116 * | 0.107 * | −0.082 * | 0.142 * | 0.082 * | −0.037 | 1 | |||||||
| Scale and Productivity Benefit | (12) | 0.173 * | −0.040 | −0.151 * | −0.355 * | −0.037 | 0.029 | 0.351 * | −0.013 | −0.018 | 0.262 * | 0.018 | 1 | ||||||
| Intensity of International Activity | (13) | 0.010 | 0.078 * | 0.043 | −0.034 | −0.043 | −0.018 | −0.173 * | 0.094 * | 0.008 | −0.071 * | −0.096 * | −0.014 | 1 | |||||
| Non-traditional Activity | (14) | −0.226 * | 0.046 | −0.054 * | −0.132 * | 0.007 | −0.068 * | 0.073 * | −0.078 * | −0.053 * | 0.140 * | 0.023 | 0.241 * | 0.017 | 1 | ||||
| Cultural Distance | (15) | −0.157 * | −0.084 * | −0.298 * | −0.561 * | −0.1079 * | −0.062 * | 0.294 * | −0.182 * | −0.081 * | 0.528 * | −0.060 * | 0.210 * | −0.018 | 0.181 * | 1 | |||
| Institutional Distance | (16) | −0.210 * | −0.071 * | −0.264 * | −0.544 * | −0.1302 * | −0.059 * | 0.207 * | −0.063 * | −0.086 * | 0.410 * | −0.116 * | 0.170 * | 0.078 * | 0.132 * | 0.713 * | 1 | ||
| Economic Freedom Distance | (17) | −0.160 * | −0.056 * | −0.207 * | −0.393 * | −0.1096 * | −0.048 | 0.115 * | 0.027 | −0.060 * | 0.269 * | −0.106 * | 0.114 * | 0.115 * | 0.059 * | 0.390 * | 0.887 * | 1 | |
| Foreignness | (18) | −0.218 * | −0.085 * | −0.326 * | −0.621 * | −0.1393 * | −0.063 * | 0.253 * | −0.050 * | −0.085 * | 0.520 * | −0.085 * | 0.160 * | 0.068 * | 0.115 * | 0.763 * | 0.942 * | 0.804 * | 1 |
| (1) | (2) | (3) | (4) | (5) | (6) | |
|---|---|---|---|---|---|---|
| Variables | Model 1 | Model 2 | Model 3 | Model 4 | Model 5 | Model 6 |
| Lag Net Interest Margin | 0.673 *** | 0.568 *** | 0.432 *** | 0.478 *** | 0.534 *** | 0.557 *** |
| (0.103) | (0.0568) | (0.0795) | (0.0764) | (0.0634) | (0.0744) | |
| Control Variables | ||||||
| Bank Age | −0.00316 | 0.00431 | 0.00103 | 0.00103 | −0.00129 | −9.27 × 10⁻⁵ |
| (0.00571) | (0.00300) | (0.00498) | (0.00437) | (0.00447) | (0.00489) | |
| Bank Size | −0.0595 | −0.00115 | −0.0814 * | −0.0753 * | −0.0643 | −0.0246 |
| (0.0436) | (0.0349) | (0.0463) | (0.0403) | (0.0477) | (0.0354) | |
| Location-Based Advantages | ||||||
| Bank Branches | −0.0366 | 0.0488 | 0.0682 ** | 0.0803 ** | 0.0866 ** | |
| (0.0782) | (0.0468) | (0.0300) | (0.0403) | (0.0356) | ||
| Market Share | 4.323 | 1.019 | −0.203 | 0.384 | −1.856 | |
| (3.158) | (2.690) | (2.596) | (2.660) | (2.343) | ||
| Market Concentration | 0.00101 *** | 0.000563 | 0.000786 ** | 0.000856 | 0.00153 | |
| (0.000343) | (0.00283) | (0.000308) | (0.00208) | (0.00303) | ||
| Bank-Specific Advantages | ||||||
| Capital Strength | −0.00869 | −0.0241 *** | −0.0259 *** | −0.0268 *** | −0.0306 *** | |
| (0.00811) | (0.00629) | (0.00660) | (0.00636) | (0.00674) | ||
| Liquidity Risk | 0.674 | 0.505 | 0.266 | 0.00105 | −0.413 | |
| (0.486) | (0.448) | (0.451) | (0.457) | (0.485) | ||
| Credit Risk | 24.56 *** | 15.43 ** | 15.83 ** | 17.65 *** | 19.88 *** | |
| (8.735) | (6.717) | (6.463) | (5.936) | (6.492) | ||
| Solvency Risk | 0.0254 | 0.0638 *** | 0.0541 *** | 0.0565 *** | 0.0720 *** | |
| (0.0163) | (0.0155) | (0.0165) | (0.0164) | (0.0193) | ||
| Impaired Loan Ratio | −0.00906 | −0.00352 | −0.00208 | −0.00459 | −0.00526 | |
| (0.0130) | (0.00711) | (0.00649) | (0.00905) | (0.00837) | ||
| Non-Traditional Activity | −0.0245 *** | −0.0217 *** | −0.0207 *** | −0.0225 *** | −0.0227 *** | |
| (0.00405) | (0.00389) | (0.00432) | (0.00377) | (0.00348) | ||
| Scale and Productivity Benefit | 33.09 ** | 55.45 *** | 53.07 *** | 49.77 *** | 44.41 ** | |
| (14.24) | (19.47) | (19.43) | (16.96) | (17.18) | ||
| Intensity of International Activity | 0.0929 | −0.110 | −0.0508 | −0.0977 | −0.169 | |
| (0.324) | (0.376) | (0.246) | (0.360) | (0.264) | ||
| Cost of LOF | ||||||
| Foreignness | −0.614 *** | |||||
| (0.168) | ||||||
| Institutional Distance | −0.104 *** | |||||
| (0.0323) | ||||||
| Economic Freedom Distance | −0.0347 ** | |||||
| (0.0135) | ||||||
| Cultural Distance | −0.0398 | |||||
| (0.0973) | ||||||
| Constant | 0 | 0.0790 | 0.495 | 0 | −0.446 | 0 |
| (0) | (0.630) | (5.115) | (0) | (3.048) | (0) | |
| Observations | 711 | 723 | 433 | 433 | 433 | 433 |
| Number of Banks | 153 | 140 | 110 | 110 | 110 | 110 |
| p-Value of AR (1) test | 0.004 | 0.000 | 0.001 | 0.001 | 0.000 | 0.001 |
| p-Value of AR (2) test | 0.895 | 0.860 | 0.771 | 0.901 | 0.911 | 0.940 |
| p-Value of Hansen test | 0.032 | 1.000 | 1.000 | 1.000 | 1.000 | 1.000 |
| (1) | (2) | |
|---|---|---|
| Variables | Model 1 | Model 2 |
| Lag Net Interest Margin | 0.400 *** | 0.337 *** |
| (0.0688) | (0.0798) | |
| Control Variables | ||
| Bank Age | −0.00249 | 0.00301 |
| (0.00386) | (0.00491) | |
| Bank Size | −0.0932 * | −0.0860 * |
| (0.0535) | (0.0493) | |
| Location-Based Advantages | ||
| Bank Branches | 0.0385 | 0.0669 |
| (0.0555) | (0.0490) | |
| Market Share | 3.286 | −0.800 |
| (2.783) | (2.971) | |
| Market Concentration | 0.00149 | −0.000572 |
| (0.00367) | (0.000940) | |
| Bank-Specific Advantages | ||
| Capital Strength | −0.0221 *** | −0.0267 |
| (0.00636) | (0.0510) | |
| Liquidity Risk | 0.473 | 1.016 |
| (0.658) | (0.777) | |
| Credit Risk | 14.41 ** | 28.49 *** |
| (6.933) | (6.745) | |
| Solvency Risk | 0.0662 *** | 0.117 * |
| (0.0113) | (0.0590) | |
| Impaired Loan Ratio | −0.00750 | −0.00863 |
| (0.00993) | (0.0161) | |
| Non-Traditional Activity | −0.0229 *** | −0.0213 *** |
| (0.00308) | (0.00616) | |
| Scale and Productivity Benefit | 59.78 *** | 80.44 ** |
| (13.15) | (35.31) | |
| Intensity of International Activity | −0.146 | −0.0313 |
| (0.278) | (0.554) | |
| Moderator | ||
| Foreignness | −0.893 ** | 0.481 |
| (0.438) | (0.725) | |
| Interaction Terms | ||
| Bank Branches × Foreignness | −0.0172 | |
| (0.103) | ||
| Market Share × Foreignness | 348.0 * | |
| (181.0) | ||
| Market Concentration × Foreignness | 3.75 × 10⁻⁵ | |
| (0.000173) | ||
| Capital Strength × Foreignness | 0.0158 | |
| (0.0515) | ||
| Liquidity Risk × Foreignness | −0.487 | |
| (0.753) | ||
| Credit Risk × Foreignness | −21.94 | |
| (13.23) | ||
| Solvency Risk × Foreignness | −0.0826 | |
| (0.0606) | ||
| Impaired Loan Ratio × Foreignness | −0.0466 | |
| (0.0536) | ||
| Scale and Productivity Benefit × Foreignness | −36.01 | |
| (38.38) | ||
| Non-traditional Activity × Foreignness | 0.00389 | |
| (0.00767) | ||
| Intensity of International Activity × Foreignness | −0.296 | |
| (0.786) | ||
| Constant | 0 | 0 |
| (0) | (0) | |
| Observations | 433 | 433 |
| Number of Banks | 110 | 110 |
| p-Value of AR (1) test | 0.000 | 0.000 |
| p-Value of AR (2) test | 0.915 | 0.902 |
| p-Value of Hansen test | 1.000 | 1.000 |
| (1) | (2) | |
|---|---|---|
| Variables | Model 1 | Model 2 |
| Lag Net Interest Margin | 0.455 *** | 0.445 *** |
| (0.0709) | (0.0726) | |
| Control Variables | ||
| Bank Age | −0.000928 | 0.000601 |
| (0.00457) | (0.00496) | |
| Bank Size | −0.0913 * | −0.0680 |
| (0.0491) | (0.0506) | |
| Location-Based Advantages | ||
| Bank Branches | 0.0757 | 0.0646 |
| (0.0481) | (0.0517) | |
| Market Share | 2.213 | 0.0823 |
| (4.318) | (3.594) | |
| Market Concentration | 0.000552 | 0.000365 |
| (0.00281) | (0.00260) | |
| Bank-Specific Advantages | ||
| Capital Strength | −0.0269 *** | −0.0341 *** |
| (0.00713) | (0.0109) | |
| Liquidity Risk | 0.430 | 0.677 |
| (0.432) | (0.816) | |
| Credit Risk | 17.55 *** | 29.52 *** |
| (5.800) | (7.198) | |
| Solvency Risk | 0.0576 *** | 0.0997 *** |
| (0.0179) | (0.0259) | |
| Impaired Loan Ratio | −0.00341 | −0.00413 |
| (0.00889) | (0.0135) | |
| Non-Traditional Activity | −0.0220 *** | −0.0245 *** |
| (0.00272) | (0.00497) | |
| Scale and Productivity Benefit | 61.88 *** | 44.89 |
| (17.89) | (30.81) | |
| Intensity of International Activity | −0.152 | −0.00923 |
| (0.257) | (0.511) | |
| Moderator | ||
| Institutional Distance | −0.0413 | 0.108 |
| (0.105) | (0.154) | |
| Interaction Terms | ||
| Bank Branches × Institutional Distance | −0.0417 ** | |
| (0.0209) | ||
| Market Share × Institutional Distance | 120.8 ** | |
| (47.30) | ||
| Market Concentration × Institutional Distance | −3.08 × 10⁻⁵ | |
| (4.66 × 10⁻⁵) | ||
| Capital Strength × Institutional Distance | 0.00355 | |
| (0.00421) | ||
| Liquidity Risk × Institutional Distance | −0.198 | |
| (0.228) | ||
| Credit Risk × Institutional Distance | −8.166 ** | |
| (3.872) | ||
| Solvency Risk × Institutional Distance | −0.0172 * | |
| (0.00966) | ||
| Impaired Loan Ratio × Institutional Distance | −0.000636 | |
| (0.0168) | ||
| Scale and Productivity Benefit × Institutional Distance | −1.002 | |
| (6.829) | ||
| Non-traditional Activity × Institutional Distance | 0.00237 | |
| (0.00157) | ||
| Intensity of International Activity × Institutional Distance | −0.0792 | |
| (0.192) | ||
| Constant | 0 | 0.430 |
| (0) | (4.386) | |
| Observations | 433 | 433 |
| Number of Banks | 110 | 110 |
| p-Value of AR (1) test | 0.001 | 0.000 |
| p-Value of AR (2) test | 0.982 | 0.645 |
| p-Value of Hansen test | 1.000 | 1.000 |
| (1) | (2) | |
|---|---|---|
| Variables | Model 1 | Model 2 |
| Lag Net Interest Margin | 0.508 *** | 0.566 *** |
| (0.0683) | (0.0851) | |
| Control Variables | ||
| Bank Age | 0.000188 | 0.00377 |
| (0.00319) | (0.00404) | |
| Bank Size | −0.0692 | −0.0194 |
| (0.0524) | (0.0533) | |
| Location-Based Advantages | ||
| Bank Branches | 0.0743 ** | 0.0440 |
| (0.0305) | (0.0396) | |
| Market Share | 0.800 | −1.697 |
| (3.459) | (3.695) | |
| Market Concentration | −8.52 × 10⁻⁵ | −0.000413 |
| (0.00123) | (0.000776) | |
| Bank-Specific Advantages | ||
| Capital Strength | −0.0239 *** | −0.0317 *** |
| (0.00630) | (0.0106) | |
| Liquidity Risk | 0.367 | 0.377 |
| (0.494) | (0.713) | |
| Credit Risk | 18.56 *** | 30.38 *** |
| (5.298) | (6.723) | |
| Solvency Risk | 0.0460 *** | 0.0622 *** |
| (0.0172) | (0.0139) | |
| Impaired Loan Ratio | −0.00168 | −0.0133 |
| (0.00980) | (0.0170) | |
| Non-Traditional Activity | −0.0222 *** | −0.0267 *** |
| (0.00364) | (0.00467) | |
| Scale and Productivity Benefit | 53.74 *** | 30.69 |
| (17.65) | (26.42) | |
| Intensity of International Activity | 0.00141 | 0.363 |
| (0.343) | (0.476) | |
| Moderator | ||
| Economic Freedom Distance | 0.0360 | −0.0257 |
| (0.0516) | (0.0758) | |
| Interaction Terms | ||
| Bank Branches × Economic Freedom Distance | −0.0246 ** | |
| (0.0116) | ||
| Market Share × Economic Freedom Distance | 49.03 ** | |
| (19.38) | ||
| Market Concentration × Economic Freedom Distance | −2.86 × 10⁻⁵ | |
| (2.28 × 10⁻⁵) | ||
| Capital Strength × Economic Freedom Distance | 0.000871 | |
| (0.00201) | ||
| Liquidity Risk × Economic Freedom Distance | −0.0418 | |
| (0.116) | ||
| Credit Risk × Economic Freedom Distance | −1.189 | |
| (1.754) | ||
| Solvency Risk × Economic Freedom Distance | 0.000681 | |
| (0.00425) | ||
| Impaired Loan Ratio × Economic Freedom Distance | −0.0115 | |
| (0.00817) | ||
| Scale and Productivity Benefit × Economic Freedom Distance | 1.146 | |
| (3.948) | ||
| Non-traditional Activity × Economic Freedom Distance | 0.00169 ** | |
| (0.000732) | ||
| Intensity of International Activity × Economic Freedom Distance | −0.0826 | |
| (0.0550) | ||
| Constant | 0 | 1.339 |
| (0) | (1.567) | |
| Observations | 433 | 433 |
| Number of Banks | 110 | 110 |
| p-Value of AR (1) test | 0.000 | 0.000 |
| p-Value of AR (2) test | 0.999 | 0.646 |
| p-Value of Hansen test | 1.000 | 1.000 |
| (1) | (2) | |
|---|---|---|
| Variables | Model 1 | Model 2 |
| Lag Net Interest Margin | 0.498 *** | 0.528 *** |
| (0.0622) | (0.0663) | |
| Control Variables | ||
| Bank Age | −0.000699 | 0.000746 |
| (0.00419) | (0.00860) | |
| Bank Size | −0.0386 | −0.0358 |
| (0.0463) | (0.0968) | |
| Location-Based Advantages | ||
| Bank Branches | 0.106 * | 0.0737 |
| (0.0607) | (0.0774) | |
| Market Share | 0.918 | −1.050 |
| (3.409) | (4.732) | |
| Market Concentration | −0.000166 | 9.28 × 10⁻⁵ |
| (0.00294) | (0.00669) | |
| Bank-Specific Advantages | ||
| Capital Strength | −0.0307 *** | −0.0479 *** |
| (0.00604) | (0.0153) | |
| Liquidity Risk | −0.139 | 0.378 |
| (0.555) | (1.150) | |
| Credit Risk | 23.06 *** | 25.54 ** |
| (6.172) | (11.60) | |
| Solvency Risk | 0.0819 *** | 0.109 ** |
| (0.0151) | (0.0520) | |
| Impaired Loan Ratio | −0.00417 | −0.00819 |
| (0.00929) | (0.0194) | |
| Non-Traditional Activity | −0.0238 *** | −0.0245 *** |
| (0.00337) | (0.00638) | |
| Scale and Productivity Benefit | 35.98 ** | 42.47 |
| (14.02) | (34.74) | |
| Intensity of International Activity | −0.138 | −0.246 |
| (0.270) | (0.691) | |
| Moderator | ||
| Cultural Distance | −0.0525 | −0.0127 |
| (0.138) | (0.495) | |
| Interaction Terms | ||
| Bank Branches × Cultural Distance | −0.0702 ** | |
| (0.0282) | ||
| Market Share × Cultural Distance | 298.1 *** | |
| (87.67) | ||
| Market Concentration × Cultural Distance | 2.84 × 10⁻⁵ | |
| (7.61 × 10⁻⁵) | ||
| Capital Strength × Cultural Distance | 0.0164 * | |
| (0.00843) | ||
| Liquidity Risk × Cultural Distance | −0.109 | |
| (0.638) | ||
| Credit Risk × Cultural Distance | −6.720 | |
| (11.18) | ||
| Solvency Risk × Cultural Distance | −0.0325 | |
| (0.0197) | ||
| Impaired Loan Ratio × Cultural Distance | −0.00307 | |
| (0.0661) | ||
| Scale and Productivity Benefit × Cultural Distance | −6.010 | |
| (14.24) | ||
| Non-traditional Activity × Cultural Distance | 0.00493 | |
| (0.00496) | ||
| Intensity of International Activity × Cultural Distance | 0.0293 | |
| (0.586) | ||
| Constant | 0 | 0 |
| (0) | (0) | |
| Observations | 433 | 433 |
| Number of Banks | 110 | 110 |
| p-Value of AR (1) test | 0.000 | 0.000 |
| p-Value of AR (2) test | 0.704 | 0.680 |
| p-Value of Hansen test | 1.000 | 1.000 |
| (1) | (2) | (3) | (4) | |
|---|---|---|---|---|
| Variables | Model 1 | Model 2 | Model 3 | Model 4 |
| Lag Net Interest Margin | 0.369 ** | 0.418 *** | 0.342 | 0.405 * |
| (0.139) | (0.128) | (0.281) | (0.210) | |
| Control Variables | ||||
| Bank Age | 0.00339 | 0.00420 | 0.000923 | 0.00553 |
| (0.00722) | (0.00708) | (0.0107) | (0.00745) | |
| Bank Size | −0.193 | −0.166 * | −0.108 | −0.148 |
| (0.126) | (0.0912) | (0.281) | (0.106) | |
| Location-Based Advantages | ||||
| Bank Branches | 0.0990 | 0.0435 | 0.0240 | 0.0317 |
| (0.188) | (0.0927) | (0.427) | (0.121) | |
| Market Share | 0.337 | 2.086 | 2.852 | 1.616 |
| (7.231) | (5.423) | (14.09) | (5.895) | |
| Market Concentration | 0.00190 ** | 0.00139 * | 0.00136 | 0.00162 |
| (0.000736) | (0.000799) | (0.00196) | (0.00111) | |
| Bank-Specific Advantages | ||||
| Capital Strength | −0.0221 | 0.000130 | −0.0151 | 0.00126 |
| (0.0446) | (0.0569) | (0.152) | (0.0591) | |
| Liquidity Risk | −0.229 | 0.645 | 0.692 | −0.0702 |
| (1.731) | (2.422) | (3.946) | (2.582) | |
| Credit Risk | 11.59 | 8.048 | 10.27 | 7.348 |
| (11.58) | (12.23) | (22.29) | (15.44) | |
| Solvency Risk | 0.0460 | 0.00121 | 0.0294 | −0.0199 |
| (0.0824) | (0.0745) | (0.193) | (0.110) | |
| Impaired Loan Ratio | −0.00443 | −0.00262 | −0.0194 | −0.0139 |
| (0.0424) | (0.0523) | (0.0533) | (0.0545) | |
| Non-Traditional Activity | −0.00620 | −0.00815 | −0.0161 | −0.00936 |
| (0.00931) | (0.00753) | (0.0151) | (0.00958) | |
| Scale and Productivity Benefit | 25.33 | 51.26 | 35.47 | 47.42 |
| (51.24) | (43.84) | (81.25) | (41.53) | |
| Intensity of International Activity | 0.151 | 0.463 | 0.182 | 0.234 |
| (0.582) | (0.625) | (0.611) | (0.600) | |
| Moderator | ||||
| Foreignness | 1.934 | |||
| (6.650) | ||||
| Institutional Distance | 0.760 | |||
| (1.671) | ||||
| Economic Freedom Distance | 2.038 | |||
| (3.557) | ||||
| Cultural Distance | 1.905 | |||
| (1.720) | ||||
| Interaction Terms | ||||
| Bank Branches × Foreignness | −0.230 | |||
| (0.323) | ||||
| Market Share × Foreignness | −111.2 | |||
| (461.0) | ||||
| Market Concentration × Foreignness | −0.00101 | |||
| (0.00387) | ||||
| Bank Branches × Institutional Distance | −0.0814 | |||
| (0.0882) | ||||
| Market Share × Institutional Distance | 11.13 | |||
| (98.43) | ||||
| Market Concentration × Institutional Distance | −0.000428 | |||
| (0.00106) | ||||
| Bank Branches × Economic Freedom Distance | −0.234 | |||
| (0.333) | ||||
| Market Share × Economic Freedom Distance | 180.4 | |||
| (282.2) | ||||
| Market Concentration × Economic Freedom Distance | −0.00103 | |||
| (0.00196) | ||||
| Bank Branches × Cultural Distance | −0.338 | |||
| (0.385) | ||||
| Market Share × Cultural Distance | −176.5 | |||
| (354.6) | ||||
| Market Concentration × Cultural Distance | −0.000636 | |||
| (0.000935) | ||||
| Constant | 0 | 0 | 0 | 0 |
| (0) | (0) | (0) | (0) | |
| Observations | 100 | 100 | 100 | 100 |
| Number of Banks | 39 | 39 | 39 | 39 |
| p-Value of AR (1) test | 0.062 | 0.058 | 0.103 | 0.112 |
| p-Value of AR (2) test | 0.831 | 0.960 | 0.955 | 0.953 |
| p-Value of Hansen test | 1.000 | 1.000 | 1.000 | 1.000 |
| (1) | (2) | (3) | (4) | |
|---|---|---|---|---|
| Variables | Model 1 | Model 2 | Model 3 | Model 4 |
| Lag Net Interest Margin | 0.318 *** | 0.339 *** | 0.358 *** | 0.381 *** |
| (0.0790) | (0.0953) | (0.0973) | (0.0706) | |
| Control Variables | ||||
| Bank Age | 0.000991 | 0.00134 | 0.00253 | −0.00740 |
| (0.00496) | (0.00425) | (0.00633) | (0.00550) | |
| Bank Size | −0.0394 | −0.0510 | 0.138 | −0.00979 |
| (0.0651) | (0.0679) | (0.0939) | (0.0745) | |
| Location-Based Advantages | ||||
| Bank Branches | 0.136 | 0.167 | 0.183 ** | 0.201 ** |
| (0.103) | (0.101) | (0.0842) | (0.0784) | |
| Market Share | −4.477 | −6.045 | −16.31 ** | −2.327 |
| (6.226) | (6.513) | (7.493) | (4.637) | |
| Market Concentration | 0.000508 | 0.000450 | 0.000213 | 0.000644 |
| (0.00129) | (0.00111) | (0.00101) | (0.00151) | |
| Bank-Specific Advantages | ||||
| Capital Strength | −0.0197 *** | −0.0232 *** | −0.00816 | −0.0305 *** |
| (0.00706) | (0.00805) | (0.0141) | (0.00740) | |
| Liquidity Risk | 1.453 * | 1.042 | 1.801 ** | −0.294 |
| (0.855) | (0.875) | (0.878) | (0.825) | |
| Credit Risk | 6.762 | 8.307 | 26.06 ** | 7.975 |
| (9.396) | (9.246) | (11.13) | (8.337) | |
| Solvency Risk | 0.0728 *** | 0.0655 *** | 0.0684 ** | 0.0923 *** |
| (0.0188) | (0.0206) | (0.0293) | (0.0199) | |
| Impaired Loan Ratio | 0.0455 | 0.0369 | −0.0826 | 0.0546 |
| (0.0655) | (0.0641) | (0.0624) | (0.0460) | |
| Non-Traditional Activity | −0.0291 *** | −0.0259 *** | −0.0261 *** | −0.0332 *** |
| (0.00458) | (0.00442) | (0.00564) | (0.00408) | |
| Scale and Productivity Benefit | 59.80 *** | 62.80 ** | 55.08 ** | 49.53 *** |
| (17.13) | (23.95) | (24.05) | (16.66) | |
| Intensity of International Activity | 0.490 | 0.482 | 0.225 | 0.379 |
| (0.320) | (0.310) | (0.567) | (0.348) | |
| Moderator | ||||
| Foreignness | −0.288 | |||
| (0.601) | ||||
| Institutional Distance | −0.0131 | |||
| (0.170) | ||||
| Economic Freedom Distance | 0.143 * | |||
| (0.0805) | ||||
| Cultural Distance | 0.108 | |||
| (0.184) | ||||
| Interaction Terms | ||||
| Bank Branches × Foreignness | −0.192 | |||
| (0.150) | ||||
| Market Share × Foreignness | 508.4 ** | |||
| (233.8) | ||||
| Market Concentration × Foreignness | 4.35 × 10⁻⁶ | |||
| (0.000212) | ||||
| Bank Branches × Institutional Distance | −0.0668 | |||
| (0.0439) | ||||
| Market Share × Institutional Distance | 145.4 * | |||
| (84.60) | ||||
| Market Concentration × Institutional Distance | 1.95 × 10⁻⁶ | |||
| (7.32 × 10⁻⁵) | ||||
| Bank Branches × Economic Freedom Distance | −0.0578 ** | |||
| (0.0232) | ||||
| Market Share × Economic Freedom Distance | 85.93 ** | |||
| (43.03) | ||||
| Market Concentration × Economic Freedom Distance | −5.20 × 10⁻⁵ | |||
| (3.62 × 10⁻⁵) | ||||
| Bank Branches × Cultural Distance | −0.111** | |||
| (0.0430) | ||||
| Market Share × Cultural Distance | 410.3 *** | |||
| (136.0) | ||||
| Market Concentration × Cultural Distance | −4.10 × 10⁻⁵ | |||
| (0.000111) | ||||
| Constant | 0 | 0 | −2.079 | 0.264 |
| (0) | (0) | (1.308) | (1.985) | |
| Observations | 288 | 288 | 288 | 288 |
| Number of Banks | 104 | 104 | 104 | 104 |
| p-Value of AR (1) test | 0.016 | 0.018 | 0.007 | 0.015 |
| p-Value of AR (2) test | 0.953 | 0.942 | 0.866 | 0.937 |
| p-Value of Hansen test | 0.905 | 0.934 | 0.570 | 0.975 |
| (1) | (2) | (3) | (4) | |
|---|---|---|---|---|
| Variables | Model 1 | Model 2 | Model 3 | Model 4 |
| Lag Net Interest Margin | 0.379 ** | 0.437 *** | 0.400 | 0.222 |
| (0.140) | (0.107) | (0.241) | (7.530) | |
| Control Variables | ||||
| Bank Age | 0.00137 | 0.00294 | 0.00722 | 0.00103 |
| (0.00809) | (0.00900) | (0.00883) | (0.0825) | |
| Bank Size | −0.170 | −0.168 | −0.148 | −0.190 |
| (0.130) | (0.107) | (0.128) | (4.057) | |
| Location-Based Advantages | ||||
| Bank Branches | 0.0577 | 0.114 | 0.0854 | 0.0643 |
| (0.0706) | (0.113) | (0.122) | (1.816) | |
| Market Share | 4.705 | 1.528 | 0.516 | 4.200 |
| (5.714) | (6.127) | (6.816) | (113.7) | |
| Market Concentration | 0.00115 | 0.000959 | 0.00112 | 0.00176 |
| (0.00110) | (0.000980) | (0.00115) | (0.0343) | |
| Bank-Specific Advantages | ||||
| Capital Strength | −0.0463 | −0.0580 | 0.00314 | −0.0617 |
| (0.0764) | (0.109) | (0.163) | (2.399) | |
| Liquidity Risk | 3.254 | 2.920 | 1.498 | 1.280 |
| (1.948) | (2.132) | (2.251) | (23.13) | |
| Credit Risk | 15.24 | 17.67 | 26.73 | 14.39 |
| (18.94) | (19.20) | (23.19) | (475.2) | |
| Solvency Risk | 0.0473 | 0.0651 | −0.0127 | 0.114 |
| (0.148) | (0.198) | (0.293) | (4.194) | |
| Impaired Loan Ratio | −0.0353 | −0.0300 | −0.0114 | −0.00654 |
| (0.0508) | (0.0574) | (0.0612) | (0.997) | |
| Non-Traditional Activity | −0.00660 | −0.00682 | −0.0155 | −0.0127 |
| (0.00892) | (0.0110) | (0.0102) | (0.0650) | |
| Scale and Productivity Benefit | −3.937 | −3.893 | 13.34 | 35.55 |
| (51.44) | (36.39) | (44.85) | (648.5) | |
| Intensity of International Activity | −0.190 | −0.121 | −0.0188 | −0.115 |
| (0.441) | (0.544) | (0.859) | (14.71) | |
| Moderator | ||||
| Foreignness | 2.791 | |||
| (3.731) | ||||
| Institutional Distance | 0.989 | |||
| (1.646) | ||||
| Economic Freedom Distance | 0.634 | |||
| (4.980) | ||||
| Cultural Distance | −2.058 | |||
| (39.99) | ||||
| Interaction Terms | ||||
| Capital Strength × Foreignness | 0.0157 | |||
| (0.136) | ||||
| Liquidity Risk × Foreignness | −7.709 | |||
| (5.664) | ||||
| Credit Risk × Foreignness | −45.51 | |||
| (63.57) | ||||
| Solvency Risk × Foreignness | 0.0664 | |||
| (0.287) | ||||
| Impaired Loan Ratio × Foreignness | −0.216 | |||
| (0.331) | ||||
| Scale and Productivity Benefit × Foreignness | 97.39 | |||
| (159.3) | ||||
| Non-traditional Activity × Foreignness | −0.0213 | |||
| (0.0569) | ||||
| Intensity of International Activity × Foreignness | −0.0354 | |||
| (4.542) | ||||
| Capital Strength × Institutional Distance | 0.0116 | |||
| (0.0726) | ||||
| Liquidity Risk × Institutional Distance | −2.198 | |||
| (2.556) | ||||
| Credit Risk × Institutional Distance | −16.00 | |||
| (21.43) | ||||
| Solvency Risk × Institutional Distance | 0.00979 | |||
| (0.139) | ||||
| Impaired Loan Ratio × Institutional Distance | −0.0877 | |||
| (0.131) | ||||
| Scale and Productivity Benefit × Institutional Distance | 22.04 | |||
| (51.00) | ||||
| Non-traditional Activity × Institutional Distance | −0.00724 | |||
| (0.0201) | ||||
| Intensity of International Activity × Institutional Distance | 0.0550 | |||
| (1.423) | ||||
| Capital Strength × Economic Freedom Distance | −0.0205 | |||
| (0.133) | ||||
| Liquidity Risk × Economic Freedom Distance | −0.964 | |||
| (7.152) | ||||
| Credit Risk × Economic Freedom Distance | −20.61 | |||
| (46.44) | ||||
| Solvency Risk × Economic Freedom Distance | 0.0442 | |||
| (0.251) | ||||
| Impaired Loan Ratio × Economic Freedom Distance | −0.0610 | |||
| (0.346) | ||||
| Scale and Productivity Benefit × Economic Freedom Distance | 4.524 | |||
| (50.49) | ||||
| Non-traditional Activity × Economic Freedom Distance | −0.00219 | |||
| (0.0418) | ||||
| Intensity of International Activity × Economic Freedom Distance | −0.116 | |||
| (0.637) | ||||
| Capital Strength × Cultural Distance | −0.0887 | |||
| (2.498) | ||||
| Liquidity Risk × Cultural Distance | −1.153 | |||
| (26.85) | ||||
| Credit Risk × Cultural Distance | 68.37 | |||
| (733.1) | ||||
| Solvency Risk × Cultural Distance | 0.0634 | |||
| (5.115) | ||||
| Impaired Loan Ratio × Cultural Distance | −0.377 | |||
| (1.512) | ||||
| Scale and Productivity Benefit × Cultural Distance | 315.0 | |||
| (3641) | ||||
| Non-traditional Activity × Cultural Distance | 0.00182 | |||
| (1.017) | ||||
| Intensity of International Activity × Cultural Distance | −12.17 | |||
| (56.56) | ||||
| Constant | 0 | 0 | 0 | 0 |
| (0) | (0) | (0) | (0) | |
| Observations | 100 | 100 | 100 | 100 |
| Number of Banks | 39 | 39 | 39 | 39 |
| p-Value of AR (1) test | 0.132 | 0.115 | 0.085 | 0.875 |
| p-Value of AR (2) test | 0.764 | 0.725 | 0.859 | 1.000 |
| p-Value of Hansen test | 1.000 | 1.000 | 1.000 | 1.000 |
| (1) | (2) | (3) | (4) | |
|---|---|---|---|---|
| Variables | Model 1 | Model 2 | Model 3 | Model 4 |
| L.Net Interest Margin | 0.260 *** | 0.380 *** | 0.362 *** | 0.443 *** |
| (0.0718) | (0.110) | (0.0834) | (0.111) | |
| Control Variables | ||||
| Bank Age | 0.0131 * | 0.0145 * | 0.00758 | 0.00156 |
| (0.00747) | (0.00806) | (0.00736) | (0.00923) | |
| Bank Size | 0.0328 | 0.0655 | 0.00527 | −0.0119 |
| (0.0776) | (0.0877) | (0.0777) | (0.0841) | |
| Location-Based Advantages | ||||
| Bank Branches | 0.103 | 0.0796 | 0.105 | 0.107 |
| (0.0662) | (0.0669) | (0.0680) | (0.0774) | |
| Market Share | −12.67 ** | −9.990 | −6.108 | −3.083 |
| (5.301) | (8.158) | (10.75) | (5.161) | |
| Market Concentration | 0.000177 | −0.000786 | −0.000228 | −0.000342 |
| (0.000866) | (0.000893) | (0.00102) | (0.000851) | |
| Bank-Specific Advantages | ||||
| Capital Strength | 0.0806 | −0.0231 | −0.0365 *** | −0.0511 ** |
| (0.0590) | (0.0278) | (0.0133) | (0.0224) | |
| Liquidity Risk | 2.214 *** | 1.607 | 1.547 | 1.450 |
| (0.684) | (0.997) | (1.092) | (0.931) | |
| Credit Risk | 25.97 *** | 28.33 ** | 34.37 *** | 32.59 * |
| (8.468) | (13.50) | (11.74) | (16.61) | |
| Solvency Risk | 7.20 × 10⁻⁵ | 0.0742 * | 0.0851 *** | 0.137 ** |
| (0.0783) | (0.0422) | (0.0253) | (0.0560) | |
| Impaired Loan Ratio | 0.00654 | 0.0128 | −0.0228 | −0.0657 |
| (0.0920) | (0.101) | (0.0782) | (0.0971) | |
| Non-Traditional Activity | −0.0406 *** | −0.0413 *** | −0.0376 *** | −0.0296 *** |
| (0.00971) | (0.00845) | (0.00572) | (0.00702) | |
| Scale and Productivity Benefit | 54.72 | 35.84 | 24.03 | 32.22 |
| (37.76) | (26.92) | (25.33) | (36.34) | |
| Intensity of International Activity | 0.443 | 0.129 | −0.0678 | −0.327 |
| (0.564) | (0.708) | (0.906) | (0.561) | |
| Moderator | ||||
| Foreignness | 1.615 | |||
| (1.003) | ||||
| Institutional Distance | 0.100 | |||
| (0.232) | ||||
| Economic Freedom Distance | −0.0692 | |||
| (0.190) | ||||
| Cultural Distance | 0.295 | |||
| (0.677) | ||||
| Interaction Terms | ||||
| Capital Strength × Foreignness | −0.0808 | |||
| (0.0607) | ||||
| Liquidity Risk × Foreignness | −3.013 ** | |||
| (1.453) | ||||
| Credit Risk × Foreignness | −40.74 ** | |||
| (18.54) | ||||
| Solvency Risk × Foreignness | 0.0102 | |||
| (0.0868) | ||||
| Impaired Loan Ratio × Foreignness | 0.0241 | |||
| (0.129) | ||||
| Scale and Productivity Benefit × Foreignness | −22.53 | |||
| (38.15) | ||||
| Non-traditional Activity × Foreignness | 0.0277 ** | |||
| (0.0134) | ||||
| Intensity of International Activity × Foreignness | −0.0799 | |||
| (0.824) | ||||
| Capital Strength × Institutional Distance | 0.00462 | |||
| (0.00838) | ||||
| Liquidity Risk × Institutional Distance | −0.426 | |||
| (0.402) | ||||
| Credit Risk × Institutional Distance | −10.31 * | |||
| (6.199) | ||||
| Solvency Risk × Institutional Distance | −0.0114 | |||
| (0.0140) | ||||
| Impaired Loan Ratio × Institutional Distance | 0.00656 | |||
| (0.0352) | ||||
| Scale and Productivity Benefit × Institutional Distance | −3.352 | |||
| (7.777) | ||||
| Non-traditional Activity × Institutional Distance | 0.00767 *** | |||
| (0.00286) | ||||
| Intensity of International Activity × Institutional Distance | 0.00551 | |||
| (0.214) | ||||
| Capital Strength × Economic Freedom Distance | 0.00417 ** | |||
| (0.00189) | ||||
| Liquidity Risk × Economic Freedom Distance | −0.235 | |||
| (0.259) | ||||
| Credit Risk × Economic Freedom Distance | −3.374 | |||
| (2.473) | ||||
| Solvency Risk × Economic Freedom Distance | −0.00199 | |||
| (0.00574) | ||||
| Impaired Loan Ratio × Economic Freedom Distance | 0.00497 | |||
| (0.0114) | ||||
| Scale and Productivity Benefit × Economic Freedom Distance | 3.785 | |||
| (4.408) | ||||
| Non-traditional Activity × Economic Freedom Distance | 0.00259 ** | |||
| (0.00128) | ||||
| Intensity of International Activity × Economic Freedom Distance | 0.0653 | |||
| (0.0884) | ||||
| Capital Strength × Cultural Distance | 0.0184 | |||
| (0.0119) | ||||
| Liquidity Risk × Cultural Distance | −0.828 | |||
| (0.940) | ||||
| Credit Risk × Cultural Distance | −13.45 | |||
| (11.36) | ||||
| Solvency Risk × Cultural Distance | −0.0420 ** | |||
| (0.0193) | ||||
| Impaired Loan Ratio × Cultural Distance | 0.0357 | |||
| (0.0478) | ||||
| Scale and Productivity Benefit × Cultural Distance | −8.403 | |||
| (12.36) | ||||
| Non-traditional Activity × Cultural Distance | 0.00703 | |||
| (0.00616) | ||||
| Intensity of International Activity × Cultural Distance | 0.263 | |||
| (0.417) | ||||
| Constant | 0 | 0.767 | 0 | 0 |
| (0) | (1.943) | (0) | (0) | |
| Observations | 288 | 288 | 288 | 288 |
| Number of Banks | 104 | 104 | 104 | 104 |
| p-Value of AR (1) test | 0.015 | 0.009 | 0.002 | 0.019 |
| p-Value of AR (2) test | 0.356 | 0.337 | 0.634 | 0.800 |
| p-Value of Hansen test | 1.000 | 0.999 | 1.000 | 1.000 |
Publisher’s Note: MDPI stays neutral with regard to jurisdictional claims in published maps and institutional affiliations. |
© 2021 by the authors. Licensee MDPI, Basel, Switzerland. This article is an open access article distributed under the terms and conditions of the Creative Commons Attribution (CC BY) license (https://creativecommons.org/licenses/by/4.0/).
Share and Cite
Liu, L.X.; Jiang, F.; Sathye, M.; Liu, H. Are Foreign Banks Disadvantaged Vis-À-Vis Domestic Banks in China? J. Risk Financial Manag. 2021, 14, 404. https://doi.org/10.3390/jrfm14090404
Liu LX, Jiang F, Sathye M, Liu H. Are Foreign Banks Disadvantaged Vis-À-Vis Domestic Banks in China? Journal of Risk and Financial Management. 2021; 14(9):404. https://doi.org/10.3390/jrfm14090404
Chicago/Turabian StyleLiu, Li Xian, Fuming Jiang, Milind Sathye, and Hongbo Liu. 2021. "Are Foreign Banks Disadvantaged Vis-À-Vis Domestic Banks in China?" Journal of Risk and Financial Management 14, no. 9: 404. https://doi.org/10.3390/jrfm14090404
APA StyleLiu, L. X., Jiang, F., Sathye, M., & Liu, H. (2021). Are Foreign Banks Disadvantaged Vis-À-Vis Domestic Banks in China? Journal of Risk and Financial Management, 14(9), 404. https://doi.org/10.3390/jrfm14090404