2. Literature Review
Over the past decade, scientists from different countries have been asking questions about which factors influence Consumer and Business Confidence. Depending on the specifics of the national economy, these can be either various factors, their different strength of action or different lags.
So, scientists from the Czech Republic
Malovaná et al. (
2021) wondered: What really does drive consumer confidence? They show that households’ expectations are tightly linked to current macroeconomic conditions. They constructed a novel index of households’ macroeconomic environment (HOME) based on the data from 22 high-income European countries in 2002–2018.
The authors
Yost et al. (
2020) studied the change in consumer confidence only on the example of restaurant performance. This study looks at the influence of cyclical fluctuations of the consumer confidence index (CCI) and the volatility index (VIX) as early-warning indicators of the variations in restaurant performance. The industry has traditionally focused on past data and on microeconomic influences to anticipate its future performance, a procedure that does not consider possible cyclical fluctuations in restaurant performance metrics. These fluctuations are driven by sentiments of consumers and investors. The study uses the cyclical component of the applied data, followed by unit root and cointegration testing, with subsequent application of the Limited Information Maximum Likelihood technique. The results show both indicators have an effect on restaurant performance, where VIX has an impact on the current, expected and overall restaurant performance, while the CCI’s influence is only partial (current performance).
Kilci (
2020) studied the evidence from Turkey 2012–2019 regarding have confidence indicators an impact on macro-financial indicators. The results indicated a strong relationship between financial services and real sector confidence indices in terms of macro-financial indicators (stock market index and inflation).
The primary aim of this study is to analyze the impact of financial services and real sector confidence indexes on some macroeconomic and financial indicators such as industrial production, inflation, stock market index, foreign exchange rates and interest rates in Turkey for the period from May 2012 to May 2019. In this study, the unit root properties of these series are tested by using the
Narayan and Popp (
2010) unit root test with two structural breaks and the
Enders and Lee (
2012) Fourier ADF unit root test with multiple structural breaks. The causal link between confidence indicators and macro-financial variables used the Fourier Toda Yamamoto causality test proposed by
Nazlioglu et al. (
2016). The results suggest a strong link between financial services and real sector confidence indexes on macro-financial indicators such as stock market index and inflation, supporting the evidence of the short-run impact of confidence indexes on these variables.
Neves et al. (
2016) studied the influence of the economic cycle on the unidirectional relationship between consumer confidence and PSI-20 returns on Portuguese evidence. The aim of this paper is to determine the relationship between market sentiment and rates of return on the main Portuguese benchmark and verify whether this relationship is influenced by different economic cycles. The results obtained suggest a one-way relationship between stock market returns and the sentiment variable. In fact, in times of recession, investor pessimism induces linear behavior and the sentiment-return relationship is more evident.
Yildirim and Zeren (
2014) studied the causality test of the relationship between consumer confidence index and online credit card use in Turkey.
In their study,
Demirel and Artan (
2017) analyzed causality relationships between the confidence level and the fundamental macroeconomic indicators using panel data analysis for 13 EU-countries for the period 2000–2014. According to the obtained results, a bidirectional causality relationship between the level of confidence and consumption expenditures, industrial production and inflation; a unidirectional relationship from the level of confidence to the unemployment rate (UNE); and a unidirectional relationship from interest rates to the level of confidence were detected. These results are compatible with the view that economic confidence is a leading indicator in explaining the changes in macroeconomic indicators.
In the article «Confidence indicators and economic developments» (
ECB Monthly Bulletin 2013), the strong correlations of consumer and business confidence indices with the main economic and financial variables show that these indicators are useful to monitor economic developments, as they are both timely and point to some leading properties with respect to “hard” data, without necessarily implying any causal relationship. The co-movements between consumer confidence and the other economic or financial variables rather point to the fact that common causes, possibly related to third factors (e.g., rare events producing financial or uncertainty shocks), could be at the origin of these changes, notably when they experience large swings. A more detailed analysis of the leading properties of survey-based indicators shows the existence of non-linearities in the relationships between confidence indices and economic variables. During normal times of economic activity, sentiment indicators are of limited help in forecasting future changes in economic variables, as they include information that is contained in other economic or financial data. However, these indices gain some predictive power during periods of tension when they feature large swings.
Kuzmanović and Sanfey (
2012) in their paper analyzed monthly data to examine the links between consumer confidence and real economic variables in Croatia.
In general, the issues of changes in consumer sentiment are oftener studied on the example of countries with average per capita incomes and below.
Scientists continued to study changes in consumer sentiment and with the unfolding of the COVID-19.
So, since the stock markets are the first to react to changes in the situation in the economy, most often they pay attention to the study of the dynamics of their indicators. In addition, this is facilitated by the availability of daily statistics, which is impossible in the case of studying the absolute majority of other market indicators.
The work of
Hassan and Gavilanes (
2021) confirms that the short-term negative impact of the rapid spread of the virus on stock index returns on the example of the most affected countries—China, USA, Spain, Italy, South Korea and Japan. The overall VAR estimate by the least squares method indicates a short-term negative impact of 2.3% on stock market performance, as the rate of spread of the coronavirus increases by 1% over time across countries, all other things being equal. Coronavirus infection rates are not statistically significant in explaining exchange rate fluctuations and rising gold prices in the analyzed countries.
Cagli (
2019) analyzes changes in the consumer confidence index as an indicator of investor sentiment and changes in the BIST-100 profit index (Borsa Istanbul stock returns). The results of the conventional Granger causality test indicate unidirectional Granger causality, ranging from BIST-100 to CCI at 10%.
According to
Nielsen Global Media (
2021) analysis Vietnam is ranked as the second most optimistic country in the world in the second quarter. Occupational safety has overtaken health and has become the number one issue among Vietnamese consumers. The economy was the third largest problem with record levels since the peak of 2014. Vietnamese consumers have become the world’s most avid shoppers.
Boettcher et al. (
2020) in December 2020 expected “double decline for private consumption in winter 2020/21. The corona pandemic saw a historic decline in private consumption in the second quarter. Unlike the 2009 GFC, this component of expenditure has failed to provide stability. In the fourth quarter, the recovery in private consumption is likely to slow down as the weakening and tightening of restrictions in early December. With vaccination coverage in the summer half of 2021, private consumption is expected to rebound sharply, leading to 4.7% growth for the year as a whole. Then the pre-crisis level of consumption can be reached again at the beginning of 2022”.
Thus, the literature review allows to draw several conclusions:
- (1)
consumer and business confidence indices are serious tools for forecasting macroeconomic changes;
- (2)
until now, there are no studies regarding the study of how reliable consumer and business confidence was in the initial period of the pandemic, especially in the context of countries with different levels of development;
- (3)
since different countries have allocated different funds to overcome problems with household and business income, there are insurmountable differences in the levels of medical care provided to patients with Covid-19 and in the levels of vaccination due to different access to vaccines, then don’t these factors primarily affect the expectations of consumers and businesses?
To answer abovementioned question, it is firstly important to study the level of health care in its dynamic development in individual countries.
Thus, the conceptual scheme of our investigation is as follows. First, we analyze the dynamics of developing the health systems by OECD countries, using annual indicators (this is the only available frequency). The goal of this is to find out whether there is real progress in the national health system of a particular country or a regression. However, of course, the very dynamics of development are reflected in the presence/absence of protecting the population against an extraordinary danger-a pandemic. Then, the question is raised whether progress/regression in the development of the health system determines the change like causal relationships, such as between Confidence indices and their natural manifestations in the form of the dynamics of production volumes or the level of unemployment) for a particular country in terms of changing their direction or lags. Or the change like causal relationships is due to other factors (not related to the state of health). For example, government support for households or businesses. Ultimately, we want to answer the question: what is more important for the expectations of the population and industry during the spread of the pandemic: the dynamics of the development of the health system or other factors?
3. Methods
For solving posed problems, several methods were used. So, the study of the state of the health care system as a synthetic indicator was carried out using calculations of the taxonomic indicator of the level of development (in Excel). Confidence indices are used as characteristics of consumer and business expectations.
To study the causal relationships between expectations and objective indicators based on Granger’s causal approach in EViews, after assessing data for stationarity using the Augmented Dickey-Fuller test (in Eviews). Consumer Price Index and Unemployment rate are used as indicators that can reflect the implementation of Consumer Confidence. And for Business Confidence, we used Production of total industry (Index).
Below is a detailed description of the methods used.
To assess the dynamics of the development of the health care system in different countries, we used the annual data on individual health indicators of the OECD countries for 2006–2019 (they do not publish indicators of health development in the poorest countries). And based on these data, taxonomic development coefficients were calculated (according to the Pluta W. and Hellwig Z. approach). To solve the problem of analysis in the dynamics of the synthetic concept of “state of the health care system”, an approach can be used, which is presented in the works of
Hellwig (
1968) and
Pluta (
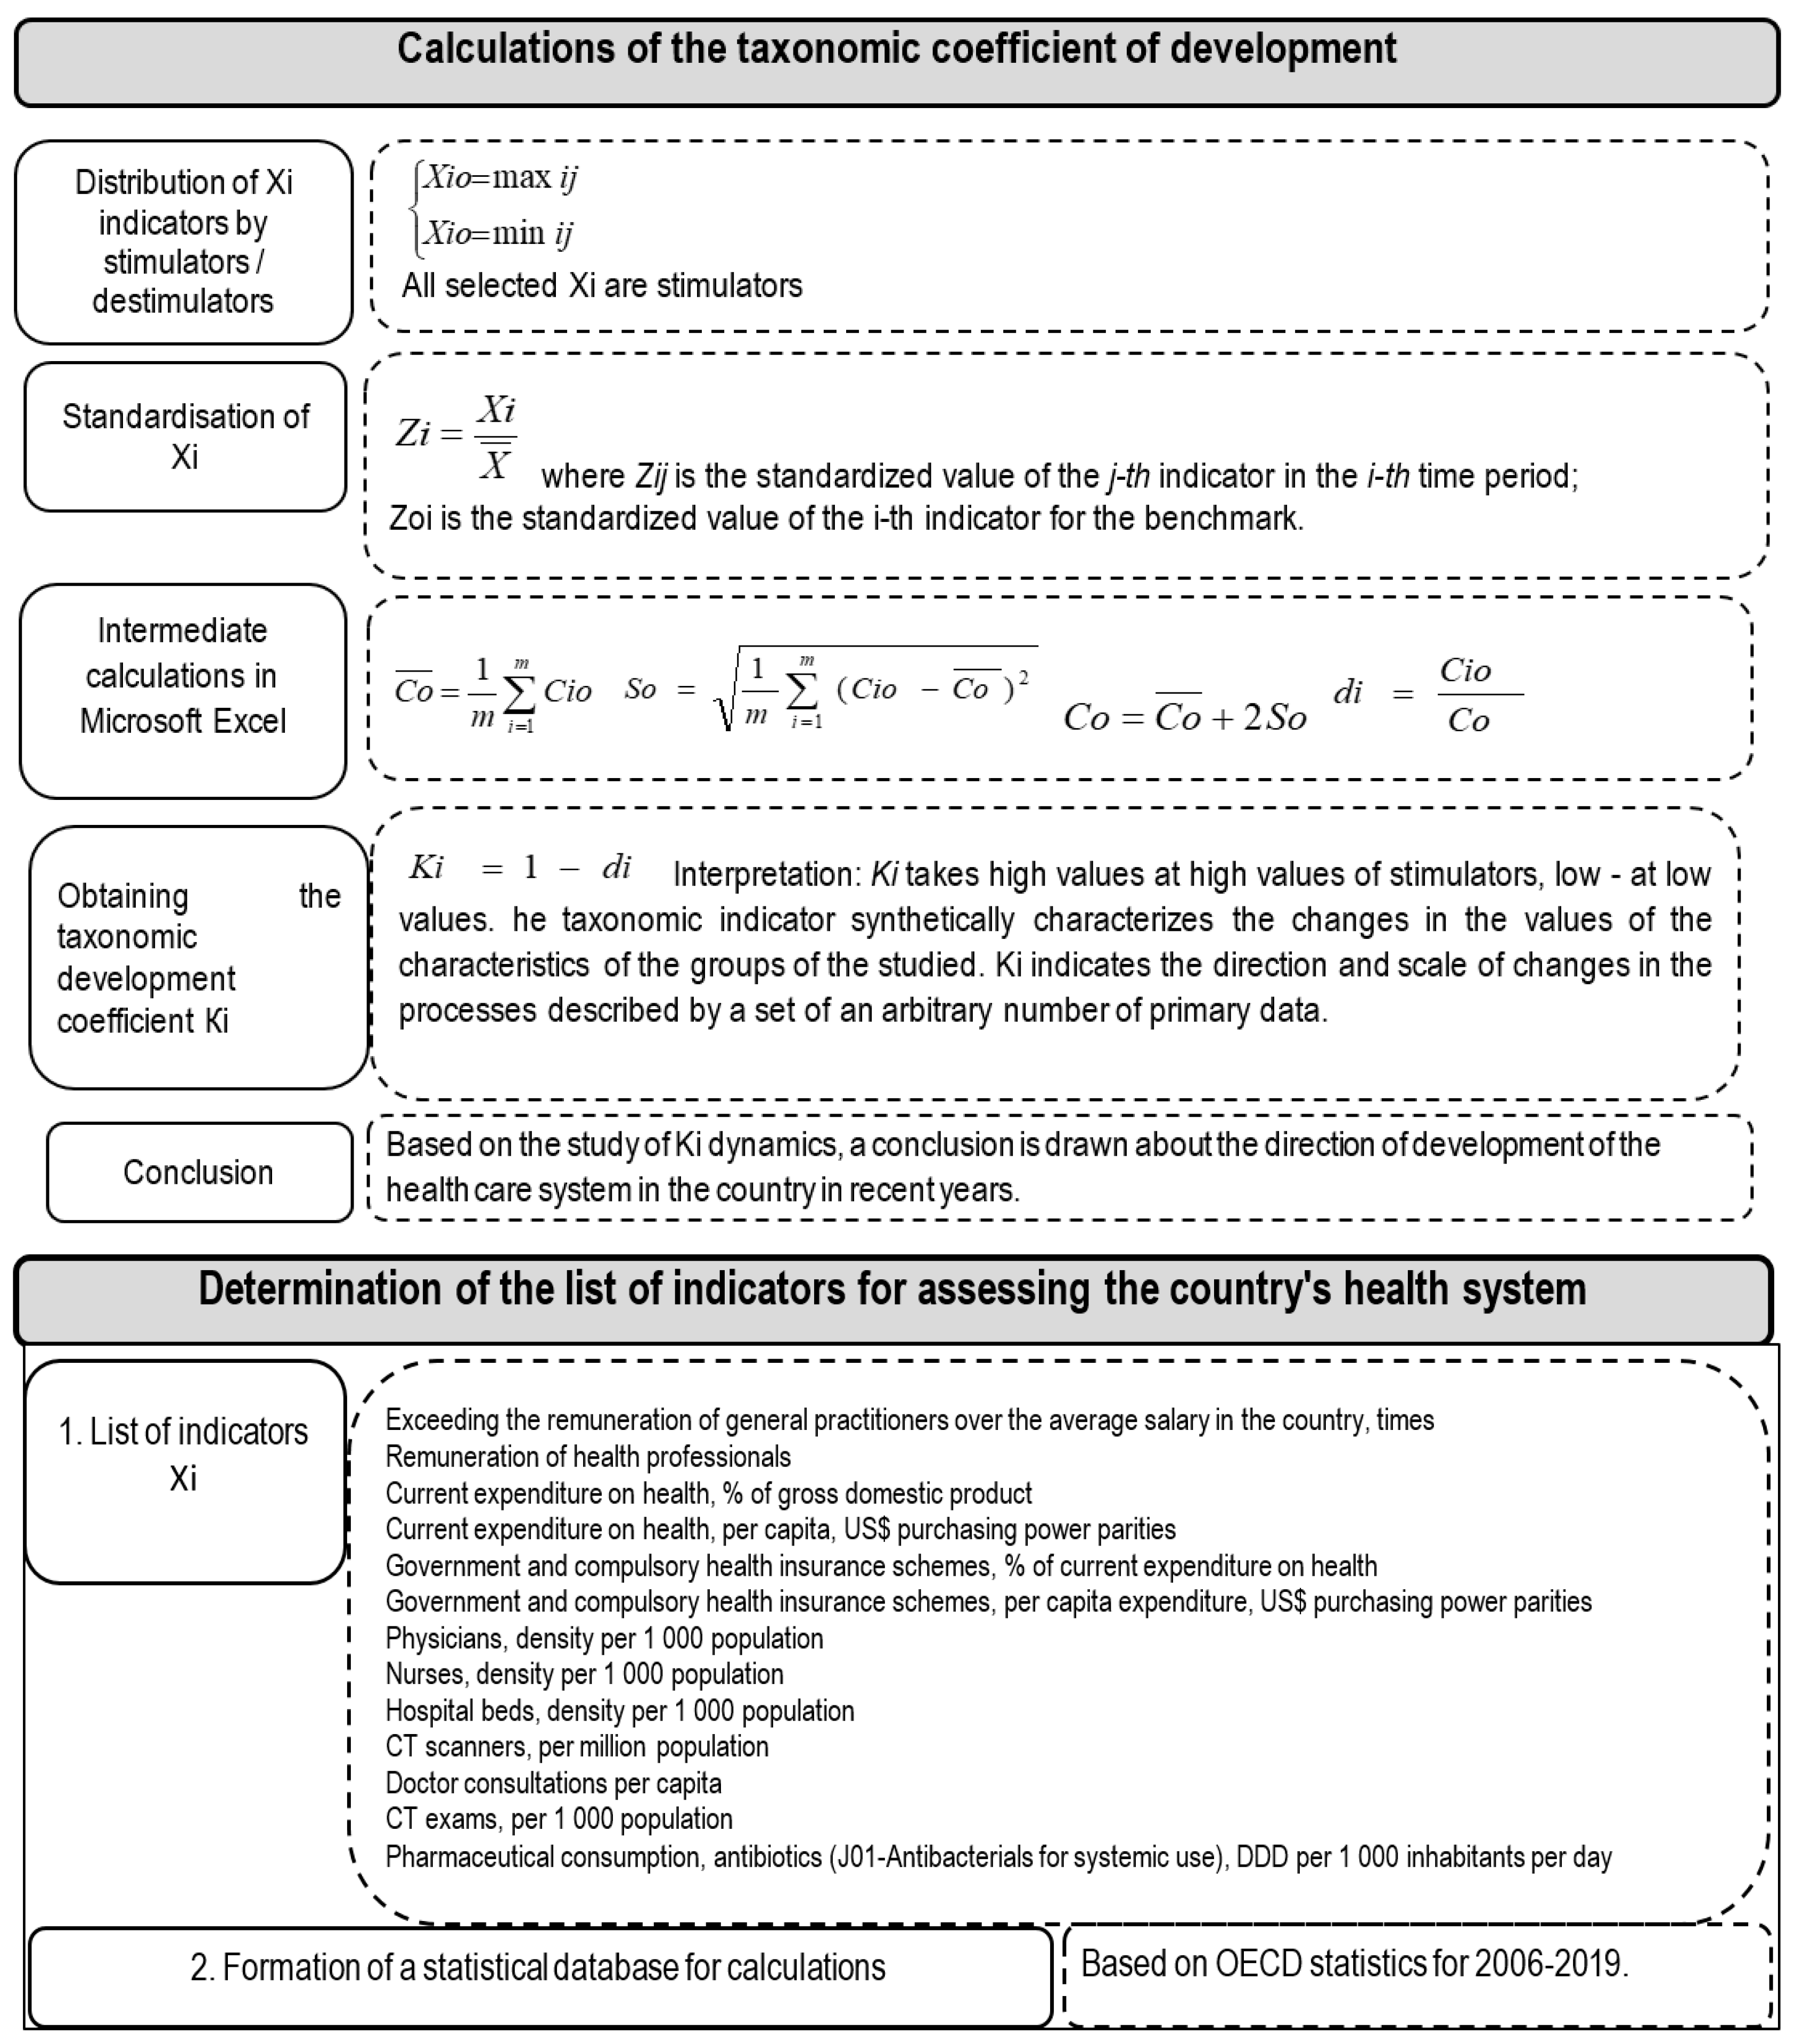
1980). These authors provide a rationale and a detailed description of the application of a taxonomic procedure aimed at calculating the taxonomic indicator of the development level Ki. The principle consists in finding the distance between the individual points-units and the point, which is the standard of development (“0”). The obtained spaces serve as initial values (in the formulas for intermediate calculations), which are used to calculate the indicator of the level of development. Formulas for calculations are presented below, in
Figure 1.
Calculations assume that a standardization procedure is used to eliminate the different influence of features with varying units of measurement and diverse scales of numbers. Also, from the point of view of the analysis of the synthetic indicator, the nature of the influence of each of the indicators on the synthetic is essential. To take this moment into account, they are divided into stimulants and de-stimulators used when building a development standard.
And Ki is interpreted in this way: the closer to 1, the more developed the specific unit is being studied; so, it is at a higher level of development. As an exception, with a probability close to zero, Ki may turn out to be >1.
In the work of Hellwig Z., the taxonomic development indicator was calculated to compare synthetic (i.e., complex) values that are “resultant” of all the characteristics that characterize the studied population—indicators of the qualifications of personnel in 15 countries (based on six different features).
In the work of
Pluta (
1980), the taxonomic indicator of the level of development was also used to analyze the properties of one unit, which develops over time. This formulation of the problem allows one to obtain a synthetic picture of the changes occurring in the values of this unit under study. Those Ki received in this way will allow studying the dynamics of the development process. It is this approach that we have taken to carry out calculations.
By the time the COVID-19 pandemic began to be announced, different countries had different levels of development of health systems. It is clear that the level of medical care for the infected depends on this.
Since there is no qualitative statistics on the state of health care in developing countries (and more often it is its complete absence), we can only analyze the indicators for the OECD countries (
OECD 2021). These are countries with average and high-level income per capita (according to the World Bank classification). 37 countries were distributed by us depending on the level of per capita income: more than 30 thousand US dollars (23 countries: Switzerland, Norway, Luxembourg, Iceland, USA, Ireland, Denmark, Sweden, Australia, Netherlands, Austria, Finland, Germany, Belgium, Canada, Israel, New Zealand, France, UK, Japan, Italy, Korea, Spain) and less than 30 thousand US dollars (14 countries: Slovenia, Estonia, Portugal, Czech Republic, Greece, Slovak Republic, Lithuania, Latvia, Hungary, Poland, Chile, Turkey, Mexico, Colombia).
Information on the state of health care systems in these countries is provided in the “Health Statistics” section of the OECD website (
OECD 2021).
For a certain part of these 37 countries in the context of 46 indicators from 5 groups (Health Expenditures, Health Resources, Medical Activity, Health Status/Mortality, Risk Factors) there are data for the period 1980–2019, although for some—only from 2006 (when they entered the EU). Therefore, for the purpose of further analysis, we used the indicators for 2006–2019, i.e., for 14 years. Since the indicators of life expectancy, potential years of life lost, suicide, alcohol, tobacco use and obesity (most of them are presented in several sections on the OECD website) are such that they depend more on the level of economic development of the country than on the health care system, then they are not used for further evaluation.
As a complex indicator that will characterize the development of the health care system as a whole, we use the taxonomic coefficient of development, the use of which for comparative multivariate analysis in economic research was described by
Pluta (
1980). Its calculation consists of several stages, listed in the diagram shown in
Figure 1.
We left 11 out of 46 indicators for calculations, adding the indicator “excess of remuneration of general practitioners over the average salary in the country (times)”. This indicator is not only a characteristic of doctors’ work motivation, but also, in a certain way, a criterion for making a decision to migrate to a country with better wages. All the indicators we used are stimulators (i.e., with their increase, we can talk about an improvement in the quality of the health care system).
In the vast majority of in developing countries, there is not enough dynamics on Confidence indices. In addition, these countries often do not calculate Confidence indices, but Sentiment indices or Purchasing Managers Index. And from the point of view of the analysis of consumer behavior for a longer term (in the future) the answers to the Consumer Confidence questions give a more valuable result than the consumer sentiment questions (because these are questions about right now behavior).
To study causal relationships using the Augmented Dickey-Fuller test, we used data on Confidence indices and economic indicators for 12 months from the beginning of the pandemic (this is the available data at the time of this writing) and for comparison 12 months before the pandemic. Unfortunately, more extended time series cannot be built yet.
The Granger Causality test aims to check the null hypothesis for all possible
xt and
yt pairs, and
l (lag in months):
The null hypothesis is that
x does not Granger-cause y in the first regression and that
y does not Granger-cause
x in the second regression. The null hypothesis is that for each equation:
4. Results
We used monthly data for selected OECD economies, based on Granger’s causal approach in EViews, after assessing data for stationarity using the Augmented Dickey-Fuller test. First, the series of dynamics (12 months before and 12 months after) were studied for stationarity. Since the series turned out to be non-stationary, we replaced them with 1st-difference and again checked for stationarity using the Augmented Dickey—Fuller test (one of the panel unit-root tests). All analyzed indicators in the form of 1st-difference showed stationarity (Prob. <0.01).
Further, the indicators were grouped by country, and in the context of two time intervals (12 months before the start of the pandemic and 12 months after), a Granger Causality test was carried out between the indicators in the context of lags 1 and 2. For the absolute majority of indicators that we analyzed, the lag was 1 month, which was revealed using the Unit Root Test option in the EViews program. However, in addition, we made calculations using lag 2.
The results of the calculations showed that for countries with an average per capita income of less than 30 thousand US dollars, the level of the analyzed indicators has a lower level of development of health systems.
In more detail, the calculation results are as follows:
The indicator “Excess of remuneration of general practitioners over the average salary in the country” is in general about 2.5 times for countries with average per capita incomes of more than 30 thousand US dollars, and about 1.6 times—if the per capita income less than 30 thousand US dollars. However, there are countries where this indicator is about 1.23 (Latvia, Mexico) and where it is more than 4 times (Luxembourg, USA).
Annual current spending on health care in % of GDP is noticeably higher in the richest countries—up to 10%, in the rest of the analyzed countries—from 4.7% in Turkey to 9.4% in Portugal on average over the period. Undoubtedly, per capita health spending in US dollars at purchasing power parity (PPP) in the group of the richest countries (from $2.2 thousand in Korea and Israel to $8.7 thousand US dollars) differs from the indicators of countries with lower per capita incomes (from less than 1000 in Colombia, Mexico, Turkey to 2500 in Portugal, Slovenia).
Since in OECD countries, health financing mechanisms provide for a fairly serious component of state and compulsory health insurance, we note that this indicator averages 76% of current health spending in the richest countries against 69% in the rest. The maximum—more than 84%—it reaches in the Scandinavian countries, and the minimum—49.5% in Mexico. If we analyze the volumes by PPP in US dollars, then the maximum level in the USA is about 5.7 thousand dollars on average.
Physicians per 1000 population in countries with per capita income more than 30 thousand US dollars—from 2 in Japan and Korea to more than 4 in Austria, Norway, Switzerland. And for countries with per capita income less than 30 thousand US dollars—from 1.8 in Chile, Colombia, Turkey to more than 4 in Greece, Lithuania, Portugal. The number of nurses per 1000 population: about 5—in Israel, Italy, Spain and more than 15—in Norway, Switzerland (among countries with per capita income more than 30 thousand US dollars), and among countries with per capita income less than 30 thousand US dollars—from less than 2 in Chile, Colombia, Turkey to more than 8 in the Czech Republic, Slovenia.
Hospital beds in countries with per capita income more than 30 thousand US dollars ranges from less than 3 (in New Zealand and Sweden) to more than 13 (Japan) per 1000 population (with an average of 4.9), compared with an average of 4.6 in countries with per capita income less than 30 thousand US dollars. The difference in the levels of this indicator across countries is primarily due to the influence of the average age of the population.
The maximum rate of computed tomography in Japan (more than 100 per 1 million of the population), the minimum is less than 1 in Colombia.
Per capita medical consultations vary from minimum levels (up to 3 in Sweden, Colombia, and Mexico) to maximum (more than 10 in Japan, Korea, Hungary, Slovakia).
Diagnostic CT examinations are most often carried out in Japan, Luxembourg, Norway, Sweden, USA (more than 200 per 1000 population), the minimum values are less than 40 (in Finland, New Zealand).
Also, pharmaceutical consumption of antibiotics in daily doses per 1000 inhabitants per day is most significant in Greece, Turkey, Korea, Luxembourg and differs from countries with minimum indicators by 3 times. All 12 listed indicators have a statistical difference in average levels (at
p < 0.001) for the two groups of countries taken for analysis. In the
Table 1, the average values of indicators used in calculating the taxonomic development coefficient for two groups of OECDs countries for 2006–2019.
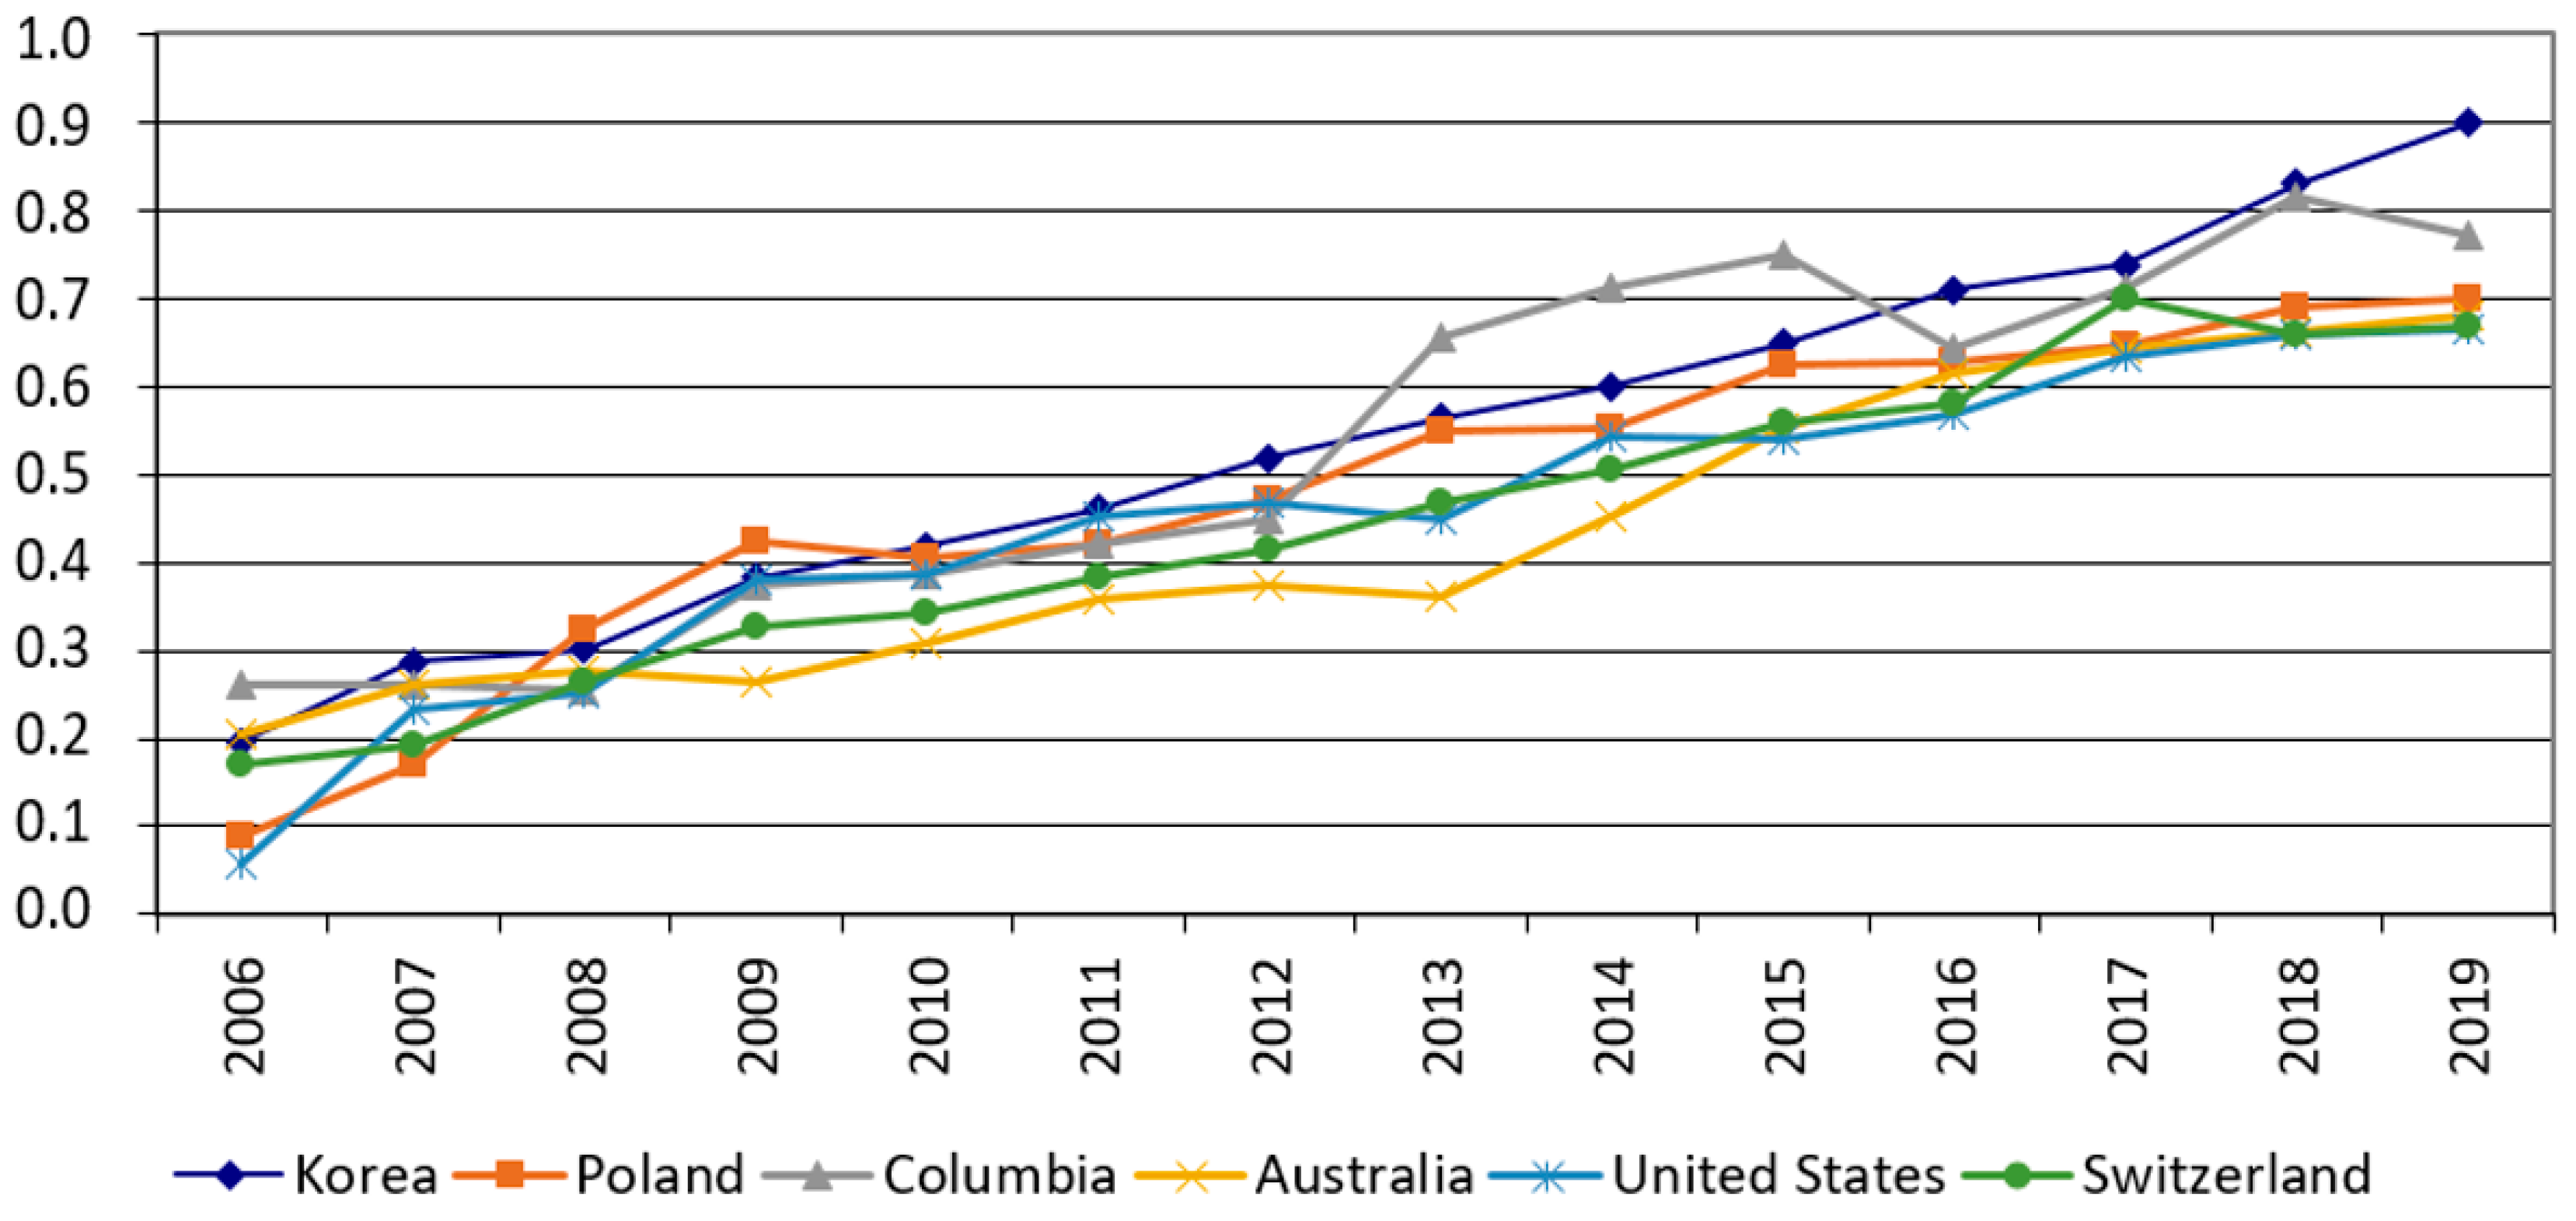
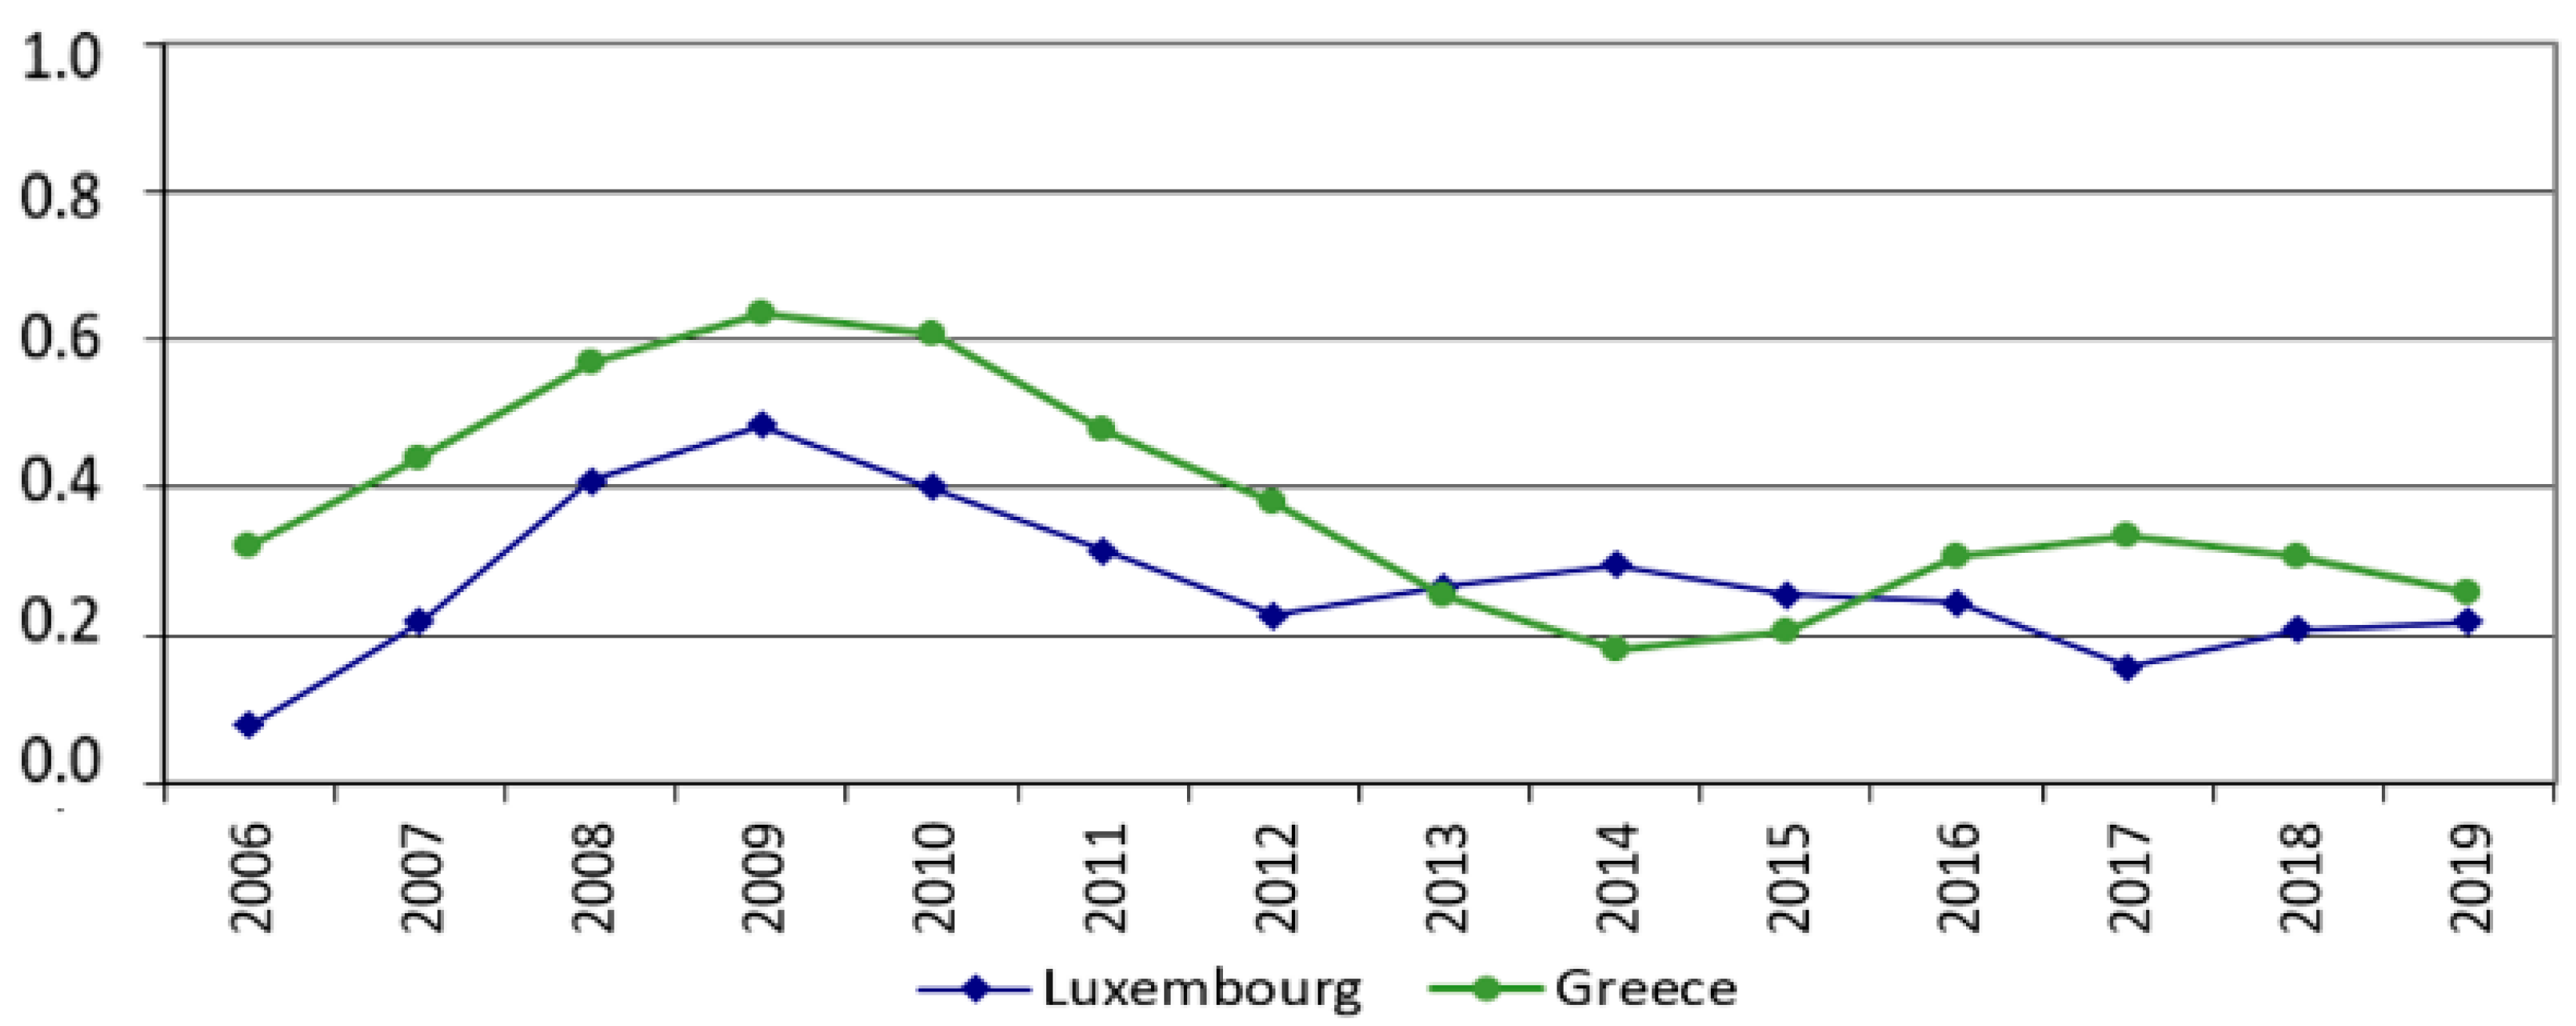
Also, the analysis of the results of the calculations made it possible to conclude that the indicators of the health care system (the coefficient of taxonomic development Ki) are most actively developing in Korea, Poland, Columbia, Australia, United States, Switzerland (
Figure 2). A noticeable drop is observed in Greece, Luxembourg (
Figure 3). An analysis of changes in taxonomic development factors for OECD countries over the past five years also revealed a trend towards faster growth in annual growth rates for countries with per capita income more than 30 thousand US dollars and in fact its absence in countries with per capita income less than 30 thousand US dollars.
However, dynamic growth is not always combined with a high level of development of the health care system. Thus, both high growth and high achieved indicators are fair for Korea. And for Colombia, rapid growth has not yet been matched by strong performance.
In the next part of our study, we will examine how the relationship between Business/Consumer Confidence and the performance of countries’ economies (in the sense of maintaining the direction of such ties) has changed in the periods before and after the onset of the pandemic. And also, are such changes related to the poor state of health systems in such countries, i.e., the fact that businesses and consumers, after assessing the prospects for a cure, could significantly reconsider their sentiment. At the same time, the existing levels of unemployment, restrictions on doing business, in turn, could affect Business/Consumer Confidence in the future.
Since there are no reliable statistics on Confidence indexes in developing countries (and more often it is its complete absence), we can only analyze the indicators for OECD countries.
Since the announcement of the pandemic by the World Health Organization it has passed little over a year. And since statistical data are published with some delay, we have at the moment only indicators for 12 months after the beginning of the pandemic. It’s interesting to compare how Consumer Confidence and Business Confidence have changed in the 12 months since the start of the pandemic versus the expectations in 12 months before it starts.
The essence of our idea is to compare, in the context of individual OECD countries, how much has changed the relationship between Consumer Confidence and economic indicators that describe the implementation of these expectations (for example, Consumer Price Index: All Items, Monthly, Not Seasonally Adjusted,% and Unemployment rate Total,%). Likewise, for the relationship between Business Confidence and an indicator that describes the volume of production on a monthly basis—Production of total industry (Index). We did not use the GDP indicator, since it has a quarterly frequency. Also, the indicators Production in total manufacturing (Index), Production of total construction (Index) were not used separately, because at the moment, a small number of countries have published them in the 12-month period from the start of the pandemic. Therefore, the authors of this study limited themselves to the dynamics of the Production of total industry (Index).
This part of the study intentionally does not make cross-country comparisons. The main reason is certain (often significant) differences in the structure of economies (the share of industrial production, services), which leaves an imprint on the structure of unemployment by industry during the spread of the pandemic (and, ultimately, on the level of unemployment itself).
Since the pandemic was announced in March 2020, a period of 12 months before it starts, we will consider March 2019–February 2020, and the 12-month period after the start of the pandemic: March 2020–February 2021. Used monthly data to simulate the dynamic impact of the COVID-19 pandemic.
The calculation results, for example, for the Unemployment rate/Consumer Price Index pair for Germany are summarized in the following
Table 2.
And
Table 3 summarizes all the results of calculations for the Granger Causality test. For ease of reading, the left-hand side shows the factors x, which have a statistically significant effect on the factors y at Prob ≤ 0.05 (as well as Prob ≤ 0.01 and Prob ≤ 0.001). The table also uses the following abbreviations: Business Confidence indicator—BUSINESS_CONF_IND, Consumer Confidence indicator—CONSUMER_CONF_IND, Consumer Price Index—CPI, Unemployment rate—UNEMPL, Production of total industry (Index)—TOT_IND_INDEX. And since the first differences were used for the calculations, D_ is everywhere before the name of the variable.
Since for certain countries in the context of a particular pair of
x and
y, may be observed the situation, where Prob ≥ 0.05, such results are combined in
Table 2 in the column—No relationship (or statistically insignificant relationship). The results of countries for which information is missing for at least one factor from the pair
x and
y are combined in the No info column.
Based on the Granger Causality test results, it should be noted that for the pair Consumer Confidence indicator/Consumer Price Index, we have a statistically significant relationship only for Germany and Denmark, and even without changing the direction of influence: the level of the Consumer Price Index in a particular month affects consumer expectations for the next month. With the onset of the pandemic, only the lag changed (increased to 2 months), which was most likely associated with a decrease in shopping opportunities due to the widespread lockdown. For the rest of the countries, no statistically significant relationships were observed in the context of this pair of factors.
The next pair of factors Production of total industry (Index)/Business Confidence indicator also demonstrated the invariability of the direction of influence and even lag for Germany. However, for a whole group of countries—Estonia, France, Italy, Slovakia, Spain—a statistically significant Granger Cause appeared after the beginning of the pandemic. The achieved level of production began to determine Business Confidence. It should be noted that the following countries were very pessimistic in their Business Confidence: Austria (minus 47% in April-2020 and January-2021), United Kingdom (minus 50.7% in May-2020), slightly higher from Chile and Belgium (minus 46%). Considerably more optimistic were, for example, Sweden (minus 12.9% in April-2020), Slovakia (minus 4.9% in April-2020).
Another pair of factors Unemployment rate/Business Confidence indicator showed the unchanged direction of influence only for Sweden and Italy. And for Lithuania, Portugal—the directions of influence have changed to the opposite. In addition, it should be noted that for a significant group of countries only with the onset of the pandemic, such a relationship in the pair of Unemployment rate/Business Confidence indicator became significant (Austria, Colombia, Greece, Poland, Chile, Hungary, the Netherlands, Latvia). Moreover, for most of these countries, there is often a link in the direction of Business Confidence Granger Cause Unemployment rate.
In the last pair of factors, the Unemployment rate/Consumer Confidence indicator, before the pandemic, the relationship was observed only for three countries: Austria, Slovenia, and Sweden. However, with its beginning—already for Italy, Lithuania, Great Britain, Austria, Greece, Poland, Portugal, Sweden. Moreover, if the link in the direction of Unemployment rate → Consumer Confidence indicator (ITA, LTU), rather, reflects the pessimism of the population in the sense of a significant, compared with other countries, unemployment rate and/or its significant increase (in Italy—about 10%, in Lithuania—growth from 6.5% to more than 9.5% after the start of the pandemic), the relationship in the direction of Unemployment rate ← Consumer Confidence indicator, at first glance, seems less logical. Nevertheless, it was with the onset of the Consumer Confidence pandemic that the part of the population that was characterized by self-employment or were employers, due to the limitations of business (tourism, restaurant, etc.), began to formulate their expectations of unemployment.
Are the changes in the direction of relationships in each pair of factors related to the level of development of their health systems? And what is the evolution of health systems in countries where Confidence indicators have found a statistically significant relationship with economic indicators? Health care systems in Germany, Denmark, Austria are indeed characterized by a high level of development, practically the best indicators among the OECD countries (better only in Korea and Japan). However, the health care systems in Sweden and Italy are not highly developed. Thus, although there is a possibility that there is a link between the health of health systems and Consumer Confidence/Business Confidence, it wasn’t traced. In other words, the state of health care systems is not decisive for consumer and business sentiment during a pandemic. Hence, only economic factors o and the level of public support affect the confidence.


