Abstract
Given the high resilience of the Central and Eastern Europe (CEE) banking sectors during the last financial crisis and their major role in the CEE region in financing the economy and supporting the high growth rates achieved there, our paper investigates the determinants of banking profitability in the CEE banking sectors based on a Generalized Method of Methods (GMM) approach using data between 2009 and 2018. We have selected determinants from the macroeconomic factors and from the financial-banking specific factors using a two-step GMM method. Our findings demonstrate that unemployment rate, inflation, budget balance, non-governmental credit, non-performing loan rates, concentration rate and capitalization rate negatively impact on the banking profitability in the CEE banking sectors. According to these findings, some policy recommendations were elaborated.
1. Introduction
The banking sector plays an important role in the development of the entire economy. It supported the high economic growth rates in the Central and Eastern Europe (CEE) region before the 2008 crisis, by loans that fueled private consumption. Moreover, the CEE banking sectors proved to be very resilient during the 2008 crisis, comparative to the Western European banking sectors, because of their sound capitalization, tight regulation and high profitability rates achieved before the crisis.
Mihajlović and Jovic (2017) have demonstrated, in their study on CEE banking sectors during 2009–2015, the interplay between the macroeconomic frame and banking sectors. They proved that sustainable economic growth supports the development of the banking sector, which, in turn, contributes to the successful economic growth and development. They have also shown that the high NPL in the CEE region affected the profitability ratios of the CEE banking systems during the last financial crisis and during the post-crisis period. This high NPL ratio was determined by a large share of banking loans denominated in foreign currency in the CEE region (which remained high even after 2012), by the extensive credit policy prior the crisis and the surge in interest rates in this region once the crisis erupted. At the beginning of 2000s, the expectations of high economic growth rates in the CEE region directed foreign financing to less productive uses, which caused serious imbalances in the region that were amplified during the crisis of 2007–2008. However, the solid capitalization of the CEE countries’ banking sectors and adequate provisions made the NPL burden more bearable across the CEE region (Kolev and Zwart 2013).
Before the 2008 crisis emerged, the improvement of the macroeconomic environment and the high levels of economic growth supported a significant increase of the non-governmental credit in the CEE region (the largest increase was reported in the Baltic states, Croatia, Bulgaria and Hungary), especially the credit denominated in foreign currency (as a result of large FDI inflows), which led to a high exposure of those banking systems to foreign exchange risk and large vulnerabilities that could be seen once the crisis erupted. The central banks have tried to fight against those vulnerabilities by imposing credit ceilings (Bulgaria and Croatia) or increasing the minimum reserves for the deposits denominated in foreign currencies (Romania and Croatia), but their actions showed a limited and short-time effect. All CEE countries with a fixed exchange rate experienced some wide current account deficits before the 2008 crisis. This caused a significant increase of the public debt, especially the short-term public debt. Lowering provisioning requirements, credit boom, better regulatory environment and better banking governance (determined by the important entry of the foreign banks on the CEE markets) headed to a large increase of the banking profitability ratios in the CEE banking systems before the crisis. During the crisis, a substantial decrease of the interest revenues could be observed in Romania, Bulgaria, Slovenia and Hungary. The banking capitalization moderated in time, but it remained above the minimum required levels even during the crisis in the CEE area. The sound performance of the CEE banking systems during the 2008–2009 crisis was based on the adequate capitalization of the banking systems and on the reliance on the committed funding from the foreign banks that had acquired many domestic banks in the CEE area (Sandor and Reiner 2010).
Although there have been some of studies focused on the CEE banking sectors that analyzed the factors that influence their profitability, especially during and after the financial crisis (Andrieș et al. 2016; Căpraru and Ihnatov 2014; Athanasoglou et al. 2006), this is the first study which investigates two different groups of determinants affecting CEE banking profitability, namely the factors specific to the financial and banking markets on one hand and macroeconomic variables on the other hand. Additionally, this study analyzes all three profitability ratios (ROA, ROE and NIM), which were analyzed separately by previous studies. Previous studies that focused on the CEE banking sectors either investigated one profitability ratio (e.g., ROA, in Andrieș et al. 2016) and both groups of determinants or two or all three profitability ratios (Athanasoglou et al. 2006; Căpraru and Ihnatov 2014), and mostly banking and financial specific factors, but only inflation rate or GDP growth among the macroeconomic factors (in the current study, GDP growth was not found significant for the CEE banking profitability). The first group of determinants of profitability involves concentration ratio, solvency rate, non-performing loans and banking credit to the non-governmental sector as a share of the GDP. Staikouras and Wood (2004) studied the impact of these category of factors on the performance of the European banking systems from 13 countries during 1994–1998. They have demonstrated that not only the factors specific to the banking industry are important for the banking profitability, but also the macroeconomic determinants matter. Therefore, the second group relates the profitability ratios to the macroeconomic environment within which the banking system operates; in this context, we included inflation, public deficit (budget balance) and unemployment rate among the explanatory variables.
For estimating the determinants of the banking profitability, we have used as dependent variables ROA, ROE and NIM, because CEE banking systems rely more on interest incomes compared to the Western European banking systems. Krakah and Ameyaw (2010) argued that bank profitability is best measured by ROA because it is not influenced by higher equity multipliers such as ROE. A possible limitation of ROA is the existence of the off-balance-sheet assets which represent an important source of profit for European banks, but ROA proved to be significant for the banking profitability in transition countries, as other studies have proved (Demirguc-Kunt and Huizinga 1999; Athanasoglou et al. 2006; Căpraru and Ihnatov 2014). We applied a two-stage Generalized Method of Moments (GMM) to select the most significant factors of those two groups that impact the banking profitability ratios and built two different equations for each profitability ratios to better emphasize the impact of the respective determinants of banking profitability.
Given the high importance of the banking sectors that dominates the financial markets in the CEE region and highly finance the CEE economies and given the distinct behavior of the CEE banking sectors during the last financial crisis and their resilience comparative to the Western European ones, this comprehensive study, which incorporates both groups of factors, analyzed separately, and all three banking profitability ratios, is necessary in order to elaborate some policy measures based on the achieved results in terms of banking management and in terms of monetary authorities’ actions.
2. Literature Review
The determinants of European bank profitability were firstly evaluated by Molyneux and Thornton (1992) for the period 1986–1989, using banking and financial specific determinants (except inflation). Staikouras and Wood (2004) examined the determinants of banks profitability in the EU for the period 1994–1998, using OLS and fixed effects models, and showed that the profitability of European banks is significantly influenced by factors related to changes in the macroeconomic environment. The performance of European banks across six countries was also investigated by Goddard et al. (2004), who found that bank institutions’ growth is linked to macroeconomic conditions, and further associated to concentration and profitability.
Tan and Floros (2012) studied the relationship between the inflation rate and banking profitability (expressed as NIM and ROA) in China during 2003–2009, by applying the two-step GMM methodology. They found a positive relation between inflation and banking profitability and a negative relation between banking market concentration and banking profitability. Onofrei et al. (2018) studied 96 banks belonging to 7 countries of the CEE region using a panel analysis and showed that one of the factors that has a significant influence on banking profitability in this region is the domestic non-governmental credit, displaying a positive impact on the banking profitability in this area, while the impact of inflation was found to be significant and negative. Contrarily, Sufian (2009) found a positive impact of inflation and banking capitalization on the banking profitability in Malaysia between 2000 and 2004. Pan and Pan (2014) studied the Chinese banking sector and showed that inflation positively impacts the banking profitability. The same results were achieved by Jiang et al. (2003), who studied the Hong-Kong banking sector between 1992 and 2002. Andrieș et al. (2016) analyzed CEE banking systems during 2004–2013 and proved a significant negative correlation between inflation and profitability ratios. Similar results were also revealed by Sayilgan and Yildirim (2009) for Turkish banks between 2002 and 2007.
Atasoy (2007) studied the Turkish banking system between 1990 and 2005 and found that the inflation rate is positively correlated with bank profitability, while the concentration rate has a negative impact on ROA. Boyd and Champ (2006) identified a negative relationship between inflation and bank profitability or banking non-governmental credit. They have also demonstrated that countries with a high inflation rate have underdeveloped and small banking markets. Guru et al. (2002) examined the bank profitability for Malaysia during 1986–1995 and found that inflation had a positive relationship with bank profitability. Abreu and Mendes (2002) reported a negative relation between inflation and banking profitability for the European banking systems (ROA and ROE), and between unemployment rate and profitability of banking systems. In addition, Demirguc-Kunt and Huizinga (1999) notice that banks in developing countries tend to be less profitable in inflationary environments particularly when they have a high capital ratio, by studying 80 countries during 1988–1995. The same authors proved that banks in countries with more competitive banking sectors, where bank assets constitute a large portion of GDP, are less profitable.
Cetin (2019) found a positive impact of inflation on ROA in developing countries and a negative impact in developed countries using a fixed effects OLS during 2013–2015 for G20 countries. Akbas (2012) found a negative impact of inflation on ROA for Turkish banks using a panel data during 2005–2010. Boyd et al. (2001) obtained the same findings. Flamini et al. (2009) found a positive relation between the inflation and banking profitability for 41 Sub-Saharan countries during 2000s using a two-stage GMM approach. Abdelaziz et al. (2011) found a negative relation for these variables in the Tunisian banking sector during 1980–2009, based on a panel data analysis with random effects, while Sufian (2009) found a positive relation for the Malaysian banking system during 2000–2004. Based on a GLS approach with fixed effects, Vong and Chan (2009) found a positive relation for the Macao banks during 1993–2007. Yilmaz (2013) also found a positive relation for 195 banks from developing countries in a panel data framework during 2005–2010. However, Hamadi and Awdeh (2012) found no impact of inflation on banking profitability ratios. Moyo and Tursoy (2020) analyzed four large commercial banks from South Africa and found a strong negative relationship between inflation and ROE between 2003–2019, based on an ARDL, FMOLS and DOLS modeling. Naceur (2003) showed that banking profitability and the net interest margin were negatively influenced by inflation in the Tunisian banking sector during 1983–2000.
Isfaq and Khan (2015) demonstrated a positive relationship between capitalization or concentration and ROA or NIM for the Pakistani banking market, but a negative relation between inflation, on the one hand, and ROA and NIM, on the other hand, using a common effect model, a fixed effect model and random effect model during 2008–2012. Dietrich and Wanzenried (2009) showed that one of the most important determinants of bank profitability within the Swiss banking sector was the market concentration rate, which is strongly negatively correlated with the profitability ratios.
Fadzlan (2009) found there is a positive impact of banking capitalization and inflation on the banking profitability during 2000–2007. Same positive relation between inflation and banking profitability was found by Pasiouras and Kosmidou (2007) for EU banking systems. García-Herrero et al. (2009) explained the low profitability of Chinese banks for the period 1997–2004 by the negative impact of the banking market concentration on banks’ profitability, but they also found a positive relation between banking capitalization and banking profitability.
Trujillo-Ponce (2013) determined that bank profits are influenced by inflation and market concentration. A negative significant correlation was found between profitability and market concentration, the latter being represented by the Herfindahl–Hirschman index (Korytowski 2018). Mirzaei et al. (2013) have studied the banks from 40 European emergent countries during 1998–2008 and found a positive relationship for the advanced economies and a negative one for the emerging ones. Less competitive market conditions are correlated with a higher level of profitability in emergent banking systems. Olson and Zoubi (2011) found that market concentration positively impacts the banking profitability. Beckmann (2007) studied 16 Western European countries and showed that there is no significant relation between bank profits and the concentration rate of the banking market.
Smirlock (1985) and Staikouras and Wood (2004) suggested that the industry concentration has a positive impact on the banking performance. The more concentrated the industry is, the greater the monopolistic power of the firms will be. This, in turn, improves the profit margins of banks. However, there are also some studies that report conflicting results. For example, Naceur (2003) reported a negative coefficient of correlation between concentration and bank profitability in Tunisia. Additionally, Karasulu (2001) found that increased concentration has not necessarily contributed to the profitability of the banking sector in Korea.
Ćurak et al. (2012) also demonstrated the negative impact of banking market concentration on the banking profitability in Greece and a strong positive impact of the solvency rate on ROA and ROE. Athanasoglou et al. (2006) have studied the banking profitability in the SEE region between 1998 and 2002 and showed that capitalization had significantly impacted profitability, while the concentration of the banking market was positively related to bank profitability. In terms of macroeconomic variables, the results were mixed among different European countries. Căpraru and Ihnatov (2014) also demonstrated this relationship for all three banking profitability ratios—ROA, ROE and NIM—in the CEE banking sectors.
Claeys and van der Vennet (2004) showed that the concentration ratio of the banking markets was positively linked to profitability for Western European banks but was not validated for Eastern European banks. Naruševičius (2018) found no significant relationship between the concentration ratio of the banking sector and banking profitability in Lithuania. However, Athanasoglou et al. (2008) found no clear results for this relationship.
The findings on the impact of capitalization on the banking profitability are mixed. Berger (1995) found a negative relation, while Molyneux (1995) demonstrated a positive relation, especially for the emerging economies. The same positive relationship between the banking capitalization and banking profitability was found by Naceur and Goaied (2008) for the period 1980 to 2000 for Tunisia, but they found no relation between the banking profitability and macroeconomic variables.
A negative relationship between banking capitalization and banking profitability was demonstrated by Goddard et al. (2010) and Rumler and Waschiczek (2012). On the contrary, Demirguc-Kunt and Huizinga (1999), Abreu and Mendes (2002), Pasiouras and Kosmidou (2007) and García-Herrero et al. (2009) determined a strong positive relationship between capitalization and banking profitability. A better capitalization decreases the financing costs and, thus, increases the banking profitability. There are many studies that proved a positive relationship between banking capitalization and banking profitability (Alexiou and Sofoklis 2009, Athanasoglou et al. 2008, Iannotta et al. 2007) and they explained that a better capitalization support lowering the financing costs for banks and that a higher capital is associated with more riskier assets and, therefore, with a higher profitability.
Trujillo-Ponce (2013) demonstrated in his study that capitalization is positively associated only with ROA, as reflected in the profitability ratio, and negatively associated with ROE, while a higher share of loans granted to the economy is positively associated with banking profitability and a low credit risk of loans is positively related to banking profitability for Spanish banks during 1999–2009, using a GMM estimator for an unbalanced panel data.
Previous researchers found that despite the higher operating costs of managing a large portfolio of loans, bank profitability should increase because of granting more credits to the economy (García-Herrero et al. 2009; Barros et al. 2007; Iannotta et al. 2007; Pasiouras and Kosmidou 2007; Chiorazzo et al. 2008; Abreu and Mendes 2002). However, increasing the share of credits granted to the economy of the total banking assets increases the risks. It seems that the consensus is that a poor quality of loans portfolio negatively impacts on the banking profitability. Increasing the non-performing loans negatively affects the banking profitability (Alexiou and Sofoklis 2009; Athanasoglou et al. 2008; Chiorazzo et al. 2008; DeYoung and Rice 2004; Hernando and Nieto 2007).
The effect of credit risk, i.e., loan losses as per non-performing loans, is clearly significant and negative (Athanasoglou et al. 2008; Coffinet and Lin 2010; Sufian 2011; Kanas et al. 2012), especially during the crisis periods. Psaila et al. (2019) analyzed the profitability of Euro-Mediterranean Commercial Banks using a pooled OLS regression, fixed effects and random effects panel regressions. They found that NPLs are negatively related to ROA for these commercial banks and that the solvency rate is the most significant explanatory factor for the NPL and ROA developments. Anbar and Alper (2011) found that weak asset quality negatively impacts on ROA for Turkish banks. They also found that banking loans did not have a positive relationship with banking profitability. The most significant factor impacting on the profitability of euro area banks (as ROA) appear to be the NPL ratio (IMF 2018). Akter and Roy (2017) demonstrated an inverse relationship between those two variables. The same results were achieved by Christaria and Kurnia (2016), Anastasiou et al. (2016), Kingu et al. (2018), Petkovski et al. (2018) and Khan and Ahmad (2017).
A higher loan quality implies more resources allocated to loan monitoring, thus increasing bank costs (Mester 1996). Likewise, riskier credits are better remunerated for banks, which can lead to an increase of the banking profitability, as some previous studies have proved (Iannotta et al. 2007; Kasman et al. 2010).
There are few direct studies about the impact of the public deficit/public balance on the banking profitability. Sayilgan and Yildirim (2009) found a positive relation in the Turkish Banking system during 2002–2007, while Kaya (2002) demonstrated that ROA and ROE of the Turkish banking system are positively correlated with the public budget deficit. Some studies analyzed the impact of the public deficit or increased public spending on the domestic and foreign investments and concluded that there is a significant negative effect in the long run, which can negatively impact the banking profitability rates by decreasing the credit demand in those affected countries (Blanchard and Perotti 2002; Alesina et al. 2002; Mulas-Granados et al. 2009; Ilzetzki et al. 2010). On the other hand, there are some studies analyzing the impact of public deficit on the banking interest rates (Laubach 2009; Canzoneri et al. 2002; Kirchner and van Wijnbergen 2012), which concluded that there is a significant positive effect of the public deficit on the interest rates, which are correlated with the impact mentioned above on the credit demand leads to the idea that the impact of the public deficits on banking profitability (measured as ROA and ROE) is significant and negative.
The unemployment rate was found to be one of the most significant macroeconomic variables for the banking performance in the CEE banking systems. The unemployment rate dynamic is important for the banking operating expenses (negotiating salaries) and, thus, for the banking profitability; hence, a positive relation with banking profitability was demonstrated for the Lithuanian banking sector based on a pooled mean group estimation technique (Naruševičius 2018). Clair (2004) studied the banking system in Singapore and determined that the unemployment rate influenced the stability and performance of the local banks. Heffernan and Fu (2008) used the net interest margin to examine the determinants of banking performance. They showed that the unemployment rate is significantly related to banking profitability. Abreu and Mendes (2002) reported a negative relation between the unemployment rate and profitability of the banking systems, expressed as ROA and ROE. An increase in the unemployment rate determines the rise of the non-performing loans and the decrease of the demand for new credits to the non-governmental sector. The strongest effect can be seen on the demand for new credits, while the impact on the NPL is weaker in the short run (Moinescu 2008). The unemployment rate determines high banking losses (Frøyland and Larsen 2002; Berge and Boye 2007), with a direct impact on the performance of the banking system (Pesola 2005).
Concluding the findings of the previous studies, we can state that the determinants belonging to the banking and financial markets group were more often analyzed by the researchers and they have been found to have a more significant impact than the macroeconomic factors on the banking profitability ratios. Their impact on the banking profitability differs because of the differences among the banking sectors in the developed markets against the developing or emergent ones, not because of the analyzed period. Different results for the same factor (from both groups) were also achieved during the pre-crisis or post-crisis periods (Blanchard and Perotti 2002; Ilzetzki et al. 2010; Sayilgan and Yildirim 2009; Kaya 2002; Abreu and Mendes 2002; García-Herrero et al. 2009; Iannotta et al. 2007; Kasman et al. 2010). The results for the emerging markets (Turkey, Hong-Kong) and CEE regions were similar regarding the impact of many analyzed determinants before and after the crisis (Demirguc-Kunt and Huizinga 1999; Sayilgan and Yildirim 2009; Andrieș et al. 2016; Athanasoglou et al. 2006; Mirzaei et al. 2013; Cetin 2019; Abreu and Mendes 2002; Moinescu 2008). However, for some factors (e.g., the concentration rate or inflation rate), the impact in the developing European countries is different than some other developing countries, such as Malaysia or China (Mirzaei et al. 2013; García-Herrero et al. 2009; Demirguc-Kunt and Huizinga 1999; Sufian 2009).
3. Research Methodology
The paper’s research objective resides in investigating the impact of financial system characteristics and macroeconomic specificities on the profitability of commercial banks in Central and Eastern Europe (CEE), by means of panel regressions in a GMM estimation framework. We used data with an annual frequency between 2009 and 2018 from 11 CEE countries, as follows: Bulgaria, Croatia, Czechia, Estonia, Hungary, Latvia, Lithuania, Poland, Romania, Slovakia and Slovenia. All countries are members of the European Union since 2004 and 2007; therefore, the period under analysis in our paper fully covers their EU membership.
The variables used in the panel modeling, along with their definitions and sources of data, are presented in Table 1. We have used three different variables to proxy bank profitability—ROA, ROE and NIM—four variables to encompass the influence of financial system attributes on bank profitability—CREDIT, HERFIND, NPL and SOLVRATE—and three variables associated with countries’ macroeconomic characteristics—BUDBAL, INFLATION and UNEMP. Several other variables have been included in the preliminary stages of this research, but we have discarded them in view of their lack of statistical significances1. All variables were collected at country level; hence, regarding the bank profitability and banking system characteristics, they illustrate the aggregate performance and conditions of all commercial banks in the countries under scrutiny, and not of particular banking institutions.

Table 1.
Description of variables.
Based on existing studies and findings, we hypothesize that CEE banks’ profitability will be negatively impacted by the importance of non-performing loans, public deficit, inflation rate and unemployment. For the remaining variables—the credit to the private sector, banking market concentration and solvency ratio—we form no a priori hypothesis regarding the sign of the panel regression coefficients.
Table 2 shows brief descriptive statistics of variables for the entire sample of countries and period under analysis. A detailed presentation and discussion on the variables’ value and patterns across countries and years is included in the next section, where the results are presented.
Table 2.
Descriptive statistics of variables, full sample.
The model used in our paper uses the General Method of Moments (GMM), firstly proposed by Arellano and Bond (1991), and intensively used in the previous research endeavors on firm profitability, including banks’ profitability and efficiency—to mention only a few papers: Athanasoglou et al. (2006), Dietrich and Wanzenried (2009), Al-Homaidi et al. (2020) and Banto and Monsia (2021). Scholars’ preference for the GMM approach to panel regression stems from its ability to control for endogeneity, due to the use of available lagged values in the dependent variable and of the exogeneous regressors’ lagged values in the form of instruments. Moreover, the GMM approach allows for the control of unobserved heterogeneity and persistence of the dependent variable, resulting in more consistent estimates of the regression parameters compared to the more traditional fixed or random effects panel regressions.
Our estimation of the determinants of banks’ profitability in CEE countries is based on the following general model:
where is the profitability of banks in country i at time t, with i = 1, …, N and t = 1, …, T, is the constant, are the regressors (explanatory variables) and is the error or disturbance term (, where is the unobserved country-specific effects and is the idiosyncratic error, —independently and identically normally distributed with a mean of zero and a defined variance—and independent of ).
We add the lagged profitability to Equation (1):
where is the one-year lagged bank profitability and is the adjustment speed to equilibrium, whose values indicate whether profits persist, but will return to their long-term level ( is between 0 and 1), depending on whether the banking sectors in the CEE countries are more or less competitive (closer to 0 or 1, respectively). Since we are interested in separately evidencing the relationships of CEE financial market characteristics, on the one hand, and macroeconomic conditions, on the other hand, with banks’ profitability, in Equation (2), variables will include, first, the four financial market variables—CREDIT, HERFIND, NPL and SOLVRATE—as regressors, and second, the three macroeconomic conditions as regressors—BUDBAL, INFLATION and UNEMP.
There are two versions of GMM estimators used in the econometric literature: the difference GMM and the system GMM. Arellano and Bond (1991) proposed the difference GMM estimator, which takes the first difference of the panel equation for each period with the aim of removing the specific country effects, while instrumented regressors of the first difference equation are their one or more period lagged values. The other estimation version, system GMM (or the two-step system GMM), proposed by Blundell and Bond (1998), is a combination of the first difference in the panel equation with an equation at level where instruments are regressors’ first differences. Arellano and Bover (1995) and Blundell and Bond (1998) demonstrated that system GMM corrects the biases on the difference GMM estimator, allowing for lagged first differences in levels equations. Hence, we proceed with the two-step system GMM estimation.
Regarding the correlation between the explanatory variables used in panel models, Table 3 shows that, overall, the correlation between regressors that are included in the same estimation (financial market variables and macroeconomic variables, separately) is not strong—the highest correlation coefficient is 0.488 between CREDIT and HERFIND, and −0.415 between BUDBAL and UNEMP—implying the lack of multicollinearity issues in our models.
Table 3.
Pearson correlation coefficients for variables included in the study, full sample (2009–2018).
The quality of the system GMM estimation results depend on the validity of instruments matrix and the assumption of no residual autocorrelation. We used the Sargan test to verify the validity of instruments and the second-order serial correlation test of Arellano and Bond (1991) to support our system GMM estimation.
4. Results and Discussion
We present the results of our analysis in two steps: first, we undertake a comprehensive investigation of banking systems’ profitability dynamics in CEE countries between 2009 and 2018, which also highlights the similarities and differences between economies; second, we show and discuss the results of our panel regressions in GMM framework, which link banks’ profitability to financial systems’ attributes and macroeconomic characteristics.
4.1. The Dynamics of Banks’ Profitability in CEE Countries
Figure 1, Figure 2 and Figure 3 describe the evolution of banks’ profitability between 2009 and 2018 in CEE countries considered as a group. Over time, mean ROA varied between −0.681% in 2009 and 1.527% in 2018, in some years being lower than median ROA and in others higher, without a special pattern that can be detected. The most striking difference between the mean and median ROA was recorded in 2009 and 2014, when mean ROA at group level was negative (−0.681% and−0.272%, respectively), while mean ROA was in the positive territory (0.668% and 0.8%, respectively). This indicates negatively skewed ROA distributions for these two years and the presence of several low ROA values in some countries that triggered the low mean ROA. These two years were also the ones that show the highest ROA variation among the 11 CEE countries, evidenced by the distance between mean/median and the staples (ends of whiskers in the boxplot). Mean ROA was more volatile over time compared to median ROA, but both have followed a general upward trend between 2009 and 2011, followed by a downward one until 2014 and a subsequent upward evolution until 2018. These fluctuations can be easily explained by the negative impact of the Global financial crisis of 2007–2009 on banking systems all over the world, including the region investigated in our research, followed by another negative impact of the European sovereign debt crisis in 2012. We also note the higher homogeneity of ROA among CEE countries after 2015, suggesting their banking systems’ fast adjustment to the recommendations and rules of the European Banking Authority after the turbulent years of the two crises.
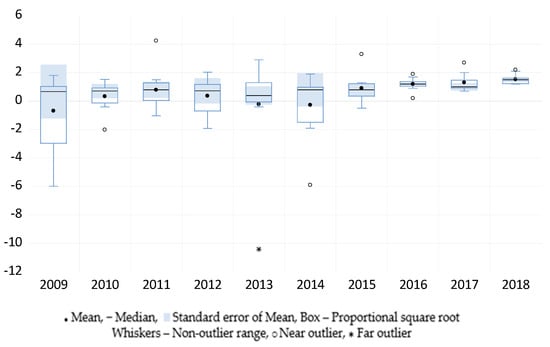
Figure 1.
Boxplot of ROA in CEE countries, 1995–2018 (%).
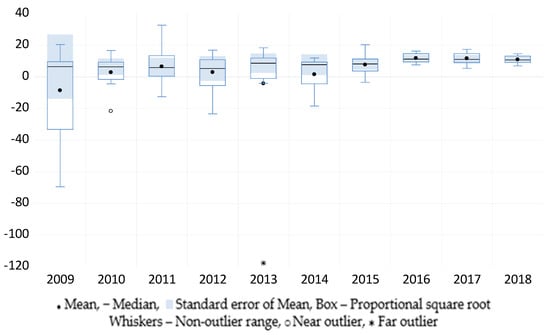
Figure 2.
Boxplot of ROE in CEE countries, 1995–2018 (%).
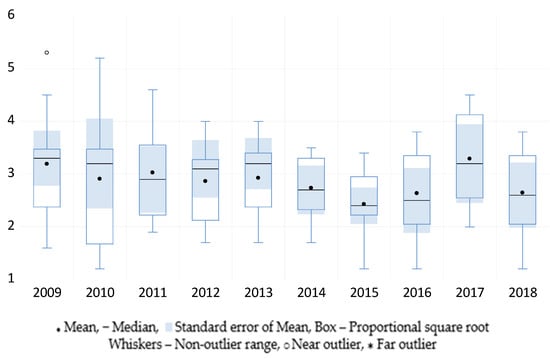
Figure 3.
Boxplot of NIM in CEE countries, 1995–2018 (%).
Moving to ROE—see Figure 2—the pattern identified in the case of ROA is generally maintained, except for year 2013, showing a high difference between mean and median ROE in the sample. Mean ROE varied between −8.545% in 2009 and 11.818% in 2016, while median ROE was positive in all years, with the lowest value in 2012 (5.3%) and the highest in 2016 (11.3%). In 5 years out of 10, ROE is negatively skewed, and positively skewed in the remaining 6. At the overall sample level, the lowest ROE was −69.4% in 2009—in Estonia—and the highest 32.7% in 2011—also in Estonia. Similar to ROA, the CEE countries’ differences in terms of ROE have diminished considerably after 2014, indicating smaller disparities in their banking systems profitability, triggered by the countries’ compliance with European Banking Authority recommendations.
Unlike ROA and ROE, which displayed both negative and positive values over time, NIMs have remained positive between 2009 and 2018 for all countries in our sample, suggesting a strong core performance of the CEE banking systems. Although mean and median NIM, respectively, have shown low variation across years, there were important discrepancies between countries, particularly in 2010 and 2009, when the differences between the maximum and minimum NIM was 4% and 3.7%, respectively. It is difficult to distinguish specific trends in NIM evolution for several years, which is quite different from ROA and ROE patterns, and we also note the quite important relative variation of NIM among CEE countries for each year, without a specific trend towards homogeneity as one moves towards 2018.
We show in Figure 4, a comparison between the evolutions of the three bank profitability variables included in our investigation, i.e., ROA, ROE and NIM, for all 11 countries in the region, between 2009 and 2018. Several observations are noteworthy, in our opinion. First, banks in the region have increased their lending volumes, which explains the robust profitability in a low interest-rate environment after the 2007–2009 financial crisis (Deloitte 2019). Second, as expected, ROA and ROE were rather well correlated at an overall sample and individual country level—the Pearson correlation coefficient between ROA and ROE at sample level is 0.937, statistically significant at 1% level, while the correlation coefficients for countries vary between 0.741 for Slovakia and 0.999 for Slovenia—but their overall evolution between 2009 and 2018 follows different trajectories depending on the country. Thus, most countries have seen their ROA and ROE considerably fluctuate over the years, more particularly ROE, with Croatia, Hungary, Poland, Romania and Slovakia leading in terms of variation. Bulgaria and Slovenia show an interesting pattern of ROA and ROE, with a general upward trend only marked by a substantial drop in one year (2014 for Bulgaria and 2013 for Slovenia). Third, NIM displays considerably less volatility over time compared to ROA and ROE, accompanied by a flat evolution in most countries and slight declines in Czechia, Romania and Slovakia.
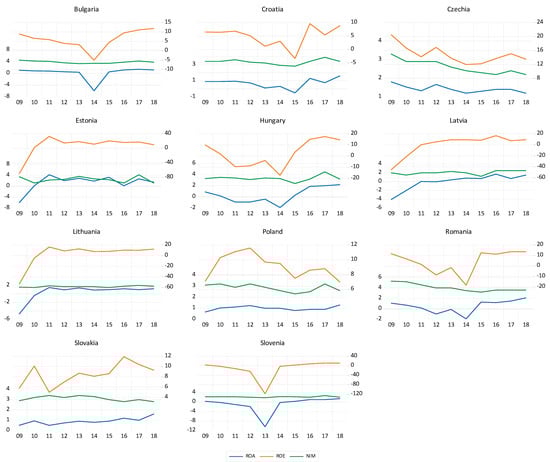
Figure 4.
Banks’ profitability in CEE countries, 1995–2018 (%). ROA and NIM are represented on the left axis and ROE on the right axis.
Fourth, at sample level, NIM shows very weak correlation to both ROA and ROE (0.130 to ROA and 0.131 to ROE, none statistically significant) caused by the significant differences at country level—the Pearson correlation coefficient for ROA and NIM varies between −0.577 for Slovakia and 0.808 for Czechia, and for ROE and NIM between −0.449 for Slovakia and 0.840 for Czechia (see Table 3). We also note the virtual no-correlations in Romania (0.007 for NIM-ROA and 0.074 for NIM-ROE), Poland (0.096 for NIM-ROA) and Estonia (−0.04 for NIM-ROA). This suggests that banking systems with high NIM, as is the case with CEE countries, were not necessarily good generators of high ROA and ROE. Moreover, capturing banks’ performance by considering only NIM overlooks other aspects related to the credit process, as well as the requirements embodied in the RAROC (risk-adjusted return on capital) modeling system (Nichols 2017). Nevertheless, one cannot overlook the robust profitability of banks in the CEE region, driven by surging lending and improvements in assets’ quality, the latter being correlated with the requirements imposed by Basel II and Basel III.
Figure 5 and Figure 6 show the evolution of the financial sector attributes in the 11 CEE countries included in our sample between 2009 and 2018. In 8 out of 11 countries, the share of domestic credit to the private sector in GDP declined between 2009 and 2018 (see Figure 5, left panel), and in some countries, this decline has been quite impressive; for example, this share dropped by 64% in Latvia (from 105.46% in 2009 to 36.62% in 2018) and by almost 50% in Slovenia (from 83.07% in 2009 to 43.32% in 2018) and in Hungary (from 59.92% in 2009 to 32.41% in 2018). By contrast, the importance of domestic credit in GDP increased by 38% in Slovakia, 14.1% in Czechia and 11.7% in Hungary. Certainly, these results reflect the widening of the financing alternatives available to the private sector in these countries, jointly with the increase of their GDP, but also point towards a lagging behind of the banking sector as provider of financing to the economy and, to some extent, of the lack of modern and innovative solutions, adjusted to the needs of the private sector in this dynamic region. On the other hand, the banking sector in the region became more resilient, as illustrated by the diminishing importance of non-performing loans and the increase in solvency rates (Vivaldi and Giorgio 2017). Regarding non-performing loans (see Figure 5, right panel), its values in 2009 varied between 4.28% in Poland and 23.99% in Lithuania, but dropped to a range between 0.45% (Estonia) and 9.70% (Croatia), reflecting the improved credit management in CEE banking institutions, also driven by stricter regulations and the implementation of Basel II and III rules, mostly after the European sovereign debt crisis of 2012. In several CEE countries, this decline was substantial, namely Estonia and Lithuania (91%) and Hungary (70%). The only CEE country that has seen an increase in NPL in 2018 compared to 2009 was Slovenia (from 5.79% to 6%), although it dropped to only 3% in 2017.
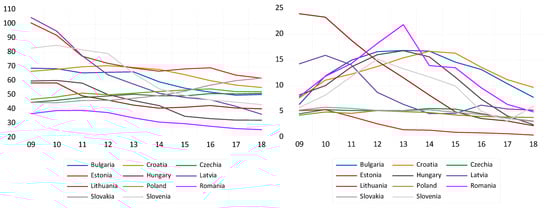
Figure 5.
Domestic credit to the private sector-% (left panel) and non-performing loans-% (right panel) in CEE countries, 1995–2018 (%).
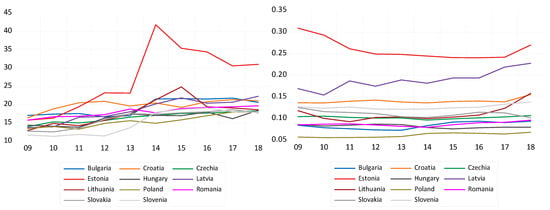
Figure 6.
Solvency rate (left panel) and Herfindahl (right panel) in CEE countries, 1995–2018 (%).
All banking systems in CEE countries have recorded important increases in their solvency rates, particularly until 2013–2014, illustrating the strengthening of banking activities after the global financial crisis of 2007–2009 (see Figure 6, left panel). After 2014, however, solvency rates slightly declined in several countries (Bulgaria, Lithuania, Slovakia and Slovenia), but most importantly in Estonia, due to the 2% increase in systemic risk buffer requirement set by Estonian Central Bank (Eesti Pank 2014) for commercial banks in August 2014. The situation of Estonian banks is linked to the particularities of the Estonian economy, with a higher-than-average level of investments but modest savings of households and companies, but also of the Estonian banking system, highly concentrated and exposed to risks associated to the same group of countries and sectors. In terms of solvency rates values, they ranged between 12.9% (Lithuania) and 15.75% (Romania) in 2009 and 17.76% (Slovakia) and 31.0% (Estonia) in 2018, after reaching 41.8% in 2014 (Estonia). In this context, it is worth noting that the values of these rates are well above the requirements of the European Central Bank, even for the countries that have not yet adopted the euro (6 out of 11 in our sample).
On the other end, the Herfindahl index shown in Figure 6 (right panel) indicates considerable differences between CEE countries in terms of their banking systems’ concentration; for example, Estonia recorded values of the index in the range of 0.24 to 0.30, while Poland recorded values between 0.05 to 0.07 over the period under scrutiny. As mentioned above, the Estonian banking system is domiated by three banks—Swedbank, SEB Bank and Luminor Bank—while the the largest local capital based bank, LVH Bank, holds 6% of banking assets. At the other end, the Polish financial landscape was much more diverse, including 32 commercial banks, 543 cooperative banks and 31 branches of credit institutions at the end of 2018, while in 2017, the share of domestic investors in banking assets became higher than the share of foreign investors (European Banking Federation 2019). However, a rising concentration of CEE countries’ banking systems after 2009 is easily observable, with only a few exceptions (Estonia, Hungary and Slovakia). This is correlated with the shares of the largest five credit institutions in each country in total assets, reported by European Central Bank. Thus, in 2018, the largest credit institutions held a share of 91% in total assets in Estonia and Latvia, 81% in Lithuania and 79% in Croatia, but only 50% in Poland and Hungary. Albeit partially explained by the size of populations in these countries, differences are also the effect of multinational banks’ presence in the region, with particularities from one country to another, including here the acquisitions of local banks or mergers between local branches of foreign banks (such as the merger between the Croatian branch of Société Générale and OTP, or between Nordea and DNB in Baltic countries). Overall, 59 M&A deals have been concluded in the CEE region between 2015 and 2018 only, according to Deloitte (2019), mostly in Poland and Romania (10 M&A deals each).
Regarding the macroeconomic variables, we note the improvement in public deficits in all CEE countries after 2009 and, in many countries, the transformation in the public surplus towards the end of the period (Bulgaria, Croatia, Estonia, Latvia, Slovakia and Slovenia), although this was not higher than 2% of the GDP. The exceptions were Czechia (the surplus in 2010, 2011 and 2014 transformed into a slight deficit in 2017 and 2018) and Romania (deficit after 2016, fueled by the populist measure of the social-democratic government). In the inflation area, all CEE countries saw their prices diminish their increase after 2011, while several of them even experienced deflation between 2014 and 2016 (Bulgaria, Romania, Croatia, Slovenia, Poland, Lithuania and Slovakia). The unemployment rate, the last macroeconomic variable used in our research, was on a robust downward trend in all CEE countries after 2009, although it somewhat increased between 2011 and 2013. Thus, the 11 countries included in our analysis had unemployment rates ranging between 5.86% (Slovenia) and 17.51% (Latvia) in 2009, but only ranging between 2.24% (Czechia) and 8.43% (Croatia) in 2013. The labor conditions in the CEE region have improved and real wages rose in almost all countries, which helped the decreasing unemployment trend (Deloitte 2019).
4.2. The Interplay between Bank Profitability, Financial System Attributes and the Macroeconomic Environment in CEE
This section of our paper reports the results of the two-step system GMM estimations for the two models used in the research: first, we show the results of the panel regressions estimations when financial market variables are considered as independent regressors; then, we report the estimations for panels which included the macroeconomic variables as regressors.
Table 4 presents the results for financial market variables panels, i.e., CREDIT, HERFIND, NPL and SOLVRATE, for each bank profitability measure considered—ROA, ROE and NIM. All models include, as presented in Section 2, the lagged values of the dependent variables as regressors. For all bank profitability measures, their 1-lag values are statistically significantly influencing the current values of profitability, but this influence has different directions for ROA and ROE versus NIM. Thus, lagged values of ROA and ROE negatively impact their current values, while previous 1-lag NIM positively influences current NIM. This points out towards a persistence of profitability as derived from the interest margin in CEE banking systems, which is correlated with the higher importance of net interest margin as a source of profitability in these countries, particularly when we observe that the panel regression coefficient for 1-lag NIM is higher, in absolute terms, compared to the similar coefficients for ROA and ROE (0.353 against 0.126 and 0.098 for ROA and ROE, respectively). At the same time, bank profitability measured by ROA and ROE shows a “reversion to mean” behavior, as banks in the CEE region do not seem to be able to maintain good past levels of profitability.
Table 4.
Results of System GMM estimations for financial market variables panels.
Regarding the influence of financial market variables on CEE banks’ profitability, we notice the significance of these variables for banks’ profitability, which is in line with previous findings of Saif-Alyousfi (2020) in the case of Asian banks, Onofrei et al. (2018) on CEE countries or Messai et al. (2015) for Western European countries. The negative link between CREDIT and all profitability measures suggests that a higher importance of credit to the private sector in these economies was detrimental to their banks’ profitability, explained by the higher exposure to credit risk of banks. We explain our findings by the declining shares of credit to the private sector in most CEE countries included in our sample, combined with the good performance in ROA, ROE and NIM, which is a direct reflection of diminishing credit risk with significant impact on CEE banks’ profitability. Our results, thus, confirm the findings of Ayaydin and Karaaslan (2014) for Turkey, and of Firtescu and Roman (2015) for Romania and Bulgaria. This may also be correlated with a general decline of private sector loans in CEE banks’ portfolios over time, while other sources of profit became more important, particularly in a low interest environment, such as asset management, changing fee structures or electronic banking and digitalization (Tennant and Sutherland 2014; Valahzaghard and Bilandi 2014; Isshaq et al. 2019).
In the banking sector, concentration refers to the accumulation of funds in a small number of large banks, which leads to a decisive role played by them over smaller banks. Our GMM dynamic panel estimations show that the banking market concentration in CEE countries, measured by the Herfindahl index, negatively impacted ROA and ROE, but we evidence no influence on NIM. Interestingly, our results indicate an almost 10 times higher impact of banking market concentration on ROE compared to ROA, which is a finding that needs to be further investigated. The negative relationship between market concentration and banks’ profitability in CEE countries confirms previous results in the literature that studied emerging and less developed economies, such as Tunisia (Naceur 2003), Czechia (Černohorský 2015), South-Eastern Europe (Athanasoglou et al. 2006), Central and Eastern Europe (Căpraru and Ihnatov 2014) or the MENA region (Zoghlami and Bouchemia 2020), but one needs to consider that the banking market concentration in the CEE region is low to middle, apart from Estonia and Lithuania. This opens the road for consolidation in the banking market in the future, which might change the relationship between concentration and profitability.
The ratio of non-performing loans to total loans (NPL) has a negative influence on ROA and ROE, but it seems to have no effect on NIM. Thus, our results are in accordance with the results of literature on the topic that finds a negative link between lower bank’s assets quality, in the form of non-performing loans, and profitability—Athanasoglou et al. (2008) for South-Eastern European countries, Coffinet and Lin (2010) for French banks, Psaila et al. (2019) in the case of Euro-Mediterranean countries and Akter and Roy (2017) for banks in Bangladesh. We should also mention that 5 of the 11 countries included in our sample became members of the European Monetary Union and adopted the euro (Estonia, Latvia, Lithuania, Slovakia and Slovenia) between 2007 and 2015, which required the compliance of the banking system to the requirements imposed by the nominal and real convergence. Moreover, Bulgaria introduced measures to support a smooth transition for Exchange Rate Mechanism (ERM) II participation and further euro adoption (European Council 2018), which have also resulted in improvements in loan quality in the banking system.
Last but not least, we evidence a negative link between solvency rates (SOLVRATE) and banks’ profitability in CEE economies, regardless of how profitability is measured. This result confirms the findings of Akbas (2012), who stressed that higher solvency rates, which banking systems in CEE countries benefit of, reduce the leverage effect, increase the financing costs and negatively impact profits, which is in line with the findings of Ćurak et al. (2012), who identified the same negative relationship between solvency rates and profitability in the case of Macedonian banks. Furthermore, Goddard et al. (2010) have shown that profitability is higher for more efficient and diversified banks, but lower for those that are highly capitalized, in a study of eight banking systems in the European Union before the 2007–2009 crisis. The explanation for this result resides in the high opportunity cost of holding considerable levels of capital, which tends to diminish shareholder returns. As in other studies (Petria et al. 2015), the results of our dynamic panel estimations reveal a higher impact of the solvency rate on ROE compared to ROA and NIM (the regression coefficient is −1.904 for ROE compared to −0.111 for ROA and −0.082 for NIM). On the other hand, our results contradict many findings that show that higher solvency is associated to improved bank profitability, in both developed and emerging countries—see, for example, Athanasoglou et al. (2006) for South-Eastern European countries, Petria et al. (2015) for the 27 EU countries and Dietrich and Wanzenried (2009) for Switzerland.
Moving to the second part of our estimations, Table 5 shows the results of the GMM panel regressions when macroeconomic variables were considered as regressors. Here, the 1-period lagged values of profitability variables are significant for their current values only in the case of ROA—positive coefficient—and NIM—negative coefficient—but not for ROE. The signs of the coefficients for both ROA and NIM are the opposite compared to the dynamic panel that included financial market variables, somehow suggesting a contrarian effect of macroeconomic characteristics on the persistence of profitability in CEE banking systems from one year to another compared to the impact of financial market variables. Regarding the macroeconomic variables—BUDBAL, INFLATION and UNEMP—we found statistical significance for all of them, which is in line with the vast research that reveals the importance of the macroeconomic framework for the performance of the banking system—see, for example, Cetin (2019) for G20 countries, Laubach (2009) for the United States, Flamini et al. (2009) for Sub-Saharan Africa, Staikouras and Wood (2004) and Goddard et al. (2004) for European Union countries, to name just a few. At the same time, the relevance of each of the macroeconomic variables considered in our models is different depending on the profitability measure used.
Table 5.
Results of System GMM estimations for macroeconomic variables panels.
Previous research on the influence of public deficit on banks’ profitability has reached mixed results, indicating either positive links between deficits and ROA or ROE—Sayilgan and Yildirim (2009) or Kaya (2002) for Turkey—or negative links, driven by decreasing demand for credit—Blanchard and Perotti (2002) in the case of United States, Mulas-Granados et al. (2009) and Ilzetzki et al. (2010) for advanced and emerging countries. At the same time, consistent research has shown that public deficits have significant impact on interest rates; hence, we expected a negative relationship between public deficit and banks’ profitability in our models. In fact, our results indicate that public budget deficit is negatively linked to all profitability measures, with a higher relevance for ROE compared to ROA and NIM, which means that higher public deficits for CEE countries, as a share of the GDP, have depressed banking systems’ profitability after the 2007–2009 financial crisis. Since, as noted above, public spending conditions improved in the countries in our sample as we approach 2018, this has triggered increases in the profitability of banks in the region.
The second macroeconomic variable included in our models was the inflation rate (INFLATION), of which we have not formed a specific expectation, given the previous inconclusive results in the extant literature, outlined in Section 2 of the paper. Our results indicate a significant and positive influence of inflation on NIM, but a negative one on ROE. Thus, higher inflation rates are correlated with higher net interest margins achieved by banks, which means that banks are riding the inflation waves and include a higher premium for inflation in lending rates compared to deposit rates. It is worth noting, in this context, that in the years of lower inflation rates and even deflation (2011 to 2016, but this is variable from one country to another), NIM has not seen declines that incorporate these developments in almost any country in the region. This hints towards the considerable power that banks in CEE countries have in terms of financing the economy compared to the capital market, although banking market penetration, measured as banking assets per GDP, remained at rather low levels in most of the countries in the region over the entire timeframe considered in our analysis (Deloitte 2019). Precisely the underdevelopment of banking and financial markets in the region may be the context for the positive impact of inflation on net interest margin, as implied by Boyd and Champ (2006). The positive effect of inflation on net interest margin was also evidenced by Atasoy (2007) for Turkey, Guru et al. (2002) for Malaysia and Flamini et al. (2009) for African countries. Regarding ROE, our estimated indicate a negative impact of higher inflation rates, which is in accordance with the results of Abreu and Mendes (2002) in their research of European banking systems, Abdelaziz et al. (2011) in Tunisia and Moyo and Tursoy (2020) in an investigation of commercial banks’ profitability in South Africa.
The unemployment rate (UNEMP) is the last macroeconomic variable included in our estimations of banks’ profitability in CEE countries, for which previous research has shown significance, given its importance for banks’ operating expenses, stability, the share on non-performing loans and so on. However, existing research fails to establish a clear-cut positive or negative link between unemployment and bank profitability. Our estimations indicate a negative impact of unemployment on CEE banks’ profitability, with statistically significant coefficients for ROA and NIM, but not for ROE. These findings suggest that, for banks in the region, the effect of unemployment on banks’ profitability is felt at an operational level, particularly when we observe that unemployment is positively and statistically significantly correlated with the importance of non-performing loans (NPL)—0.493—and the credit to private sector—0.497 (see Table 3). These findings confirm the ones of Clair (2004) in the case of Singaporean banks, Heffernan and Fu (2008) for Chinese banks, Abreu and Mendes (2002) for Spanish, German and French banking systems and of Pesola (2005) for Nordic European countries.
5. Conclusions
The aim of this research was to highlight the major determinants of banking profitability in the CEE banking sectors, given the better resilience of these banking sectors in front of the challenges posed by the last financial crisis and the current pandemic crisis. We have applied a two-step GMM approach to select the most significant factors impacting on ROA, ROE and NIM. We analyzed separately the macroeconomic determinants from the determinants specific to the financial and banking market to better emphasize their impact on the banking profitability ratios.
Summarizing our findings, the budget balance strongly and negatively impacts on the banking profitability ratios (the strongest impact is on ROE), except on NIM, where the impact is weak, but still negative. Inflation rate strongly and negatively impacts on ROE, but its impact on NIM is positive. The weakest positive impact is on ROA. The unemployment rate also negatively impacts on the banking profitability rates, but its influence is weaker than the impact of the budget balance or inflation. The weakest impact is also displayed on NIM. The most significant factor specific to the financial and banking market is the concentration rate of the banking market. Its impact is strong and negative, especially for ROE and ROA. NPL strongly and negatively impacts ROA and ROE, too, while the impact on NIM is weak, similar to the impact of the solvency ratio. The credit to the non-governmental sector negatively and significantly impacts ROE, while the impact on ROA and NIM is weak and negative.
These findings can be explained by the decrease of the credit to the private sector, while the NPL sharply increased in many CEE countries as a result of the 2007–2008 crisis. The profitability ratios (ROE and ROA) of the CEE banking sectors largely fluctuated during 2008–2015 because of the above-mentioned developments of the non-governmental credit and NPL, except for the Baltic states, where the share of NPL was not high and the credit granted to the private sector was rather stable. The Baltic banking sectors also display the highest capitalization rate and concentration rate among the analyzed banking sectors. The concentration rate increased for all the CEE banking sectors during 2008–2015, because some banks withdrew from this region then, and there were many mergers and acquisitions during those specific times. Slovenia, on the other hand, displayed the lowest capitalization rate during the analyzed period and faced a sharp decrease of the non-governmental credit and a sharp increase of the NPL ratio, which determined high negative ROA and ROE between 2008 and 2015. However, although a better capitalization supports the decreasing of the financing costs, the banking sectors faced large difficulties in obtaining financing in the context of the Global financial crisis and the sovereign debt crisis that followed, which may explain the negative relation between the capitalization and the profitability ratios in the CEE region. Moreover, these determinants, specific to the financial and banking markets, are also linked to the macroeconomic determinants of the banking profitability. The rise of the unemployment rate in the financial crisis context determined a significant increase of the NPL in the CEE region, which negatively affected the banking profitability ratios of the CEE banking sectors. The increased public deficits for a long period determined a rise of the interest rates during 2008–2015, which caused a sharp decrease of the non-governmental credit in the CEE region, and an increase of the NPL ratio, which negatively impacted on the banking profitability ratios. Although many previous findings highlighted the positive impact of the inflation on the profitability ratios, researchers that investigated the European banking sectors or CEE banking sectors found the same negative relation between inflation and profitability ratios, except for NIM. The explanation is related to the effect of inflation on the increase of NPL and interest rates that cause a drop in the banking profitability ratios.
Considering the negative impact of the macroeconomic determinants on the banking profitability ratios, the authorities should adopt correlated monetary, fiscal and social measures to keep inflation, unemployment and public deficit at low levels. This is especially difficult during the crisis periods. For the banking management, based on these current findings, we can recommend lower capitalization rates considering that the CEE banking sectors display the highest capitalization ratios in Europe. These ratios can be reduced without jeopardizing the banking solvency, especially now, when the NPL ratios are quite low compared to the period of the financial crisis.
Author Contributions
Conceptualization, A.H. and M.R.; methodology, A.H.; software, A.H.; validation, A.H., M.R. and L.B.; formal analysis, A.H. and L.B.; investigation, M.R. and S.M.D.; resources, M.R. and A.H.; data curation, A.H.; writing—original draft preparation, A.H., M.R. and L.B.; writing—review and editing, L.B. and S.M.D.; visualization, A.H. and M.R.; supervision, A.H. and M.R. All authors have read and agreed to the published version of the manuscript.
Funding
No funding was received for this research.
Informed Consent Statement
Not applicable.
Data Availability Statement
Data sources are displayed in Table 1. Data are freely available and can be accessed by everyone.
Conflicts of Interest
The authors declare no conflict of interest.
Note
| 1. | We have tested for preliminary significance with the following variables: Nominal GDP per capita, GDP growth rate, the tax and contribution rate as a percentage of bank profits, 10-year bond yields, Nominal effective exchange rate (NEER), Real effective exchange rate (REER) and Equity market capitalization ratio to GDP. It is difficult to explain the lack of significance of each of these variables for bank profitability in CEE countries; however, most likely, this is due to the limited period under analysis, the particularities of CEE countries’ exchange rate regimes (in the case of NEER and REER) and the specificities of the banking systems included in the analysis. |
References
- Abdelaziz, Hakimi, Djelassi Mouldi, and Helmi Helmi. 2011. Financial Liberalization and Banking Profitability: A Panel Data Analysis for Tunisian Bank. International Journal of Economics and Financial Issues 1: 19–32. [Google Scholar]
- Abreu, Margarida, and Victor Mendes. 2002. Commercial Bank Interest Margins and Profitability: Evidence for Some E.U. Countries. University of Porto Working Paper Series, No. 122; Porto: University of Porto. [Google Scholar]
- Akbas, Halil Emre. 2012. Determinants of Bank Profitability: An Investigation on Turkish Banking Sector. Öneri Dergisi 10: 103–10. [Google Scholar]
- Akter, Rozina, and Jewel Kumar Roy. 2017. Non-Performing Loan on Profitability: Evidence from Banking Sector of Dhaka Stock Exchange. International Journal of Economics and Finance 9: 126–32. [Google Scholar] [CrossRef]
- Alesina, Alberto, Silvia Ardagna, Roberto Perotti, and Fabio Schiantarelli. 2002. Fiscal Policy, Profits, and Investment. American Economic Review 92: 571–89. [Google Scholar] [CrossRef]
- Alexiou, Constantinos, and Vogiazas Sofoklis. 2009. Determinants of bank profitability: Evidence from the Greek banking sector. Economic Annals 182: 93–118. [Google Scholar] [CrossRef]
- Al-Homaidi, Eissa, Faozi Almaqtari, Ali Yahya, and Amgad Khaled. 2020. Internal and external determinants of listed commercial banks’ profitability in India: Dynamic GMM approach. International Journal of Monetary Economics and Finance 13: 34–67. [Google Scholar] [CrossRef]
- Anastasiou, Dimitrios, Helen Louri, and Efthymios Mike Tsionas. 2016. Determinants of non-performing loans: Evidence from Euro-area countries. Finance Research Letters 18: 116–19. [Google Scholar]
- Anbar, Adem, and Deger Alper. 2011. Bank Specific and Macroeconomic Determinants of Commercial Bank Profitability: Empirical Evidence from Turkey. Business and Economics Research Journal 2: 139–52. [Google Scholar]
- Andrieș, Alin, Bogdan Căpraru, Florentina Ieșan-Muntean, and Iulian Ihnatov. 2016. The Impact of International Financial Crisis on Bank Performance in Eastern and Central European Countries. EuroEconomica 35: 111–26. [Google Scholar]
- Arellano, Manuel, and Stephen Bond. 1991. Some tests of specification for panel data: Monte Carlo evidence and an application to employment equations. The Review of Economic Studies 58: 277–97. [Google Scholar] [CrossRef]
- Arellano, Manuel, and Olympia Bover. 1995. Another look at the instrumental variable estimation of error-components models. Journal of econometrics 68: 29–51. [Google Scholar] [CrossRef]
- Atasoy, Hasan. 2007. Expenditure-Income Analysis in Turkish Banking Sector and Determinants of Profitability. Un Published Dissertations of Senior Specialists. Ankara: Central Bank of Turkey. [Google Scholar]
- Athanasoglou, Panayiotis, Matthaios Delis, and Christos Staikouras. 2006. Determinants of Bank Profitability in the South Eastern European Region. WP No 47. Athens: Bank of Greece. [Google Scholar]
- Athanasoglou, Panayiotis, Sophocles Brissimis, and Matthaios Delis. 2008. Bank-specific, industry-specific and macroeconomic determinants of bank profitability. Journal of International Financial Markets, Institutions and Money 18: 121–36. [Google Scholar] [CrossRef]
- Ayaydin, Hasan, and İbrahim Karaaslan. 2014. Stock market development, bank concentration, ownership structure, and bank performance: Evidence from Turkey. Journal of Economics and Political Economy 1: 49–67. [Google Scholar]
- Banto, Jean Michel, and Atoke Fredia Monsia. 2021. Microfinance institutions, banking, growth and transmission channel: A GMM panel data analysis from developing countries. The Quarterly Review of Economics and Finance 79: 126–50. [Google Scholar] [CrossRef]
- Barros, Carlos Pestana, Candida Ferreira, and Jonathan Willians. 2007. Analysing the determinants of performance of best and worst European banks: A mixed logit approach. Journal of Banking and Finance 31: 2189–203. [Google Scholar] [CrossRef]
- Beckmann, Rainer. 2007. Profitability of Western European Banking Systems: Panel Evidence on Structural and Cyclical Determinants. Discussion Paper Series 2: Banking and Financial Studies, no. 17; Frankfurt am Main: Deutsche Bundesbank. [Google Scholar]
- Berge, Tor Oddvar, and Katrine Godding Boye. 2007. An analysis of banks’ problem loans. Economic Bulletin 78: 65–76. [Google Scholar]
- Berger, Allen. 1995. The relationship between capital and earnings in banking. Journal of Money, Credit and Banking 27: 432–56. [Google Scholar] [CrossRef]
- Blanchard, Olivier, and Roberto Perotti. 2002. An Empirical Characterization of the Dynamic Effects of Changes in Government Spending and Taxes on Output. The Quarterly Journal of Economics 117: 1329–68. [Google Scholar] [CrossRef]
- Blundell, Richard, and Stephen Bond. 1998. Initial conditions and moment restrictions in dynamic panel data models. Journal of Econometrics 87: 115–43. [Google Scholar] [CrossRef]
- Boyd, John, and Bruce Champ. 2006. Inflation, Banking and Economic Growth; Cleveland: Federal Reserve Bank of Cleveland.
- Boyd, John, Ross Levine, and Bruce Smith. 2001. The Impact of Inflation on Financial Sector Performance. Journal of Monetary Economics 47: 221–48. [Google Scholar] [CrossRef]
- Canzoneri, Matthew, Robert Cumby, and Behzad Diba. 2002. Should the European Central Bank and the Federal Reserve be concerned about fiscal policy? Paper presented at Symposium on “Rethinking Stabilization Policy”, Jackson Hole, WY, USA, August 29–31. [Google Scholar]
- Căpraru, Bogdan, and Iulian Ihnatov. 2014. Banks’ Profitability in Selected Central and Eastern European Countries. Procedia Economics and Finance 16: 587–91. [Google Scholar] [CrossRef]
- Černohorský, Jan. 2015. The Concentration and Profitability in the Czech Banking System. Scientific Papers of the University of Pardubice, Series D: Faculty of Economics and Administration 22: 30–41. [Google Scholar]
- Cetin, Huseyin. 2019. Inflation and Bank Profitability: G20 Countries Banks Panel Data Analysis. Paper presented at 2019 International Conference on Management Science and Industrial Engineering, Phuket, Thailand, May 24; pp. 168–72. [Google Scholar]
- Chiorazzo, Vincenzo, Carlo Milani, and Francesca Salvini. 2008. Income diversification and bank performance: Evidence from Italian banks. Journal of Financial Services Research 33: 181–203. [Google Scholar] [CrossRef]
- Christaria, Fiola, and Ratnawati Kurnia. 2016. The Impact of Financial Ratios, Operational Efficiency and Non-Performing Loan Towards Commercial Bank Profitability. Accounting and Finance Review (AFR) 1: 43–50. [Google Scholar]
- Claeys, Sophie, and Rudi van der Vennet. 2004. Determinants of bank interest margins in Central and Eastern Europe: A comparison with the West. Economic Systems 32: 197–216. [Google Scholar] [CrossRef]
- Clair, Robert Wayne. 2004. Macroeconomic Determinants of Banking Financial Performance and Resilience in Singapore, Monetary Authority of Singapore, Staff Paper, No. 38. Available online: https://www.mas.gov.sg/-/media/MAS/resource/publications/staff_papers/MAS_Staff_Paper_No_38_RSTC_V3.pdf (accessed on 29 May 2021).
- Coffinet, Jerome, and Surong Lin. 2010. Stress Testing Banks’ Profitability: The Case of French Banks. Working Paper No. 306. Paris: Banque de France. [Google Scholar]
- Ćurak, Marijana, Klime Poposki, and Sandra Pepur. 2012. Profitability Determinants of the Macedonian Banking Sector in Changing Environment. Procedia—Social and Behavioral Sciences 44: 406–16. [Google Scholar] [CrossRef]
- Deloitte. 2019. CEE Banking Consolidation Perking Up. Available online: https://www2.deloitte.com/content/dam/Deloitte/ce/Documents/finance/ce-banking-study-2019.pdf (accessed on 1 June 2021).
- Demirgüç-Kunt, Ash, and Harry Huizinga. 1999. Determinants of commercial bank interest margins and profitability: Some international evidence. World Bank Economic Review 13: 379–408. [Google Scholar] [CrossRef]
- DeYoung, Robert, and Tara Rice. 2004. Non-interest income and financial performance at US commercial banks. The Financial Review 39: 101–27. [Google Scholar] [CrossRef]
- Dietrich, Andreas, and Gabrielle Wanzenried. 2009. What Determines the Profitability of Commercial Banks? New Evidence from Switzerland. Paper presented at 12th Conference of the Swiss Society for Financial Market Researches, Geneva, Switzerland, April 3. [Google Scholar]
- Eesti Pank. 2014. Stricter Capital Requirements for Banks as of August, Press Release of Eesti Pank. Available online: https://www.eestipank.ee/en/press/stricter-capital-requirements-banks-august-31072014 (accessed on 1 June 2021).
- European Banking Federation. 2019. Banking in Europe: EBF Facts & Figures 2019. Frankfurt am Main: European Banking Federation. Available online: https://www.ebf.eu/wp-content/uploads/2020/01/EBF-Facts-and-Figures-2019-Banking-in-Europe.pdf (accessed on 31 May 2021).
- European Council. 2018. Statement on Bulgaria’s Path towards ERM II Participation. Available online: https://www.consilium.europa.eu/ro/press/press-releases/2018/07/12/statement-on-bulgaria-s-path-towards-erm-ii-participation/ (accessed on 1 June 2021).
- Fadzlan, Sufian. 2009. Determinants of Bank profitability in a Developing Economy: Empirical evidence from the China Banking Sector. Journal of Asia-Pacific Business 10: 201–307. [Google Scholar]
- Firtescu, Bogdan, and Angela Roman. 2015. Internal and external determinants of commercial banks profitability: Empirical evidence from Bulgaria and Romania. Annals of the University of Oradea, Economic Science Series 24: 896–904. [Google Scholar]
- Flamini, Valentina, Calvin McDonalds, and Liliana Schumacher. 2009. Determinants of Commercial Banks Profitability in Sub-Saharan Africa. IMF Working Paper no. 15. Washington D.C., U.S.. Available online: https://www.imf.org/external/pubs/ft/wp/2009/wp0915.pdf (accessed on 1 January 2009).
- Frøyland, Esped, and Kai Larsen. 2002. How Vulnerable Are Financial Institutions to Macroeconomic Changes? An Analysis Based on Stress Testing. Norges Bank. Economic Bulletin 3/2002. Norges Bank. Available online: https://norges-bank.brage.unit.no/norges-bank-xmlui/handle/11250/2504526 (accessed on 4 January 2021).
- García-Herrero, Alicia, Sergio Gavilá, and Daniel Santabárbara. 2009. What explains the low profitability of Chinese banks? Journal of Banking and Finance 33: 2080–92. [Google Scholar] [CrossRef]
- Goddard, John, Phil Molyneux, and John Wilson. 2004. Dynamic of growth and profitability in banking. Journal of Money, Credit and Banking 36: 1069–90. [Google Scholar] [CrossRef]
- Goddard, John, Hong Liu, Phil Molyneux, and John Wilson. 2010. Do bank profits converge? European Financial Management 19: 346–65. [Google Scholar]
- Guru, Balachendher, John Staunton, and Bala Balashanmugam. 2002. Determinants of Commercial Bank Profitability in Malaysia. Paper presented at 12th Annual Australian Finance and Banking Conference, Sydney, Australian, December 16–17. [Google Scholar]
- Hamadi, Hassan, and Ali Awdeh. 2012. The Determinants of Net Interest Margins of Commercial Banks in Lebanon. Journal of Money, Investment and Banking 23: 118–32. [Google Scholar]
- Heffernan, Shelagh, and Maggie Fu. 2008. The Determinants of Bank Performance in China. Working Paper Series (WP-EMG-03-2008); London: Cass Business School, City University. Available online: http://ssrn.com/abstract=1247713 (accessed on 15 May 2021).
- Hernando, Ignacio, and Maria Nieto. 2007. Is the Internet delivery channel changing banks’ performance? The case of Spanish banks. Journal of Banking and Finance 31: 1083–99. [Google Scholar] [CrossRef]
- Iannotta, Giuliano, Giacomo Nocera, and Andrea Sironi. 2007. Ownership structure, risk and performance in the European banking industry. Journal of Banking and Finance 31: 2127–49. [Google Scholar] [CrossRef]
- Ilzetzki, Ethan, Enrique Mendoza, and Carlos Vegh. 2010. How Big (Small?) are Fiscal Multipliers? IMF Working Paper 52. Washington, D.C.: International Monetary Fund. [Google Scholar]
- International Monetary Fund. 2018. Euro Area Policies: Financial Sector Assessment Program-Technical Note-Systemic Risk Analysis. IMF Staff Country Reports 18: 8–86. [Google Scholar]
- Isfaq, Jawad, and Naeem Ullah Khan. 2015. Bank profitability, inflation and cost efficiency—A case of Pakistani banks. International Journal of Business and Management Review 3: 41–53. [Google Scholar]
- Isshaq, Zangina, Benjamin Amoah, and Ishmael Appiah-Gyamerah. 2019. Non-interest income, risk and bank performance. Global Business Review 20: 595–612. [Google Scholar] [CrossRef]
- Jiang, Guorong, Eve Law, and Angela Sze. 2003. The Profitability of the Banking Sector in Hong Kong. Hong Kong Monetary Authority Quarterly Bulletin, September 16. [Google Scholar]
- Kanas, Angelos, Dimitrios Vasiliou, and Nikolaos Eriotis. 2012. Revisiting bank profitability: A semi-parametric approach. Journal of International Financial Markets, Institutions and Money 22: 990–1005. [Google Scholar] [CrossRef]
- Karasulu, Meral. 2001. The Profitability of the Banking Sector in Korea. IMF Country Report, July 2. [Google Scholar]
- Kasman, Adnan, Gokce Tunc, Gulin Vardar, and Berna Okan. 2010. Consolidation and commercial bank net interest margins: Evidence from the old and new European Union members and candidate countries. Economic Modelling 27: 648–55. [Google Scholar] [CrossRef]
- Kaya, Tanya Y. 2002. Determinants of Profitability in Turkish Banking Sector. No 1. Istanbul: Turkish Banking Regulation and Supervision Agency. [Google Scholar]
- Khan, Ihtesham, and Adnan Ahmad. 2017. Assessing banks internal factors as determinants of non-performing loans: Evidence from Pakistani commercial banks. Journal of Managerial Sciences 11: 109–25. [Google Scholar]
- Kingu, Peter, Macha Salvio, and Raphael Gwahula. 2018. Impact of Non-Performing Loans on Bank’s Profitability: Empirical Evidence from Commercial Banks in Tanzania. International Journal of Scientific Research and Management 6: 71–79. [Google Scholar]
- Kirchner, Markus, and Sweder van Wijnbergen. 2012. Fiscal Deficits, Financial Fragility, and the Effectiveness of Government Policies, Tinbergen Institute Discussion Paper, TI 2012-044/2. Available online: https://papers.tinbergen.nl/12044.pdf (accessed on 10 May 2021).
- Kolev, Atanas, and Sanne Zwart. 2013. Banking in Central and Eastern Europe and Turkey. Challenges and Opportunities. EIB 5–13. Available online: https://www.eib.org/attachments/efs/economic_report_banking_cee_turkey_en.pdf (accessed on 3 May 2021).
- Korytowski, Marcin. 2018. Banks’ profitability determinants in post-crisis European Union. IJFBS 7: 1–12. [Google Scholar] [CrossRef]
- Krakah, Anthony Kofi, and Aaron Ameyaw. 2010. Determinants of Bank’s Profitability in Ghana. Working Paper: Blekinge Tekniska Högskola. Available online: http://www.camessays.com/upload/doc/Thesis%20bank.pdf (accessed on 10 May 2021).
- Laubach, Thomas. 2009. New Evidence on the Interest Rate Effects of Budget Deficits and Debt. Journal of the European Economic Association 7: 858–85. [Google Scholar] [CrossRef]
- Messai, Ahlem, Mohamed Gallali, and Fathi Jouini. 2015. Determinants of bank profitability in Western European Countries evidence from system GMM estimates. International Business Research 8: 30. [Google Scholar] [CrossRef][Green Version]
- Mester, Loretta. 1996. A study of bank efficiency taking into account risk preferences. Journal of Banking and Finance 20: 1025–1045. [Google Scholar] [CrossRef]
- Mihajlović, Ljiljana Stosic, and Ljiljana Jovic. 2017. The financial sector of the state—The structure of the banking system with a banking sector in Central and Eastern European countries. Journal of Process Management—New Technologies, International 5: 13–29. [Google Scholar] [CrossRef]
- Mirzaei, Ali, Tomoe Moore, and Guy Liu. 2013. Does market structure matter on banks’ profitability and stability? Emerging vs. advanced economies. Journal of Banking & Finance 37: 2920–37. [Google Scholar]
- Moinescu, Bogdan. 2008. Banking Stability and unemployment. An empirical analysis on Romania. Paper presented at IMF-NBR Regional Seminar on Financial Stability Issues, Sinaia, Romania, September 18–19. [Google Scholar]
- Molyneux, Phil. 1995. Structure and Performance in European Banking. Applied Economics 27: 155–59. [Google Scholar] [CrossRef]
- Molyneux, Phil, and John Thornton. 1992. Determinants of European bank profitability: A note. Journal of Banking and Finance 16: 1173–78. [Google Scholar] [CrossRef]
- Moyo, Delani, and Turgut Tursoy. 2020. Impact of Inflation and Exchange Rate on the Financial Performance of Commercial Banks in South Africa. Available online: https://mpra.ub.uni-muenchen.de/101383/1/MPRA_paper_101383.pdf (accessed on 19 May 2021).
- Mulas-Granados, Carlos, Emanuele Baldacci, and Sanjeev Gupta. 2009. How Effective is Fiscal Policy Response in Systemic Banking Crises? IMF Working Papers 09/160. Washington, D.C.: International Monetary Fund. [Google Scholar]
- Naceur, Sami Ben. 2003. The Determinants of the Tunisian Banking Industry Profitability: Panel Evidence. Paper presented at Economic Research Forum (ERF) 10th Annual Conference, Marrakesh, Morocco, December 16–18; Available online: http://www.mafhoum.com/press6/174E11.pdf (accessed on 19 May 2021).
- Naceur, Ben Sami, and Mohamed Goaied. 2008. The determinants of commercial bank interest margin and profitability: Evidence from Tunisia. Frontiers in Finance and 19 Economics 5: 106–30. [Google Scholar] [CrossRef][Green Version]
- Naruševičius, Laurynas. 2018. Bank profitability and macroeconomy: Evidence from Lithuania. Technological and Economic Development of Economy 24: 383–405. [Google Scholar] [CrossRef]
- Nichols, Chris. 2017. The fallacy of NIM. The Data on Net Interest Margin and Bank Performance. Available online: https://www.linkedin.com/pulse/data-net-interest-margin-bank-performance-chris-nichols/ (accessed on 5 June 2021).
- Olson, Dennis, and Taisier Zoubi. 2011. Efficiency and Bank Profitability in MENA Countries. Emerging Markets Review 12: 94–110. [Google Scholar] [CrossRef]
- Onofrei, Mihaela, Ionel Bostan, Angela Roman, and Bogdan Narcis Firtescu. 2018. The determinants of commercial bank profitability in CEE countries. Romanian Statistical Review 2: 33–46. [Google Scholar]
- Pan, Qinhua, and Meiling Pan. 2014. The Impact of Macro Factors on the Profitability of China’s Commercial Banks in the Decade after WTO Accession. Open Journal of Social Sciences 2: 64–69. [Google Scholar] [CrossRef][Green Version]
- Pasiouras, Fotios, and Kyriaki Kosmidou. 2007. Factors influencing the profitability of domestic and foreign commercial banks in the European Union. Research in International Business and Finance 21: 222–37. [Google Scholar] [CrossRef]
- Pesola, Jarmo. 2005. Banking Fragility and Distress: An Economic Study of Macroeconomic Determinants. Research Discussion Paper 13. Helsinki: Bank of Finland. [Google Scholar]
- Petkovski, Mihail, Jordan Kjosevski, and Kiril Jovanovski. 2018. Empirical Panel Analysis of Non-Performing Loans in the Czech Republic. What are their Determinants and How Strong is Their Impact on the Real Economy? Finance a úvěr-Czech Journal of Economics and Finance 68: 460–80. [Google Scholar]
- Petria, Nicolae, Bogdan Capraru, and Iulian Ihnatov. 2015. Determinants of banks’ profitability: Evidence from EU 27 banking systems. Procedia Economics and Finance 20: 518–24. [Google Scholar] [CrossRef]
- Psaila, Ayrton, Johnatan Spiteri, and Simon Grima. 2019. The Impact of Non-Performing Loans on the Profitability of Listed Euro-Mediterranean Commercial Banks. International Journal of Economics and Business Administration VII: 166–96. [Google Scholar]
- Rumler, Fabio, and Walter Waschiczek. 2012. Have changes in the Financial Structure Affected Bank Profitability? Evidence for Austria. The European Journal of Finance 22: 803–24. [Google Scholar] [CrossRef]
- Saif-Alyousfi, Abdulazeez. 2020. Determinants of bank profitability: Evidence from 47 Asian countries. Journal of Economic Studies. [Google Scholar] [CrossRef]
- Sandor, Gardo, and Martin Reiner. 2010. The Impact of the Global Economic and Financial Crisis on Central, Eastern and South-Eastern Europe: A Stock-Taking Exercise. ECB Occasional Paper, No. 114. Frankfurt am Main: European Central Bank (ECB). [Google Scholar]
- Sayilgan, Guven, and Ozgur Yildirim. 2009. Determinants of Profitability in Turkish Banking Sector: 2002–2007. International Research Journal of Finance and Economics 28: 207–13. [Google Scholar]
- Smirlock, Michael. 1985. Evidence on the (non) relationship between concentration and profitability in banking. Journal of Money, Credit, and Banking 17: 69–83. [Google Scholar] [CrossRef]
- Staikouras, Christos, and Geoffrey Wood. 2004. The Determinants of European Bank Profitability. International Business and Economics Research Journal 3: 57–68. [Google Scholar] [CrossRef]
- Sufian, Fadzlan. 2009. Factors Influencing Bank Profitability in a Developing Economy: Empirical Evidence from Malaysia. Global Business Review 10: 225–41. [Google Scholar] [CrossRef]
- Sufian, Fadzlan. 2011. Profitability of the Korean banking sector: Panel evidence on bank-specific and macroeconomic determinants. Journal of Economics and Management 7: 43–72. [Google Scholar]
- Tan, Yong Aaron, and Christos Floros. 2012. Bank profitability and inflation: The case of China. Journal of Economic Studies 39: 675–96. [Google Scholar] [CrossRef]
- Tennant, David, and Richard Sutherland. 2014. What types of banks profit most from fees charged? A cross-country examination of bank-specific and country-level determinants. Journal of Banking & Finance 49: 178–90. [Google Scholar]
- Trujillo-Ponce, Antonio. 2013. What determines the profitability of banks? Evidence from Spain. Accounting and Finance 53: 561–86. [Google Scholar] [CrossRef]
- Valahzaghard, Mohammad, and Elham Bilandi. 2014. The impact of electronic banking on profitability and market share: Evidence from banking industry. Management Science Letters 4: 2531–36. [Google Scholar] [CrossRef]
- Vivaldi, Carlo, and Marrano Mauro Giorgio. 2017. Banking Outlook: CEE Region—The Place to be, Presentation at 2017 EBRD Annual Meeting. Available online: https://www.unicreditgroup.eu/content/dam/unicreditgroup-eu/documents/en/press-and-media/press-releases/2017/2017_EBRD_Annual_Meeting_Media_Presentation.pdf (accessed on 31 May 2021).
- Vong, Anna, and Hoi Si Chan. 2009. Determinants of Bank Profitability in Macau. Macau Monetary Research Bulletin 12: 93–113. [Google Scholar]
- Yilmaz, Ayse Altiok. 2013. Profitability of Banking System: Evidence from Emerging Markets. Paper presented at WEI International Academic Antalya Conference, Antalya, Turkey, January 14–16. [Google Scholar]
- Zoghlami, Feten, and Yassine Bouchemia. 2020. Competition in the banking industry, is it beneficial? Evidence from MENA region. Journal of Banking Regulation 22: 169–79. [Google Scholar] [CrossRef]
Publisher’s Note: MDPI stays neutral with regard to jurisdictional claims in published maps and institutional affiliations. |
© 2021 by the authors. Licensee MDPI, Basel, Switzerland. This article is an open access article distributed under the terms and conditions of the Creative Commons Attribution (CC BY) license (https://creativecommons.org/licenses/by/4.0/).