1. Introduction
The construction industry impacts labor markets and societies in general. Its competitive advantage is therefore important to both global and local economies. As such, there has to be stringent procedures and regulations to ensure the monitoring of the performance of construction projects. A typical construction project starts with the inception of the concept by the project owner, which then translates into designs by a consultant, and finally work by the contractor to execute the project. This multiparty involvement heightens the inherent risks that could jeopardize the performance of a project. These risks typically impact the important time and cost performance parameters of a project.
Risks in construction projects typically fluctuate during the various project stages. Initially, risks related to design errors and design synchronization present real safety and performance risks to a project. Such vulnerabilities in a project, at that stage, are generally attributed to project owners/consultants, as the design is generally their duty. Though, during the construction phase of a project, risks that are credited to contractors present more of a threat to a project. Instances of such risks include long lead items procurement and common construction strategies.
Moreover, the construction industry is generally unpredictable and one of the first to be influenced by uncertain economic fluctuations. Subsequently, the various risks in the construction industry should be precisely surveyed to expect and alleviate their effects on a project. In their paper,
Nguyen and Nguyen (
2020) indicated that a more accurate assessment of risks would be a significant factor in project success, increasing the confidence of project developers to invest in the construction industry. In turn, that will nurture the prosperity of the construction industry. Moreover, risks have a significant impact on the cost and time performance of a project. The lack of accurate estimation leads to the failure of projects, which is translated into the failure of the construction industry (
Van Thuyet et al. 2019).
To that end, the construction industry must be able to estimate and forecast the different risks that could impact a project’s performance. Many studies were conducted in the area of risk assessment and estimation; however, none of the previous studies tackled the quantification of risks in a metric that allows the reflection of different risk factors on a project’s cash flow. Therefore, this paper showcases the development of a construction Cash Flow Risk Index (CFRI) that project owners can use to forecast and assess different risks that could impede the performance of their project, allowing for early detection and mitigation. Moreover, this metric also assists contractors in evaluating their existing or potential projects’ risks, as seen by owners and affecting cash flow. This will allow decision-makers to make informed decisions about risk mitigation and investment. As such, this paper will discuss the development of the CFRI throughout the different sections of the paper. In section two of the paper, the literature review that led to the development of the index is discussed. Moreover, in section three of the paper, the methodology of the paper is explained with all of the required steps to build the index properly. However, in section four of this paper, the resultant index is portrayed, and the final outcome of the paper is shown. In sections five and six of the paper, the discussion and the conclusion of the paper are introduced to present the study’s main outcomes along with the limitations and the future aspects of development to the study.
2. Risks and the Construction Industry
A risk is generally defined as someone or something that creates or suggests a hazard (
Risk 2021). This definition is closely related to the definition of risk in the construction industry. In construction, risk can be defined as the event that, if it occurs, can have an impact on the outcomes of a project. Such a definition can explain that the risk event’s occurrence is the primary factor that controls the event’s severity and outcome (
Wang and Yuan 2011). However, the concept of risk could be more tailored to the construction industry as its nature defines different factors that could be attributed to different stakeholders.
In the literature, risk in the construction field is usually related to safety risks that could entail losses of property or injury of the human capital (
Zhang et al. 2021). However, many risks could impact the performance of a project financially and, in terms of delivery, that could have a much more significant impact than the safety risks. Moreover,
Blank and Tarquin (
2005) indicated that engineering projects are also sensitive to risks that could have major, and in some cases, devastating, impacts on their performance.
To underline the effect of multiple risk factors on a construction project’s cash flow,
Lee et al. (
2012) developed an evaluation system to build weights for the impacts of risk factors. In their work, they built a system to assess each type of risk based on its frequency and severity. They also focused on the risk factors related to safety but a vital issue to be highlighted was that the employees’ safety on-site could pose a significant risk to project completion and cost performance. Another study that adopted a holistic approach towards the construction industry’s risk factors was conducted by
Edwards and Bowen (
1998), who suggested that the financial risks are amongst the most significant risks that could occur in a construction project. They also rightly highlighted that a construction project’s financial performance is the essential factor that could determine a project’s outcomes.
On the other hand,
Strong et al. (
2009) explained the difference between the concept of risk and the concepts of uncertainty or random variables. They stated that there is always a chance for a financial loss or adverse outcome, or a financial gain or a positive outcome with risk. Furthermore, they explained that the following two parameters are associated with risk: the consequences of the risk in terms of losses or gains and the probability of this to occur. To further explain and examine this, the authors also showed the difference between the notions of risk analysis and risk assessment. They described that each concept is tied with one of the parameters associated with risk; hence, risk analysis identifies the possible outcomes, while a risk assessment is a process of calculating the probability of these outcomes occurring.
Additionally,
Kangari and Riggs (
1989), developed a linguistic system to assess risk factors in the construction industry. In their research, the authors explained how the risk assessment process can be subjective, and that there is always a need for a linguistic system to measure or assess this risk based on the perception of the decision-maker. This methodology can be beneficial for decision-makers who lack the required experience in the risk assessment field. Another advantage of this methodology is the ability to use decision-making tools such as Topsis and Electre. Similar work was presented by
Lam et al. (
2001), where the authors proposed a model to combine the qualitative and quantitative data to make better risk allocation in a construction project. The authors also incorporated a fuzzy decision system to assist the decision-maker in making a better-informed decision with the inclusion of the decision-maker’s subjective opinion in linguistic variables.
Abd El Razek et al. (
2014) showed the risks associated with cost overruns and the measures that construction companies should consider in mitigating them. The author stressed the importance of accurate cash flow forecasts, enabling the contractor to foresee the possible risks and include buffers to mitigate the impact on a project’s cost performance. Nevertheless, Zavadskas and Turskis (
Zavadskas and Turskis 2013) suggested that contractor competency is a significant factor in predicting the construction industry risks and contractors should employ their expertise to mitigate such risks.
Discussing the risks that may occur in the cash flow of a construction project,
Odeyinka et al. (
2008) indicated that all projects tend to develop a cash flow forecast at the beginning of the project, using a net cash flow value flow and cost flow approach. However, due to the inherent nature of risk that the construction industry poses, these forecasts are bound to have variations and deviations. The study concluded that 26 significant risk factors affect and create a variation for the cash flow forecast. Some of these risk factors are related to the payment patterns and frequencies, others are related to the subcontractors and suppliers, while others relate to the government’s regulations. There are two central norms when it comes to construction cash flow views. The first norm defines the cash flow as net receivables minus net payables during a project, while the other norm defines the cash flow as the actual movement of money in and out of a project (
Wang and Yuan 2011). Moreover, many methods have been used to model the cash flow based on historical data and, with the development of technology, more methods have been found that use computers to conduct simulations and predictions.
On the other hand,
Odeyinka et al. (
2008) showed that among the most common severe risk factors in the construction industry, financial risks are the most influential regarding severe adverse outcomes on a construction project. Another study that tackled similar ideas was conducted by
Liu et al. (
2017), where the authors proposed a method to consider risk factors in the financial models to alleviate some of the impacts on project delivery.
Sato and Hirao (
2013) examined the trade-offs between the budgeting issues and the risk factors. They concluded that there should be an integration between the risk management plan and the budgeting plan to ensure that all risk factors are considered and that adequate buffering measures are in place to mitigate the effect or the impact of the risks. A complementary model that could be used was presented by
Farooq et al. (
2018), where the authors proposed using a model that will quantify the errors in the risk assessments by including a margin of buffer in the budget to ensure the effectiveness of risk mitigation. This model is based on a weighting function that will be able to detect such risk assessment errors. On other hand,
Guerra and Sorini (
2012) presented a model to integrate uncertainty into financial models by using fuzzy numbers in the model. This can be done by accurately calculating the upper and lower bounds of the membership functions.
In his study,
Mbachu (
2011) investigated the primary sources of risk that exist in construction. The author aimed to investigate the leading risk factor in the construction industry in New Zealand, which is the payment risk, since the implication is that this risk poses considerable threats to the construction industry. The author explained that the payment risk imposes significant danger when it comes to maintaining an adequate cash flow and completing the project. Furthermore, the author attempted to attribute the risk sources to the construction industry parties – namely clients, consultants, contractors, and suppliers. The results indicated that clients are the source of highest risk with a 24% contribution to contractors’ problems. Contractors and subcontractors were also perceived as high sources with 19% and 17% contribution to contractors’ problems, respectively. On the other hand, the consultant risk was considered moderate, and suppliers were considered a low-risk source, and their collective contributions were calculated to be 37% of contractors’ problems. This study is vital to contractors as it allows the project manager to allocate resources adequately to mitigate different sources of risk, which eventually increases the project’s profitability and satisfaction. As an outcome, the author indicated that the proposed methodology is considered to be a useful tool for risk analysis and risk management and response.
Furthermore,
Mahmoudi et al. (
2020) indicated that risks are an inherent part of the construction industry. However, there are ways to mitigate their impact if assessed adequately at the beginning of a project where the contractual relationship or the delivery method can be chosen appropriately to minimize the extent of the impact of the risks in a project. As such, the approach can be of great value to ensure the success of a project or the transfer of liability from the project owner to the contractor and vice versa.
Therefore,
Table 1 below lists the risk factors extracted from the surveyed literature that are attributed to clients. The risk factors below show that all risks attributed to clients are related to the contractual relationship and contract administration. Therefore, it is the client’s responsibility to administer the contract, and to ensure that the contractual relationship is free from all factors that could hinder a project’s cash flow. On the other hand,
Table 2 shows the risk factors obtained from the literature that are attributed to consultants. All risk factors attributed to consultants are related to their expertise when it comes to design and project supervision.
As for the risk factors attributed to contractors,
Table 3 shows that risk factors attributed to contractors are related to technical factors and management factors, and this indicates the important role of the contractor within a project, as their technical expertise is required for solving the technical issues faced at a project site and their management expertise is required to make sure that the project runs on time.
Table 4 shows the risk factors attributed to external parties, such as market pressure, governmental agencies, or any other party that is not the main stakeholder in a project. These factors could be attributed to one or more contributors and could have an unpredictable impact on a project’s cash flow.
As such, the above risk factors extracted from the literature were integrated into the development of the measuring index, the CFRI, to assess the impact of the different risk factors from the client’s perspective on a project’s cash flow.
While all of the presented methods for risk quantification are functional, each has certain shortcomings. Some models are unable to capture risks that occur in a construction project, some depend on subjective input, which makes it too specific for certain areas or functions, while others do not offer the flexibility or the applicability of tailored models. Therefore, this research developed an integrated Cash Flow Risk Index (CFRI), from an owner’s perspective that captured the risks in a construction project that impact projects’ cash flow. In summary, the study provided the best approach to integrate risk factors in a construction cash flow that is performed using the developed CFRI to test how the inclusion of risk factors into a project’s cash flow will enhance the accuracy of the forecast.
3. Materials and Methods
The CFRI is a metric that was created for use by owners/developers to account for risks in the cash flow forecast. This metric was created after exploring the relevant literature and synthesizing the theory considering the risk factors preliminarily deduced from the literature review in
Table 1,
Table 2,
Table 3 and
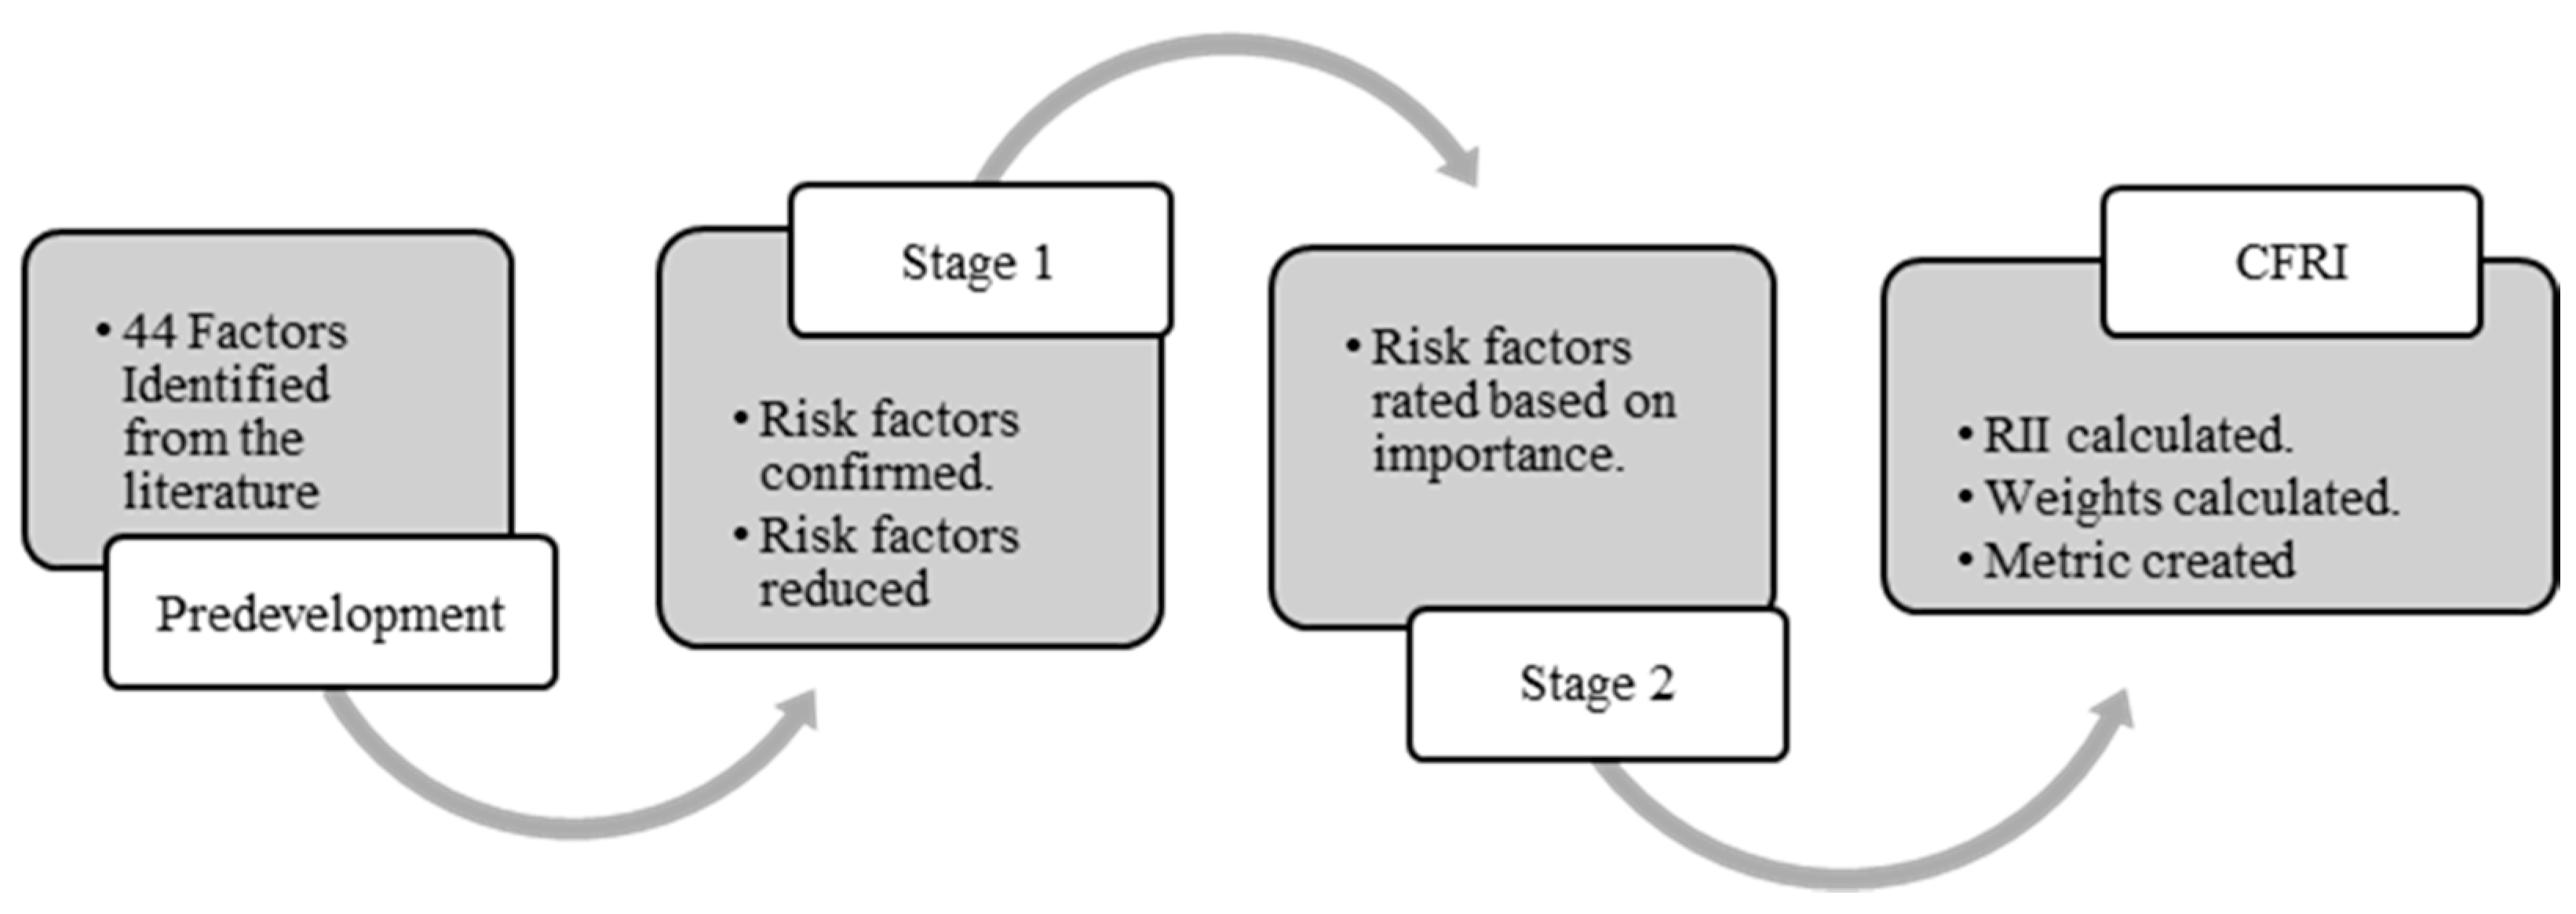
Table 4. The first step was to extract the different risk factors from the literature. Therefore, a total of 44 risk factors were identified. The chosen factors were restricted to those explicitly impacting a project’s cash flow. Moreover, the extracted risk factors were placed in four groups depending on the risk factor contributor. The four identified groups were (i) the client-related risks, (ii) the consultant-related risks, (iii) the contractor-related risks, and (iv) the external risks that are out of the control of the three main stakeholders.
After identification, the risk factors were validated and consolidated, using feedback from industry experts and the Delphi approach, which was carried out in stage 1. This practice aimed to provide an amalgamated list of risk factors that served as the basis of the next operation in stage 2, where a second iteration of the survey was disseminated to industry practitioners to attain the weight of the different factors and their ranking. The results of the second iteration were the foundation of the CFRI metric to enable project owners to capture the impact of different risk factors that may occur in a project on the cash flow, and to facilitate multiple simulations of cashflow data in later stages of the study.
Figure 1 below illustrates the process of metric construction.
3.1. Stage 1: Risk Factors Confirmations and Consolidation
To confirm and consolidate the identified risk factors, a Delphi study was conducted with different risk factors identified from the literature. To capture the full spectrum of possible scenarios, respondents from the different types of stakeholders in the construction industry, were engaged, including clients, consultants, contractors, and governmental agencies. The identified target respondents were the most suitable to reflect the possible risk factors from all perspectives.
The study was built to accommodate the participants’ responses on multiple iterations to validate and consolidate the risk factors.
Table 5 below illustrates the process of the study. The first iteration started with 44 risk factors, which were sent to the participants to confirm whether the factors are applicable or not applicable. The results of the first iteration were shared with a panel of experts, and they were asked to identify the most relevant factors again. The second iteration began with the risk factors identified from the first iteration to be further reduced. The same process was repeated until the risk factors were reduced to the target of 30 factors or until the respondents’ replies plateaued at the same number of factors, following which the study was concluded.
As such, using the Delphi approach for this study enabled the confirmation and reduction in risk factors at the same time, which increased the efficiency of data collection and allowed for individual participants to voice their views.
3.2. Stage 2: Risk Factors Ranking and Weightage
To rank the risk factors that have been identified from stage 1, a survey was developed requesting participants to rate the different risk factors on a five-point Likert Scale. The survey was created electronically and was sent to participants in the construction industry selected from the different types of stakeholders.
The survey was comprised of two sections; the first section was an introduction about the study and questions that are used to provide the demographic background of the respondents. In the second part of the survey, respondents were asked to rate the different risk factors on a five-point Likert Scale ranging from “Extremely Important” to “Not Important”. The survey included the factors obtained from stage 1 and was presented in a digital format to ease the collection of responses.
3.3. Cash Flow Performance Index (CFPI) Formulation
Applying the results of the first stage to the second stage to obtain each factor’s ranking and weights. The Relative Importance Index (RII) method was used to quantify each risk factor’s rate and importance. The 5-point Likert Scale system allowed the respondents to rate the identified risk factors. The scale started with the highest score (5) for “Extremely Important”, then followed by (4) “Very Important”, (3) “Important”, (2) “Somewhat Important”, and (1) “Not Important”. This scale was used to rate all of the factors on which the basis of the RII was calculated as per Equations (1) and (2), as follows:
where:
: is the sum of the weights of each factor multiplied by the frequency of the answer;
: is the highest criteria score, which in this case is (5).
: is the number of respondents, which is 32 in this study.
Obtaining the RII for each risk factor then facilitated the calculations of weight for each factor. The Rank Exponent method was used to calculate the weight of each factor. In this method, the weight of the factors is calculated by dividing the inverse of the rank raised to a power (p) by the sum of all the ranks raised to the same power (p), as illustrated in Equation (3) below (
Tah and Carr 2000); and raising the rank inverse to the power (p) will allow a wider separation between the weights, allowing for a more in-depth identification of relative importance, as follows:
where:
n: is the number of respondents.
r: is the rank of the factor.
p: is the power of the equation. In this case, the power was chosen to be 2 to represent a steeper weight distribution.
After obtaining the weight for each risk factor, the CFRI tool demands the input of the user’s evaluation of each risk factor based on a linguistic scale, as shown in
Table 6 below. Upon the identification of the evaluation of the risk, the CFRI tool will multiply the evaluation of each risk factor by the weight assigned to that risk factor to obtain the contribution of that risk factor to the CFRI, and the final CFRI is one minus the sum of the contributions of all of the risk factors.
The notion of quantifying risk and risk response could offer an important advantage for the prediction and mitigation of risks. In a construction project, risks are bound to occur; therefore, forecasting and mitigation ability makes the difference between successful project delivery and default. As such, the application and implementation of the CFRI unlocks significant abilities. As discussed, the CFRI imposes a decrease in the cash flow to reflect risk levels that, in reality, impede the progress of a project, which, in turn, harms the cash flow. As such, incorporating the impacts of the metric will provide an insight into the possible risks that a project may face, and the probable response a project owner might have to these risks.
The developed CFRI metric went through two main stages before the conceptualization, as illustrated in
Figure 1. This metric’s principles were defined from the literature, then data collection with industry professionals yielded a fully developed metric that can translate risks in a project into a cash impact. As such, this study aims to provide a better tool to quantify the impact of risk on cash flow predications.
4. Results
This section highlights the results of the data collection and the analysis performed to build the CFRI metric. The first section discusses the risk factors validation and consolidation of the risk factor and the second section illustrates the results of the RII calculations to finally construct the CFRI.
4.1. Risk Factors Validation and Consolidation—Delphi Study
As explained above, 44 risk factors were extracted from the literature to be validated and built into the CFRI. In this research, a Delphi study was conducted with input from a sample of industry experts to validate and consolidate the risk factors. The Delphi study’s main aim was to obtain validation from all of the industry experts and reduce the risk factors to build the CFRI.
Table 7 below illustrates the respondents’ backgrounds and affiliations.
In the first round of the study, all of the 44 risk factors were sent to the experts’ panel, asking them to identify whether each risk factor is relevant or irrelevant. They were asked to identify 30 relevant factors and 14 irrelevant factors. Each expert identified the factors they deemed relevant and those they deemed irrelevant. The results from all of the experts were tabulated and the percentages of relevant and irrelevant factors were calculated to determine the factors that could proceed to the second round based on a 50% or more relevance rate.
The results of the first round concluded that only seven factors were found to be irrelevant, while 37 factors were determined to be relevant. Therefore, another round was carried out. After analyzing the results of round one and removing the seven irrelevant risk factors, the study moved to round two with 37 factors. The aim was to further reduce the number of factors identified. The first-round results were shared with the expert panel, and they were requested to determine 30 relevant and seven irrelevant risk factors out of the 37 factors considered in round two. The round two results then revealed that only one risk factor was determined to be irrelevant, and 36 risk factors were deemed to be relevant.
After completing the second round, and removing one irrelevant risk factor, the study moved to a third round to reduce the risk factors even further. The second-round results were shared with the participants who were asked to determine the 30 most relevant factors and the six least relevant factors to reach a total of 30 relevant factors. The third-round results determined that the panel responses had plateaued, and the same 36 factors were deemed relevant. Therefore, the study terminated after the third round.
The resultant 36 risk factors were deemed to be relevant and final and would be the basis of the rank survey presented in the next section to determine the ranks and weights of the risk factors to build the CFRI. The results of the Delphi study removed the eight risk factors that were deemed irrelevant to the cash flow of a construction project. They are as follows:
Delay in releasing retention: This factor was deemed irrelevant as the retention release has no impact on a project in the construction stage.
Accidents (safety): This factor was deemed irrelevant as safety and accident prevention is the sole responsibility of the contractors, and all of the risks related to this factor should be borne by the contractor only and should not impact the cash flow of a project.
Inflation rate increase: This factor was deemed irrelevant as it is the contractor’s responsibility to plan for fluctuations in the inflation rate for the duration of a project.
Exchange rate fluctuation: This factor was deemed irrelevant as the exchange rate does not affect the contractor’s procurements since almost all materials are locally available.
Changes in interest rates: This factor was deemed irrelevant as it is the contractor’s responsibility to plan for fluctuations in the interest rate for the duration of a project.
Cultural differences: This factor was deemed irrelevant as the cultural differences may affect communication but have minimal effect on cash flow.
Labor disputes and strikes: This factor was deemed irrelevant as it is the contractor’s responsibility to satisfy their obligations towards laborers.
Ambiguous planning due to project complexity: This factor was deemed irrelevant as, during the planning stage of a project, the ambiguity can be eliminated.
An important conclusion is that at the beginning of the study, the literature identified a total of 14 risk factors triggered by the client, 7 risk factors triggered by the consultant, 15 risk factors triggered by the contractor, and 8 risk factors triggered by external parties. After completing the Delphi study, 13 risk factors were attributed to the client, 6 risk factors were attributed to the consultant, 14 risk factors were attributed to the contractor, and only 3 factors were attributed to external parties.
Therefore, the resultant 36 factors were based on the risk survey conducted to determine the weights and ranks of the risk factors to build the CFRI. Moreover, the number of risk factors triggered by the contractor’s competence or behavior was the highest, followed by the client’s risk factor, then the risk factors triggered by the consultant, and the risk factors triggered by external sources. From this, it could be concluded that the contractor and the client are the two essential stakeholders that control a project’s functions and the leading players in risk mitigation.
4.2. CFRI Construction
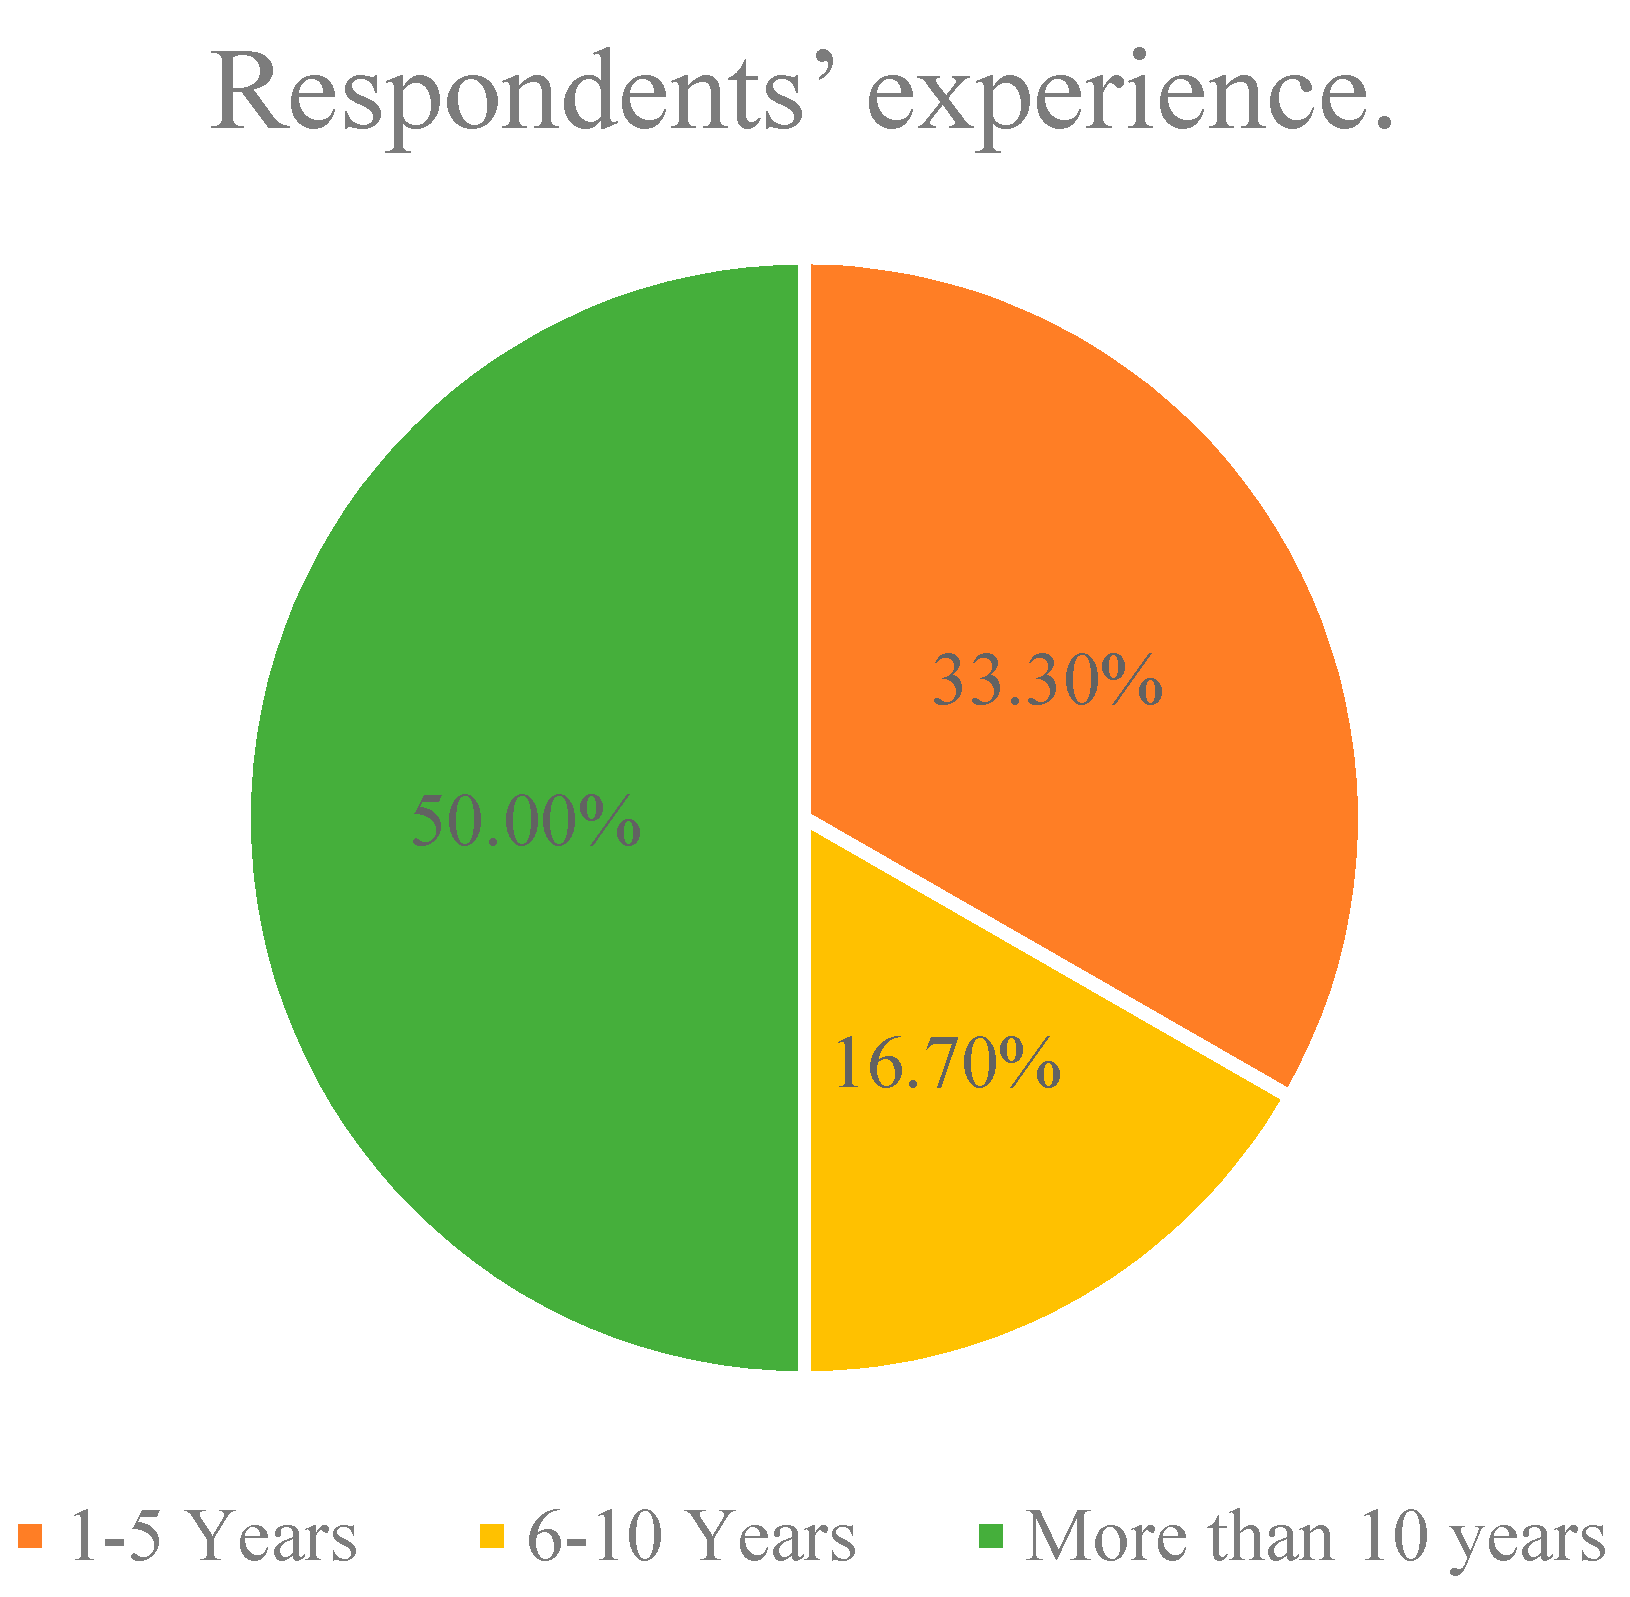
The 36 factors identified from the Delphi study were built into the rank survey, which was sent to 40 respondents; 32 responses were collected, which corresponds to a return rate of 80%, which is significant. The identified target respondents were the most suitable to reflect the possible risk factors from all perspectives.
Figure 2 and
Figure 3 below illustrate the demographics of the respondents.
All respondents were asked to rate the risk factors on a five-point Likert Scale with five being “Extremely Important” and one being “Not Important”, and the results were analyzed to calculate the RII, as shown in
Table 8 below. The results show that the risk imposed by the poor coordination of the design is the most critical factor that could severely impact the cash flow, while neglecting to have a reserve fund strategy has the least impact on a project’s cash flow. Another important observation is that the factors related to design and design changes are among the highest-ranking factors due to their importance and their impact on a project and its productivity.
After ranking the 36 factors, the weights of the factors were calculated using a Rank Exponent. The author decided to use a Rank Exponent calculation for the weights since it allows for a wider separation between weights, allowing for a more in-depth identification of relative importance. The result of the weights of each factor is illustrated in
Table 8 below.
With the calculation of the weights for the different risk factors using the Rank Exponent Method presented in
Table 8 below, the authors started with the actual construction of the CFRI, which is the tool that will allow the user to quantify the risk associated with the project upon its application. The full CFRI tool is shown in
Table 9 below. In the evaluation cell, the user will define the evaluation of the risk from the scale defined in
Table 6; then, the tool will multiply the weight assigned to the risk factor by the evaluation defined by the user to obtain the contribution of the risk factor to the overall CFRI. Last, the total CFRI is the sum of the individual contribution of all of the factors deducted from one to be represented as a reduction factor.
The final index will allow the users of the metric to evaluate their project based on the different risk factors to finally obtain the risk impact on a project that can be reflected in a project’s cash flow to enhance the accuracy of estimation by the inclusion of possible risks to a project. Such an index can be used as an assessment tool to forecast and mitigate risks in a construction project.
5. Discussion
This study set out to collect risk factors relevant to construction cash flow and to build a risk inclusion index, CFRI. The research starting with a total of 44 risk factors identified from the literature and divided them into four groups depending on the stakeholder responsible for initiating the risk. The four groups were (1) project owner, (2) project consultant, (3) project contractor and (4) external parties. Each group of risks was analyzed based on the project phase that the risk is likely to occur in, and it was found that project owner’s risks tend to be manifested at the beginning of a project but could also last until the end of a project. Instead, the risks imposed by the project consultant tend to be presented at the beginning of the project and those are mostly related to design. The project contractor’s risks, however, were found to have an effect throughout the project’s duration and vary between technical and financial risk factors. The last group, which was the external parties’ risks, was found to have only a minor impact during a project’s duration, which could be attributed to the short duration of projects since the impacts of such risks tend to be observed later in the life cycle of a project.
As such, the study aimed to propose a framework to analyze and quantify risk for project stakeholders, that is synthesized in the Cash Flow Risk Index (CFRI) and would be integrated into a further cash flow model. The study validated the risk factors extracted from the literature through a Delphi approach. The Delphi approach was used due to its fast convergence to the final factors and its capacity to allow for individual inputs from all of the participants to validate the risk factors identified from the literature in addition to consolidating them into a list that forms the CFRI. After three rounds of Delphi with industry experts, the risk factors were validated and reduced from 44 to 36. These 36 risk factors were then built into a survey that was sent to professionals in the construction industry to collect the data required to calculate the relative importance of the different factors, and to provide a comparison between the factors using the RII approach. After the calculation of the RII, the relative importance indexes were used to determine the weights of these factors using a rank exponent approach that resulted in the final CFRI tool.
The highest risk factor attributed to the client was design changes and variation with a weight of 0.0632. This reveals that changes in design and variations during the construction activities could lead to significant impacts on the cash flow of a project where these changes could entail a deviation from the planned budget. On the other hand, the lowest-ranked risk factor was the delays in response, with a weight of 0.0002, which could suggest that a set and defined scope at the beginning of a project would not require any feedback from the client and the delays in response could be ignored as it is the contractor’s responsibility to construct a project following the defined scope.
In contrast, the highest risk factor attributed to the consultant was the lack of coordination between the different packages in the design, with a weight of 0.08, and that also confirms that any uncertainties in the design could have serious effects on a project’s progress and cash flow stability. The lowest rated risk factor attributed to the consultant was the delay in response, with a weight of 0.0089, and that indicated that it is the contractor’s responsibility to identify the scope and act on solving any technical issues that arise during the construction stage.
The highest-ranking risk factor attributed to the contractor was faulty construction methodology, with a weight of 0.0756. This can indicate that the choice of the construction methods and the perfection of the approach is the most critical factor that could endanger the cash flow position. While the availability of a reserve fund strategy is essential to mitigate delays that may occur, it was the lowest ranking risk factor attributed to the contractor, with a total weight of 0.0001. Hence, the absence of a reserve fund strategy is not crucial to the cash flow of a project, which could be due to the fact that the contractor should not by any means be the party responsible for financing a project’s progress.
This study promotes the inclusion of risk into all aspects of project management as it has a significant impact on a project’s performance. Moreover, in terms of cash flow forecast, it is recommended for the forecast to be conducted at an early stage of concept design to provide a clear idea to the project owner of the possible risks that their project might face. However, an accurate estimation requires a thorough investigation of the possible risk factors to devise a mitigation plan against such risks.
The main limitation of this dissertation was the access to data. During the COVID-19 pandemic, access to industry professionals was limited to telecommunications, making it extremely difficult to pitch the project idea and solicit response and data.
The main recommendation for future research direction is to develop a risk performance index to track the risk performance and mitigation throughout the project phases that can also provide valuable insight into the project performance.
6. Conclusions
The study yielded many interesting findings in the area of cash flow estimation and risk inclusion. While risks are inherent in the nature of the construction industry, their impact on a project’s cash flow cannot be ignored. Moreover, risks can be triggered by different stakeholders in a project and their effect varies depending on the project stage. The risks imposed by project owners are usually related to the finance of a project, while the risks imposed by project consultants tend to be related to the design and technical errors. On the other hand, risks imposed by the contractor tend to be related to the financial aspect of performance as well as the technical aspects of the construction works, but the risk attributed to external parties tend to be manifested on longer durations, hence, having minimal impact on projects due to their shorter durations.
Moreover, the study proposed a Cash Flow Risk Index (CFRI) to quantify the risk impact on a project’s cash flow. The development of the CFRI required multiple phases to identify the risk factors from the literature, then conduct a Delphi study to confirm and distill the identified risk factors to the most critical. The Delphi study was carried out over three iterations, resulting in a reduction in the risk factors from 44 to 36 factors. Next, a survey was shared with professionals in the construction industry to rank the factors on a five-point Likert Scale, which resulted in a ranking of all of the factors that identified the design-related factors as the most critical. The CFRI included the consolidated risk factors, and the resultant weighted ranking.
Furthermore, it was concluded that risks are inherent in the nature of the construction industry. Therefore, their impact on a project’s cash flow cannot be ignored. Moreover, risks can be imposed by different stakeholders in the construction industry. However, their impacts vary depending on the project stage. With the various stakeholders in a project, risks imposed can vary. Risks imposed by project owners are usually related to the finance of a project. On the other hand, risks imposed by project consultants tend to be related to the design and technical errors, risks imposed by the contractor tend to be related to the financial aspect of performance as well as the technical aspects of the construction works, and risks attributed to external parties tend to be manifested on longer durations. Hence, they have a minimal impact on projects due to their shorter durations.
Ultimately, the CFRI can be considered an important tool that aids in quantifying the impact of risks on a construction project’s cash flow and increasing the accuracy of the cash flow forecast.
The study’s contribution to the body of knowledge is the creation of the CFRI, the validation of the index, the collection of data with analysis, and the underlying theory of formulating an index that enables a better prediction accuracy.


