1. Introduction
For most Eastern European developing countries (and Bulgaria is no exception), the financial crisis of 2008–2011 was the first since the beginning of the transition to a market economy, which was caused by mass defaults on credit obligations. Thus, it has become a threat to the stability of the banking system and confidence in it, and, hence, sustainable economic development. The resumption of economic growth in Bulgaria directly depends on the activation of the main function of the banking system—crediting the real sector of the economy, i.e., on solving a number of problems to improve the management of problem credits, a significant amount of which put pressure on the capitalization of banks, thereby reducing the propensity for new risks and reducing the supply of new credits.
The banking system is one of the most important components of the macroeconomic system of any country, and crediting is the main function of the bank (
Moradi and Rafiei 2019). For some credits, there is a problem of quality deterioration inevitably emerging, which potentially leads to losses and damages, given that the issue of effective management of problem credits is relevant for all times of banking (
Ye et al. 2018).
Today, the management of overdue credit debt portfolios remains an acute issue for Bulgarian banks. Numerous observations on the activity of commercial banks on the recovery of overdue debts indicate the effectiveness of personal contact with such borrowers. However, in such work, a commercial bank incurs significant costs: salaries of bank staff; court costs; commissions to collectors (
Gilchrist and Mojon 2017). Eventually, the bank’s employees, who have to sell credit products, are involved in the work, due to which the bank receives less profit from lending activities (
Shen et al. 2019).
Over time, commercial banks increase their credit portfolios and, accordingly, the number of overdue credits increases. Some credits are repaid, others are extended, and some turn into bad debts. With the activation of a negative economic “cyclone” (for example, the crisis of 2008), the number of problem debts in the portfolios of commercial banks increases exponentially (
Mou et al. 2018). Under these conditions, individual work for each borrower who has an overdue payment on the credit becomes not just difficult but impossible.
The solution to this, today an acute problem, is possible by automating the overdue debts recovery process (
Li and Zinna 2018). Thus, the development of scoring systems provides an opportunity to automate this work through the introduction of collector scoring systems in the practice of commercial banks. The variety of approaches to the implementation of scoring technologies, particularly at different stages of lending, encourages creative “experiments” of banking practitioners in the implementation of tasks such as application, behavioral, fraud, and collection scoring (
Sun et al. 2018).
The need for further research aimed at improving methodological approaches to the problem credit management system and to address a number of practical issues (including the development of scientifically sound approaches to assessing the degree of problem credit and choosing an effective method of managing it) determined the purpose, objectives, and the relevance of the chosen research topic.
The scientific novelty of the obtained results lies in solving the current problem of updating the concept of banking risk management and developing scientific and practical recommendations for improving the effectiveness of banking risk management in a crisis. Thus, the areas of updating the concept of banking risk management are substantiated, which is based on a comprehensive approach to determining zonal levels of banking risk management, the formation of organizational and economic areas of improving risk management in a financial crisis, and developing new external tools to influence the efficiency of banking risk management, which will allow eliminating the “imitative” nature of risk management and increasing the level of financial stability of the banking system. The practical value of the built model of collection scoring for the recovery of overdue debt lies in the possibility to make recommendations for work with each segment of the portfolio of overdue loans in accordance with the calculated level of credit risk.
Thus, the development and introduction of effective credit scoring systems into the business processes of a commercial bank are some of the important tasks of risk management.
One of the priority tasks facing commercial banks today is the competent management of problem debts for the purpose of ensuring their financial stability and competitiveness, in compliance with the standards of external regulators.
Doubtful debt is a debt of which repayment to the commercial bank is not certain. Overdue debt is a debt which was not repaid within the period specified in the loan agreement. As for problem loans, these are loans for which one or more payments were not made, the liquidity ratio of the collateral decreased, and there appeared doubts about the repayment of the bank debt. The article analyzes overdue credit debts of individuals to the bank for the purpose of using collection services.
The aim of this work is to study the problem of overdue credit debt and to create effective methods of managing bad debts in financial institutions. The main objectives of this article are the construction of models of scoring evaluation of overdue credits based on a combination of tools of fuzzy logic theory and technologies of artificial neural networks; and the development of recommendations for managing the portfolio of problem credits to minimize losses caused by defaults on credit agreements.
2. Literature Survey
Scientists in their works have studied the issue of scoring system tools from different points of view.
The Altman model is one of the first models of analysis of the probability of bankruptcy of an enterprise, which was based on discriminant analysis (
Altman 1968). The Altman analytical model is an algorithm for integrated assessment of the threat of bankruptcy of an insolvent enterprise based on the integrated recording of the most important indicators helping to identify the financial crisis of an enterprise (
Altman et al. 1977).
Thus, the study of
Fonseca et al. (
2020) was devoted to the development of scoring technologies as a tool for credit risk management of commercial banks.
Hájek and Olej (
2015) highlighted a number of practical studies aimed at assessing the financial condition and diagnosis of corporate bankruptcy with the use of tools from fuzzy logic theory, discriminant and regression analysis, and neural networks.
Yamori (
2019) argued that risk management in banks has changed significantly over the last ten years. This is due to the fact that the regulations issued during the global financial crisis and the fines levied after it caused a wave of changes in the functions of risk. These included more detailed and stringent capital, liquidity, and financing requirements. Non-financial risk management has become more important as compliance and behavior standards have been strengthened.
Baron and Xiong (
2017) stated that stress testing has become a key surveillance tool along with growing expectations of bank statements about risk and appetite. Banks have also invested in strengthening the culture of risk and have become more active in taking risks into account in decision making.
Jiménez et al. (
2017) argued that banks sought to define and delineate their lines of defense in more detail. Given the scale of these and other developments, most risk functions in banks are still amid transformations that meet these heightened requirements.
Mian and Santos (
2018) argued that risk management is fundamental in banking. The key elements for effective risk prediction are a well-developed credit policy and related procedures; effective portfolio management (cash, credit, real estate); effective credit control; and, most importantly, well-trained and trained staff to work in this system.
Chen et al. (
2018) agreed that all banks try to minimize their risks, as this is necessary to minimize losses and further the development of the financial institution. In the opinion of these authors, risk minimization consists of the anticipation of risks and losses that may cause risk, sizes, consequences, and measures to prevent and minimize or eliminate losses.
Leo et al. (
2019) took the position that aggregation of risk ratings should be taken into account to measure and assess concentrations within portfolios. Risk ratings are also a factor in determining the level of assigned economic capital and the provision for credit losses.
Schwaab et al. (
2017) conducted a study on relative risk management in a commercial portfolio—many financial institutions use the participation or syndication of the influence of other financial institutions or organizations, credit sales and securitization, and credit derivatives to manage the size of the credit portfolio and the relative credit risk associated with it. These activities can play an important role in reducing credit risk to reduce risk or where it has been determined that the concentration of credit risk is undesirable.
As practice shows, the Monte Carlo method is one of the most effective statistical methods based on the modeling of random processes with given characteristics. The method allows analyzing and evaluating different “scenarios” of project implementation and taking into account different factors within one approach (
Peña et al. 2018). Each type of project has its own specific vulnerability to risks, which is clarified in the modeling process (
Anghel et al. 2017). The disadvantage of this method is that it uses probable characteristics for evaluations, which is not very convenient in practice.
The VaR method is used to quantify stock and currency risks. This method, which is based on statistics of volatility (variability) of market indicators and their mutual correlation, makes it possible to calculate the market value of open positions with a certain level of probability (
Baltes and Cozma 2019).
The method of expert assessments is similar to the statistical method. The fundamental difference is that the method of expert assessments involves the study of assessments made by different experts (internal or external experts) (
Apătăchioae 2015). Expert assessment can be obtained both after conducting special studies and using the experience of leading specialists (
Salleo et al. 2020).
The Delphi method is a variant of the method of expert assessments, which is characterized by anonymity and controlled feedback (
Infante et al. 2020). Anonymity is achieved through an individual survey of experts, which does not allow them to discuss answers to questions. After processing the data through controlled feedback, the generalized results are communicated to each expert (
Levrel et al. 2017). This allows being acquainted with the assessments of other leading experts. After that, you can repeat the survey of experts.
The “decision tree” method is another type of method of expert assessments. This method involves graphical construction of possible solutions (
Pousttchi and Dehnert 2018). Using special methods of probability calculation, experts assess each vector and then choose a less risky one.
The method of coefficient analysis consists in expert analysis and comparison of economic coefficients characterizing the financial condition of the bank with the average indicators of the corresponding group of banks for a specific period of time (
Lock and Seele 2015).
According to the ranking method, each bank using a certain method calculates a ranking and draws a conclusion about the creditworthiness and financial condition of a counterparty (
Khedmatgozar 2021).
In our opinion, the main disadvantage of all the above methods of expert assessments is the subjective nature of assessments.
In contrast with them, the analytical method is based on game theory and involves the following steps:
- (1)
Selection of a key indicator (for example, profitability rate);
- (2)
Identification of environmental factors affecting the key indicator;
- (3)
Calculation of values of the key indicator at a change in environmental factors.
The method of stress testing is used to analyze interest rate and currency risks in banking (
Kim et al. 2017). This method allows analyzing the dynamics of changes in important quantitative indicators of risk. Stress testing is designed to assess the degree of change in key risk indicators in cases of significant changes in environmental factors.
The duration method can also be used to quantify stock risk (
Harnay and Scialom 2016). The duration reflects the sensitivity of the current value of a financial instrument to changes in interest rates. The larger the duration of a financial instrument, the more sensitive its present value is to changes in interest rates. The difference between the average duration of assets and liabilities characterizes the position chosen by the bank in relation to market and interest rate risks (
Roper and Tapinos 2016). A positive duration imbalance leads to a change in the economic value of the bank in the opposite direction of a change in interest rates. A negative duration imbalance leads to a change in the economic value in the same direction as a change in interest rates.
GAP analysis is used to assess interest rate risk and liquidity risk. According to this method, first, certain assets and liabilities are divided into time periods, and then an analysis is conducted—concerning whether there are enough flows received from the placed assets to meet the obligations for each time period (
Ntarmah et al. 2019).
The method of analogy is used in the analysis of new products or business lines. The essence of this method consists in transferring a similar situation to the object of study (
Raut et al. 2017). The main disadvantage of this method is that it is very difficult to create conditions in which past experience would be repeated.
The advantage of the combined method is that it uses the advantages of all the above methods (
Ntseme et al. 2016). Thus, the statistical method, as a result of the assessment of the past, can be combined with elements of the analytical method and the methods of expert assessments.
Thus, the variety of risks and methods of their assessment indicates the complexity of the banking sector as an object of analysis, which requires continuous improvement of the banking risk management system. At the same time, it should be noted that the existence of banking risks should not be considered only as a negative phenomenon. On the contrary, the presence of risk can be considered as a factor in the dynamic and efficient development of the banking sector of the economy.
Despite the considerable amount of scientific research on the issue of management of bank assets, the problem of managing overdue credits remains extremely relevant today.
3. Materials and Methods
The scoring method allows making a quick analysis of the loan application in the presence of the client. In the analysis of business loans, various methods of credit scoring are also used—from the simplest formulas to complex mathematical models. Scoring, as one of the main tools in credit risk management, is recognized in the world as one of the most effective methods. With that, the level of this efficiency varies depending on the factors taken into account in it. The developed scoring models require constant improvement due to the appearance of new factors influencing the credit risk of banks.
A scoring model allows a bank to determine the value of the probability that a particular borrower will repay the loan within a certain period of time on the basis of classification and determination of the characteristics of reliable, unreliable, and bad clients for loan repayment obtained by analyzing the credit histories of previous borrowers. This is done by calculating an integrated indicator, based on which value the distribution of borrowers relative to the reliability barrier is carried out—clients with a value above the barrier are reliable and are granted a loan; those with a value below the barrier are included in the list of unreliable clients.
The problem of qualitative forecasting for economic and financial processes requires the use of new modern methods based on a systematic approach to the development of appropriate software. More often, this software is implemented in the form of modern forms of decision support systems, which are becoming widespread as a tool and means of solving a large number of practical problems (
Vo and Zhang 2019).
Mathematical modeling has been widely used in solving problems in economics, biology, ecology, etc. (
Tang et al. 2019).
A systematic approach to modeling and forecasting is aimed at reducing or eliminating the uncertainty of different types, filling gaps, processing extreme values, taking into account possible types of statistical data distributions, and using statistical criteria to improve data processing at each stage of calculation (
Schwarz 2018).
Most of the published methods (
Appendix A) are based on the same characteristics for the analysis of the financial condition of the borrower, namely, the financial characteristics of its activities (
Dell’Ariccia et al. 2017).
The main stages of selection and construction of a model consist of selecting the input data and determining the independent variables on which the model will be built. The main source for obtaining data about the client is their personal data at the time of filing the credit application, as well as information available to the client in the credit bureaus, for example:
- -
Demographic indicators (age, nationality, sex, education, place of residence, duration of residence in the actual place of residence, profession, length of service, availability of property, marital status, presence of children, etc.) (
Li et al. 2020);
- -
Data relating to the requested credit (credit purpose, initial payment, total credit amount, a term of financing, a ratio of credit amount to funds secured by the credit, etc.) (
Damrongsakmethee and Neagoe 2017);
- -
Financial indicators (taking into account quantitative characteristics in the model, it is not recommended to use absolute values, but rather to use coefficients, for example, amount of debt to income, monthly freely available budget to monthly income, monthly credit payments to monthly income, monthly credit payments to the monthly free budget) (
Ignatius et al. 2018);
- -
Marketing indicators: the motive that encourages one to apply to the bank, the source of the credit application, the program, etc.
Banks should implement credit scoring technologies that would allow centralized storage of all information about borrowers (
Peña et al. 2018). Over time, data accumulation would provide opportunities to automatically update scoring models and optimize them according to retrospective data. These technologies should allow making changes in the model by a human.
The ability to monitor and evaluate credit cases will provide positive results from the implementation of these scoring technologies (
Zhang 2020). Under such conditions, the management of the portfolio of overdue credits is simplified. Debt collection costs are being optimized, decision making deadlines are being reduced, overdue debt is being managed, and credit risk is being managed.
The successful integration of credit scoring technologies depends on the availability of retrospective data on the bank’s borrowers, including the results of working with problem credits both during credit booms and in the conditions of economic recession (
Teles et al. 2020).
Furthermore, to build adequate models of collector scoring, it is important to exchange information between commercial banks such as blacklists, as well as extracting information from credit bureaus, etc.
Taking into account all the above, the authors decided to develop a tool for estimating problem debts as part of building a model of collector scoring.
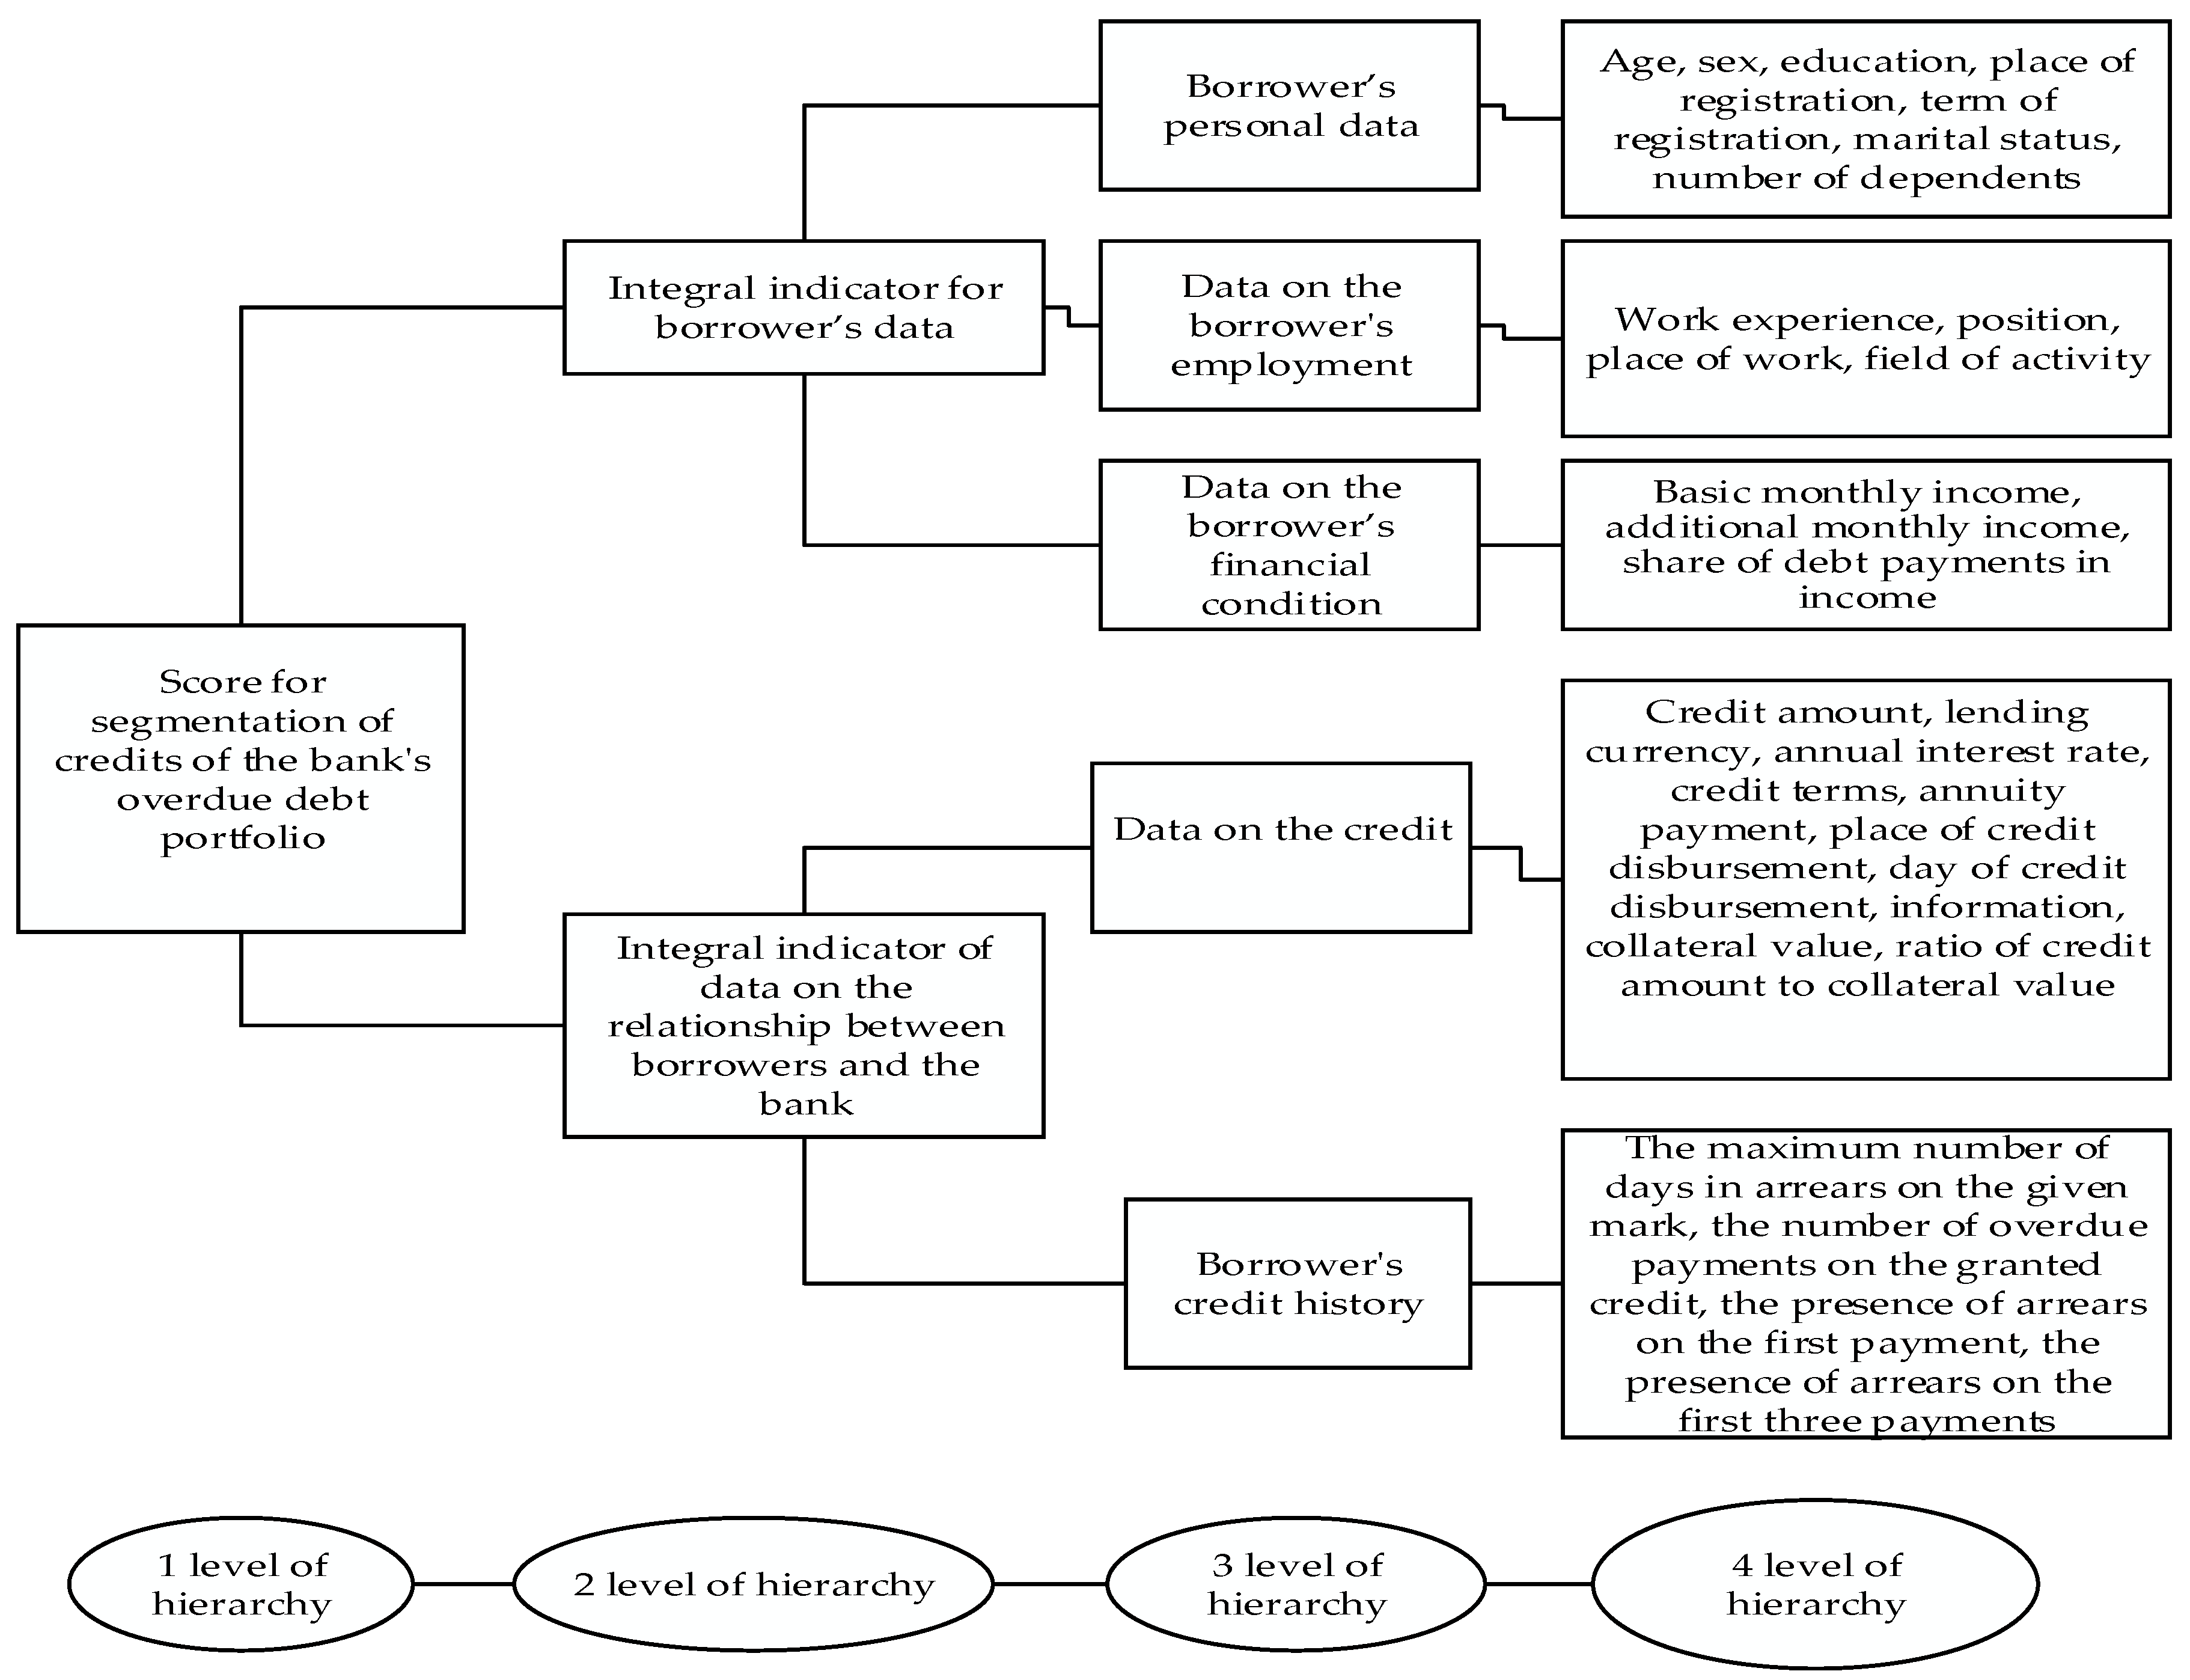
The task of the collector scoring model is to classify (group) borrowers with overdue credit payments for further debt collection. Borrowers will be grouped according to a point scored, which is the result of an integrated assessment of a number of qualitative and quantitative characteristics of borrowers based on the hierarchical model presented in
Figure 1.
To assess problem debt in the framework of building a model of collector scoring, the authors chose the tools of the theory of fuzzy logic and neural networks. This choice is explained by the heterogeneity of input information, multicriteria, lack of basis for comparing the resulting integral variables of the model, etc.
The process of modeling the collector scoring with the involvement of these tools is carried out in the following stages:
Formation of a training sample in relation to the input criteria for the evaluation of borrowers.
Linguistic description of the input criteria for evaluation of the IV level of the hierarchy, establishing the parameters of their membership functions based on the use of Kohonen maps with subsequent fuzzification of these criteria.
Convolution of input criteria for evaluation of the IV level of the hierarchy in the corresponding intermediate integrated indicators of evaluation of the III level of the hierarchy.
- 3.1.
Calculation of integrated indicators based on quantitative variables of the IV level of the hierarchy in the context of intermediate integrated indicators of the III level of the hierarchy.
- 3.2.
Calculation of linguistic variables in relation to input qualitative variables.
- 3.3.
Convolution of quantitative and qualitative indicators into intermediate integrated indicators.
Linguistic description of intermediate integral indicators of evaluation of the III level of the hierarchy, and the establishment of parameters of their membership functions based on the use of Kohonen maps with the subsequent fuzzification of these indicators.
Convolution of intermediate integrated indicators of assessment of the III level of the hierarchy into the corresponding integrated indicators of assessment of the II level of the hierarchy.
Linguistic description of integrated indicators of evaluation of the I level of the hierarchy, and establishment of parameters of their membership functions based on the use of Kohonen maps with subsequent fuzzification of these indicators.
Convolution of integrated indicators of assessment of the II level of the hierarchy in the resulting point scored (an integrated indicator of the I level of the hierarchy).
Analysis of evaluation results.
The simulated credit portfolio of a commercial bank for credit agreements of individuals served as a sample for building the model. The volume of the prepared sample was 1000 credit agreements with active overdue payments. Thus, a debtor’s pool was formed, i.e., a portfolio of credits with overdue debts.
Data were taken from the official websites of 4 Bulgarian banks for 2015–2019: Bulgarian National Bank, Fibank, Raiffeisenbank, UniCredit Bulbank.
Information about the borrower was used as input variables of the model (evaluation criteria of the IV level of the hierarchy), particularly data on qualitative and quantitative characteristics. The universal set (ranges) of a variable model is the value it can take. For example, the variable “sex” is defined on the universal set (“male”; “female”).
The selection of input variables of the model was carried out in such a way that the point scored (the resulting integrated indicator) took into account such characteristics of the borrower as: socio-demographic data; employment; financial position; information on the credit; overdue information.
The initial (result) variable is the point scored (Score) for the distribution of credit agreements by the following segments of outstanding overdue debts—“uncritical”, “average”, “bad”, “very bad”, and “write-off” (classes C_1, C_2, C_3, C_4, C_5, respectively).
It should be noted that the name of a linguistic variable and its universal set usually correspond to the name and set of values of a certain quantitative evaluation criterion.
For example, for each incoming continuous variable such as age (), passport registration period (), work experience (), basic monthly income (), additional monthly income (), DTI indicator—the share of debt payments in income (), amount of credit (), annual interest rate (), credit term (), annuity payment (), collateral value (), LTV valuation indicator—the ratio of the credit amount to the collateral value (), the maximum number of days in arrears on the credit granted (), and the number of overdue payments on the credit granted (), the linguistic variable is determined (where is the index indicating the integrated indicator of the II level of the hierarchy, is the index indicating the intermediate integrated indicator of the III level of the hierarchy, and is the index indicating the corresponding input variable), the name of which coincides with the name of the corresponding variable, and a term set of values is formed. Here, is a term of a linguistic variable called “Low” (L); —“Medium” (M); —“High” (H).
The membership of the values of the input variables to the terms of the corresponding term sets is determined by the membership functions. Quasi-bell-shaped functions were chosen as the basis for constructing membership functions in the presented study.
Thus, the system of quasi-bell-shaped membership functions for a term set of a linguistic variable
will have the following analytical form:
where
is the
-th variable of the
-th intermediate integral of the
-th integral;
—the number of input variables related to the
-th intermediate integral;
—membership function of the variable
-th term of the term set of values
;
—left coordinate of the maximum of the function
;
—compression/stretching coefficient of the left arc of the membership function;
—the right coordinate of the maximum of the function
;
—coefficient of compression/stretching of the right arc of the membership function.
To establish the parameters of membership functions, the authors of this article used self-organizing neural networks (Kohonen maps). The advantages of this approach are that the process of constructing Kohonen maps does not require (
Gersbach and Rochet 2017): the availability of a priori information about cluster parameters, and in contrast to statistical clustering methods, “cluster standards” are formed in the neural network learning process solely based on input information; known values of the “output” of the model; involvement of expert opinion.
In the process of repaying overdue debt to the bank, there often arise such problems as the cost of repaying the debt exceeding the amount returned, determining the order and priority of working with borrowers, effective choice of tools to influence borrowers, and assessing the real cost of selling a portfolio of bad loans to a debt recovery firm. The use of mathematical models in the analytical systems of a commercial bank and adaptation of these systems to the set business tasks will provide an opportunity to significantly improve the quality of the loan portfolio management process, including measures to repay (recover) overdue debt.
Collection scoring divides borrowers into separate groups, which is convenient for collectors and allows segmenting borrowers regardless of the type of loan product (type of loan). It is important to note that the segmentation of borrowers is an important separate stage in the organization of the process of repayment of overdue loans. After segmentation, different strategies are applied to the work with each separate group of borrowers, which allows making the work on recovery (repayment) of overdue debt most effective.
Thus, when working on the collection of overdue loans, collection scoring helps to solve such problems as performing segmentation of clients, determining their priority and priority of actions of bank employees in relation to a borrower, and identifying the relevant tools of influence. Moreover, such scoring makes it possible to obtain an estimate of the portfolio of overdue loans for sale to another structure (for example, a debt recovery firm).
4. Results and Discussion
As a result of neural processing of statistical sampling of values of input indicators and analysis of profiles of the constructed Kohonen maps, we obtained the following parameters of membership functions:
,
,
,
(
Appendix B).
When experimentally constructing self-organizing maps, it was determined that dimensional maps (25 × 25) provide the most accurate result for the variables age, registration period, and work experience. For the variables basic monthly income, additional monthly income, DTI, credit amount, annual interest rate, credit term, annuity payment, collateral value, LTV valuation indicator, the maximum number of days in arrears on the credit, and number of overdue payments on the credit, we used topological dimension maps (30 × 30). It is at such dimensions of self-organizing maps that the maximum values of quantization matrix errors have a permissible level of 0.036. Additionally, the given topological dimensions are explained by the large sample size (1000 credit agreements).
The next stage of modeling collector scoring is the convolution of the input criteria for evaluating the IV level of the hierarchy into the corresponding intermediate integrated indicators for evaluating the III level of the hierarchy.
Among the variety of rules of fuzzy inference, the rules of Mamdani, Sugeno, hierarchical, compositional rule Zade, and others are the most used.
The use of Mamdani convolution in the given case is not appropriate due to the large number of possible combinations of linguistic terms of the input variables. Indeed, only for quantitative variables were there about half a thousand options. Involving an expert analyst in the formation of such a set of rules will give the wrong result in the segmentation of problem clients to manage problem debt.
The involvement of fuzzy inference in the process of modeling hierarchical systems is one of the most acceptable in the case of modeling on samples with thousands of observations and a wide range of variables. The use of such a system of fuzzy inference makes it possible to overcome the problems of high dimensionality in the modeling of multidimensional dependencies.
Thus, with a large number of inputs, it is difficult for an expert analyst to state cause-and-effect relationships with fuzzy rules. The advantage of using a hierarchical system of fuzzy inference is also its compactness. However, the disadvantage of using this type of conclusion in the given case is the influence of the human factor on the outcome of the grouping of borrowers, which is associated with the expert establishment of decision making rules.
If the task is to segment the set of debtors to establish an appropriate strategy for the relationship between the lending institution and the borrower to repay overdue debts, it is necessary to summarize the indicators that characterize borrowers (such as age, education, family, children, work experience, place of registration, and others) to identify the dependence of “input variables non-return risk”.
Thus, according to the authors, to obtain more adequate results of credit risk assessment, it is appropriate in this case to apply a hierarchical approach, involving at the stages of convolution an additive composition rule with subsequent neural processing of the set of values of the resulting integrated indicator using Kohonen maps.
To determine the vectors of correction factors, the latter conducted numerous experiments separately for each variable.
Since the input variables have a positive or negative ingredient, the correction vectors must take this property into account. Thus, the variables with a positive ingredient include the registration period, work experience, basic monthly income, additional monthly income, and the value of the collateral. That is, the greater the value of these variables, the better it is (less risky). It is expected that these borrowers are more likely to settle with the creditor. For these variables, the elements of the vector of correction factors take positive values and are arranged in ascending order.
For such quantitative variables as DTI, credit amount, annual interest rate, credit term, annuity payment, LTV valuation rate, the maximum number of days in arrears on the credit, and the number of overdue payments on the credit, with the increase in their values, the chances of repaying the debt to the creditor decrease. These variables have a negative ingredient. For these variables, the elements of the correction factor vectors can take both positive and negative values but are arranged in descending order.
The results of experimental studies on the establishment of correction vectors are shown in
Table 1.
Qualitative input variables, which form the intermediate integrated indicators of the III level of the hierarchy, are involved in neural processing by one array. A numerical value to each value of the qualitative variable is assigned to process the Kohonen self-organizing maps. Thus, a group of variables {“Gender”, “Level of education”, “Place of registration”, “Marital status”, “Number of dependents”} are simultaneously involved to cluster observations to calculate the intermediate integral indicator “Borrower’s personal data”. The result of the calculation will be a linguistic variable that contains an integrated assessment of the corresponding input qualitative variables, with a term set of values “Low”, “Medium”, and “High”. The input variable “Number of dependents” will be conditionally considered a qualitative indicator, as the borrower’s behavior, depending on the number of dependents, is not clearly traced. Therefore, the variable is involved in simultaneous processing with qualitative variables.
Groups of variables {“Position”, “Place of work”, and “Field of activity”} (the result will be a linguistic variable with a term set of values “Low”, “Medium”, and “High”), {“Lending currency”, “Region credit disbursement”, “Credit issuance day”, “Credit security information”} (the result will be a linguistic variable with a term set of values “Low”, “Medium”, and “High”), and {“Presence of delay on the first payment”, “Presence of arrears on the first three payments”} (the result will be a linguistic variable with a term set of values “Low”, “Medium”, and “High”) are also processed simultaneously. The result of this processing of arrays of input quality variables is the formation of four bases of rules, a fragment of which is given in
Appendix C.
The total number of rules for qualitative variables of the intermediate integrated indicator for the borrower’s personal data based on the results of neural processing is 322 rules. The database of rules for qualitative variables of the intermediate integrated indicator on the data on the borrower’s employment based on the results of neural processing contains 159 rules. The base of rules for qualitative variables of the intermediate integrated indicator on the data on the credit based on the results of neural processing has 215 rules.
As a result of neural processing of vectors of data of intermediate integral indicators, one will obtain the membership of each observation to a certain cluster (one of three that characterize the corresponding linguistic value “Low”, “Medium”, and “High”), and the distance of a neuron to the certain center of a cluster on the corresponding topological map. Using the results obtained after neural processing, the parameters of membership functions for all intermediate integral indicators of evaluation of the third level of the hierarchy are calculated—
,
,
,
(
Table 2).
The following correction factor vectors were determined experimentally for intermediate integrated indicators of the III level of the hierarchy: {1,1,5} for the intermediate integrated indicator on the borrower’s personal data, employment data, and data on the granted credit; {1,2,3} for the intermediate integrated indicator on the financial condition of the borrower and arrears of payments on the credit.
Similar to the previous stages of modeling, linguistic variables for integral indicators of the II level of the hierarchy and term sets of values of linguistic variables are determined, and membership functions are constructed. To determine the parameters of membership functions, as in the previous stages, vectors of numerical values calculated on the indicators of the training sample are involved in neural processing. The result of neural processing is that each borrower belongs to one of the three clusters in terms of integrated indicators. As a result of processing the data on the distribution of borrowers in these clusters, the parameters of the membership functions of all terms of these integrated indicators, which are summarized in
Table 3, are obtained.
As a result of a series of numerical experiments for integral indicators, the following vector of correction factors was determined: {1,2,3}.
The linguistic variable that describes the score is defined by a term set of values with three terms: “Low”, “Medium”, and “High”. To determine the parameters of the membership functions of the scoring indicator, the vector of its numerical values, calculated for borrowers of the training sample, is subjected to neural processing, as a result of which data on the parameters of clusters are obtained (
Table 4).
The topological image of the clustering of scores of borrowers is shown in
Figure 2. When constructing the Kohonen map for the scoring indicator, the dimensions of the topological map were established (30 × 30).
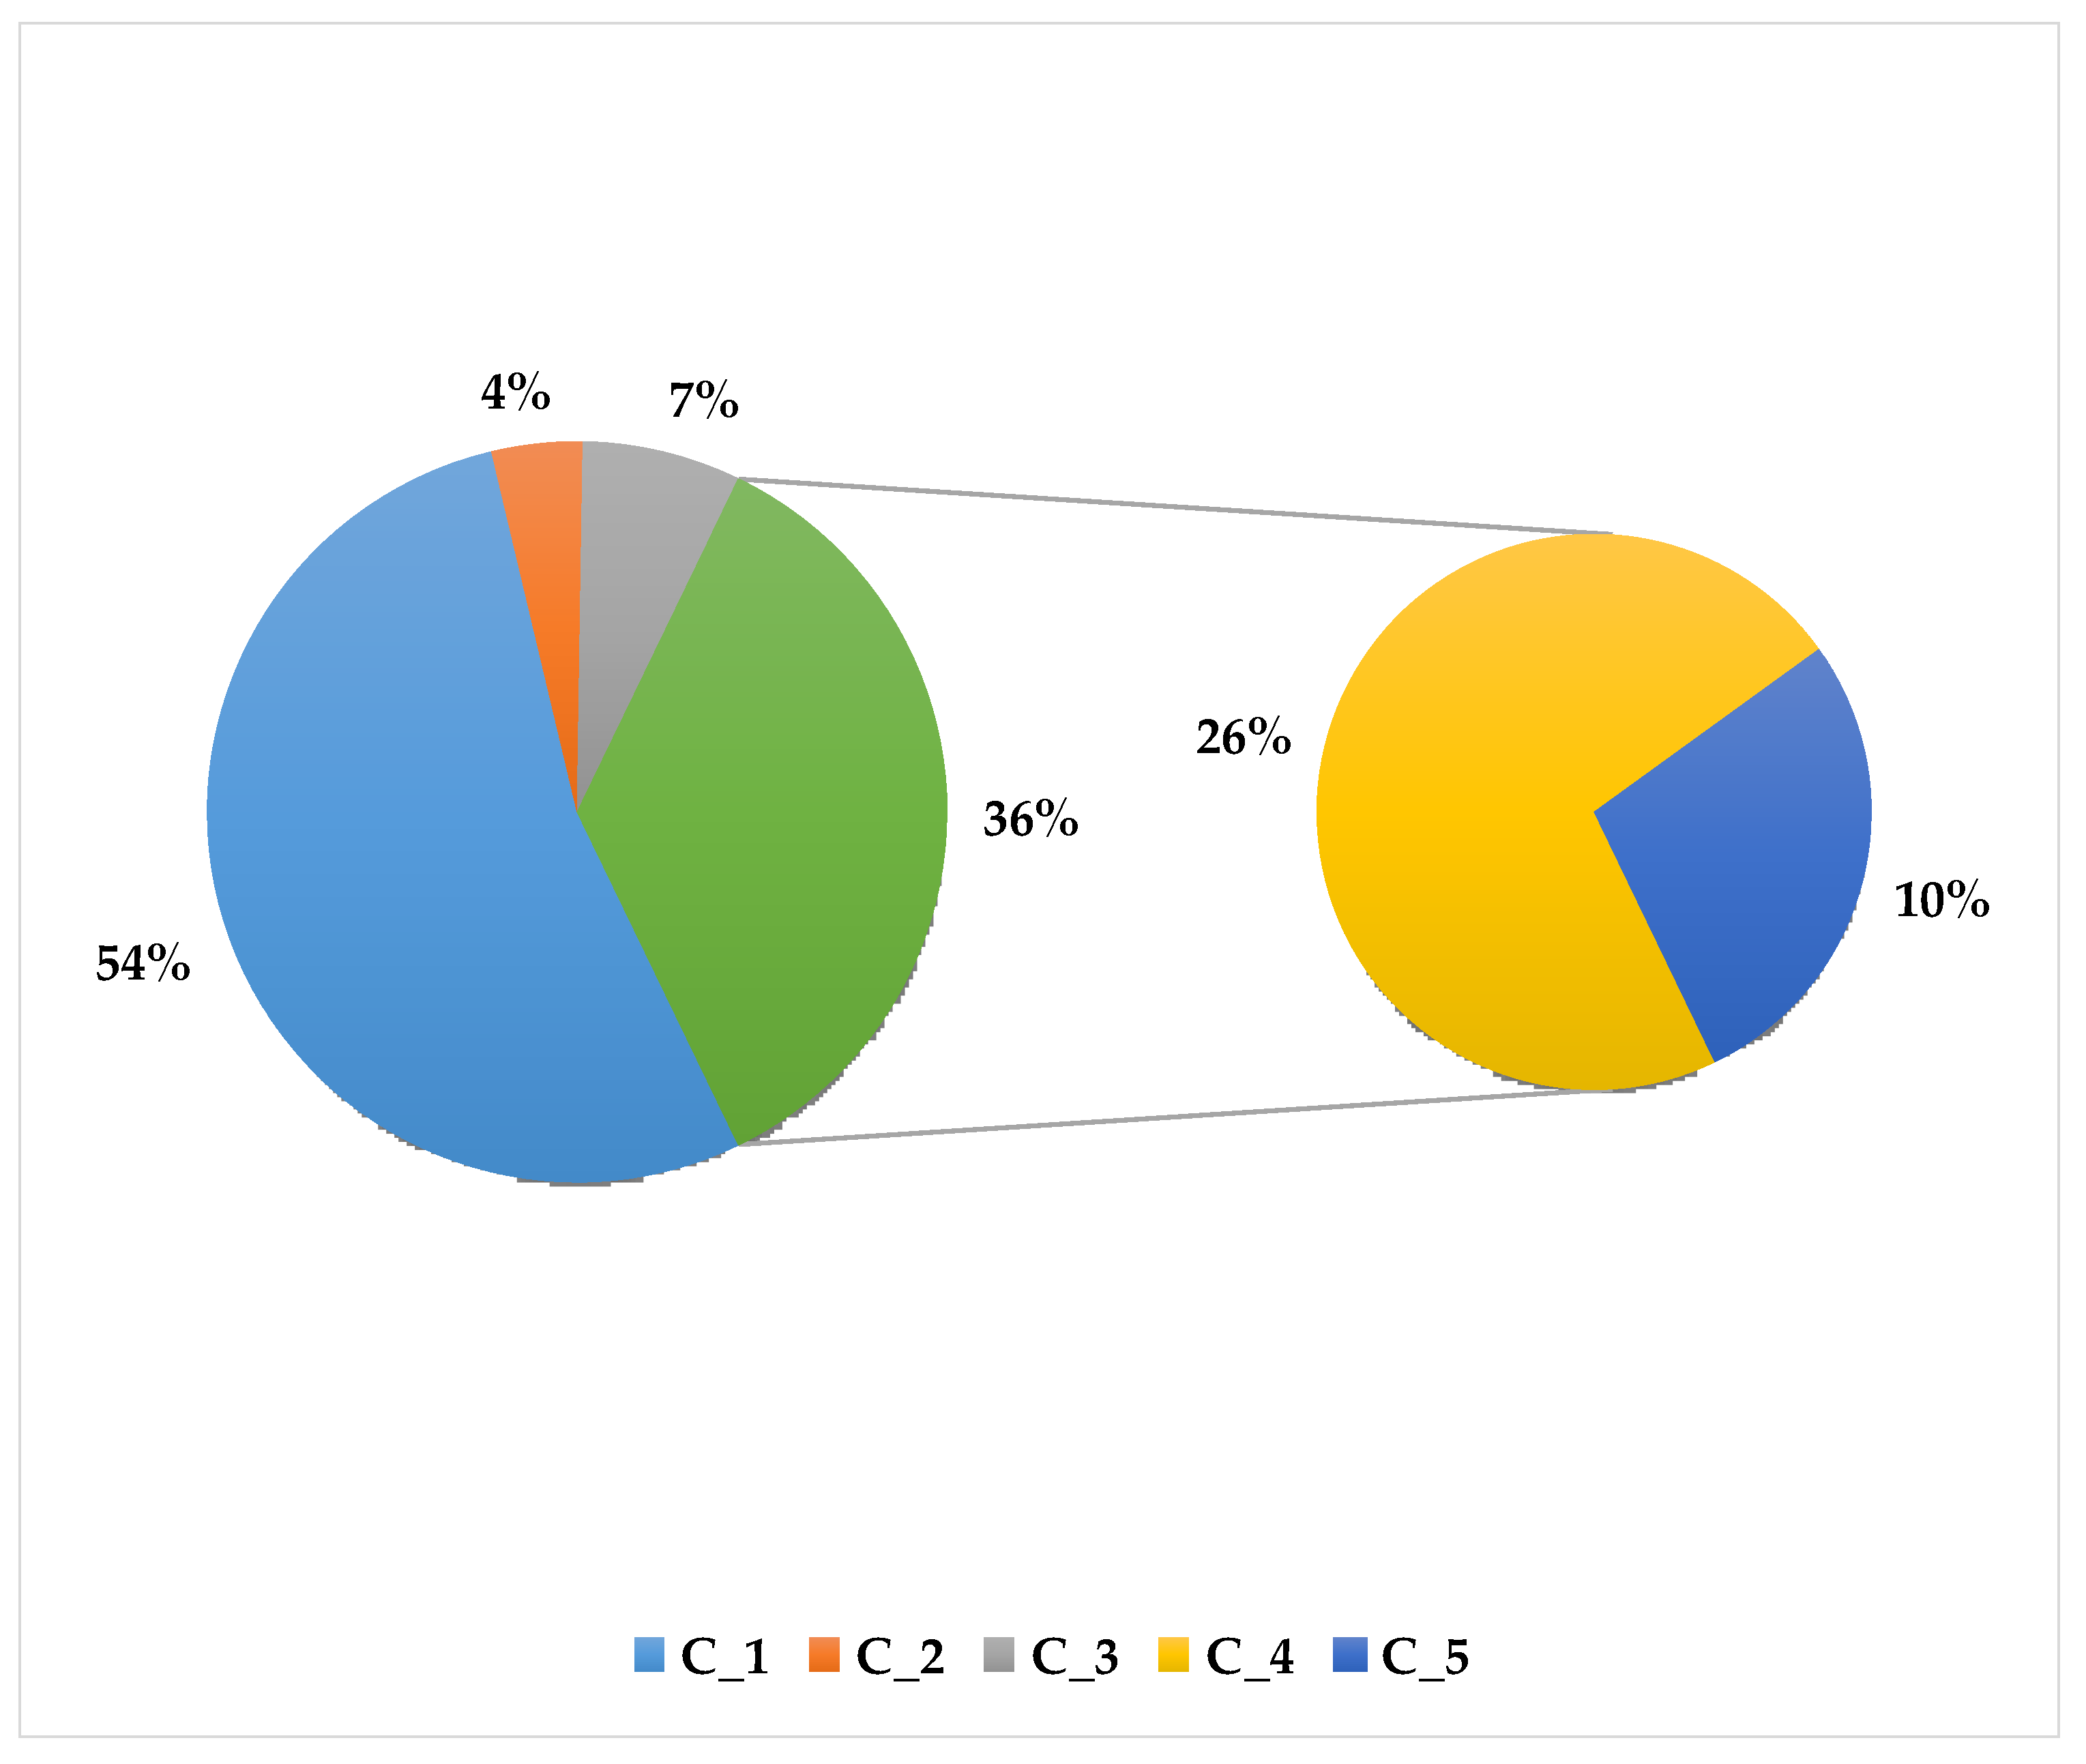
The result of fuzzy clustering will be the segmentation of borrowers with overdue credit repayment terms, based on which one can determine the most adequate strategy for interaction with each individual debtor. The segment of the overdue credit portfolio of a commercial bank is determined based on the calculated values of the scoring indicator (S), as shown in
Table 5.
The result of the segmentation of borrowers with overdue credit indebtedness is presented in
Table 6, and the diagram is shown in
Figure 3.
The results of
Table 6 characterize only a separate portfolio of overdue credits. It should be recalled that scoring systems are developed separately for each specific task. Thus, scoring models developed on data on customers who have used consumer credits for small amounts cannot work adequately, for example, on the credit portfolio of car credits.
The constructed model of collector scoring for recovery of overdue debt makes it possible to develop recommendations for working with each segment of the portfolio of overdue credits in accordance with the level of credit risk, which are summarized in
Table 7.
The priority of cases in the third group should be determined according to the level of risk. More “dense” work with such debtors can be effective.
Akkoç (
2019) conducted a study to find the most effective approach to the pre-processing of the characteristics of borrowers for the purpose of improving the accuracy of forecasts of defaults on credit obligations.
Akkoç (
2019) analyzed three main methods to present data to the inputs of credit scoring models: the use of initial explanatory variables without transformation, the translation of categorical characteristics into a set of fictitious variables, binning of indicators with the calculation of the weight of evidence (WOE) for each category.
To obtain conclusions on the systematic influence of characteristics of borrowers,
Janková and Dostál (
2020) carried out 10 repeated iterations to build neural network models of the perceptron type for each of these three methods of preparation of input factor sв. Each scoring model was evaluated using a wide range of indicators of integrated and point efficiency.
According to
Ashokkumar and Babu (
2020), the results of their conducted experiments confirmed, almost by all criteria, the advantage of the methodological approach, suggested by the authors, to data processing by way of dividing the quantitative variables into categories and ensuring the trend of their indicators of weight of evidence and compliance with limits on the number of observations in each group.
Moradi and Rafiei (
2019) determined that the highest accuracy is provided by a fuzzy system based on Sugeno logical inference, and the best transparency is provided by a system based on Mamdani fuzzy inference. Hybrid evolutionary-neuro-fuzzy credit scoring technologies were developed for both fuzzy inference models.
Regarding the fourth segment, it is worth determining how effective it can be to collect an overdue debt. That is, whether it will not exceed the cost of work of debt collection of credit funds repaid in this way. If a negative financial result is found, it is recommended to write off such debt as bad. Comparing recovery costs with the amount of debt and the expected amount of repayment is an important step in building a strategy for repaying overdue payments.
It is recommended to become clear of debts that formed the fifth segment (assignment, write-off).
It should be noted that the considered fuzzy credit scoring models are not ideal, as they have certain disadvantages and limitations. The sets of characteristics that are associated with payment delays or loan defaults vary from country to country. Here, one should take into account national, cultural, and economic features. The scoring model will be more accurate the more homogeneous the sample the forecast is based on, and provided that all subsequent clients will also fall into this category of clients. Therefore, a model cannot be transferred with its weights and thresholds from one country to another so that it remains effective. Additionally, even within one bank, it will be advisable to apply different models for different groups of clients and banking products.
Based on the experience of the banking system, it is clear that, along with the rapid development of consumer lending, increases in the number of defaults and fraud, and taking into account the convenience and usefulness of the scoring method for assessment of the creditworthiness of an individual borrower, it is necessary to improve the scoring model. While the quantitative indicators are sufficiently developed and take into account the economic condition of a borrower, qualitative indicators, due to their narrow range, do not fully cover all aspects of the client activities exposing the bank to losses from delays in payments or non-repayment of a loan.
In addition, many software products used by banks apply only one of the above-mentioned analytical methods to make a decision. As a wide range of indicators that must be taken into account for a complete and thorough assessment of the creditworthiness of an individual client require the simultaneous use of different methods of decision making, it is advisable to use hybrid expert scoring systems. These issues and taking into account the time factor when building fuzzy credit scoring models will be considered in further studies.


