Abstract
Using US firms with over $5b market cap, this paper tests the impact of levered beta on the firm’s market value and optimal capital structure. Using the synthetic rating method in a recursive model, the paper shows the current and optimal weighted average cost of capital sensitivities as the firm’s market risk measured by beta changes. The paper shows that the change in the value of beta due to alternative leverage levels or other risk factors will alter the cost of capital insignificantly and has no impact on the optimal capital structure due to those firms’ extra-strong bond ratings. As a side-benefit of the synthetic rating method, one may also observe the market-level variables’ impacts on the cost of capital computations and the optimal debt ratio. The paper uses Disney Corporation to show how the synthetic rating methodology helps to disclose the sensitivities of hypothetical alternative leverages.
1. Introduction
Capital structure and its impact on a firm’s cost of capital and firm value have always been widely debated and well analyzed. Historically, the weighted average cost of capital (WACC) approach introduced by Modigliani and Miller (1958, 1963) highlights that a levered firm’s value may be expressed as a sum of two present values representing investment and financing decisions. The investment decisions highlight the present value of the relevant unlevered cash flows, and the financing decisions pertain to the present value of the tax shield. In late 1970s, Myers (1977) highlights that many corporate assets, including growth opportunities, should be viewed as ‘real options’ and their value depends on future discretionary investment by the firm, and therefore issuing risky debt reduces the present market value of a firm holding real options. Myers believes that corporate managers are not really thinking about a long-run target debt-to-equity ratio in making financing decisions, and they just follow the most practical path. Myers suggests that the theories of the optimal capital structure may be translated into advice to managers. (Myers 1984, p. 575) Myers adds, “We know very little about capital structure. We do not know how firms choose the debt, equity, or hybrid securities they issue. We have only recently discovered that capital structure changes convey information to investors” (Myers 1984, p. 590). Miller (1976) writes, “even in a world in which interest payments are fully deductible in computing corporate income taxes, the value of the firm, in equilibrium will still be independent of its capital structure.” Adding to the literature, Miles and Ezzell (1980) show that the WACC model would yield correct valuation if the leverage ratio of the firm remains constant through time, an assumption criticized by the practitioners. Miller (1988) notes that “A number of recent developments in finance can be seen as confirming the suspicions of many of us academics in the early 1960s that high leverage strategies to reduce taxes were indeed entirely feasible.” As noted by Ross et al. (1996), the underlined WACC approach to valuation has been a favorite for both practitioners and theorists as early as the 1990s. Giner and Reverte (2001) used a valuation model to analyze the capital structure’s informative value, decomposing the book value of equity in its two main components of total assets and liabilities to test whether investors price them differently.
Graham and Harvey (2001) report that 37% of their respondents have a flexible target debt ratio, 34% have a somewhat tight target or range, and 10% have a strict target. Fama and French (2002) suggest that firms move quite slowly towards their targets. Welch (2004) highlights that US corporations do little to counteract the influence of stock price changes on their capital structures. Ross (2005) reemphasizes, “… in modern finance, the textbook approach to capital budgeting and the WACC continues to be a holdout. Generations of students are still taught the workhorse tradeoff between tax benefits and bankruptcy costs and learn to derive a WACC to use for evaluating investment projects.” Barclay and Smith (2005) question if there is a way of dividing a company’s capital base between debt and equity that can be expected to maximize firm value? And if so, what are the critical factors in determining the target leverage ratio for a given company? They question what makes the capital structure debate especially intriguing and conclude that the theories lead to such different and opposed decisions and outcomes. Titman and Tsyplakov (2007) discuss the importance and usefulness of target debt ratio and supports dynamic capital structure models. Jaroslav and Bartosova (2015) highlight that over the last 50 years, several theories of capital structure have been formulated, but the main problem associated with their application was the fact that their outcomes are valid only under certain conditions and with certain limitations. Krüger et al. (2015) show that “firms fail to properly adjust for risk in their valuation of investment projects, and that such behavior leads to value-destroying investment decisions.” Bartosova and Jaros (2016) define the basic task of liability management in a capital structure as the most appropriate alternative of a company capital structure.
As explained in many corporate finance textbooks, corporations pay attention to maintain their optimal capital structure since it has a significant impact on firms’ market value. For any firm, the WACC constitutes the discount rate used to compute the present value of the firm’s future free cash flows, and when it is minimized, the computed present value of the firm is maximized. Suboptimal capital structure will depress the market value of firms and contribute to inefficiencies reflected by the higher cost of capital. When a firm operates at the suboptimal capital structure, a restructuring should offer the needed correction to grant maximum market value. Restructuring is an act of modifying the firm’s leverage level to move the firm to the optimal capital structure.
This paper evaluates the impact of change in a firm’s beta in response to the change in the leverage of the firm’s optimal capital structure using the synthetic rating method in a recursive model. This is important since firms would like to know the impact of modified leverages on their cost of capital to set their steps properly in the strategic move of restructuring. On the other hand, financing decisions are complex and connected to several variables and parameters such as the firm’s market risk measured by beta, the corporate tax rate, the risk-free rate, and the equity-risk premium used in modeling. In addition, investigating the impact of modified leverages is difficult since the component costs of debt and equity used in unobserved alternative leverage levels need to be estimated. The paper overcame this hurdle by utilizing the synthetic rating approach to obtain the cost of debt and equity values for the alternative leverage levels when the firm’s riskiness changes due to a number of relevant factors. The paper discloses the impact of leveraged beta, equity risk premium, and the risk-free return on the optimal capital structure and the firm’s debt capacity. This context attempts to show the impact of a firm’s changing riskiness on a company’s cost of capital and the positioning of the optimal capital structure under alternative leverages using an experimental evaluation. This is valuable for the managers since it enables firms to obtain the WACC elasticities to anticipate the reaction to the change in overall riskiness of the firm as well as the related variables’ impact on the leverage enhanced cost of capital and their reflection on the market value of firm together with the size of the debt.
Our findings suggest that while the recursively computed WACC values corresponding to alternative leverage amounts move with the beta, the shape of the WACC curve for alternative leverage levels and the optimal debt-to-equity ratio will stay the same, making much of the discussions around the firm’s risk structure and capital structure irrelevant for the US firms with extra-strong bond ratings and market cap over $5 billion. The paper shows that firms with extra-strong bond ratings are almost always operating using a D/A ratio that is not sensitive to immediate changes in the firm’s riskiness since their cost of capital stays the same as leverage changes for a wide range of dent-to-asset ratios. This is important since it contributes to the capital structure debate using an experimental approach to show that capital structure or the optimal debt-to-equity ratio need not be modified if the firm’s beta changes due to leverage modifications.
2. Materials & Methods
Modern corporate finance defines the market value of a firm as the present value of future free cash flows discounted at the weighted average cost of capital, or WACC:
where k is the component cost of capital in percentages, W is the percent of the component to total capital, T is the marginal tax rate, D is debt, P is preferred stock, and E is equity. Notice that ∑W = 1.0 For simplicity, we assume the firm has no preferred stock outstanding throughout the paper.
Once obtained, WACC will be used to determine the market value of a firm (V) using the equation:
where t is the time subscript with proper compounding and FCF is the free cash flow to the firm.
Clearly, to obtain the market value, one has to obtain the future FCFs and the WACC value to discount them:
Literature has alternative forms of FCF computation. The one used here is the most common one that several data providers such as Reuters use. It typically shows the free cash flow to the firm by computing the operating cash flows (OCF) minus the capital expenditures (CAPEX).
Free cash flow is an important financial health indicator as it includes not only the operating cash flows of the year but also the required investment to stay competitive, or CAPEX. Firms typically like to maintain the optimal capital structure that minimizes the composite cost of capital and maximizes the market value of the firm. Using Equation (2), the market value will rise if the firm raises the FCF or lowers the WACC. The usual fraction properties apply to observe a higher fraction value when the numerator and denominator change.
The change in FCF is a complex matter and largely depends on the funds’ availability and the strategy. This paper will not cover the FCF-related issues and their impacts on the firm’s market value. In order to focus on the impact of the WACC on the market value of a firm, we focus on the denominator of Equation (2).
2.1. Free Cash Flow
For simplicity, throughout the paper, we assume that FCF stays the same over time or increases with a constant growth rate. These assumptions are not strategic and will not alter our findings because “stays the same” or “increases” do not imply a firm’s capabilities. It is well known that successful new firms with high growth rates may have negative or wildly fluctuating FCFs, while steadily profitable mature firms may have much more stable FCFs. Therefore, the value and the volatility of FCF are not an integral part of this work as we focus on the denominator of Equation (2). These assumptions will simply provide us with comparable benchmark results and offer simplicity.
When FCF is assumed not to change over time, Equation (2) becomes:
When FCF is assumed to grow with a constant rate of g, Equation (2) becomes:
2.2. Current WACC and Its Determinants
Equation (1) summarizes the inputs needed to determine the WACC. In addition to the firm’s marginal tax rate and the percentage of capital amounts in each component, one has to obtain the cost of debt, cost of preferred stock, and cost of equity. The common WACC in Equation (1) has many complications a researcher has to deal with in computing. One important issue is the need to use the market value of debt and equity when computing the cost of debt and equity. The market value of equity is rather simple as it is available, but debt’s market value is a more complex matter. A firm’s debt is not created at a single point in time but initiated in several different points that spread over many years, if not decades, and each has its characteristics reflecting the time the debt was issued. A firm’s total debt is simply the portfolio of several debts outstanding, each with a different size, cost, and duration.
When computing the cost of debt and equity, researchers may use the discounted cash flow approach to obtain the cost of equity:
where D1 is the next period’s dividends, P0 is the current stock price, and g is the growth rate or the percentage change in stock price from time zero to one.
Alternatively, one may prefer to follow an asset pricing model, such as CAPM, and utilizes the following in determining the cost/return of equity:
where kRF is the risk-free return, kM is the market return, and βx is the beta of the firm showing its market risk. Once the market value of equity and the current cost of equity is determined, the current component cost of equity will be obtained.
The current component cost of debt may also be determined using the current cost of debt and the current market value of debt. Some researchers use the book value of debt as an acceptable conservative proxy for the market value of debt since the firm will refinance if the cost of debt decreases. The total interest paid for the same period constitutes the cost of outstanding debt, producing a ratio we use as the current kD.
An alternative way to compute the current cost of debt is to start with the posted book value of debt and interest expenses of the same period. Using the bonds outstanding, the weighted average maturity of the portfolio can be computed. The firm’s current cost of borrowing can be used as the discount rate to compute the PV of a bond (the portfolio that includes all outstanding bonds) with the face value equal to the book value of total debt with coupons equal to the interest expense, and the time to maturity equal to the weighted average maturity of the bonds included in the portfolio. The obtained PV of this bond will constitute the market value of debt for the firm.
Computing the after-tax cost of debt requires knowing the risk-free rate and the default spread. How to obtain those are to be explained later. Once we have the total amount of capital, the marginal tax rate, market value of debt and equity, and cost of debt and equity, we can compute the current WACC. With the current WACC and the FCF, the current market value of the firm will be obtained.
2.3. Synthetic Ratings and Obtaining the Cost of Debt
The most intuitive way to obtain the current cost of debt is to utilize the published rating spreads available in Bloomberg’s FIW (Fixed Income Worksheet) similar to Reuter’s corporate spreads for industrials, published periodically in the past. This paper uses the synthetic rating method utilizing the interest coverage ratio to determine the spread over the risk-free rate as shown in Table 1, below. Using all publicly traded US companies, a synthetic rating table can relate the interest coverage ratio (ICR) to a company’s rating, and the corresponding spread over the risk-free rate can be obtained.

Table 1.
Synthetic ranking 2020—interest coverage ratios and default spreads for non-financial firms with market cap > $5 billion.
2.4. Methodology
The starting point of the method is the firm’s current capital structure that uses the market value of debt and equity. The firm’s share price, shares outstanding, total debt, EBIT, total interest paid, and the tax rate are the required inputs for the recursive model. The firm’s beta is computed simply by regressing the firm’s monthly stock returns. Once the “current information” is obtained, the firm’s unlevered beta showing the firm’s all-equity risk level is obtained using the Hamada equation. Unlevered beta is used to compute alternative levered betas using the recursive model. Utilizing the levered betas and standard capital asset pricing model, cost of equity, components are obtained for all leverage levels starting with all-equity and rising 1 percent at a time up to 100 percent. For each percent increase in debt, the corporate default risk above the risk-free is computed using the synthetic ranking method and recorded as the cost of debt for the debt level. Combining component costs of debt and equity yield the values of the minimum weighted average cost of capital amounts from zero to 100 percent debt levels (See Figure 1, below). The resulting figure shows how the debt-to-asset ratio will look like the levered beta increases due to higher leverage. As one can see from Figure 1, even if the firm’s risk is more than doubled, the firm’s D/A ratio stays the same. We have performed the analysis to 30 firms included in Dow Jones Industrial Average (DJIA) and confirmed that everyone is in line with the model’s findings. For the sake of compactness, only four firms’ min WACC graphs are presented in Figure 2.

Figure 1.
Disney’s WACC values for different leverage levels using January 2020 data. EBIT: $11.85 b, Total debt: $51.93 b, Interest Paid: $1.25 b, Tax: 21%, Shares Outstanding: 1.81 b, Price: $148, 10Y Treasury rate of 1.88 percent, and the market return is 7.88 percent.
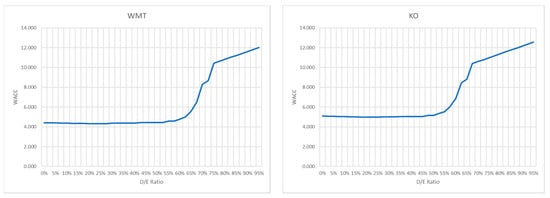
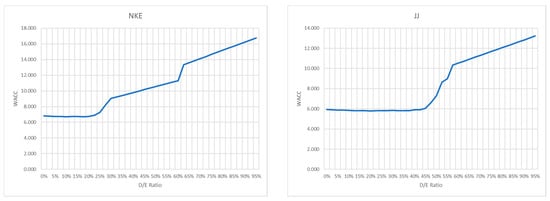
Figure 2.
Presenting four DJIA firms: Walmart, Coca Cola, Nike, and J&J. Figures show their optimal capital structures as their debt-ratio increases.
3. Sensitivities
Knowing the firm’s current WACC and the current market value is the starting point to investigate if the current capital structure is optimal. One needs to evaluate how the current capital structure changes as leverage changes. Suppose a lower WACC value cannot be obtained as the leverage ratio is modified. In that case, the firm is operating at the optimum capital structure, and therefore, its market value is maximized.
Strategic planning on financing decisions requires knowing the cost of capital’s reactions to alternative risk scenarios together with the impact on the optimal debt ratio. In other words, decision-makers of any firm would like to see how sensitive the minimum WACC to the inputs needed to compute the WACC for alternative scenarios and how sensitive they are to the changes in market parameters. Secondly, the impact of certain underlying assumptions such as an assumed equity risk premium can be quantified when a model is capable of making the impact of the modifications of certain inputs on the minimum WACC observable. In more detail, if the market risk premium has very little impact on the min WACC value, the use of the historical MRP or an annual return of SP500 over a one-year Treasury will not have a significant impact on the results. However, if little changes in the risk-free rate change the min WACC significantly, it would be important to pay attention to what risk-free rate should be used.
3.1. Capital Structure in Play
Once the current min WACC with current inputs is obtained, this capital structure’s optimality can be investigated by modifying the debt ratio. This, however, requires integrating a leverage enhanced risk measure. A company’s current beta value reflects the company’s current risk under the current leverage level. Modified leverage will change not only the cost of debt but also the cost of equity since the firm’s overall risk increases with the leverage. On the other hand, an increase in leverage-induced risk will not necessarily modify the cost of capital and optimal capital structure. As it is well-known, an increase in leverage may lower the cost of capital and helps the firm up to a point, but further increases in the leverage will hurt the firm beyond this optimal point.
Computing the new cost of equity and cost of debt requires hypothetical corporate spreads over the risk-free rate for the alternative debt levels. Further, for each new debt level, a levered beta calculation would be necessary and will be computed using the Hamada equation:
where βL is the levered beta, βU is the unlevered beta, T is the marginal tax rate, and D/E is the debt-to-equity ratio.
Inserting computed levered beta values in Equation (7) will produce the cost of equity estimations for alternative leverage levels. To obtain the entire WACC values for alternative leverage levels require a cost of debt estimation for each alternative level. This paper overcomes this hurdle using the synthetic rating approach. Computing the company’s interest expense for the new hypothetical alternative debt amount produces the interest coverage ratio under the assumption that different leverage levels will not modify the firm’s EBIT. Using the Synthetic Rating Table provided, we obtain the corresponding spread over the T-Bond. Adding this spread to the risk-free rate will produce the needed cost of debt for the leverage level in question.
Using both the cost of debt and cost of equity for the given D/A ratio and the tax rate will produce the WACC value for the alternative leverage levels. Figure 1 shows the WACC values for alternative leverage levels for Disney Corporation. This work uses Disney Corporation to show the sensitivities; however, the methodology used here can be applied to any firm to obtain firm-specific elasticities. The WACC has minimized at the D/E level 0.375 or 37.5 percent dent-to-asset ratio. Using the actual accounting data, Figure 1 provides a full picture of WACC sensitivities. It will present the min WACC value of 7.058 percent at 0.375 and show how much this value will change as we move around the optimal point. It is very valuable to see that the min WACC values are visibly flat up to almost 45 percent but becomes very sensitive to increased leverages after that point. In more detail, Figure 1 shows, for example, when leverage changes from 15 percent to 45 percent, the min WACC moves up from 7.13 to 7.29 percent, 0.16 percent, or 16 basis points. However, when leverage changes from 48 percent to 58 percent, the min WACC moves up from 7.44 percent to 11.53 percent, 4.09 percent, or 409 basis points. The management will be able to see that the impact of the leverage or use of more debt financing will not lower the WACC if they are located on the left of 45 percent level. The management will also see that issuing more debt will decrease the WACC up to 37.5 percent D/A ratio, but they can go up to 45 percent without much worry. Figure 1 is a visual survey of WACC values together with optimal capital structure.
3.2. Sensitivities and Capital Structure
Since a firm’s total risk is the market risk plus the idiosyncratic risk and the idiosyncratic risk is not priced since it is entirely diversifiable, the market risk measured by beta is the firm’s relevant risk. As the leverage level is modified, the alternative cost of equity computations uses the levered betas computed using Equation (8). Knowing how sensitive the min WACC to changes in levered beta is therefore very valuable for the firm as they relate this to their strategic decisions and the levered cost of equity computations.
In more detail, when a firm’s market risk measured by beta changes due to a number of factors, the firm’s cost of debt and equity will reflect the new risk level and ultimately changes the value of WACC for the analyzed leverage level. For instance, in January 2020, Disney’s beta was reported as 1.04; however, in January 2021, Disney’s reported beta was 1.20. Those changes will modify the firm’s optimal capital structure and, therefore, the size of restructuring. If the new current and optimal capital structure values move away from each other, it implies a need for a larger restructuring. We will extend our evaluation using a comprehensive robustness check employing other relevant factors included in beta and WACC computation, such as the risk-free rate, equity risk premium, and the size of the debt.
The risk-free rate is used to compute the cost of debt. Knowing the impact of risk-free rate on min WACC is valuable since firms may decide to use alternative risk-free rates with care or may not pay much attention if the parameter is proven to be ineffective in modifying the min WACC.
The market-risk premium (MRP) is important for a number of reasons: In general, there is no agreement as to what the most appropriate market-risk premium is. Academics and practitioners have been discussing which MRP may work better in pricing assets for many decades with no consensus. One may use the historical MRP while the others may prefer the annual difference between the SP500 and one-year T-Bond as the MRP. Knowing the sensitivity of MRP on min WACC will also put those approaches in perspective.
Finally, the amount of debt has an obvious impact on the min WACC. The elasticity shows how much room in borrowing a firm has before the min WACC moves to a higher point and lowers the firm’s market value. In a way, this shows the reserve debt capacity that will not change the cost of debt, as observed in Figure 2 below.
Overall, firms would like to observe the min WACC’s reaction when certain factors are subject to change. This paper’s main contribution goes beyond how the different aspects of capital structure interact and integrates a synthetic rating method to provide us with the cost of debt components under unobserved alternative debt-to-equity scenarios. Without the organic link of the component cost of debts to the firm’s changing bond rating, researchers and practitioners will not be able to obtain the proper cost of debt and equity components and will not be able to observe the elasticities shown in Figure 1 above and Figure 2 below.
4. The Application—Disney Corporation
We have integrated multiple-stage programs recursively feeding each other to compute and show alternative levered WACC values as the firm’s risk level changes due to integrated alternative leverage scenarios in a systematic manner. In more detail, the process starts with the current data. The initial step is to compute the current WACC and the current capital structure. Then, using the synthetic rating, we obtain the cost of debt information, and using the Hamada equation to modify the firm’s levered beta systematically for all alternative leverage levels, we obtain the cost of equity. Combining those components, the leverage-specific cost of debt and equity at all D/E levels is computed together with the corresponding WACC values and the min WACC showing the optimal capital structure that maximizes the firm’s value.
4.1. The Market Risk and Its Impact on WACC and Capital Structure
Table 2 shows the changes in actual and min WACC values when the firm’s market risk changes under alternative debt amounts. The top left panel uses the current actual debt level of $51.93 billion. The shaded middle row shows that the current beta for Disney is 1.04 as of January 2020 and the current WACC at 16.24 percent debt-to-asset ratio is 7.12 while the min WACC is 7.04 at 37.5 percent debt-to-asset level. This shows that Disney is not operating at the optimal capital structure and should move to 37.5 percent via restructuring. However, the real usefulness of this study is its ability to show the entire picture. A decision-maker will be able to visualize several important characteristics of the firm otherwise not available and get answers to several questions by using Table 2. As shown in Figure 1, the difference between the actual and optimal capital structure is very little—6 basis points—implying the firm may not benefit much from the restructuring. Second, when the risk measured by beta increases significantly from 1.04 to 1.54, the optimal D/A ratio stays the same at 37.5 percent level. So, the increase in market risk will not modify the position of the min WACC. The spread between the current and optimal WACC will not be much different, with the largest difference equal to 18 basis points. At the same time, a decision-maker will be able to see the value of WACC at the higher risk levels. When beta is about 50 percent higher than the present level, the WACC increases from 7.12 to 9.63 percent. When we modify the beta downwards, from 1.04 to 0.84, our min WACC is still positioned at the 37.5 percent level! Only when we lowered the beta down to 0.74 or lower did the min WACC’s location move down to 20 percent D/A level, suggesting lower leverage. However, the difference between the actual and min WACC will be insignificant for those lower beta levels making capital structure decisions not important.
Table 2.
Disney’s beta sensitivities as the amount of debt changes. The top panel starts with total debt of $51.93 b. and raises it $10 b at a time, and the bottom panel lowers it $10 b at a time. Both panels use the real data EBIT: $11.85 b, Interest Paid: $1.25 b, Tax: 21%, Shares Outstanding: 1.81 b, Price: $148, 10Y Treasury rate 1.88 percent, and the market return is 7.88 percent. Published beta: 1.04 (Shaded middle row) with 5 steps up-and-down 0.1 incremental changes.
It is important to highlight that Table 2 shows two important issues about leverage and beta-risk. First: If we take a certain debt such as the current $51.93 billion, we will be able to monitor the cost of capital and the optimal capital structure while the firm’s risk changes at the current leverage level. Table 2 shows that there will be no change in the debt ratios for the beta values of 0.74 to 1.54. Interestingly, this is the case for almost all simulated debt levels from $11.93 to $91.93 billion. It shows that the change in beta value has no immediate impact on the optimal debt ratio for a given debt level. Second: If we move horizontally, Table 2 shows that for a given beta level, if we alter the leverage, the optimal debt ratio slightly changes so that as leverage increases, the optimal debt ratio decreases. The important thing to note here is that if a firm borrows more, it needs to have a lower debt ratio to maintain its optimal capital structure.
Table 2 highlights that as the amount of debt increases, the composite cost of capital slightly decreases as expected, keeping the beta value constant. Similarly, for a given debt level, when the starting beta value increases, the composite cost of capital also increases. However, the optimal capital structure stays the same for a wide range of debt-to-asset ratios in both cases. Consequently, the increase in beta without changing the debt amount will raise the WACC and consequently lower the market value of the firm, but an increase in beta accompanied by an increase in debt amount will lower the WACC and raise the market value of the firm. In both cases, however, the firm need not worry about maintaining its optimal capital structure. This highlights that maintaining the optimal capital structure is not an immediately binding goal for the firms as all of the studied firms observed to be operating on the flat section of the min WACC curve. In more detail, as it can be seen in Figure 1, the Disney Corporation’s minimum cost of capital will produce the 7.10 percent cost of capital for the debt ratio of 13 to 37 percent.
The remaining parts of the table show the same under alternative debt amounts noted on each panel’s upper left corner. The table starts with $51.93 billion actual debt amount and introduces four additional $10 billion debt in each direction to check the robustness of the beta sensitivity of WACC. In its entirety, the table is a very comprehensive way to see the present and future of the firm’s WACC picture together with its sensitivities to market risk and total debt amounts.
4.2. The Risk-Free Rate, Market Risk Premium, and Their Impact on WACC and Capital Structure
In alternative WACC computations, in addition to the beta of a firm, we need to use the risk-free return and the market-risk premium since these are needed to obtain the alternative cost of debt and equity. Because those values are usually subject to debate, we must assure that our results are robust to alternative proxies used as the market-risk premium and the risk-free rate. Table 3 shows Disney’s beta sensitivities as the amount of debt changes.
Table 3.
Disney’s min WACC sensitivities as risk-free rate and equity premium changes. The top panel starts with R(M) of 7.88% and increases 2% at a time and the bottom panel decreases 2% at a time. Both panels use the real data EBIT: $11.85 b, Interest Paid: $1.25 b, Tax: 21%, hares Outstanding: 1.81 b, Price: $148, 10Y Treasury rate of 1.88 changes plus/minus 8 times with 20 basis point intervals.
A firm’s beta coefficient is obtained by regressing the firm’s monthly returns on the market’s monthly returns, usually using the past five years. Therefore, beta relates a firm’s relative risk to the market. However, when we estimate the cost of equity using an asset pricing model such as CAPM used in this work, as shown in Equation (7), one needs to know the risk-free rate and the equity risk premium to compute the cost of equity. The risk-free rate is proxied by the Treasury securities, and the market risk premium may be proxied by using some form of historical risk-premium or using a market index for a related period to comparable to the risk-free securities terms. For instance, if a 10-year Treasury bond is used as the risk-free rate, one may use the return of a broad market index for the same 10-years period. Alternatively, a shorter-term maybe used. In this work, we used a very wide range to cover most grounds.
Table 3 addresses this issue showing the elasticities of WACC and min WACC as the risk-free rate and the equity risk premium artificially. The table starts with the actual risk-free rate of 1.88 percent published on January 2020 and the assumed equity risk premium of 6 percent and moves this rate up and down, 8 times each way, with 20 basis point steps. For each of these 16 risk-free alternatives, the equity risk premium of 2, 4, 6, 8, and 10 percent were simulated, and the results are tabulated.
Table 3 shows that as the risk-free rate increases, both the value of WACC and min WACC increase but the optimal D/A ratio and the sensitivity of WACC to the change decline. We also observe that the spread between the actual and min WACC is negatively correlated with the risk-free rate as low risk-free rates show significantly higher spreads. Those are observable with no exception in all 5 distinct panels of Table 3, each panel representing a different market-risk premium.
The top half of Table 3 also shows that an assumed increase in market risk premium will not modify the min WACC percentages for all 17 different assumed risk-free rates with no exception. However, the bottom half shows that the min WACC percentages decline as the market risk premium declines. This implies that the optimal capital structure is not sensitive to equity risk premium increases but is sensitive to the decreases. Decision-makers of any firm would utilize this finding in their capital budgeting that if a broad market index such as SP500 is expected to increase and causes the equity risk premium to increase, the firm needs not to make any arrangements to maintain its optimal D/A ratio. In contrast, the opposite movements will signal the need to decline the D/A ratio to maintain the optimal capital structure.
5. Discussion and Conclusions
This work uses Disney Corporation to illustrate the method and reports the sensitivities of four other firms from Dow 30 in Figure 2 to highlight the observed similarities. While all 30 firms from DJIA are studied for this work, only 5 of them are reported to limit the study’s size. Results obtained from the remaining 25 are available upon request from the author. This paper evaluates the impact of levered beta on the firm’s market value and optimal debt-to-equity ratio. It attempts to find answers to the long-debated capital structure question: If a firm’s market risk increases and the firm decides to modify its debt ratio, would the capital structure’s optimality be compromised? In addition, how the market value of the firm will be affected as a result of this?
These are important questions since the textbook approach highlights that when a firm’s beta risk increases, the cost of debt and cost of equity also increase, making leverage modifications more costly and therefore undesirable. This paper shows that this is not correct for the US non-financial firms with extra-strong bond ratings and over $5 billion market cap. Using synthetic rating method in a set of recursive models by simulating the beta risk up and down for 50 percent, we run the model to see what happens to the optimal capital structure and the composite cost of capital for each alternative leverage level and accordingly measured current and optimal WACC sensitivities as the value of beta is altered.
Findings may be summarized as follows: First, for a given debt amount, when the firm’s market risk as measured by beta increases, the WACC increases; however, the min WACC position stays the same, implying there will be no change in the specifics of optimal capital structure. On the contrary, when market risk declines, the WACC declines with the min WACC, implying firms prefer lower leverage with lower market risk. Using Table 2, we see that with the original beta value of 1.04 and the original total debt of $51.93, the Disney Corporation’s optimal capital structure shows a 0.375 debt ratio. When beta is modified from 074 to 1.54 using 0.10 intervals, the optimal debt ratio stayed at 0.375 for the current debt level of $51.93 billion and the simulated debt levels from $11.93 to $91.93 billion. This shows that, for a given debt amount, an increase in the firm’s beta risk has no impact on the firm’s optimal capital structure for a very wide risk region. So, we can conclude that min WACC’s sensitivity is not symmetric around the original beta, and it is more sensitive to the declines than the increase in risk.
Furthermore, the change in debt amount will not alter this result. The result shows that firms like to maintain a conservatively set debt ratio so that if their riskiness changes, they do not need to respond quickly by adjusting their leverages. The observed flat section of the D/A ratios in Figure 1 and Figure 2 is due to the firms’ extra-strong bond ratings that increased leverage and interest expenses will not modify the cost of capital for those firms.
From left to right in Table 2, we observe that min WACC moves to a lower leverage ratio when the total debt increases and the difference between the cost of actual and optimal capital structure declines. The WACC value also declines as the size of debt increases. The opposite is also correct when the total debt declines, moving the firm to a higher leverage ratio. The difference between the cost of actual and optimal capital structure increases. This result implies that firms use the size of the debt to stabilize their positions. As they borrow more, they lower their leverage by raising the equity more than the debt component.
In addition, this paper discloses that the optimal capital structure is not sensitive to equity risk premium increases but is sensitive to the decreases. Decision-makers of any firm would utilize this finding in their capital budgeting that if a broad market index such as SP500 is expected to increase and causes the equity risk premium to increase, the firm needs not to make any arrangements to maintain its optimal D/A ratio while the opposite movements will signal the need to decline the D/A ratio to maintain the optimal capital structure.
Corporate finance literature expects that as firms get riskier, the use of additional debt will raise the cost of debt and equity, moves the firm to a different optimal capital structure, ultimately raising their WACC and lowering their market value. We have shown that WACC will not increase with the risk causing a decline in market value for non-financial US firms with over a $5 billion market cap. In addition, it will not change the optimal capital structure. When the size of debt increases with risk, the firm’s WACC will decrease slightly, as seen in Table 2, raising its market value. The optimal capital structure will not be impacted by those changes for the firms with extra-strong bond ratings making the capital structure is an issue for the firms with lower ratings. As seen in Table 2, the analysis shows that WACC will increase if the firm keeps the debt amount intact as its market risk increases. Table 2 highlights that a firm with an extra-strong bond rating must raise the leverage when its market risk increases and starts to hurt the firm’s market value.
Those findings will help practitioners see the greater picture of the firm on the verge of making financing decisions by highlighting elasticities and other simpler reactions of the variables entering into strategic financing. The results highlighted here help explaining the importance of beta risk in strategic capital structure decisions and its impact on the current D/A ratio and the optimal capital structure.
Possibly, a limitation of this study could be its use of non-financial US firms over $5 billion in market capitalization. A future line of the research may expand this analysis to emerging market firms and smaller and riskier US firms so that additional leverage will have an immediate impact on the cost of capital.
Funding
This research received no external funding. It was supported internally by Ambassador Charles A. Gargano Endowed Chair funds.
Institutional Review Board Statement
Not applicable.
Informed Consent Statement
Not applicable.
Data Availability Statement
Not applicable.
Acknowledgments
The comments of three anonymous referees are greatly appreciated and improved the paper substantially.
Conflicts of Interest
The author declares no conflict of interest.
References
- Barclay, Michael J., and Clifford W. Smith. 2005. The Capital Structure Puzzle: The Evidence Revisited. Journal of Applied Corporate Finance 17: 8–17. [Google Scholar] [CrossRef]
- Bartosova, Viera, and Jaroslav Jaros. 2016. Contribution to the Theory of Capital Structure Optimization. International Journal of Scientific & Engineering Research 7: 717–26. [Google Scholar]
- Fama, Eugene F., and Kenneth R. French. 2002. Testing trade-off and pecking order predictions about dividends and debt. The Review of Financial Studies 15: 1–33. [Google Scholar] [CrossRef]
- Giner, Begona, and Carmelo Reverte. 2001. Valuation Implications of Capital Structure: A Contextual Approach. European Accounting Review 10: 291–314. [Google Scholar] [CrossRef]
- Graham, John R., and Campbell R. Harvey. 2001. The Theory and Practice of Corporate Finance: Evidence from the Field. Journal of Financial Economics 60: 187–243. [Google Scholar] [CrossRef]
- Jaroslav, Jaros, and Viera Bartosova. 2015. To the capital structure choice: Miller and Modigliani model. Procedia Economics and Finance 26: 351–58. [Google Scholar]
- Krüger, Philipp, Augustine Landier, and David Thesmar. 2015. The WACC Fallacy: The Real Effects of Using a Unique Discount Rate. Journal of Finance 70: 1253–85. [Google Scholar]
- Miles, James A., and John R. Ezzell. 1980. The Weighted Average Cost of Capital, Perfect Capital Markets, and Project Life: A Clarification. Journal of Financial and Quantitative Analysis 15: 719–30. [Google Scholar] [CrossRef]
- Miller, Merton H. 1976. Debt and Taxes. The Journal of Finance 32: 261–75. [Google Scholar]
- Miller, Merton H. 1988. The Modigliani-Miller Propositions After Thirty Years. Journal of Economic Perspectives 2: 99–120. [Google Scholar] [CrossRef]
- Modigliani, Franco, and Merton H. Miller. 1958. The Cost of Capital, Corporation Finance, and the Theory of Investment. American Economic Review 48: 261–97. [Google Scholar]
- Modigliani, Franco, and Merton H. Miller. 1963. Corporate Income Taxes and the Cost of Capital: A Correction. American Economic Review 53: 433–43. [Google Scholar]
- Myers, Stewart C. 1977. Determinants of Corporate Borrowing. Journal of Financial Economics 5: 147–75. [Google Scholar] [CrossRef]
- Myers, Stewart C. 1984. The Capital Structure Puzzle. Journal of Finance 39: 575–92. [Google Scholar] [CrossRef]
- Ross, Stephen A. 2005. Capital Structure and the Cost of Capital. Journal of Applied Finance 15: 5–24. [Google Scholar]
- Ross, Stephen A., Randolph Westerfield, and Jeffrey E. Jaffe. 1996. Corporate Finance, 4th ed. Chicago: McGraw-Hill, Inc. [Google Scholar]
- Titman, Sheridan, and Sergey Tsyplakov. 2007. A Dynamic Model of Optimal Capital Structure. Review of Finance 11: 401–51. [Google Scholar] [CrossRef]
- Welch, Ivo. 2004. Capital Structure and Stock Returns. Journal of Political Economy 112: 106–31. [Google Scholar] [CrossRef]


Publisher’s Note: MDPI stays neutral with regard to jurisdictional claims in published maps and institutional affiliations. |
© 2021 by the author. Licensee MDPI, Basel, Switzerland. This article is an open access article distributed under the terms and conditions of the Creative Commons Attribution (CC BY) license (http://creativecommons.org/licenses/by/4.0/).