1. Introduction
One of the key strategic challenges facing any country’s national economy today is the emergence of powerful development points, which are usually advanced industries, innovative technologies, and development of commercial, industrial and social infrastructure, as part of the complex processes of sustainable development and the evolution of the knowledge economy (
Boström et al. 2018). One of such promising industries is the textile industry, whose products, while meeting primary needs, are characterized by continuous growth of the consumer market (due to global population growth processes); the availability and development of technologies aimed at simplifying the technological process and reducing production costs through alternative materials, and numerous opportunities for product differentiation (
de Oliveira Neto et al. 2019). Development is an objective necessity for the enterprise’s long-term operation in modern conditions. The implementation of effective development, its provision and maintenance of high results preconditions the need to address the issue regarding its assessment. The long-term operation of the enterprise involves the assessment of the achieved development level, its drivers’ identification, characterization of the changes caused by it, and assessment of its key determinants impact (
Chofreh et al. 2018). The problem of the theory and methods of assessing the textile enterprises development is primarily to identify the most reasonable methods, criteria, indicators that would most closely reflect the peculiarities of the studied problem.
At the present stage, the importance of the textile industry in many countries is rapidly growing, owing to the intensification of scientific and technological progress, which expands the scope of textiles beyond traditional clothing and household items. In particular, the textile industry is an important factor in the development of other industries, such as chemical, engineering and agriculture, and recently textiles have been increasingly used in space and military technologies (
Franco 2017). The development of the textile enterprise is a controlled process of positive quantitative, qualitative and system-structural changes on the basis of irreversibility, regularity, adaptability to the business environment, high customer loyalty, customer satisfaction in goods and services and focus on building and rational use of its economic potential (
da Silva et al. 2021). Meanwhile, one of the main factors in the development of a textile enterprise is its financial support. On the one hand, it is an integral element (together with logistics, intellectual and personnel, product, information, etc.) and a condition for financing the necessary changes (
Tursunov 2017). On the other hand, the criteria for assessing development is the extent of its formation, rational distribution, efficiency of use and impact on the financial and economic condition of the enterprise (
Samo and Murad 2019). Insufficient or lack of adequate financial support significantly reduces the development potential or totally precludes it. One of the main problems hindering development is the insufficient amount of financial support. Insufficient financial support minimizes opportunities to restore the logistics base, improve the skills of workers, and address social issues and general development (
Van and Nguyen 2019;
Yang and Ha-Brookshire 2019). Meanwhile, this results in an interdependence of sustainable development on the financial security of enterprises (
Ahmad et al. 2020). That is why this study is aimed at assessing the financial security of textile enterprises, as it involves not only the efficient use of the already accumulated part of financial resources, but also the formation of additional sources that help increase productivity and competitiveness of the company. Financial support for the development of textile enterprises has its own peculiarities, based on the specifics of light industry. It is characterized by a significant share of working capital, high mobility of financial assets, attracting short-term credit resources, high share of accounts payable, active marketing programs financing, investment resource orientation to innovation in production and technological process (
Prakash et al. 2020).
One of the most important tasks in the system of financial support for the textile enterprise development is the effective management of formation subsystems and its financial resource utilization. The difficulty of raising funds due to the weak financial and economic condition of enterprises and financial market infrastructure requires the broadest possible differentiation in the sources of raising funds, specifically in such areas as their own financial resources, potential for efficiency enhance, resources of financial infrastructure institutions, financial opportunities for institutional and project integration. At the same time, the allocation and use of financial resources should also be rational and aimed at financing the stable functioning of the enterprise financial system, ensuring the proper course of the current production and technological process, as well as financing investment projects of enterprise development (
Makhsudjonovna and Maxmudova 2019).
An examination of existing developments in the study on measuring enterprise development in general and textiles, in particular, allowed the most widely used methods to be identified: coefficient, integral, expert and cost (
Le and Wang 2017;
Nguyen et al. 2020;
Li et al. 2020). Quite often, these methods involve the use of an evaluation indicators set. An appropriate approach to textile development research is an integrated method that allows overall to assess the dynamic changes in all areas of the textile enterprise (
Panigrahi and Rao 2018;
Ai et al. 2020).
In order to ensure that the system of indicators for assessing the financial security of textile enterprises is genuinely informative and objective, the following general requirements for its construction should be taken into account. The system of indicators should be complete, interconnected and enable verification. The system should avoid duplication and multicollinearity. The system should focus on the most important indicators and ensure unidirectional interpretation of changes in indicators (
Heredia-Mercado et al. 2021). Building an efficient subsystem for the use of financial support for a textile enterprise’s development should focus on ensuring financial self-sufficiency (through funding the stable functioning of the financial system) (
Najafabadi and Mankhi 2020), sustainability (by funding the components of the production process and its resources) (
Wakeford et al. 2017) and development (through funding investment projects for the company) (
Le et al. 2019).
Assessment of the dynamics and their nature regarding the main indicators of the textile enterprises’ productivity allows us to identify quantitative, qualitative and structural changes. They are characterized by irreversibility, regularity and focus on building the capacity of the textile enterprise in meeting consumers needs in goods and services, i.e., the development of these enterprises (
Lucato et al. 2017). The main methods of financial support or funding are: self-financing, lending and through the budget (state, external, non-repayable) financing (
Fraczek 2020).
The approach in which the light industry enterprise will pursue quite an aggressive and offensive policy of its own gradual expansion into the sales market is rather promising in today’s conditions for business environment development of textile companies. Such a strategy provides for the successive thresholds passage: (1) ensuring full funding of current financial and economic activities; (2) increasing the real cost of assets and expanding working capital; (3) improving the efficient use and formation of a rational capital structure; (4) increasing productivity and market coverage; (5) investment and innovative business development; (6) diversification and development of related economic activities. The criterion for the fulfilment of the defined components of the financial support implementation for the textile enterprise’s development is the achievement of specific financial and economic objectives at each stage of its financial strategy implementation (
Gardas et al. 2018;
Jabłońska et al. 2020).
One of the main obstacles to a textile enterprise’s development is their insufficient funding. Therefore, textile enterprises should monitor the adequacy of financial resources in order to ensure development, sufficiency of their own resources and the effectiveness of their own financial management (
Ceptureanu et al. 2018). Furthermore, based on generalizations of theoretical positions and the applied research of modern scientists, it can be argued that the elimination of negative trends and ensuring effective and structurally balanced textile enterprises development objectively requires improving the management system through their financial and economic activities. The aforementioned modern research is focused on certain narrow financial issues of companies or aimed to form a broad indicator system for a detailed assessment of the financial efficiency of the business. However, the relationship between financial support and both the performance and the enterprise development as a key determinant of its future success remains insufficiently studied. This study is aimed to fill the aforementioned gap in science by developing a methodological approach to assess the funding level and determine its impact on the level of textile enterprises development. This study aims to determine the mutual impact of financial security on the level of textile enterprises development. Achieving the defined goal involves the model formation that contains partial integrated indicators of the level of financial security and the company’s development and enables the diagnostics and comparison of the companies considering the state of capital structure, current financing and their financial efficiency. Therefore, the scientific contribution of this study consists in a methodical approach to assessing the financial security level in the context of enterprise development and identification of factors to improve its efficiency.
The logic of the conducted study involves the following steps:
- -
conducting business-diagnostics of the development level of the studied enterprises and determining the integrated indicators of capital structure, current financing and financial efficiency;
- -
formation of a financial security reference model;
- -
determination of an integrated indicator of financial support for the studied textile enterprise’s development and separation of this indicator for a group of companies;
- -
determination of the deviation from the standard according to the integrated indicator of financial support for the textile enterprise’s development;
- -
formation of regression development models of the studied companies taking into consideration separate integral indicators of financial maintenance.
2. Materials and Methods
This study proposes a methodological approach based on the formation of an integrated indicator of financial security and its regression model. It is intended to define an integrated indicator as the general output resulting from the given research according to the business diagnostics indicators of financial support of the textile enterprises development. This study involves several steps.
Step 1—forming a sample of enterprises. The study was conducted based on materials from 16 textile enterprises in the European Union. The main criteria for selecting companies was the number of employees, 50 to 250 people, and annual sales revenue, 10 to 50 million euro. Due to the agreement with the top management not to disclose special information about the company, the names of the studied companies are encrypted (A, B, C, etc.).
Step 2—conducting rapid diagnostics of the surveyed companies financial support and determining its integrated indicator. To this end, rapid diagnostics was carried out on the following indicators:
- -
capital structure: the autonomy ratio (), the ratio of borrowed and own funds (), the ratio of long-term financial independence (), the short-term debt ratio ();
- -
current financing: the ratio of own circulating capital (), the quick liquidity ratio (), the ratio of own capital flexibility (), the ratio of receivables and payables ();
- -
financial efficiency: the financial stability ratio (), the business insurance ratio (), return on equity (), return on capital ().
The integrated indicator is the result of a comprehensive economic assessment. Comprehensive economic assessment forms a characteristic due to simultaneous and coordinated study of a parameters set that reflect all or most change and development aspects of economic phenomena and processes. It contains general conclusions on the results of the research object. The objectives of complex economic assessment are to define an integrated parameter by aggregating different methods of quantitative and qualitative analysis. Integral assessment enables us to combine in one indicator many factors of different name, units, weight and other characteristics (
Melnychenko 2020). This simplifies the business diagnostics process of financial support for the textile enterprise’s development, and is a reliable option for its implementation and granting the objective final conclusions.
In this study, in general terms, the justification of the integrated indicator is carried out according to the following formula:
—integrated indicator of the capital structure of textile enterprises;
—integrated indicator of current financing of textile enterprises;
—an integrated indicator of the financial efficiency of textile enterprises;
n—the number of indicator groups.
For its part, the integrated indicators of capital structure, current financing and financial efficiency were determined by the logical function of Harrington E.C. (
Volodymyr and Chernova 2017).
where
n is the number of indicators used to diagnose each component of financial support for the textile enterprises development;
exp—the accepted value of the exponent;
di–partial function determined in accordance to the Harrington scale for capital structure indicators, current financing and financial efficiency;
—the value of the i-th indicator of capital structure, current financing and financial efficiency in a standardized form, which are calculated by the following formulas:
where
—the standardized value of capital structure indicators, current financing and financial efficiency;
—arithmetic mean of all levels of individual components indicators of financial support for the textile enterprises development;
—standard deviation (standard error) of separate indicators components of financial support for enterprise development.
- (b)
for destimulators:
In this study, it is proposed to define the integrated indicator of the textile enterprise development as the sum of the products of each average value of the studied development indicator and its significance:
where
—an integrated indicator of the textile enterprises development;
vi—the weight of the i-th development indicator;
ki—is the average value of the
i-th development indicator determined by using the geometric mean, i.e., by the following formula:
where
kj—partial characteristics of the studied economic phenomenon,
j is the number of partial characteristics varying from 1 to
n.
Step 3—assessment of the overall level of the surveyed companies financial support. A scale of values of the general integrated indicator (
) was developed in order to determine the specific state of financial support for the textile enterprises development, which is given in
Table 1.
Using the proposed evaluation scale of the integrated indicator of financial support for textile enterprises’ development, this study finally established a business diagnosis based on the location of the surveyed enterprises at the level of certain financial support for their development.
Step 4—assessment of the development level of the studied enterprises on the basis of its integrated indicator. To assess the development level of textile enterprises and the impact of financial support on its level, taking into account the number of studied indicators, it was decided to conduct such a research for typical representatives of each surveyed enterprises group with the results being disseminated to the whole group of enterprises. In order to identify the typical representatives of each group among the existing statistical methods used in economic research, the distance method has been prioritized. The essence of this method is to compare the indicators of the studied enterprises with the indicators of the reference object (
Gawin and Marcinkowski 2017).
That is, by comparing the values of integrated indicators with a reasonable reference indicator of financial security, we identified enterprises that in each group are its typical representatives at the level of financial security.
The definition of an integral enterprise development indicator was carried out on the basis of the key indicators for 2015–2019, using a formula equivalent to the financial security indicator measurement:
—turnover, —net profit; —average salary; —property value; —fixed assets value; —labor productivity; —R&D intensity; —share of investment in innovation in total turnovers; —share of investments in innovations in total costs. The higher this indicator, the higher the development level of the company.
Step 5—assessment of the relation between the level of financial security and development of the studied companies based on the regression model formation. This study has formed econometric models by using the method of correlation and regression analysis in order to establish the relationship between the studied phenomena (financial support and textile enterprises development). Correlation-regression analysis is a set of mathematical methods used to investigate and generalize the correlatively related variables. In particular, this study addresses two main problems due to the methods of correlation-regression analysis: first, finding a general pattern that characterizes the dependence of two correlatively related variables, i.e., the development of a mathematical connection model; second, determining the closeness of the connection.
The scheme of the correlation-regression model construction includes the following stages:
- (1)
problem statement;
- (2)
selection of the most significant factors for analysis;
- (3)
establishing the relationship between the studied features and its density;
- (4)
determining the nature of the relationship, its direction and form, the selection of a mathematical equation to express existing relations;
- (5)
calculation of numerical model characteristics;
- (6)
statistical assessment of the significance of sample communication indicators.
For a single-factor regression model, correlation analysis enables quantification of the relationship closeness between the indicator and the factor. The existence and quantitative characteristics of the relationship between the feature and the factor is determined by the correlation coefficient. Wherein the regression analysis has three components: logical analysis, graphical analysis and determination of the theoretical regression line equation, i.e., the establishment of a functional relationship between the indicator and factors. In the logical analysis of empirical data of economic indicators and factor values, some assumptions can be made on the presence and direction of the relationship between the feature and the factor.
At the stage of graphical analysis, the numerical values of factor (x) (in our study it is the value of the financial security integrated indicator; current financing; capital structure; financial efficiency) are plotted on the abscissa axis, and the value of indicator (y) (in our study it is the value of integral indicator of the textile enterprise development), on the ordinate axis. The points on the graph corresponding to each pair of values xi and yi form a correlation field.
The nature of the points location shows the direction and form of relation. By connecting the points on the plane in sequence, we obtained an empirical regression line. Its shape can determine the type of theoretical regression line. The shape of the curve is detected and the formula of the equation corresponding to this curve is chosen based on the graphical data analysis.
The choice of the mathematical dependence form, i.e., the equation, is very responsible in econometric analysis, since the quality of models, i.e., their compliance with real processes, is determined not only by a set of input values reflecting production factors and conditions, but also by the chosen form of relation.
The least squares method was used to find the regression line in this study. The essence of the least squares method is to find such a theoretical regression line, which is closest to the empirical regression line in comparison with others, i.e., gives the smallest sum of squares of the actual values deviations of the resultant feature from the calculated (theoretical) values:
—empirical (initial) indicator data; —theoretical (calculated by the regression equation) indicator data.
The least squares method has a significant advantage over others known methods for finding the direct regression, if the deviation forms a normal distribution. This is one of the prerequisites for determining the probabilistic estimates of the simulation results. In practice, the studied aggregations of variables are generally well distributed or reasonably close to normal distribution laws.
In order to use a regression equation outside the area defined by the actual data it must be properly justified. The main cause of errors is the form of relation that is linear within this area and may be nonlinear outside it. Therefore, the use of the linear regression equation for statistical analysis and forecasting requires special justification.
In particular, for linear pair regression:
where
—the resulting variable;
—parameters of the regression equation;
—factor variable;
—random variable, the application of the least squares method requires the following hypotheses to be fulfilled (
Wu et al. 2019):
There is a linear relation between the resulting variable
and the factor variable
which is described by regression equations:
The factor variable x is a deterministic (non-random) quantity.
The mathematical expectation (mean) of a random vector
is equal to zero and the variance is small constant positive value that is independent of the index, i.e.,:
The vector components are uncorrelated random variables, i.e., for each .
It is often assumed that a random variable has a normal distribution law with zero mathematical expectation and a constant positive small variance
In this case, model (11) is called the classical normal linear regression model.
The linear correlation coefficient R enables determination of the correlation density between the indicator and the factor at a pair linear relationships.
The correlation coefficient can take values from −1 to +1. The sign indicates the direction of relation: “+” straight, “−” inverted.
—There is a linear functional relationship between x and y, i.e., one value of the factor x corresponds to a single value of the indicator y.
—There is no connection between x and y.
The correlation density estimation in stochastic dependence was determined on the basis of the Chaddock in
Table 2 (
Luchko et al. 2020).
The statistical significance of the econometric model (or the model adequacy to the original data) in this study was assessed using Fisher’s
F-test, which is based on the value of the determination ratio R
2:
is taken from the table of critical values of Fisher’s F-distribution at probability (or significance level ), degrees of freedom , where is the number of observations, is the number of factors that affect the indicator.
If , then we can reliably assume that the considered mathematical model is adequate to the original data.
If , then we can reliably assume that the considered mathematical model is inadequate to the original data.
This study examines the impact of the integrated financial security indicator () and individual integrated financial security indicators () on the integrated indicator of the studied textile enterprises development. Meanwhile, the corresponding pair regression equations of the dependence of the integrated development indicator on the integrated financial security indicator () and individual integrated financial security indicators () are constructed. The research results obtained were processed using statistical methods with the aid of built-in MicrosoftExcel functions.
All econometric regression models are calculated with a probability of p = 0.95. For each model, the adequacy of its empirical data was analyzed on the basis of Fisher’s F-test values, the correlation coefficient was calculated, and its statistical significance was estimated using t-statistics, and the determination coefficient was calculated.
In order to achieve the defined goal of the study, the following hypotheses have been developed:
Hypothesis 1 (H1). Financial support has a significant impact on the level of textile enterprises development.
Hypothesis 2 (H2). The capital structure has a significant impact on the level of textile enterprises development.
Hypothesis 3 (H3). Current funding has a significant impact on the level of textile enterprises development.
Hypothesis 4 (H4). Financial efficiency has a significant impact on the level of textile enterprises development.
3. Results
Based on the calculations, the adjusted values of the main indicators of the conducted business diagnostics of financial support are determined. The results obtained are given in
Table 3. The diagnostics was carried out on the following indicators: capital structure: the autonomy ratio (
), the ratio of borrowed and own funds (
), the ratio of long-term financial independence (
), the short-term debt ratio (
); current financing: the ratio of own circulating capital (
), the quick liquidity ratio (
), the ratio of own capital flexibility (
), the ratio of receivables and payables (
); financial efficiency: the financial stability ratio (
), the business insurance ratio (
), return on equity (
), return on capital (
).
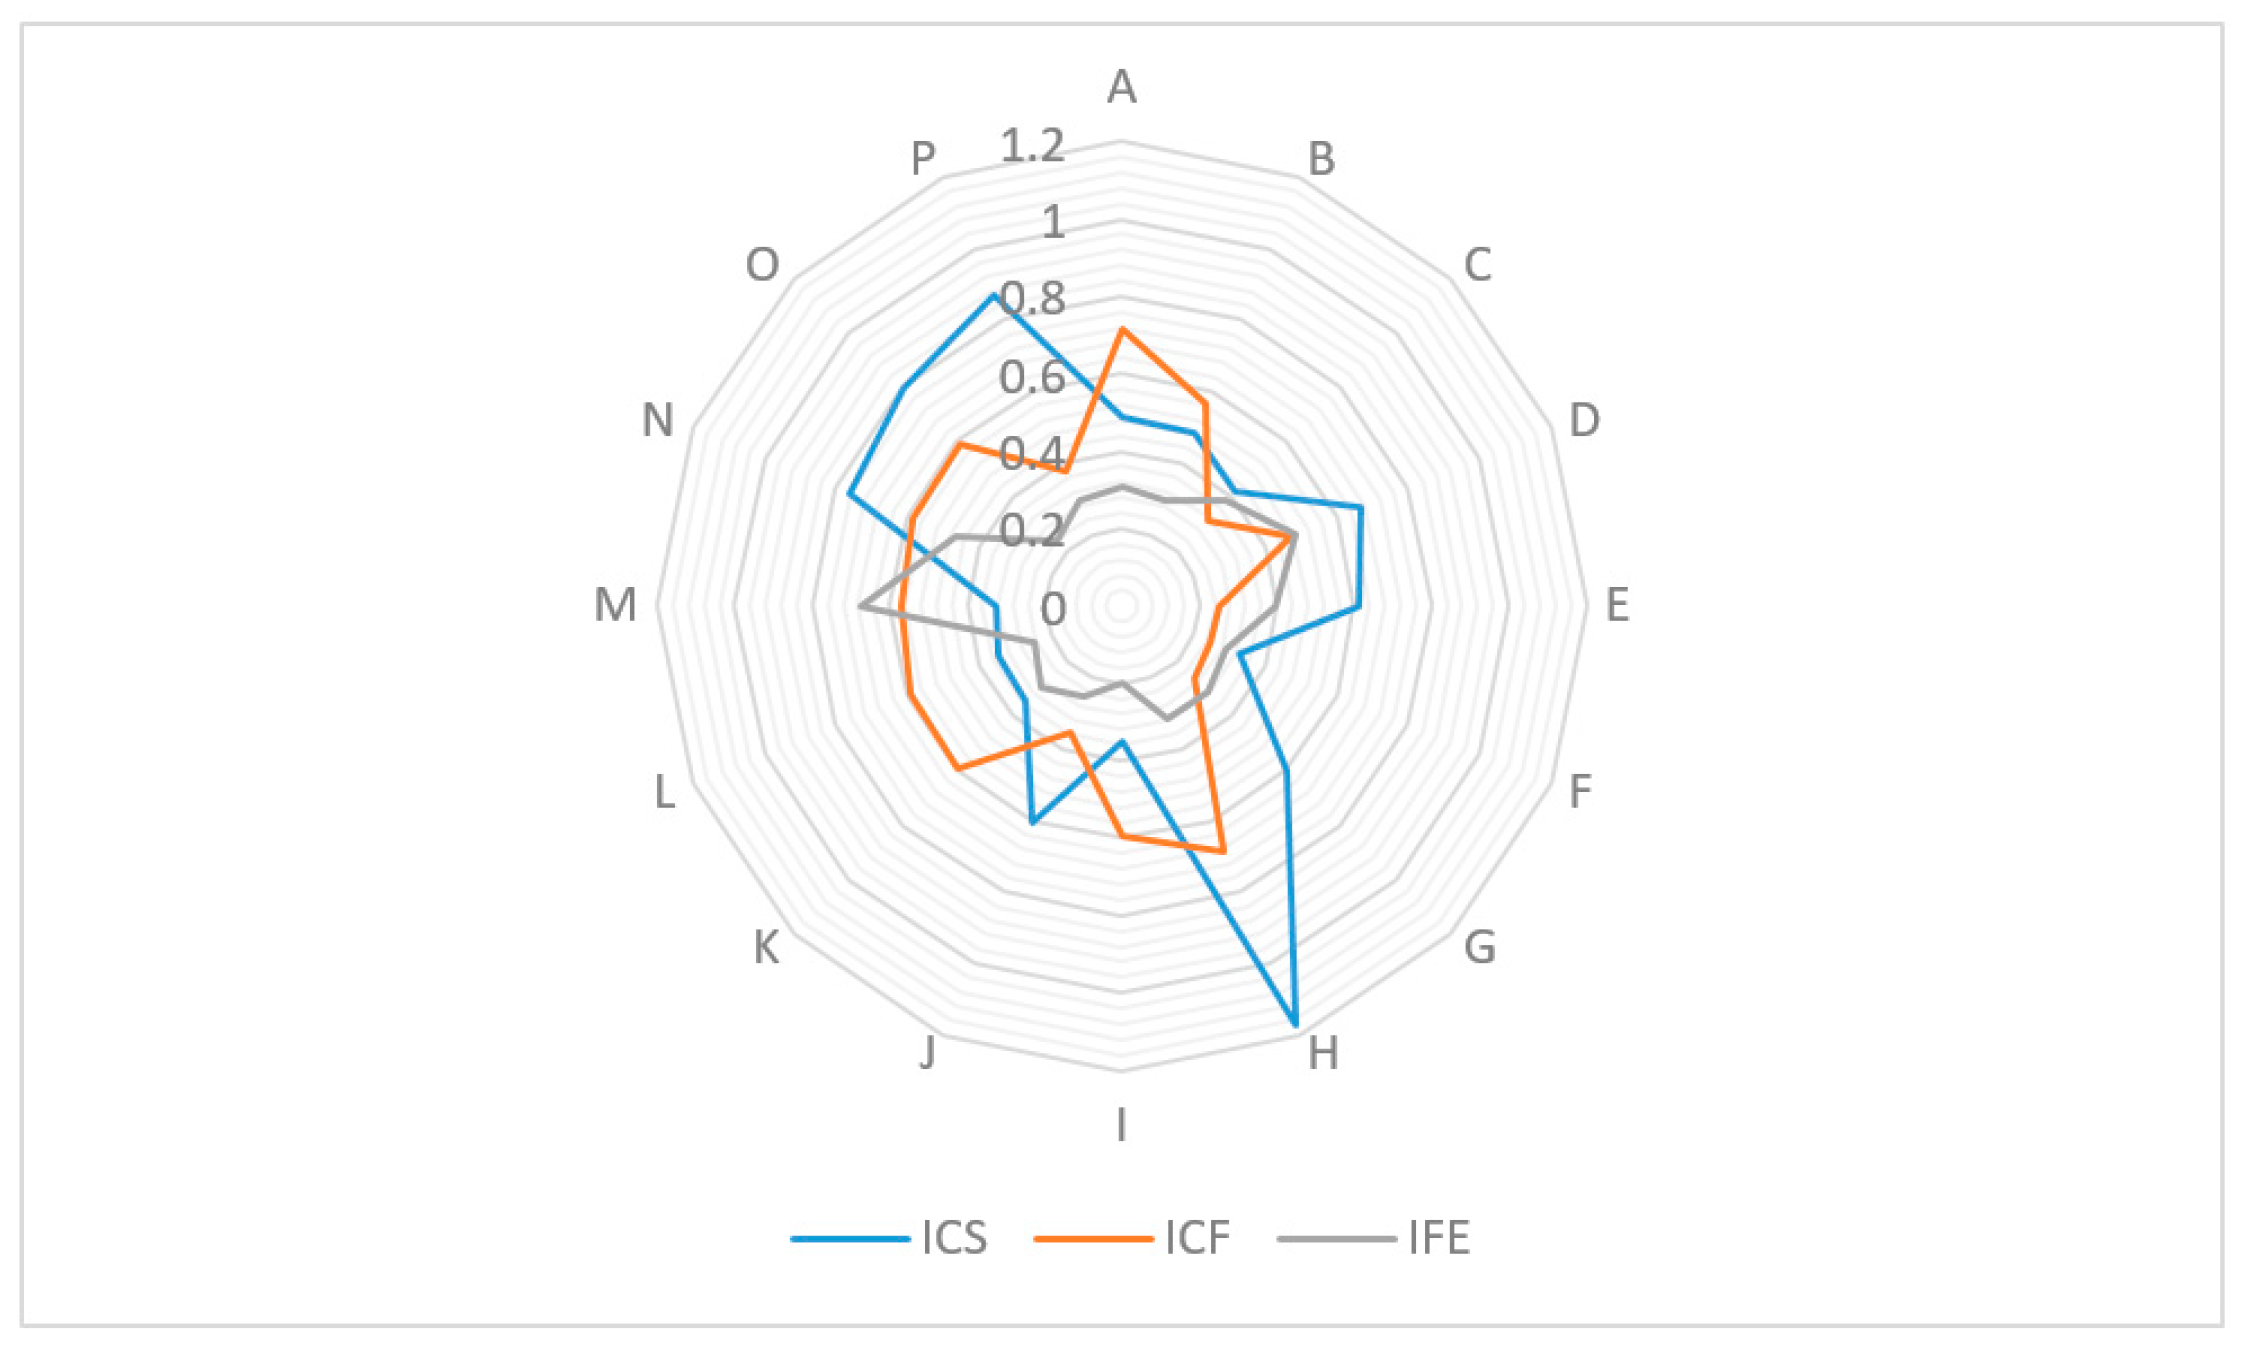
On the basis of the formed indicators system the integrated indicators of separate components of financial support for the textile enterprises development have been defined:
—capital structure,
—current financing,
—financial efficiency (
Figure 1).
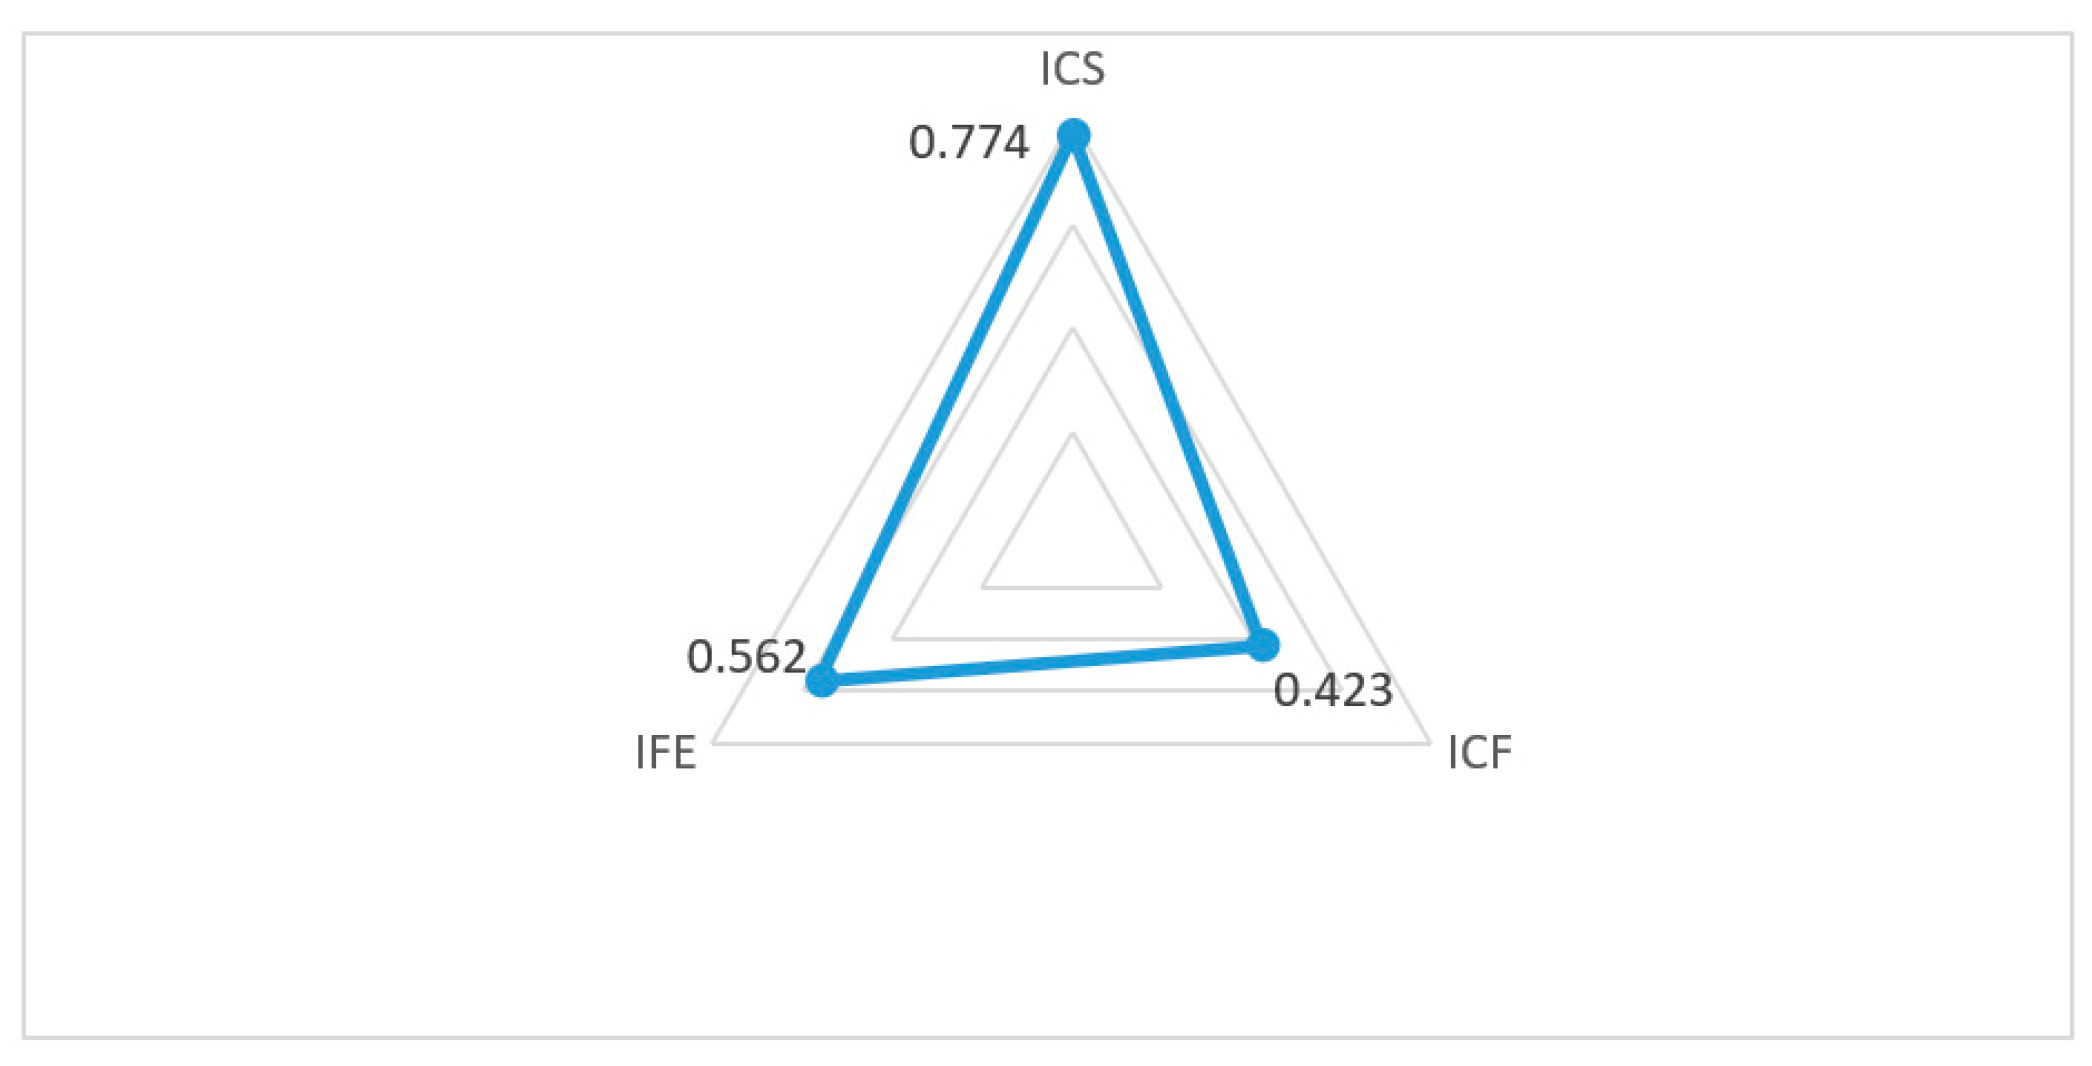
A reference financial security model was formed based on the calculations which reflects the transformed, according to a sound methodology, optimal values of integrated indicators of capital structure, current financing and efficiency (
Figure 2).
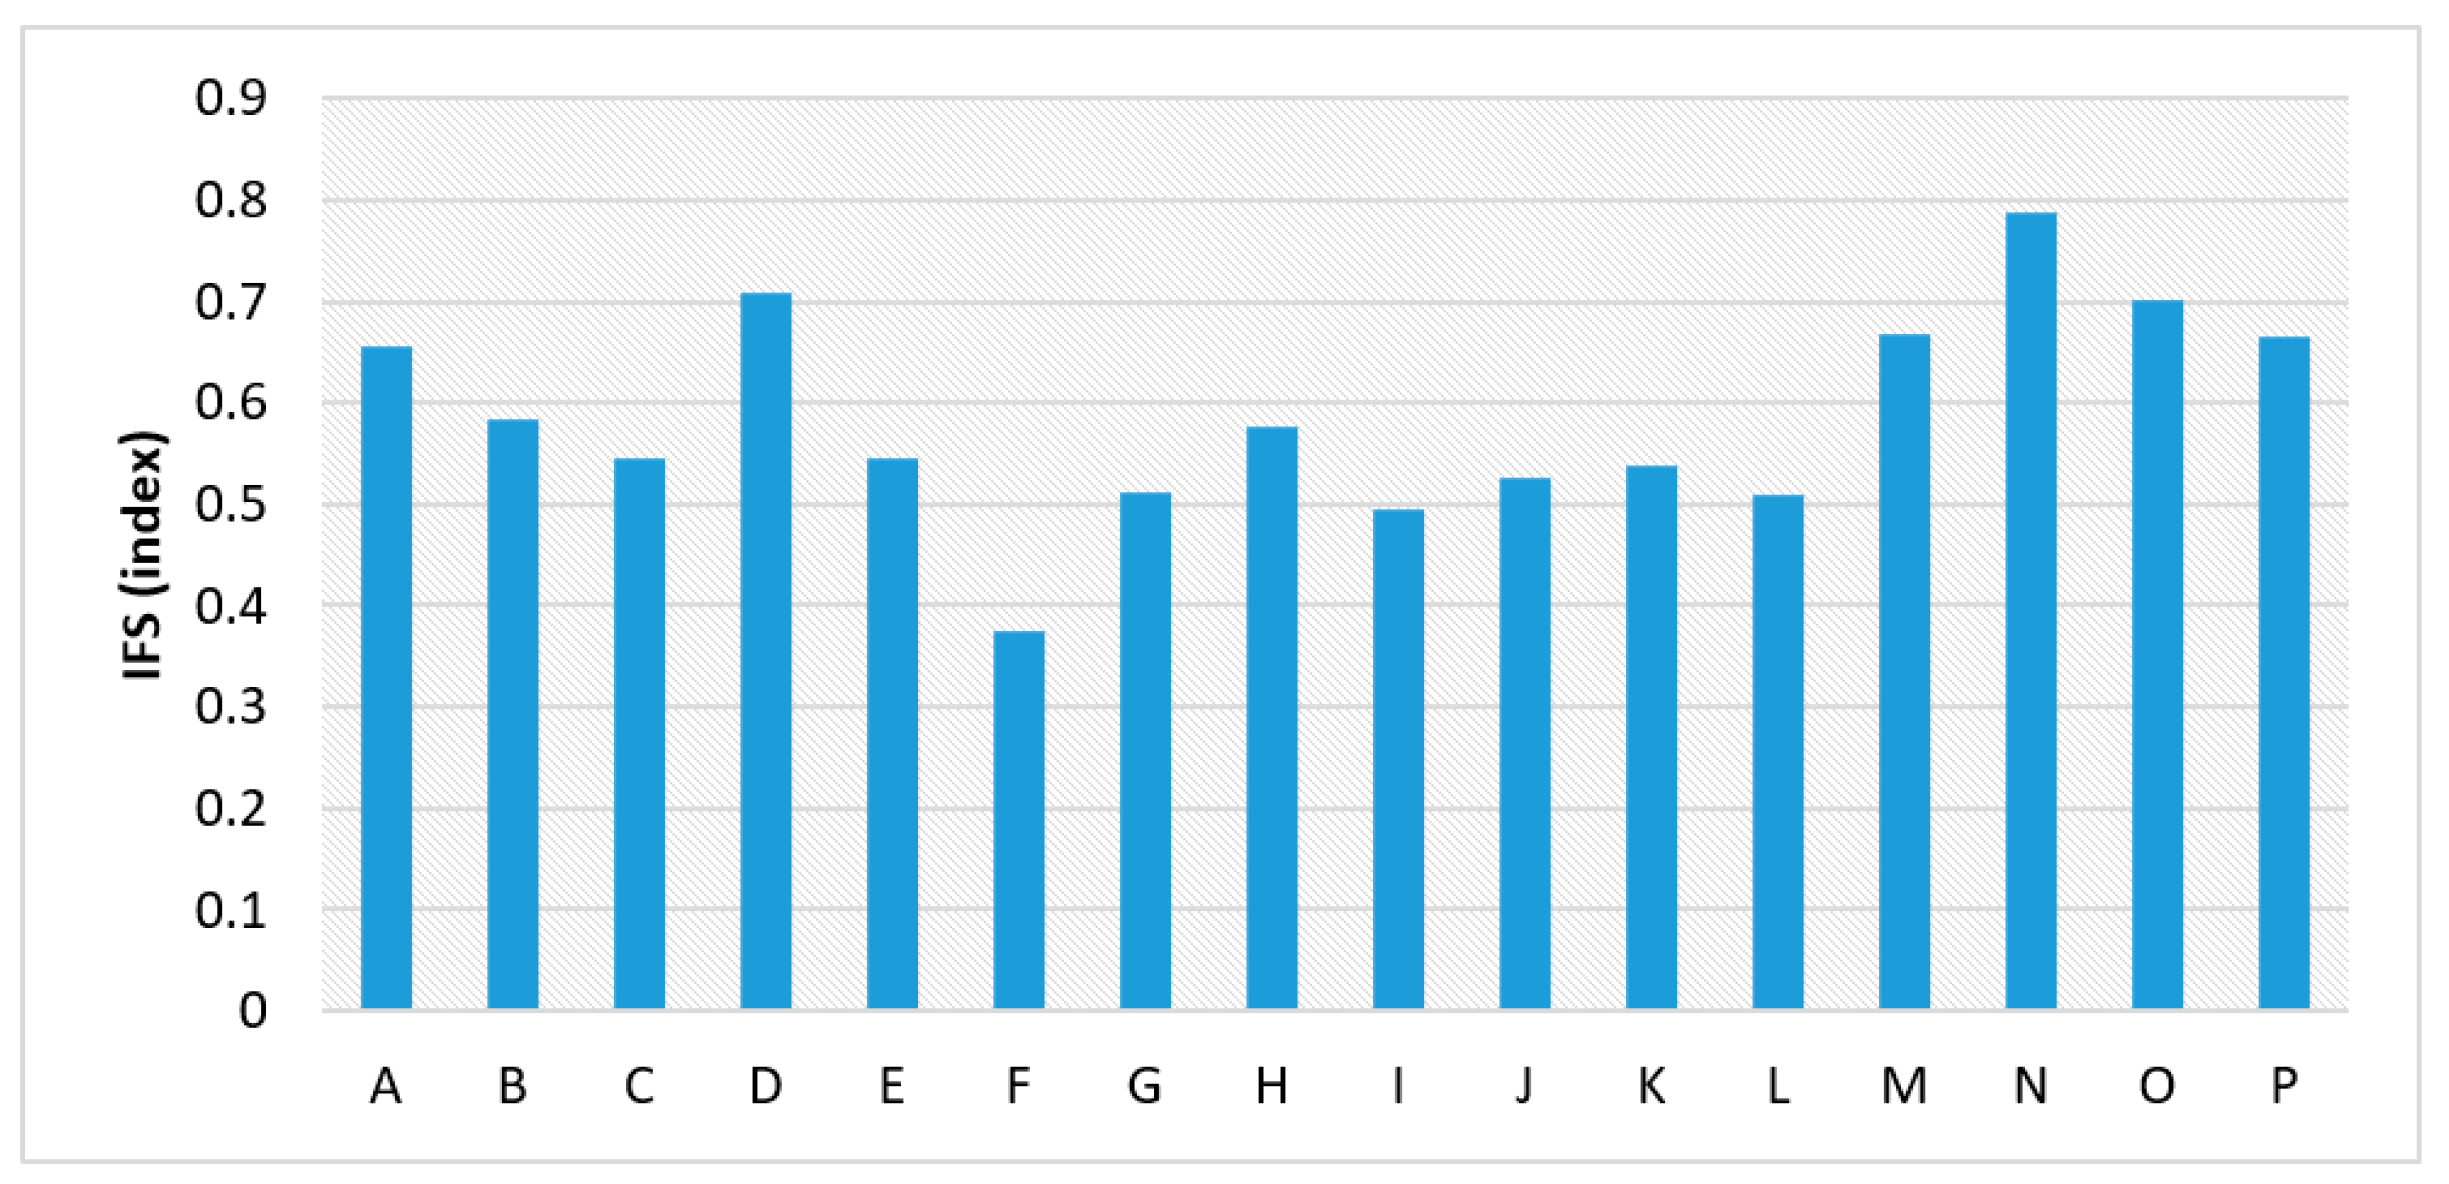
The definition of partial integrated indicators has made it possible to establish an integrated indicator of financial support for the development of the studied textile enterprises. Integral indicators of financial support for the textile enterprises development are shown in
Figure 3.
Scheme 4 groups of textile enterprises were singled out (
Table 4).
Therefore, it was defined that the financial support for the development of such textile enterprises as: N, D, O, M, P and A in 2019 was normal; B and H was acceptable; it was low in C, E, K, G, J, L, I; and crisis in the F textile enterprise.
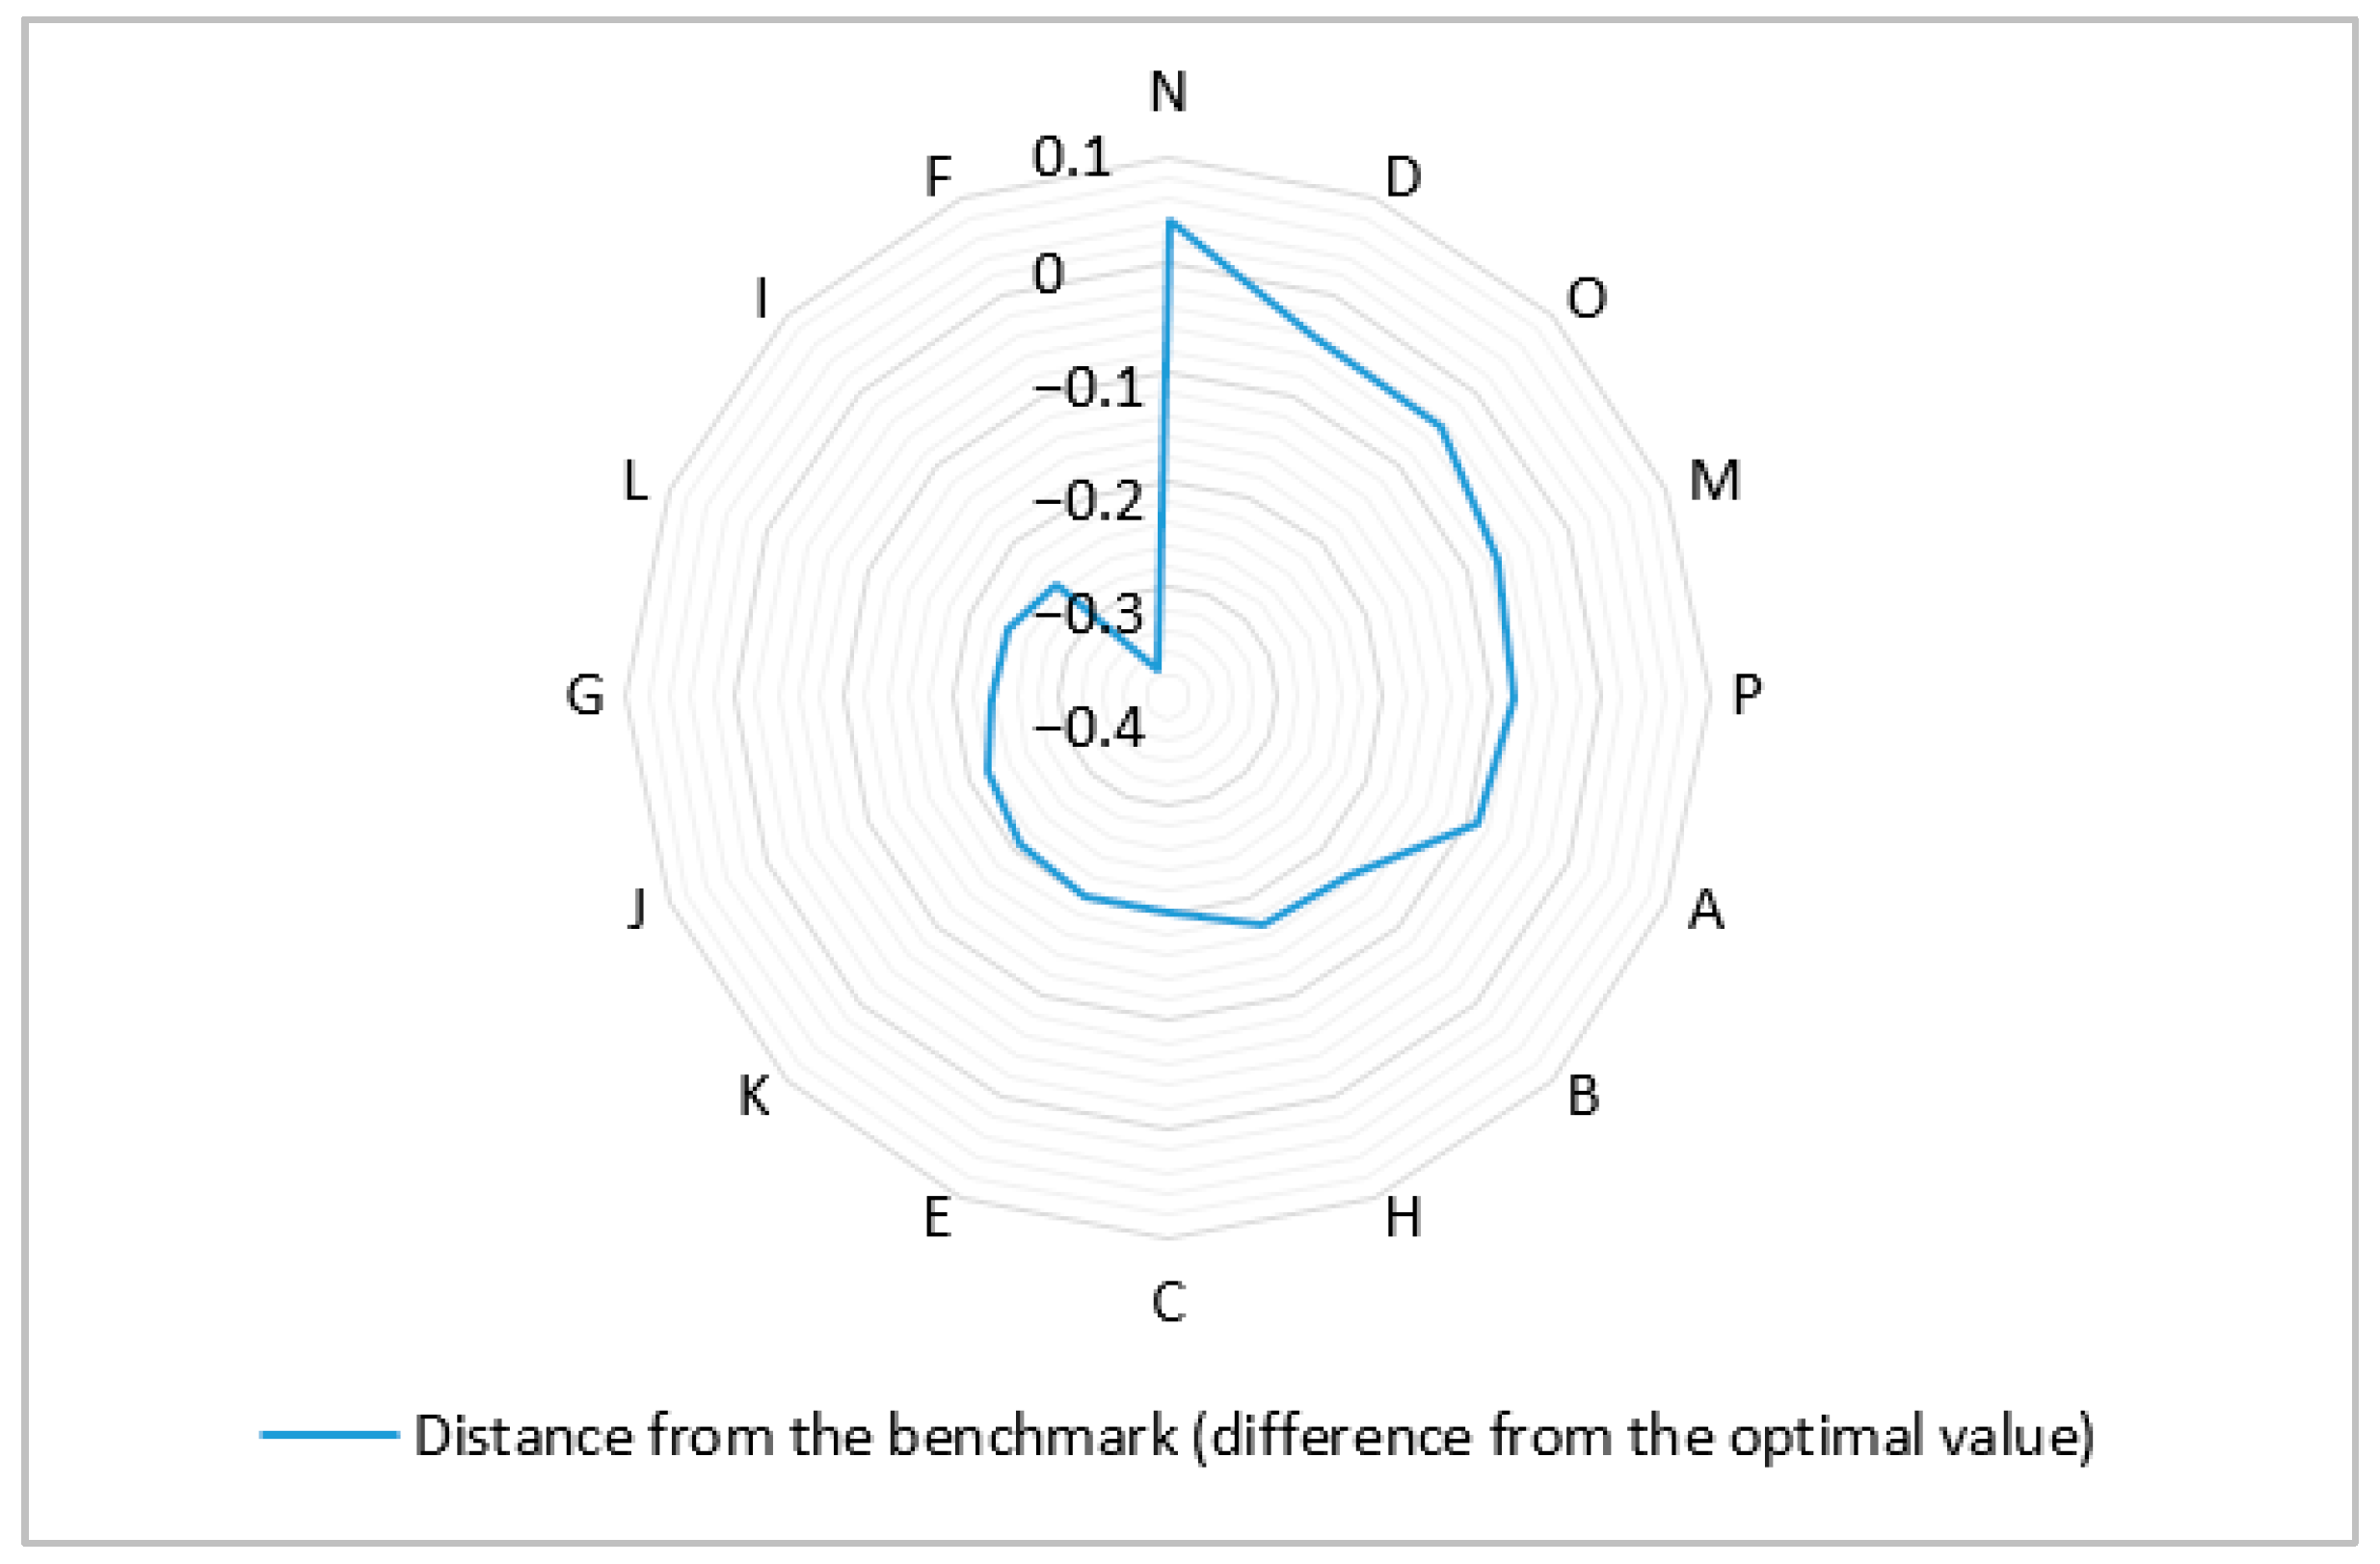
By comparing the values of integrated indicators with a reasonable reference indicator of financial security, companies, that in each group at the financial security level are typical representatives of their group, have been identified (
Figure 4).
The results of the calculations provided for information for the study on the impact of financial support on the textile enterprises development. According to the proposed methodological approach, the growth rates of the main development indicators are determined and groups of enterprises are formed. The average change rates of the main development indicators of these textile enterprises in 2015–2019 have been determined. On that basis, the study on the textile enterprises development adjusted the average rate of change in the textiles development, taking into account predetermined basic indicators. Therefore, the integrated indicators of textile enterprises development for different groups for the period 2015–2019 have been determined. The results of the calculations with the obtained values interpretation are combined in
Table 5.
Therefore, it is determined that the group of companies with normal financial development support during the analysed period sufficiently increased. Slow development, which can lead to stagnation, was observed in a group of companies with acceptable financial development support. Stagnation is characteristic of a group of companies with low financial security and development of the main economic activity indicators, i.e., stagnation enterprises representing a group of companies with crisis financial development security. The calculation results are the basis for management decisions of both short- and long-term nature to ensure the development of these textile enterprises.
Since one of the main efficiency factors is financial support, it is advisable to analyse point by point its impact on the textile enterprises development. In order to establish the connection between the studied phenomena (financial support and textile enterprises development) it was decided to form an econometric model using the method of correlation and regression analysis. The formed models proposed the following variables:
x0–an integral indicator of the textile enterprises development (IDI);
x1—integrated indicator of financial security (IFS);
x2—a separate integrated indicator of financial security–capital structure (ICS);
x3—a separate integrated indicator of financial security–current financing (ICF);
x4—a separate integrated indicator of financial security–financial efficiency (IFE). The simulation results and their econometric interpretation are given in
Table 6.
The simulation results and their econometric interpretation are given in
Table 7.
Regression equation describing the dependence of the development level on the integrated indicator of financial security. In particular, b0 = 0.73 does not make economic sense, and the regression coefficient b1 = 3.03 shows that with an increase in the integrated indicator of financial security by 1 the integrated development indicator is expected to grow by an average of 3.03. The value of the even correlation coefficient R = 0.95 indicates a quite close internal correlation and the relation between these indicators. The coefficient of determination R2 = 0.91 indicates that the change in the mean value of the integrated development indicator by 91% depends on the change in the mean value of the integrated financial security indicator, and by 9% on other factors that were not taken into consideration in this model. Comparing the actual value of the t-criterion with the tabular tcrit = 2.15, it can be argued that the correlation coefficient for this model is statistically significant with a p = 0.95 probability. Comparing the actual F-criterion value with the tabular Ftable = 4.6, it can be argued that the generated regression model is adequate output to the original data with a p = 0.95 probability. Therefore, hypothesis H1 can be considered acceptable as the relationship between the development level and financial security of textile enterprises has been confirmed.
The regression equation describes the dependence of the development level on the integrated capital structure (ICS) indicator. In particular, b0 = 0.37 does not make economic sense, and the regression coefficient b1 = 1.25 shows that with an increase in the ICS by 1 the integrated development indicator is expected to grow by an average of 1.25. The value of the pair correlation coefficient R = 0.92 indicates a fairly close internal correlation and the relation between these indicators. The determination coefficient R2 = 0.85 indicates that the change in the mean value of the integrated development indicator by 85% depends on the change in the mean value of the individual integrated financial security indicator (ICS) by 15% on other factors that were not taken into consideration in this model. Comparing the actual t-criterion value with the tabular tcrit = 2.15, it can be argued that the correlation coefficient for the third group of enterprises model is statistically significant with a probability of p = 0.95. Comparing the actual F-criterion value with the tabular Ftable = 4.6, it can be argued that this regression model is adequate to the original data with a probability of p = 0.95. Therefore, hypothesis H2 can be considered acceptable as the relationship between the development level and capital structure of the textile company has been confirmed.
In particular, b0 = 0.37 does not make economic sense, and the regression coefficient b1 = 1.5 shows that when the integrated current financing (ICF) indicator increases by 1 the integrated development indicator is expected to grow by an average of 1.5. The value of the pair correlation coefficient R = 0.87 indicates a high correlation and the relation between these indicators. The coefficient of determination R2 = 0.76 indicates that the change in the mean value of the integrated development indicator by 76% depends on the change in the mean value of the individual ICF, and by 24% on other factors that were not taken into consideration in this model. Comparing the actual t-criterion value with the tabular tcrit = 2.15, it can be argued that the correlation coefficient for this model is statistically significant with a probability of p = 0.95. Comparing the actual F-criterion value with the tabular Ftable = 4.6, it can be argued that the regression model is adequate to the original data with a probability of p = 0.95. Therefore, hypothesis H3 can be considered acceptable as the relationship between the development level and current financing of the textile enterprise has been confirmed.
Regression equation is describing the dependence of the development level on the integrated financial efficiency (IFE) indicator. In particular, b0 = 0.61 does not make economic sense, and the regression coefficient b1 = 1.29 shows that with an increase in the IFE by 1 the integrated development indicator is expected to grow by an average of 1.29. The value of the pair correlation coefficient R = 0.47 indicates a noticeable correlation between these indicators. The coefficient of determination R2 = 0.22 indicates that the change in the mean value of the integrated development indicator depends only on 22% on the change in the mean value of the integrated IFE, and 78% on other factors that were not taken into consideration in this model. Comparing the actual t-criterion value with the tabular tcrit = 2.15, it can be argued that the correlation coefficient for the model is not statistically presumable with a probability of p = 0.95. Comparing the actual F-criterion value with the tabular Ftable = 4.6, it can be argued that the regression model is not adequate to the original data with a probability of p = 0.95. Hypothesis H4 cannot be accepted, as there is no significant relationship between the development level and financial efficiency of the textile company. Financial efficiency affects only 22% of the textile enterprises; development. This is due to the fact that it includes both financial and managerial aspects, which need to be examined in more detail among the general set of factors in the textile enterprises development.
To comprehensively assess the relation between the textile companies’ development and their financial support, a multiple regression model was formed. The authors suggest in it the following variables:
x0—integrated indicator of the textile enterprises development (IDI);
x1—ICS;
x2—ICF;
x3—IFE. We have excluded the integrated financial assurance (IFS) indicator from the list of variables, as ICS, ICF and IFE are its components and correlate with this indicator. The simulation results and their econometric interpretation are given in
Table 7.
The conducted dispersion analysis confirms the low level of significance of IFE in the formed model. This results in a negation of its applicability, as
p-value for IFE is 0.29 (0.29 > 0.05). The low correlation level is also confirmed by the other benchmarks for this factor, therefore, it should be excluded for a multiple regression model development. The figures obtained by exclusion of the IFE factor are listed in the
Table 8 and
Table 9.
The final results of the simulation confirm that a regression equation can be applied, as follows:
The results obtained confirm the steady level of development relation with capital structure and flow financing, both in autonomous and integrated treatment, since P-value for variables is less than 0.05. This regression model is applicable based on such control points: R2 = 0.95, Ftable < F (3.81 < 135.18), tobs = 16.44 exceeds tcrit = 2.16. Thus, in order to improve the development level, textile industries should develop the financial support of the process, concentrating on capital formation and improving the efficiency of flow financing.
4. Discussion
Based on the proposed methodological approach, it has been determined that in order to assess the financial support for the textile enterprises development, it is advisable to use rapid diagnostics, given the specific study object. This allows us to rely not only on the partial indicators definition, but also to form their complex taking into account the peculiarities of the enterprise operation (
Kumar and Harris 2020). This enables the integrated indicator to be determined. Such diagnostics allows us to promptly and fully determine the quality of financial security, its sufficiency, structure, efficiency, which is the basis for strategic and tactical management of textile enterprises (
Kwilinski 2019;
Drobyazko et al. 2020).
A significant advantage of this study is the use of econometric models obtained by stepwise regression analysis. It shows the significant impact of the integrated financial security indicator and individual integrated financial security indicators (ICS and ICF) on the integrated development indicator of the studied textile enterprises. Meanwhile, a weak impact on the integrated development indicator of a separate integrated financial security indicator (IFE) was revealed. This proves that the textile enterprises development strongly depends on their financial support in general (
Zwolak 2017). In particular, the capital structure and the predominance of equity in it, as well as current financing significantly affect the textile enterprises’ development. The formation of a rational capital structure will enable effective implementation of the investment process, cash flows control, and obtaining a comprehensive assessment of the financial security state in the dynamics. A rationally formed capital structure under the conditions of effective cash flow management will enable the implementation of any strategy of financial support for the textile companies’ operation and development (
Mugo et al. 2019;
Heredia-Mercado et al. 2021). The proposed methodological approach can be an essential tool for forming the company’s top management policy in order to meet the needs of the internal and external business stakeholders, particularly to expand the range of raw material suppliers, re-equip or modernize production and increase staff performance, fund the corporate and social responsibility and attract new investors in order to increase the intensity of R&D, to create financial benefits for the founders and partners, and most importantly to form the financial potential for the introduction of sustainable technologies that are valuable for consumers in production (
Samo and Murad 2019;
Makhsudjonovna and Maxmudova 2019).
This study can be supplemented by an expert method evaluation. Then the formation of an overall assessment of the relationship between the textile industry development and financial security will be both a quantitative and a qualitative characterization of all aspects. An important role is played by the quality of financial development management (
Melnychenko 2020). Therefore, it may be possible to consider the financial support management for the textile enterprises’ development, primarily from the perspective of process approach. This management approach allows executives to identify and administer key processes, that can be implemented mainly through the planning, organization, coordination, motivation and control functions (
Wakeford et al. 2017).
The use in this study of the distance from the standard reference for the integrated financial support indicator for the textile enterprises development indicates that the organization in the financial management system should be directed towards the implementation of financial support plans for the research enterprises development (
Goswami 2019).
The results of the study confirm the hypothesis that adequate financial support stimulates the textile enterprises development (
Ali et al. 2019). This will enable short- and long-term policy formation for textile enterprises financial management focused on ensuring their development.
The methodical recommendations formed by carrying out express diagnostics of financial support for the textile enterprises development provide an opportunity to determine the state of financial support for the studied enterprises with simultaneous optimal value establishment of an integrated indicator (
Radaelli 2020). This enables the actual values comparison and establishment of conclusions, “diagnosis” of the studied object’s condition. In order to conduct rapid diagnostics based on the results of economic and financial textile enterprises activities, first of all, the main indicators of financial support have been determined. The proposed methodological approach allows us to establish the presence and closeness of the relationship between financial security and development, the state of financial security and its impact on textile enterprises development.
Despite the methodological advantages of this study, financial support for the textile enterprises development should be planned using modern and advanced information processing software (
Weqar and Haque 2020). This can optimize the process of planning financial support in the textile enterprises’ management system, which depends on its proper implementation. However, the financial planning development can be long- and short-term. At the same time, its strategic and tactical financial support plans should be formed focusing on the priorities and horizons of textile enterprises development.
The limitation of this study is that despite the effective management, high-quality and stable functioning of the financial support system for the textile enterprises development requires identification and full utilization of internal institutional financial infrastructure (
Csikosova et al. 2019). It is formed by the subjects of the enterprise financial policy, its internal institutional and legal and regulatory framework and methodological support, formal and informal rules of corporate behaviour in the financial sector. Therefore, further research can deepen towards the institutionalization of financial infrastructure and integration of its elements’ potential for textile enterprises. This will improve the preconditions for the formation and effective functioning of the financial support system for the textile enterprises development.
The study conducted may be of some interest to those who implement the enterprises’ financial strategy and make justified management decisions, as well as to experts, scientists who study the features of financial support for textile enterprises, drafting models of their development.
5. Conclusions
On the basis of the conducted express diagnostics for the purpose of a condition estimation of financial support for the textile enterprises in this research integral indicators on separate components have been defined. This enabled assessment of the capital structure, the current financing sufficiency and the financial efficiency of textile enterprises. The determined integrated indicator of financial support for the textile enterprises development allowed its condition to be defined, namely the normal, acceptable, low and crisis levels. This provided an opportunity to assess the state of financial support for the studied textile companies’ development. A rapid diagnostic of the light industry financial situation was carried out using the proposed methodological approach. The integrated values obtained are in the range, which gives grounds to assert that there is sufficient capacity of individual enterprises to further develop and effectively use their financial support. Meanwhile, a group of companies with crisis financial support for development has been identified.
The financial support model proposed in this study, formed by means of partial integrated indicators, enables visual comparison, benchmarking of the capital structure state, current financing and financial efficiency of the surveyed enterprises with the optimal value. An essential scientific achievement of this study is the formation of a methodological approach that provides an opportunity to assess the financial support level for enterprise development based on both sources of funding and the structural content of the company’s capital. In particular, the absence of significant impact of financial efficiency on the level of textile companies’ development was identified. The main reason for this is the specifics of their operation, namely the focus on production activities. Meanwhile, it is confirmed that financial security is the starting point of progressive changes in the field of material production, which creates the necessary conditions for textile companies’ economic growth.
The correlation-regression analysis between the integrated financial security indicators and the integrated development indicator became the basis for confirming the hypothesis of the financial security impact on the textile enterprises development. It is established that textile enterprises’ development largely depends on their financial support in general. The change in the mean value of the integrated development indicator by 85% depends on the change in the mean value of the integrated financial security indicator. In particular, the capital structure and the predominance of equity in it, as well as current financing significantly affect the textile enterprises development by 90% and 77%, respectively. The considered factors of financial efficiency influence only 36% of the textile enterprises development. This is due to the significant impact of both financial and management aspects. Thus, a significant level of influence of the financial situation on the analysed textile enterprises development based on the correlation-regression analysis results has been identified and confirmed. The relationship is directly proportional and strong both between the integrated financial security indicator and the integrated development coefficient (regression coefficient was 0.89) and between the integral values of individual financial security components and the coefficient of textile enterprises development (corresponding regression coefficients were: for current financing—0.87, for the capital structure—0.79, for the financial efficiency—0.86). This proves the need to develop the financial management system of textile enterprises in order to improve the factors and prerequisites for their development.
The use of the proposed methodological approach in enterprises can assist politicians in identifying target areas in order to achieve strategic intentions for the development of the industry at the national or regional level and to promote foreign investment in industrial development. Increasing the development level of textile companies can facilitate additional job creation, ensuring effective integration of manufacturers, brands and designers with foreign partners. Stable financial support for the textile companies’ production will enable more flexibility of supply chains, respectively, the price and speed of response will become more competitive, which will expand the export market. The development of textile enterprises based on the principles of sustainability and green technologies must also be supported by appropriate financial support. This, for its part, will not only create value for consumers, but also improve their standard of living.
In the long run, further research can deepen the institutionalization of financial infrastructure and integration of its elements’ potential for textile enterprises. This will improve the preconditions for the formation and effective functioning of the financial support system for the textile enterprises development.
The study conducted may be of some interest to those who implement the enterprises’ financial strategy and make justified management decisions, as well as to experts, scientists who study the features of financial support for textile enterprises, drafting models of their development.


