Article

An Analysis of the Effects of Public Investment on Labor Demand through the Channel of Economic Growth with a Focus on Socio-Professional Categories and Gender

by
Mame Cheikh Anta Sall
1 and
Adriana Burlea-Schiopoiu
2,*
1
Faculty of Economics, University Cheikh Anta DIOP de Dakar, Dakar 10700, Senegal
2
Faculty of Economics and Business Administration, University of Craiova, 200585 Craiova, Romania
*
Author to whom correspondence should be addressed.
J. Risk Financial Manag. 2021, 14(12), 580; https://doi.org/10.3390/jrfm14120580
Submission received: 11 October 2021 / Revised: 26 November 2021 / Accepted: 27 November 2021 / Published: 2 December 2021
(This article belongs to the Special Issue Financial Development and Economic Growth)

Abstract

:
The paper aims to analyze the impact of public investments generated by implementing the Emerging Senegal Plan (ESP) on economic growth and gender inequalities observed in the labor market in Senegal. A dynamic computable general equilibrium modeling was carried out for this purpose using a social accounting matrix (SAM) based on an extensive segmentation of the labor market according to gender and socio-professional category. The results prove that the investments made in priority market sectors led, overall, to a good trajectory of economic growth. Moreover, job creation followed the expansion of sectors of the economy, which increased their demand for labor because of the capital increase. In conclusion, there is a strong demand for qualified women (senior executives and middle executives). We recommend considering positive discrimination in favor of women by implementing public employment programs and the importance of recovery sectors affected by the pandemic.

1. Introduction

Since its independence in 1960, the Senegalese economy has always experienced erratic growth. It has known five significant phases of development:
(1)
The period 1960–1983 was marked by irregular growth.
(2)
1983–1994 is a period that corresponds to the exclusive recourse to internal adjustment, characterized by an investment deficit and a loss of growth and competitiveness.
(3)
The post-devaluation decade (1995–2005) was marked by the pursuit of reforms and the acceleration of growth.
(4)
The period 2005–2013 was characterized by a slowdown in economic growth.
(5)
The period after 2013 was characterized by an improvement and stability of growth.
Senegal has many advantages, including strong democratic stability likely to attract foreign direct investments (FDI), a geographical location allowing privileged access to European and American markets, significant diversification of its economic tissue; however, the country’s economic performance is often fragile compared to the overall trend of sub-Saharan African countries (Chetboun 2015).
The Senegalese economy is confronted with structural problems that fundamentally influence its growth model: the inefficiency of public spending, difficulties in the energy sector, an unfavorable business climate, and insufficient and unproductive private investment. In this regard, the country has often relied on public investment to drive growth.
Since February 2014, public decision makers have implemented a new economic development strategy, the Emerging Senegal Plan (ESP), the medium- and long-term economic policy benchmark. Senegal’s ambition through the ESP is to promote economic growth with a substantial impact on human development and, by extension, the country’s emergence by 2035. Three axes have been identified to implement the ESP: the structural transformation of the economy and growth; human capital, social protection, and development; and governance, institutions, peace, and security (République du Sénégal 2014).
The ESP implementation is reflected in the trend of economic growth that has become relatively strong. The ESP has enabled Senegal to record one of the strongest economic growths in West Africa, with an increase from 4.5% in 2014 to 6.8% in 2018 (Banque Mondiale 2019). Today, Senegal is placed among the most dynamic economies in the sub-region.
This trend is, partly, the result of the credit of fiscal policy because, in Senegal, fiscal policy is the main instrument available to the authorities in the implementation of socio-economic policies, due to membership in the monetary zone, whose monetary policy is entrusted to the Central Bank of West African States (CBWAS). The share of public investment in public expenditure increased since 2000, rising from 31% in 2001 to 35.7% in 2006 and 40.4% in 2016 (DPEE 2018).
However, despite the good economic growth trajectory noted in recent years, Senegal remains characterized by strong inequalities between men and women, as evidenced by the country’s gender inequality index, which is 0.698 (according to the (World Economic Forum 2015): 1 = Perfect equality between men and women; 0 = Total inequality between the two groups).
Notable disparities also distinguish the Senegalese labor market between men and women. According to Senegalese statistics (DPEE 2018), the unemployment rate is estimated at 15.5%. The gender analysis reveals that unemployment affects women more (26%) than men (7.4%).
The rate of underemployment related to working time is 26.8%, and it is higher for women (39.3%) than for men (19.9%).
The Senegalese labor market is also characterized by the high vulnerability of the jobs held. Thus, only 38.4% of the active population have a job, and this is made up of 72.5% men and 27.5% women. The low employment rate is mainly due to the predominance of the informal sector, where 93% of the employees are women.
These gender inequalities observed in the labor market raise severe socio-economic problems because the participation of women in the labor market allows them to emancipate themselves, to have autonomy and social status (Anne et al. 2018). In addition, access to employment allows women to access income-generating activities that generally influence the standard of living of their offspring and, therefore, of future generations. However, the women often face difficulties in accessing decent work, and when they do, they tend to earn lower wages than men (FMI 2019).
Starting from the relationship that could exist between public investment, growth, and the labor market, we determined to find the answer to the following question:
What is the impact of public investments in implementing the ESP on economic growth and gender inequalities in terms of the profile of jobs created on the labor market?
The main objective was to analyze the impact of public investments generated by the implementation of the ESP on economic growth and gender inequalities manifested in the Senegalese labor market. We started from the hypothesis that the ESP investments have made it possible to relaunch economic growth but have widened gender inequalities in the labor market, increasing the supply of employment, which is more favorable to women. To achieve this objective, we constructed a computable general equilibrium model (CGEM) based on the basic model of PEP-T, developed by Decaluwe et al. (2013).
This research is relevant because, to our knowledge, there is not yet any work on Senegal regarding the triple relationship between public investment, economic growth, and the labor market as it relates to men–women segmentation. Our research makes it possible to fill this gap in the literature and offers the decision makers the opportunity to consider implementing public policies in the consolidation of the economic growth process and the fight against inequalities between men and women.

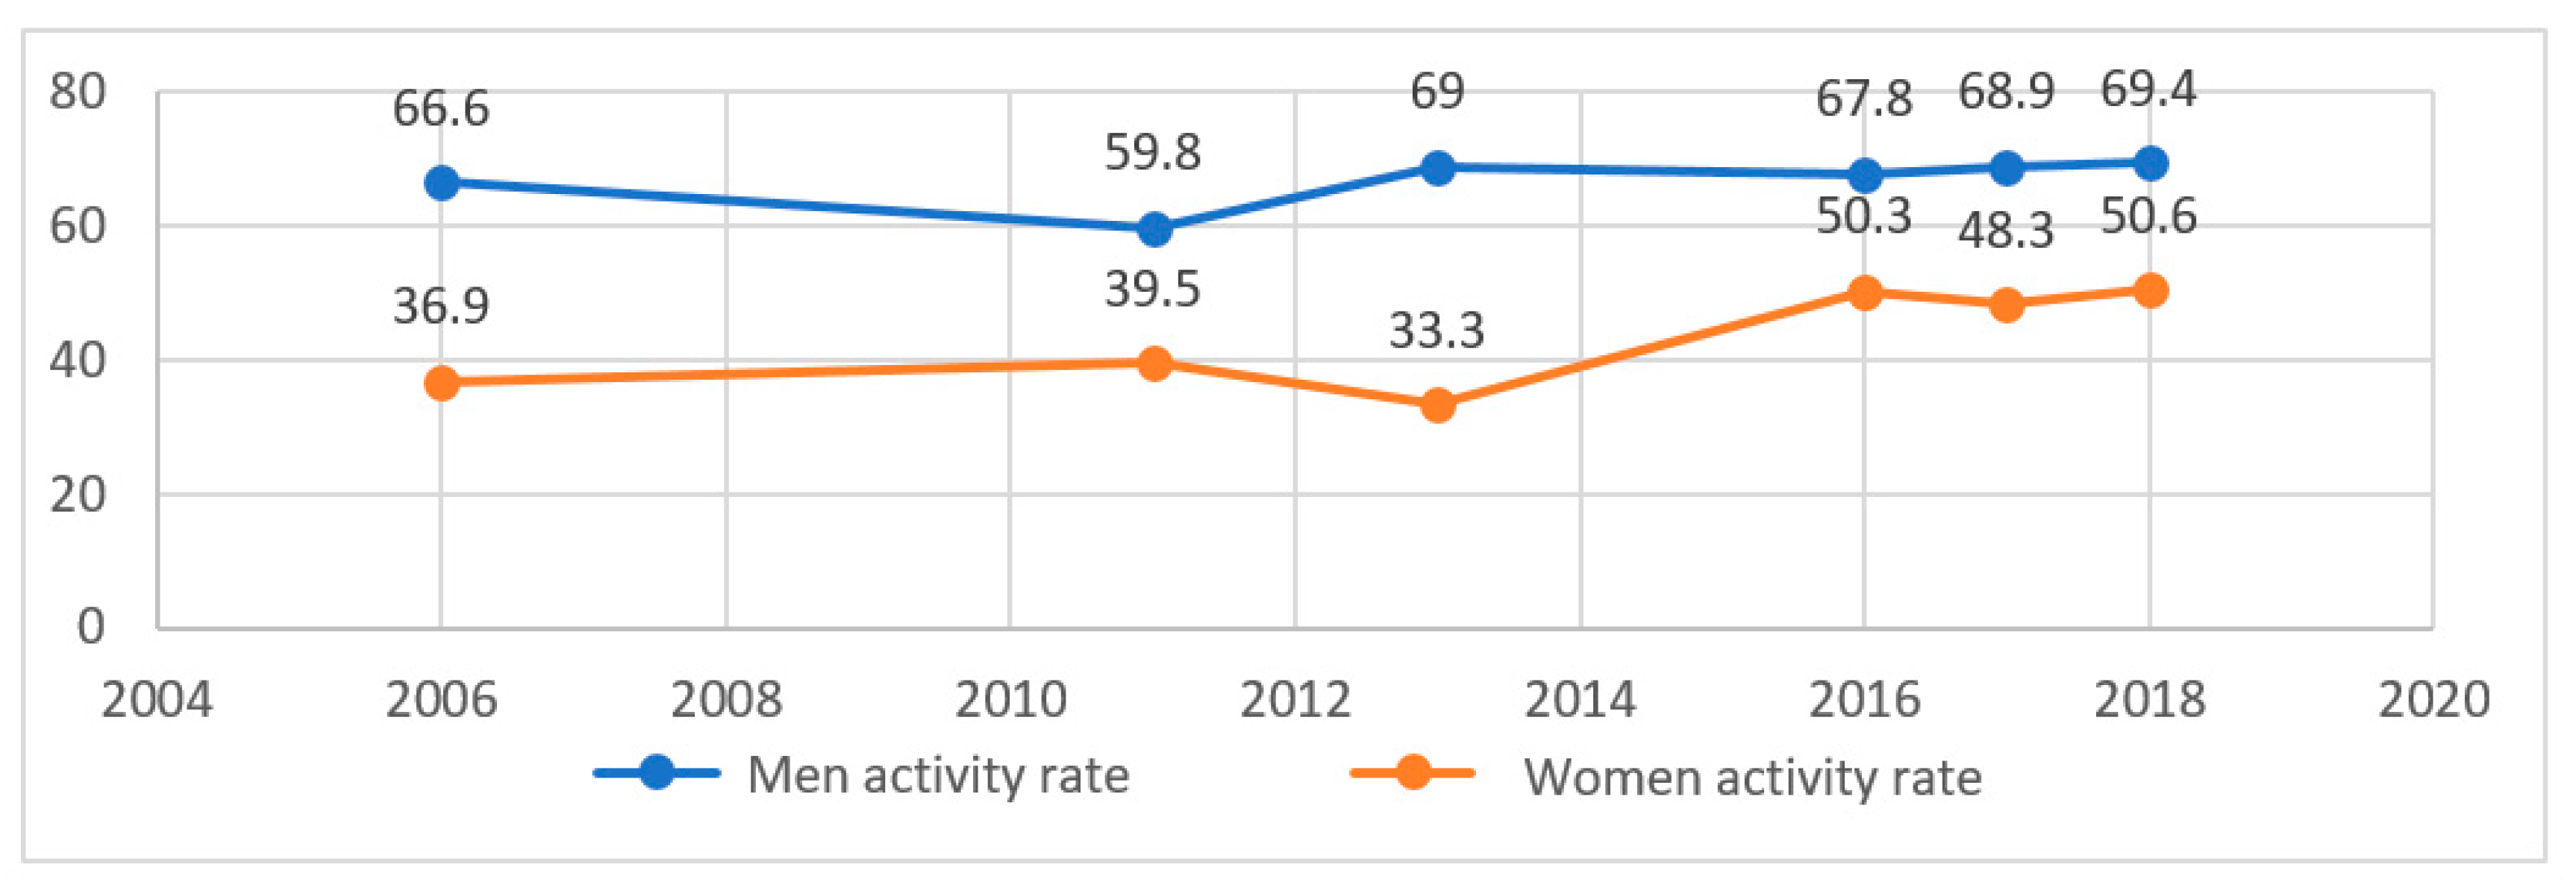
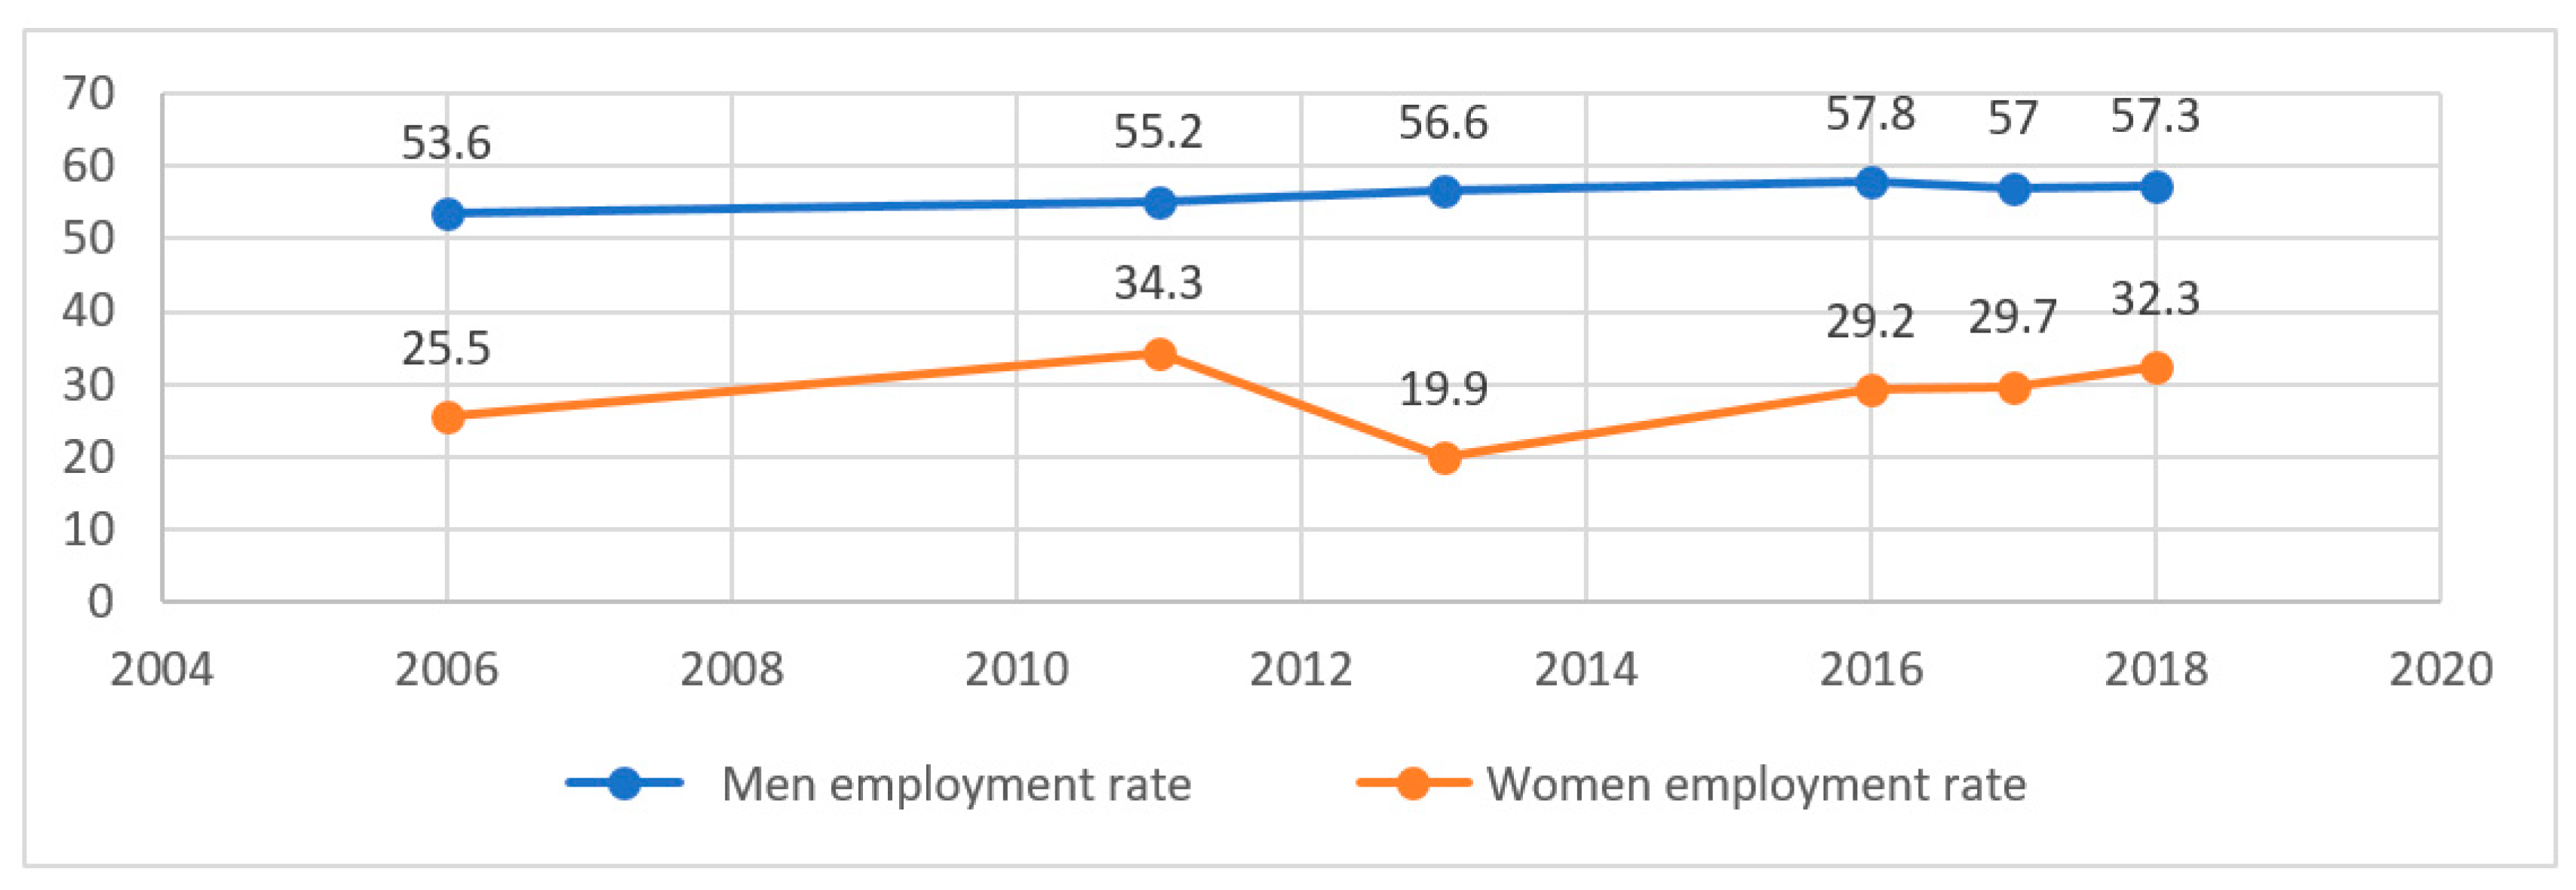
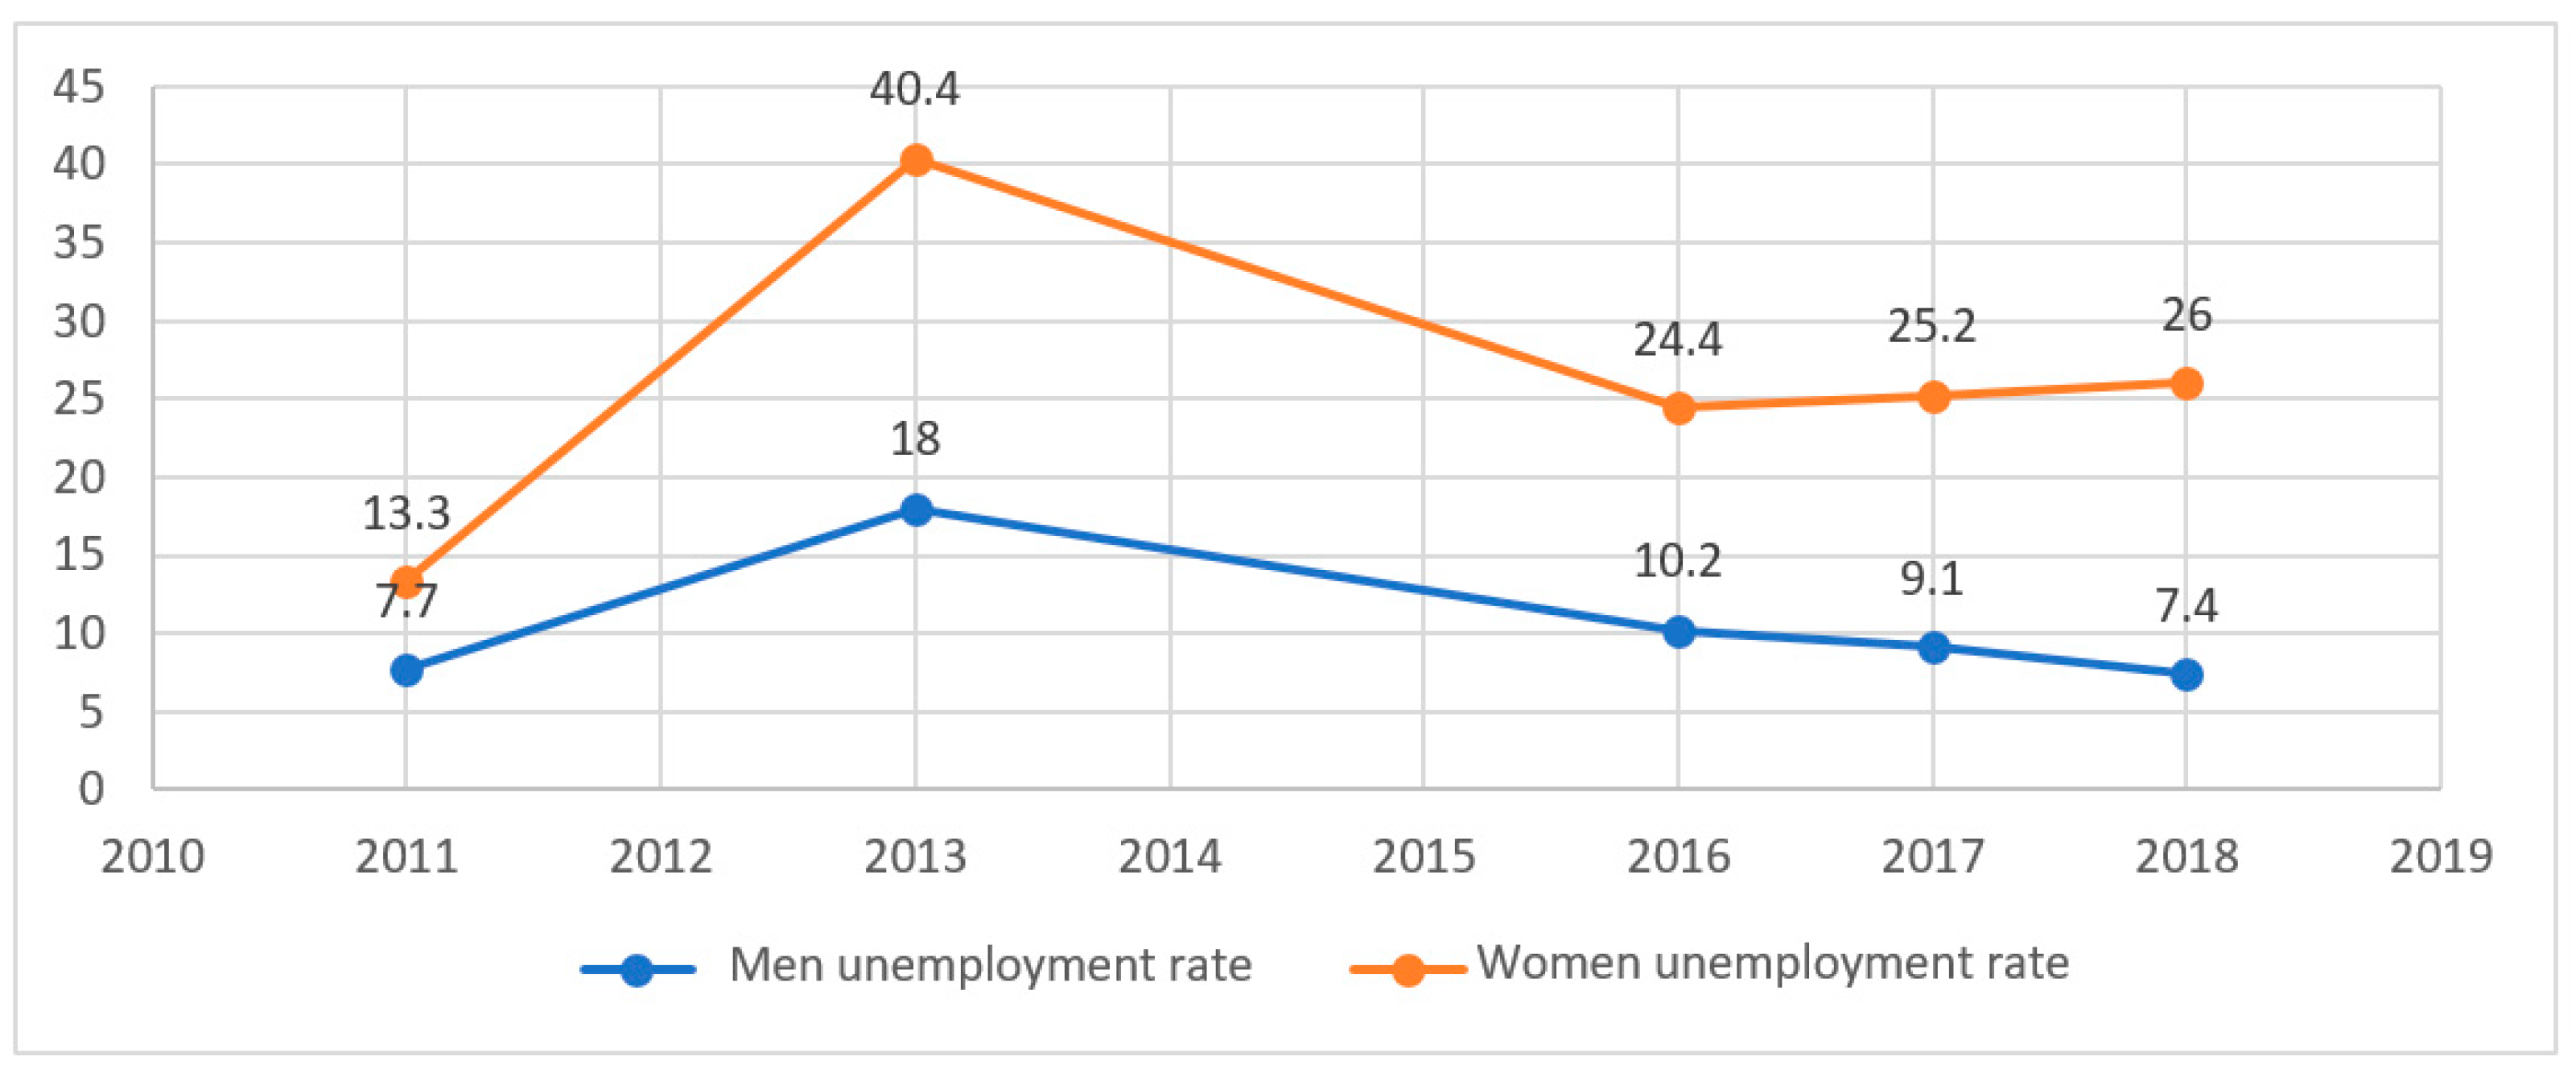
2. Brief Presentation of the Senegalese Labor Market According to Gender Disparities

Notable gender disparities characterize the Senegalese labor market due to men’s and women’s relatively different job opportunities (Sall 2018). These disparities are reflected in the analysis of activity rates, employment rates, and unemployment rates. From 2006 to 2018, the activity rate of men was significantly higher than that of women. The activity rate of men increased slightly from 66.6% to almost 70%, while that of women increased significantly from 36.9% to 50.6% (see Figure 1).
The same trend can be observed in terms of the employment rate. Even if the employment rate of men is much higher than that for women, there was a slight increase in the rate of men from 53.6% in 2006 to 57.3% in 2018, while that of women markedly increased from 25.5% to 32.3% between 2006 and 2018 (see Figure 2).
From the point of view of the unemployment rate, it should be noted that they developed differently. The unemployment rate for men rose from 7.7% in 2006 to 18% in 2013 and then gradually decreased to 7.4% in 2018 (ANSD 2013). On the other hand, the unemployment rate for women has seen an evolution sawtooth, although there has been a slight increase over the last three years, reaching 26% in 2018 (see Figure 3).

3. Literature Review

The first models of economic growth (Domar 1946; Harrod 1939) explained economic growth solely by the volume of investments. These models subsequently paved the way for modern growth models, as Solow (1956) introduced the concept of technical progress as a long-term exogenous growth factor and established the famous concept of convergence economic.
The hypothesis of technical progress and its exogenous aspect have been overturned by the contents of endogenous growth models, which consider that technical progress is not exogenous but somewhat produced (Burlea-Schiopoiu et al. 2017). Moreover, real economic growth is endogenous because it results from economic choice, optimizing agents, cumulative factor investments, including human capital, technology, physical capital, and public capital (Darreau 2003).
The advent of endogenous economic growth theories has accelerated the conceptual evolution of the growth process through the endogenization of technical progress through experience (Arrow 1962; Burlea-Schiopoiu 2009), research and development (Romer 1986), and education (Lucas 1988).
The theory that most attracts our attention concerning our research is Barro (1991), who insists on the link between public capital and economic growth. Indeed, according to this theory, public investment is one of the main determinants of economic growth. By emphasizing the features of public capital, Barro’s theory highlights the imperfections of the market, which, beyond the existence of monopoly situations, are mainly linked to the problems of the appropriation of innovation. Public investments in infrastructure, education, and basic research are essential for sustainable economic growth (Goumrhar 2017).
In this context, it is up to the State to create institutional structures that support the profitability of private investments and subsidize activities that are insufficiently profitable for economic agents and yet essential to society. Public investment is considered a means of leading the economy towards economic growth with an improvement in the productive capacity and productivity of the different sectors of the economy (Costa-I-Font and Rodriguez-Oreggia 2005).
From the point of view of women’s participation in the labor market, it must be mentioned that economists discuss this problem at length. For example, Akyuz and Dogan (2017) consider that both the level of development and the educational level are the most relevant variables to analyze the participation of women in the labor market. For most studies, the link between economic growth and women’s activity rate is explained by a curve in the shape of a normal U (Tam 2011; Gaddis and Klasen 2014; Lechman and Kauer 2015; Verme 2015; Azuh et al. 2017).
Using mostly MEGCs, these authors attempted to provide indications to justify the trajectory of the curve by referring to the theory of Boserup (1970). According to this theory, men’s preferential access to education and new technologies can deprive women of jobs during the first years of economic growth. However, as economic growth improves, women have access to education and technology that later promote an increase in the female employment rate. Likewise, the authors have provided other explanations for the trajectory of the U-curve (Mammen and Paxson 2000; Lincove 2008; Cavalcanti and Tavares 2011), which point out that at the very beginning with an agrarian economy, women were very present in the labor market. Then, they withdrew at the earliest stages of economic growth with the surge of the blue-collar sector and finally returned when the white-collar sector grew.
However, according to other authors, the women participation rate experiences an opposite trajectory. Thus, it increases at the start of economic growth to a maximum before decreasing (U-shaped curve inverted). For these authors, the participation of women in the labor market increases from the early stages of economic growth before decreasing from a ceiling (Tansel 2002; Fatima and Sultana 2009). These results reflect those of Casale and Posel (2005), who demonstrated a positive relationship between variables during the booms of the decade after apartheid in South Africa. Akyuz and Dogan (2017), drawing inspiration from the work of Kuznets (1955) and using the approach of the autoregressive distributed lag (ARDL) model of analysis, were able to prove that economic growth first increases the participation rate of women to a maximum level and finally, the trend is reversed.
Alongside these contradictory results, Lahoti and Swaminathan (2013) have shown, using a dynamic panel model, that there was no significant relationship between economic growth and the participation rate of women in working life in India during the period 1983–2010. Their results reveal that economic growth, by itself, is not sufficient to increase women’s economic activity because the dynamics of growth are rather important. Gaddis and Klasen (2014) followed the Lahoti and Swaminathan (2013) approach with a sectoral one. They analyzed the effect of structural changes on the participation rate of women in the labor market using sectoral growth rates in developing countries. Using a dynamic panel model, they found that sectors such as agriculture, industry, mining, and services affect the employment rate of women differently. Their results show that structural changes have a weak effect on the participation rate of the female workforce. They concluded that the assumption of a U-shaped female participation rate in the development process is not too relevant for most developing countries. Moreover, it should be emphasized that the nature of this relationship also depends on cultural, religious, and/or behavioral specificities, which may vary from one country to another (Nassar 2003; Fernández 2013). By way of illustration, women in Muslim countries often do not have access to employment due to their religious constraints, and, in this case, a U-shaped relationship hypothesis with solid foundations might not be valid in these countries (Wolch and Dear 2014).
Finally, it should be emphasized that the most outstanding contemporary challenge for humanity is to promote economic and social policies capable not only of assuring inclusive growth but of controlling the dynamics of the labor market and of combating poverty by considering the inequalities that are observed there from all points of view (Azuh et al. 2017). Indeed, the labor market plays a significant role in implementing a virtuous circle between economic growth, poverty, and the reduction in inequalities. Therefore, the proper functioning of the labor market is a fundamental determinant of well-being and egalitarian development. Mansour and Tremblay (2018) put forward the need to propose a set of public policies (parental leave, childcare services, the flexibility of working hours) to consolidate economic growth and support women on the job market.

4. Computable General Equilibrium Model and Data

A dynamic computable general equilibrium model (CGEM)was built to simulate the impact of the ESP on the growth and evolution of the demand for labor according to gender. One of the specificities of this model is the integration of the channels through which public investments affect the total factor productivity of the different branches, proving the complementarity between private and public investments, the accumulation of capital, and the demand for labor. In the past, several general equilibrium models have been developed and applied in Senegal to analyze a wide range of policies (Boccanfuso et al. 2007; Cabral 2009, 2012, 2013).
The choice of methodology is justified because general equilibrium modeling provides a more satisfactory answer than partial equilibrium analyzes by giving an overview of the channels through which the implementation of a policy passes (Suwa 1991). Thus, it makes it possible to analyze the impact of economic policies on the economy’s structure in all its compartments concerning the interactions between sectors and between different economic agents.
As we previously mentioned, the basic model structure used was that of PEP-T, and we added an extensive segmentation of the labor market marked by the introduction of a wage curve and the modeling of foreign trade, which considers the existence of finite export demand. The model is dynamic recursive, which means that it is solved as a sequence of static equilibria connected over time through the accumulation of capital and the increase in labor and behavioral equations. One of the advantages of a dynamic model specification is the possibility of generating a medium- and long-term path, and structural changes can be analyzed over time. The model is for a small economy, for which world prices are given.

4.1. Parameters of the Functional Forms of the Model

The specification of the functions of production, household consumption, and import and export demands requires some parameters. The most important parameters are the following: the income elasticity of demand for products, the Frisch parameter, the elasticity of substitution between capital and labor, the elasticity of substitution between imported and local products, the elasticity of transformation between foreign and local sales, and the elasticity of foreign demand. In the absence of long series, these parameters were not estimated on data from Senegal. They were taken over from the literature and empirical studies in other developing economies (Annabi et al. 2006). All other model parameters were calibrated using SAM data to ensure consistency of base year data. The elasticity of complementarity between public and sectoral capital is taken from Cabral et al. (2017).

4.2. Accounting Framework of the Model: Social Accounting Matrix (SAM) of Senegal

The National Agency builds the initial matrix for Statistics and Demography based on the following tables: input–output table, the table of financial operations of the State, and the table of the balance of payments.
We disaggregated this matrix using the 2011 (ANSD 2011) statistics adjusted using the statistics from 2017 and 2018 (ANSD 2017; DPEE 2018). This matrix has been disaggregated as broadly as possible given the specificity of the research, and it includes 27 business sectors and 48 products. The labor factor was first segmented into ten socio-professional categories, as follows:
  • Senior executives and engineers (CSI);
  • Middle managers and supervisors (CMAM);
  • Employees and skilled workers (EOQ);
  • Employees and semi-skilled workers (EOSQ);
  • Employers;
  • The maneuvers;
  • Self-employed workers (own account);
  • Family helpers;
  • Paid or unpaid apprentices;
  • The others, which include the undeclared and the unclassifiable.
Therefore, each category of employees is also segmented according to gender (men and women). In total, the only labor factor is now found to be split into 20 sub-segments. Indeed, this segmentation makes it possible to highlight the heterogeneity of the labor market according to socio-professional category and gender to respond appropriately to the specificity of our problem. The capital factor is also split into two modalities: private capital and public capital. This segmentation procedure makes it possible to simulate the impact of a variation in public investments in a sector on employment according to gender and socio-professional category. Regarding agents, we have the classics: households, firms, government, and the rest of the world. To consider their heterogeneity, households are also dissociated into fifteen sub-segments according to income quartiles and living area (five quartiles for Dakar, five quartiles for other urban centers, and five quartiles for the rural area). The abbreviations correspond to the 27 sectors of activity found in the Senegalese economy (see Appendix A).

4.3. Justification of the Simulations

The simulation consists of analyzing the consequences of an increase in public investment in priority sectors, following the implementation of the first phase of the ESP (see Table 1. The choice of priority sectors emanates from public decision makers, and only market sectors were considered in the modeling. Implementing the first phase of the ESP resulted in a relative increase in public investment in the so-called priority sectors. The simulation consisted of varying the volume of public investment allocated to the group of priority sectors of the first phase of the ESP as follows:
  • Agriculture and agro-industry (in this sub-sector, the only increases in public investment are those noted in agriculture in the strict sense, and, consequently, the shock will only affect this sector);
  • Fishing–aquaculture;
  • Civil engineering roads-highways and ports-airports;
  • Digital economy (the telecommunications sector has been used here as a proxy).
From 2014, the ESP resulted in an average increase in sectoral public investment between the sub-periods 2010–2013 and 2014–2016, as is presented in the following table (Table 1).
The model makes it possible to assess the effects of an increase in public investment allocated to sectors of activity on demand for labor and, therefore, the supply of jobs.

5. Results of Simulations and Discussions

After an analysis of the macroeconomic and sectoral impact of the shock linked to the increase in public investments in the so-called priority sectors, we analyzed the impact on the volume of jobs demanded by the sectors of the economy according to socio-professional category and gender, aware that in an EGC model, all variables interact and are determined simultaneously. In a dynamic model, the economy grows, even in the absence of a shock.

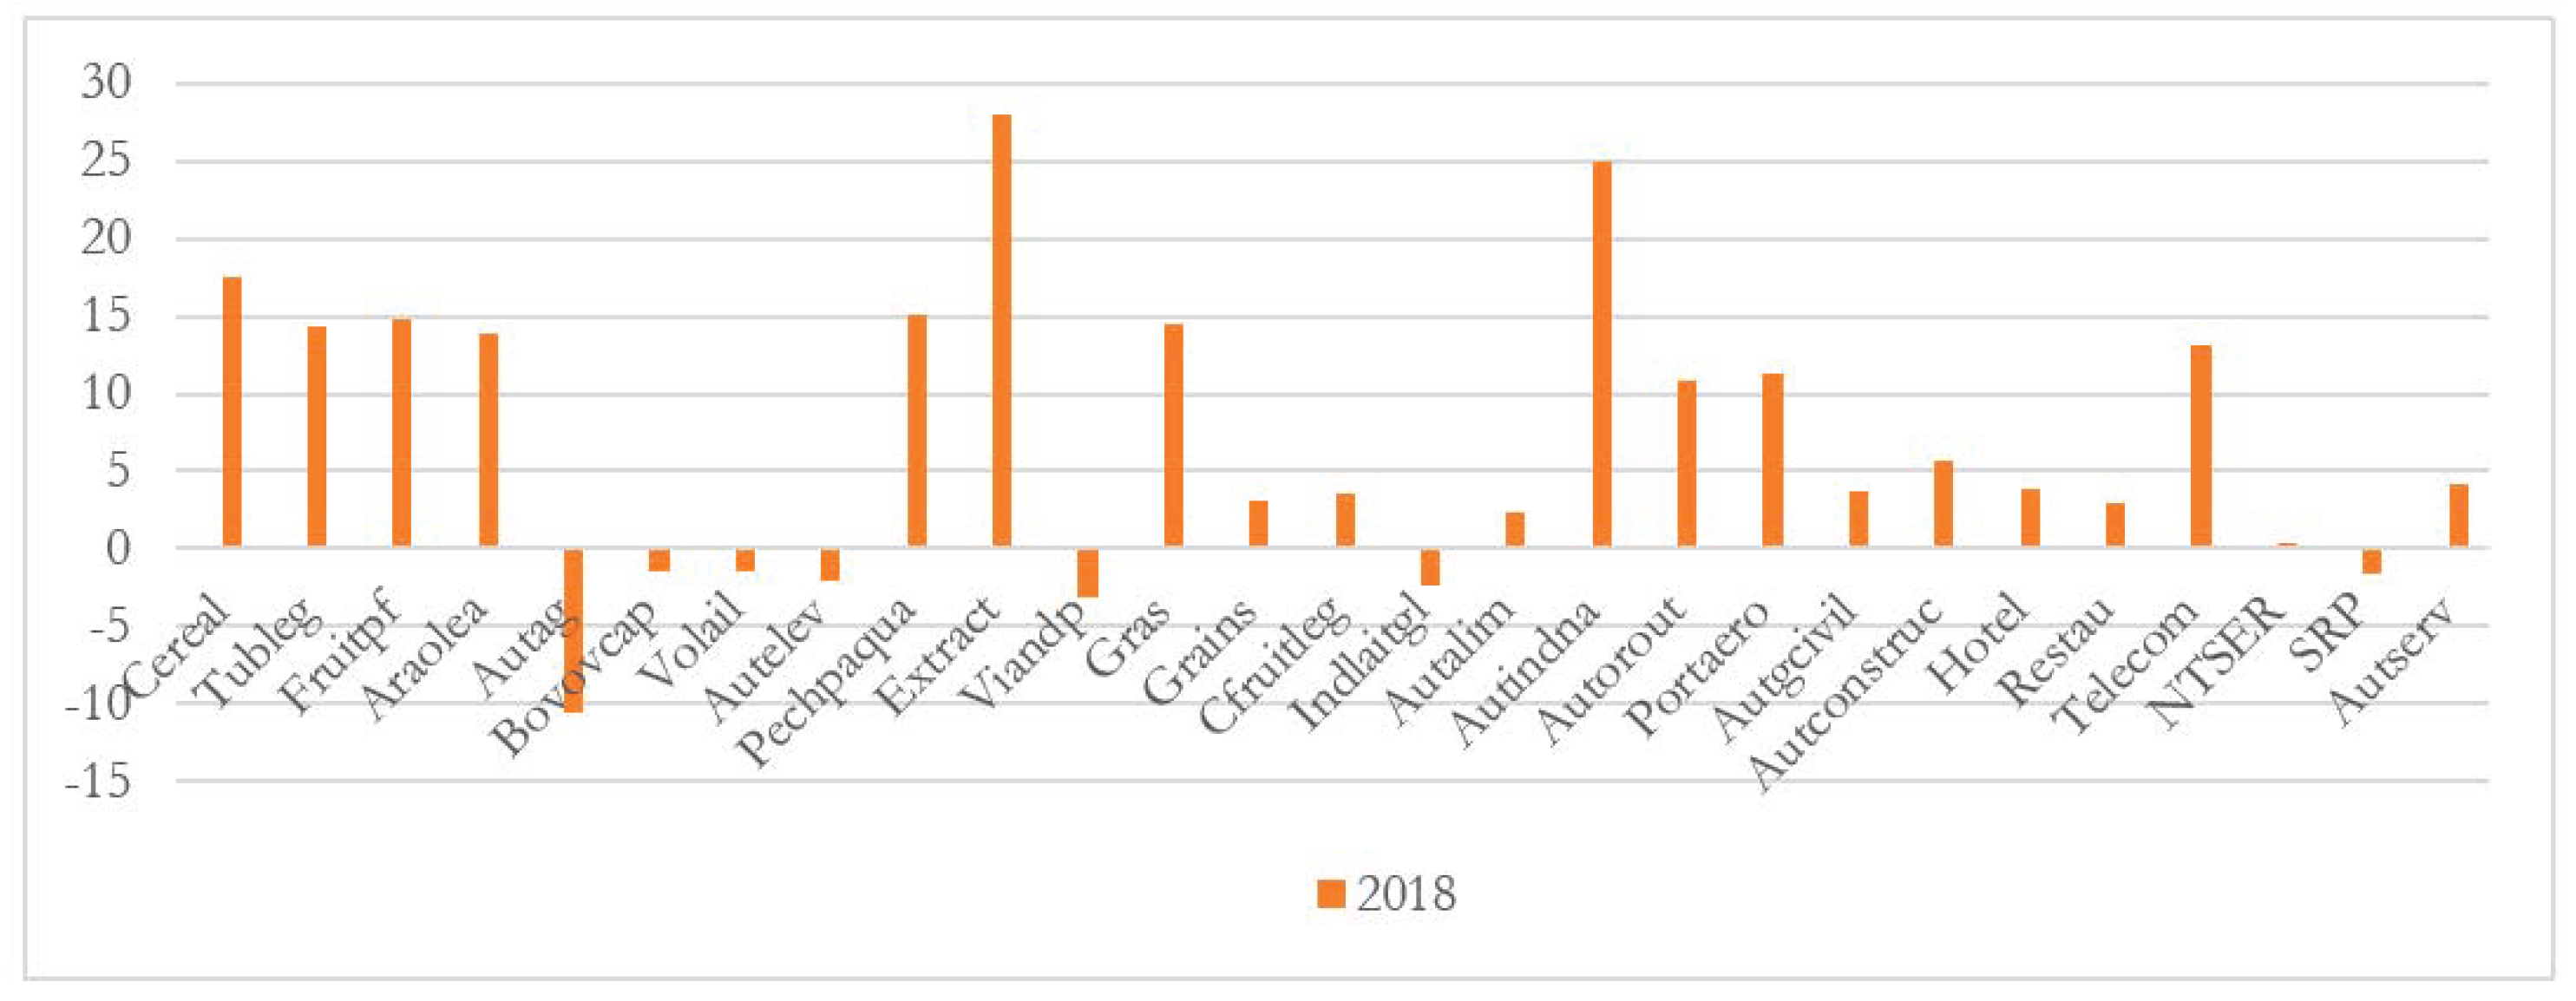
5.1. Global Impact on Production

The increase in public investment in the priority sectors of the ESP encouraged an increase in GDP and allowed an improvement in the growth rate of 1.28 to 3.02 percentage points between 2015 and 2018 (e.g., an average increase of 1.79 percentage points per year—see Figure 4).

5.2. Sector Impact on the Added Value on Production

Increased public investment is assumed to have relatively more impact in priority sectors with relatively higher public capital intensity. Consequently, the increase in public investments in priority sectors translated into an increase in their added value. The most significant increases were recorded in the mining and extract industries and other non-food “autindna” industries. The other priority sectors (agriculture, fishing–aquaculture, civil engineering: road–highway, port–airport, digital economy: telecom) observed an increase in added value, but to a lesser extent (Figure 5).
Following a considerable increase in the flow of public investments, the return on public capital fell for the entire period, unlike that on private capital. We consider that the injection of public capital into priority sectors enabled them to develop and attract more private capital, and a spillover effect on public capital appeared (Figure 6).

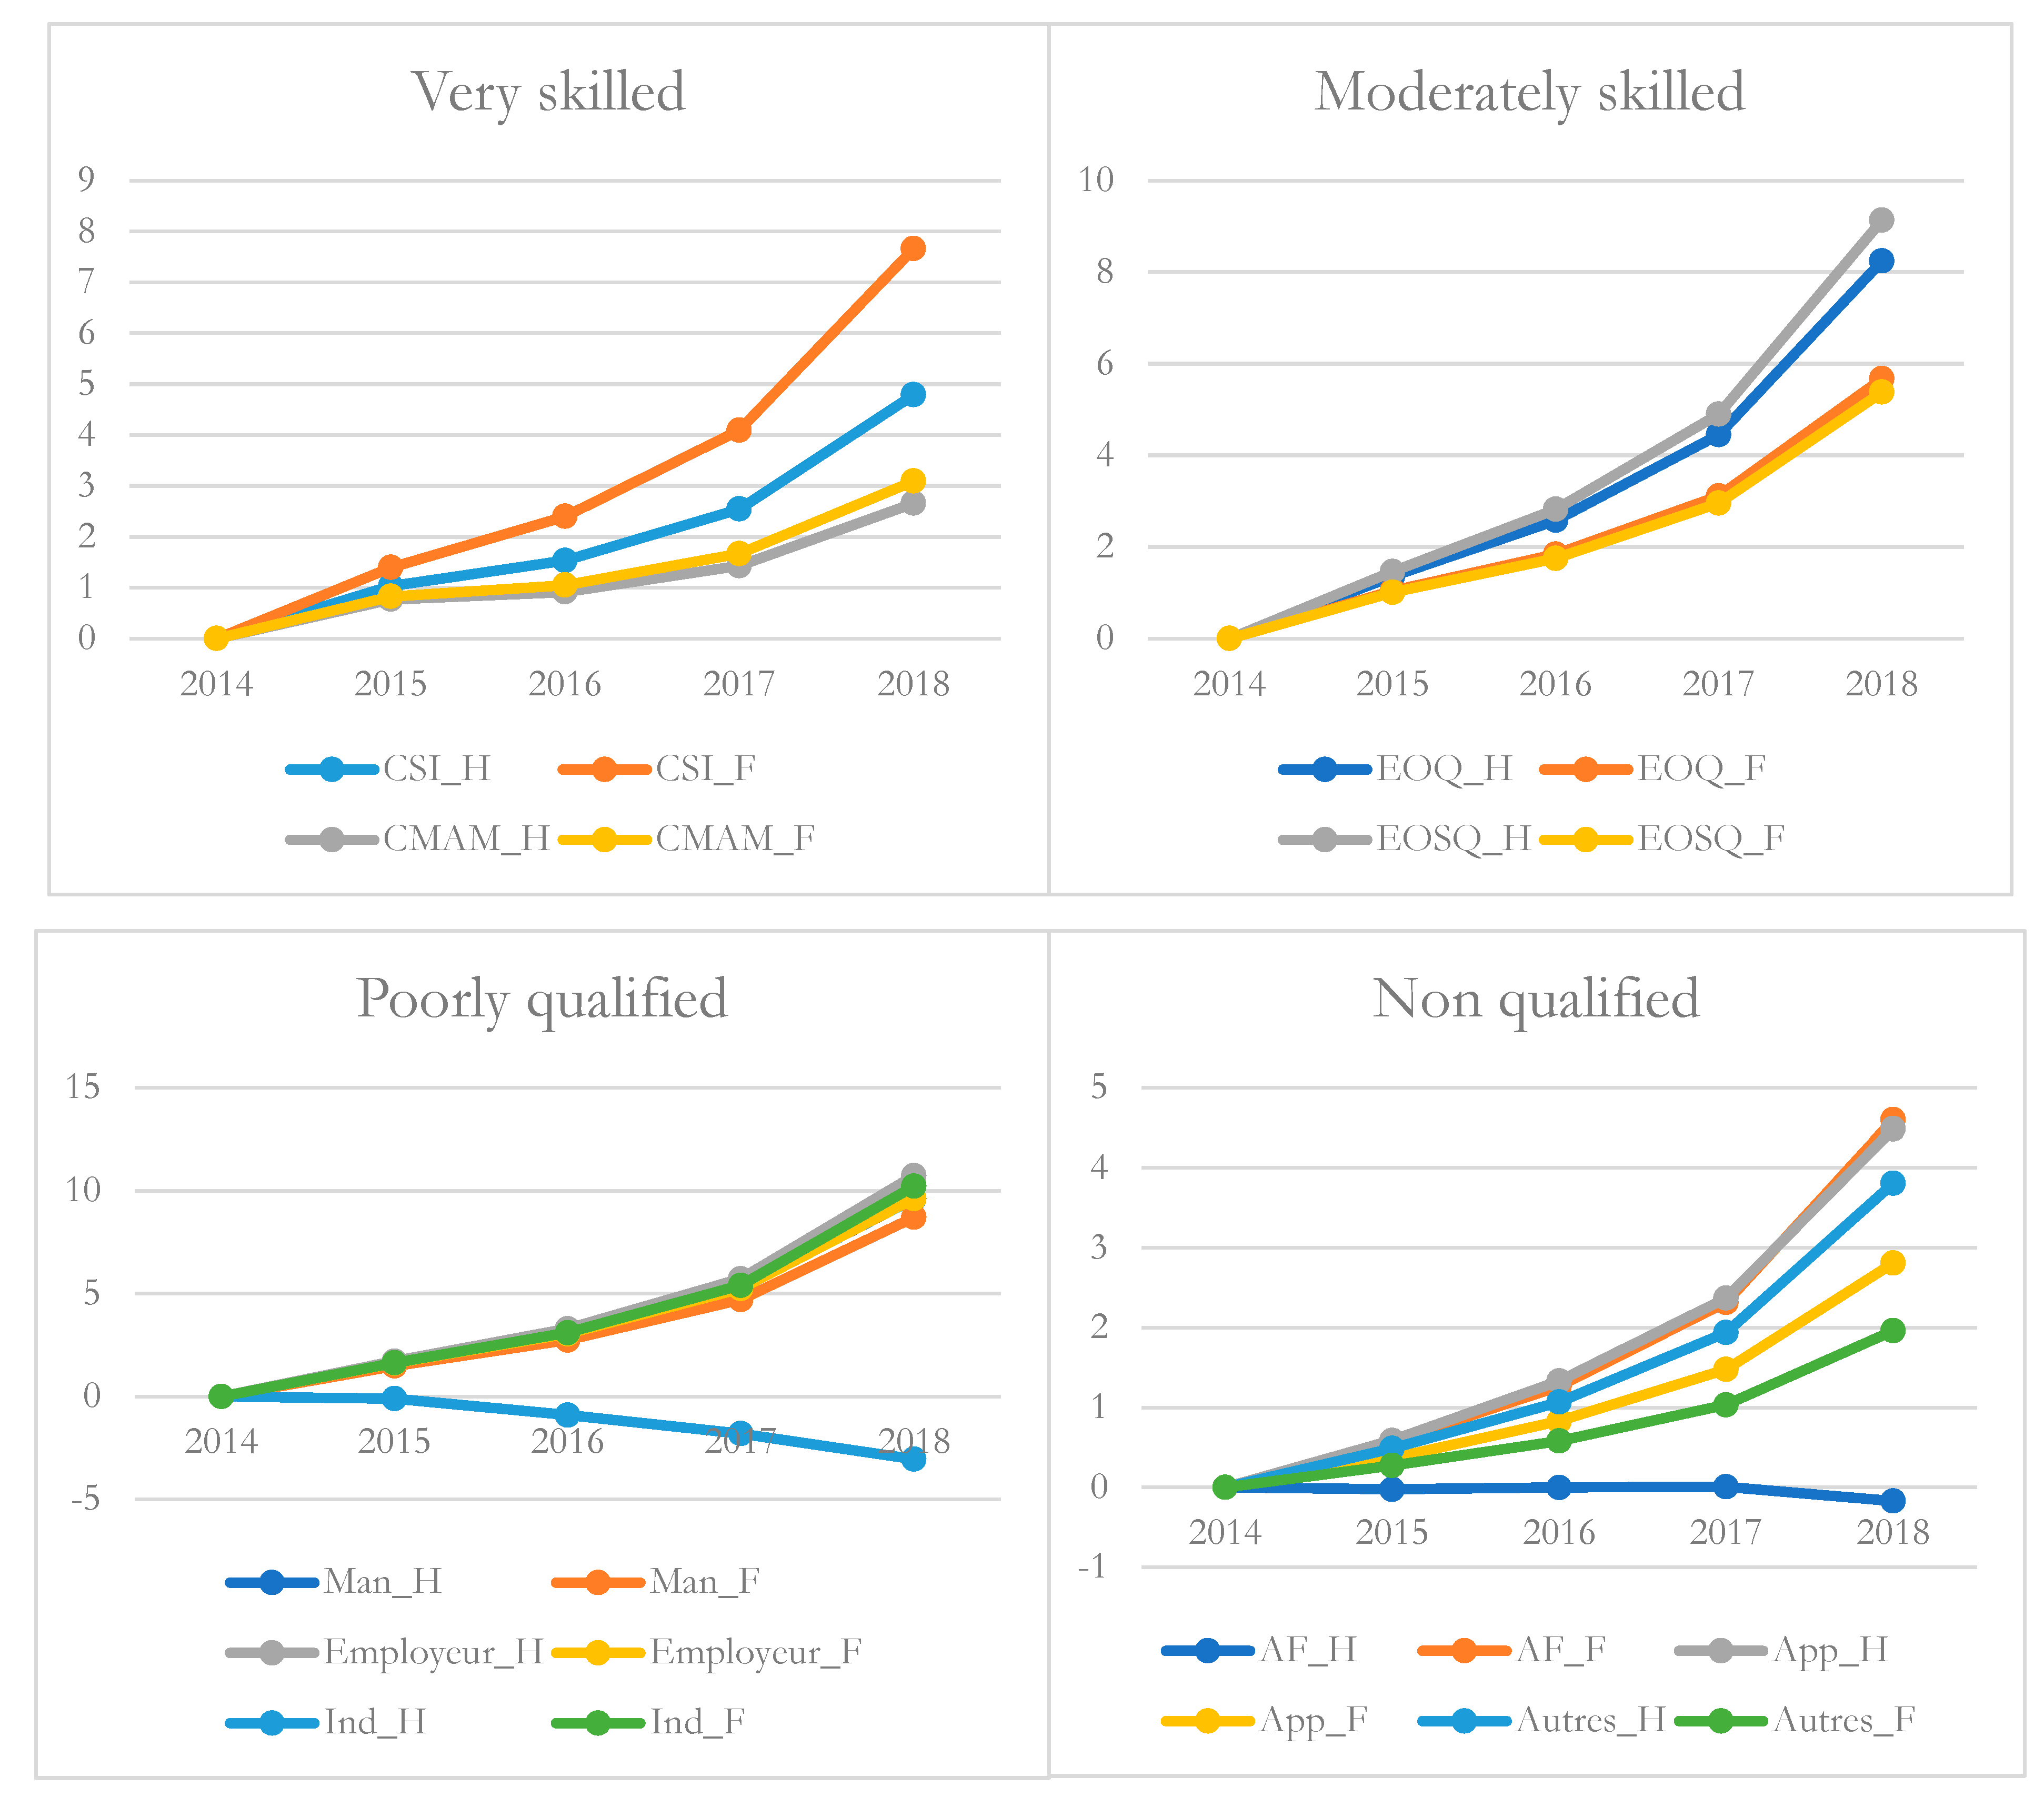
5.3. Impact on the Labor Market

We used the classification of the different socio-professional categories resulting from the Senegal documents (ANSD 2017), and to facilitate their analysis after the simulation process, we grouped the 20 segments of the labor market into four categories:
  • The highly qualified: Senior managers and engineers (CSI)/ middle managers and supervisors (CMAM);
  • Medium-skilled: Employees and skilled workers (EOQ)/ employees and semi-skilled workers (EOSQ);
  • The low-skilled: Employers/laborers/self-employed workers (own account);
  • The unqualified: Family helpers/paid or unpaid apprentices/others, which includes the undeclared and unclassifiable.
Our results prove that the increase in public investment caused an expansion of priority sectors but also of other sectors of the economy and, in turn, promoted a substantial increase in demand for the workforce (all segments included) except for self-employed men (Ind_H), who experienced a significant decrease in demand, and male family helpers who are practically observing the status quo (Figure 6).
This drop in the demand for work by self-employed men could be linked to a shift in demand towards other segments of the male workforce, particularly the skilled and medium-skilled segments. The sectors of the growing Senegalese economy prefer to free up self-employed men to fall back on other segments of more qualified workers. The same interpretation could be applied to male family helpers (AF_H), for whom the demand has stagnated, given that the economy already has a good stock of employees for this segment and that the demand for male labor is more oriented towards other socio-professional categories.
The results also prove, concerning the highly qualified segment, that women senior managers (CSI_F) are in greater demand than their male counterparts, and the same trend is observed for middle managers even if the difference is more negligible for this segment. From the point of view of the medium-skilled (skilled, semi-skilled employees and workers), the reverse can be observed with men, who are more in demand. As for the low-skilled (laborers), men are slightly more in demand than women are.
From the point of view of the unskilled employees, the results are a bit more mixed. While women caregivers are in greater demand than their men are counterparts, it is different for apprentices and other work segments (the undeclared and unclassifiable), where men are in greater demand than women are.
The analysis of work demand allows us to diagnose the evolution of wages, and we observed that the increase in labor demand led to an increase in wages for all work segments from 2015 to 2018. One exception was self-employed men, for whom wages logically fell over the entire period due to a drop in their employment request (Table 2). The wages fell for many segments in 2015, which is linked to a delayed effect of the increase in labor demands on wages.
Based on the results of our simulations, we noted a positive relationship between public investment and economic growth. Indeed, before implementing the ESP, Senegal had experienced very sober economic activity, given the low level of public investment. In this sense, the ESP has enabled an increase in public investment, which has resulted in a revival of economic activity and massive job creation.
This result confirms the theory of endogenous growth (Barro 1991; Goumrhar 2017) by emphasizing the existence of a positive correlation between public investment and economic growth. Senegal has made a lot of public investments in education, research, development, and infrastructure, among others, which has helped improve economic growth.
Public capital plays a driving role in economic activity in Senegal. In this sense, a significant increase in public investment, especially in infrastructure, makes it possible to attract private investors (local and foreign) and thus promote the recovery of the sectors concerned (Burlea-Schiopoiu et al. 2021). The results of our simulations show a complementarity and training effect between public and private investments (local and foreign).
From the point of view of foreign direct investment (FDI), it must be said that Senegal is one of the most attractive countries in the West African sub-region due to its socio-economic stability as well as the many advantages that the Senegalese economy has had since the implementation of the ESP. The latest UNCTAD report (2021) mentions that Senegal is among the few economies that will increase FDI flows in 2020. They are estimated at USD 1.5 billion due to mining, industry, energy, etc. Asada (2020) emphasized that FDI plays a remarkable role in the socio-economic development of countries, especially developing ones, and he pointed out that if most Asian countries have successfully integrated into the world economy, it is partly due to FDI.
In terms of the labor market, the results of our simulations show that the ESP has generally led to an increase in demand for labor. Indeed, the ESP has made it possible to improve the country’s governance, strengthen resilience to external shocks and place the country on an inclusive and sustainable growth path, creating jobs for both men and women. These results agree with Casale and Posel’s (2005) results from South Africa, with those of Fatima and Sultana (2009) from Pakistan, and with those of Akyuz and Dogan (2017) from Turkey. Our results are also not far from those of Asada (2020), who focused on foreign direct investments through the ARDL method and concluded that Vietnam developed its strategy to enhance the positive and constructive relationship between FDI, trade, and labor productivity. Asada (2020, p. 2) mentions that “The driving forces of the structural transformation include capital accumulation and technology transfer through FDI as well as the reallocation of labor from sectors with lower labor productivity to sectors with higher labor productivity, notably export-oriented manufacturing sector.”
From a gender perspective, it is generally observed that female labor is in greater demand for the highly skilled segment than male labor, while for the medium-skilled and low-skilled segments, men are more in demand than women are. This result is mainly linked to the low presence of highly qualified female labor in the Senegalese labor market, and female workforce scarcity means that it is in high demand in this market compared to the masculine workforce.
Notorious gender disparities still characterize Senegal regarding skill and productivity levels and a difference in human capital endowment between men and women. Inequalities are observed from college, where the trend shows that up to 78.9% of men reach the eighth year of higher education, while it is 21.1% for women. In addition, girls are poorly represented in the science and technology series (39.8%) compared to 60.2% for boys. Individuals with vocational training are 63.4% male compared to 36.6% female (ANSD 2017).
For the other labor market segments (the medium-skilled, the low-skilled, and the unskilled), it is generally noted that men are more in demand than women. This result is mainly related to the structure of the Senegalese labor market on the one hand and the choice of priority sectors of the ESP on the other. Thus, it is noted that the segments of the medium-skilled, low-skilled, and unskilled require physical capacity and a workforce that is generally more favorable to the male workforce.
The literature proves that starting from an expanding agrarian economy, the “blue-collar” sector (industry, mining, construction, etc.) is generally more favorable to male labor, while “white-collar workers” (service, banking, education, health, etc.) are more supportive of the female workforce (Lincove 2008; Cavalcanti and Tavares 2011). In this sense, given that the priority sectors of the ESP are predominantly in the sphere of ‘blue-collar workers,’ this is followed by the creation of more good jobs for men. Thus, to promote gender equality in the labor market, women’s labor-intensive sectors (‘white-collar’ sectors) should be preferred.
Antonopoulos and Kim (2011), through a micro-simulation model applied to the Social Accounting Matrices of South Africa and the United States, demonstrated that investing in social services (for older people, people with chronic illnesses, preschool children, etc.) has a significant impact on job creation, especially for the female workforce. They concluded that investing in social services contributes to gender equality in the labor market and promotes income growth and inclusive development.
Our findings agree with those of Kim et al. (2019) that proved based on a macro–micro simulation model targets on social sectors that are intensive in female labor, and that it is possible to promote job creation more favorable to women to fight against gender disparities in the labor market and to achieve inclusive economic growth. Kim et al. (2019, p. 1213) underlined that “the economic policy makers that alleviating female labor supply restrictions can aggravate unemployment even further in the face of a general lack of jobs, low growth or jobless growth at best”.

6. Conclusions and Policy Implications

The result of our research is the dynamic computable general equilibrium model used to assess the impact of the increase in public investment resulting from the implementation of the ESP on growth and employment. Given the specific nature of the research, an extensive segmentation of the labor market was carried out to highlight the heterogeneities of the labor factor according to gender and socio-professional categories. The simulations focused on the variation in the level of public investment devoted to priority sectors during phase one of the ESP implementation during the period 2014–2018.
The results of our research prove that the substantial investments drained by the implementation of the ESP have put the Senegalese economy on a dynamic trajectory of economic growth. As a result, job creation followed the expansion of economic sectors and increased demand for labor due to a capital increase. However, this demand has evolved differently depending on the socio-professional categories and gender.
Regarding the highly skilled segment, women are in greater demand than men, except this mostly accounts for self-employed and caregiver workers. The implementation of the ESP influenced the labor market, generating a strong demand for qualified women (senior and middle managers), independent women and family helpers. The other effect of ESP implementation consists of an increased demand for men (especially medium-skilled, skilled, semi-skilled, low-skilled and unskilled).
The demand for qualified women is very high on the labor market, but they are available in very limited numbers, unlike their male counterparts. Self-employed women are in greater demand than men. One source of this divergent demand (women–men) is the preponderance of the women-associated trades on the Senegalese labor market, while the men are required for productive jobs.
From the point of view of the implications of economic policies, it could be argued that the practice of positive discrimination in favor of women with the implementation of public employment programs considering the gender dimension and the recovery of intensive sectors in traditional female labor (social sectors, education, daycare, hotel industry, tourism, catering, etc.) would make it possible to improve the employment rate of women in the short term.
The practice of positive discrimination in the favor of women with the implementation of public employment programs considers the gender dimension and the recovery of sectors accessible to women (e.g., hotels, tourism). Thus, in the short term, it would make it possible to improve the employment rate of women. In the medium to long term, by promoting women’s education, retaining girls in schools, and encouraging them to take more interest in training, modern jobs based on science and technology would be relevant to facilitate skilled female employment.
In the medium to long term, the pursuit of raising the level of the human capital of women by promoting the education and retention of girls in school and by encouraging them to take more interest in training and modern jobs focused on science and technology would help facilitate their access to the skilled segment to find decent employment.
Moreover, it is essential to mention that if the computable general equilibrium models are powerful instruments for simulating the expected effects of a shock, the results can only be apprehended based on the assumptions which underline them. Indeed, when sterilizing all the other shocks to isolate the only effects attributable to the simulated shock, the impact assessment should only be interpreted through the prism of a comparison between a usual scenario without shock (business as usual) and the scenarios relating to the ESP.
Another limitation of this research is inherent to the accounting base used (ANSD 2011, 2013, 2017; DPEE 2018), which we found to be a little old, mainly due to the unavailability of a newer base.
This research offers many perspectives, particularly the possibility of integrating women’s domestic work (unpaid work) into the analysis and seeing the influence of this on-demand for women’s labor at the labor market—paid employment level.

Author Contributions

Conceptualization, M.C.A.S.; methodology, M.C.A.S.; validation, M.C.A.S. and A.B.-S.; formal analysis, M.C.A.S.; investigation, M.C.A.S.; writing—original draft preparation, M.C.A.S.; writing—review and editing, A.B.-S.; visualization, M.C.A.S. and A.B.-S.; supervision, A.B.-S. All authors have read and agreed to the published version of the manuscript.

Funding

This research received no external funding.

Data Availability Statement

The data are available upon request.

Conflicts of Interest

The authors declare no conflict of interest.

Appendix A

Table A1. Description of the 27 business sectors and products/services.
AbbreviationsActivity AreaProducts/Services
CerealCereal cropsWheat, millet/sorghum, corn, paddy rice, Other agricultural products
TublegCultivation of tubers and vegetablesOnion, tomato, melon–watermelon, mango, other agricultural products
FruitpfCultivation of fruits, plants and flowers, nurseriesMango, banana, citrus, other agricultural products
AraoleaPeanuts and other oil products (except cotton seeds)Groundnuts and other oil products, other agricultural products
AutagOther agriculture, forestry, and logging activitiesSeed cotton, mahogany, other agricultural products
BovovcapBreeding of cattle, sheep, goats, poultry Sheep, cattle, goats, raw milk, other livestock products
VolailPoultry farmingPoultry, other livestock products
AutelevOther breeding activitiesOther livestock products
PechpaquaFishing, fish farming, and aquacultureFishery products, other food products
ExtractExtractive activitiesZircon, other extraction products
ViandpSlaughter, processing, and conservationFishery products, Bovine meat, sheep meat, goat meat, poultry meat, other food products, restaurant services
GrasFood fats productionCrude peanut oils, other food products
GrainsGrain workHusked rice, millet, and sorghum flour, other food products
CfruitlegPreserved fruits and vegetablesRaw peanut oils, millet, and sorghum flour, Tomato preserves, milk and the like, other food products
IndlaitglManufacture of dairy products and ice creamMilk and assimilated, other food products, electricity
AutalimOther food industriesOther agricultural products, Poultry, other livestock products, other food products, tobacco
AutindnaOther non-food industriesOther extractive products, nitrogen, and fertilizers, other Chemicals, manufactured products, water, electricity, telecommunications services
AutoroutConstruction of roads and highwaysRoads, highways
PortaeroPorts and airportsPorts and Airports
AutgcivilOther civil engineeringOther civil engineering
AutconstrucOther construction activitiesOther constructions
HotelHotel and accommodationHotel services, restaurant services
RestauCatering and drinking placesCatering services
TelecomTelecommunicationsTelecommunications
NTSERNon-market servicesNon-market services
SRPOil exploration and prospecting servicesOil exploration and prospecting services
AutservOther servicesOther services
Source: Authors, based on SAM Senegal.

References

  1. Akyuz, Mehmet, and Buhari Dogan. 2017. Female Labor Force Participation Rate and Economic Growth in the Framework of Kuznets Curve: Evidence from Turkey. Review of Economic and Business Studies 10: 33–54. [Google Scholar]
  2. Annabi, Nabil, John Cockburn, and Bernard Decaluwé. 2006. Functional Forms and Parametrization of CGE Models. Working Paper. Ottawa: International Development Research Centre (IDRC). [Google Scholar]
  3. Anne, Bator, Baurice Younouss Diedhiou, Christian Lukineyo Joshi, and Sokhna Diarra Mboup. 2018. L’impact de l’APE sur l’emploi des femmes: Quelle contribution des investissements publics? Une analyse en EGC Dynamique appliquée au cas du Sénégal. Québec: Partenership for Economic Policy (PEP). [Google Scholar]
  4. Agence National de la Statistique et de la Démographie (ANSD). 2011. Rapport de l’Enquête de Suivi de la Pauvreté au Sénégal; Dakar: Ministère de l’Economie, des Finanaces et du Plan.
  5. Agence National de la Statistique et de la Démographie (ANSD). 2013. Rapport définitif du Recensement Général de la Population et de l’Habitat, de l’Agriculture et de l’Elevage; Dakar: Ministère de l’Economie, des Finanaces et du Plan.
  6. Agence National de la Statistique et de la Démographie (ANSD). 2017. Rapport de l’Enquête National sur l’Emploi au Sénégal; Dakar: Ministère de l’Economie, des Finanaces et du Plan.
  7. Antonopoulos, Rania, and Kim Kijong. 2011. Public Job-creation Programs: The Economic Benefits of Investing in Social Care Case Studies in South Africa and the United States. Working Paper No. 671. Annandale-on-Hudson: Levy Economics Institute of Bard College. [Google Scholar]
  8. Arrow, Kenneth J. 1962. Economic Welfare and the Allocation of Resources for Invention. Princeton: Universities-National Bureau Committee for Economic Research, Princeton University Press, pp. 609–26. [Google Scholar]
  9. Asada, Hidekatsu. 2020. Effects of Foreign Direct Investment and Trade on labor Productivity Growth in Vietnam. Journal of Risk Financial Management 13: 204. [Google Scholar] [CrossRef]
  10. Azuh, Dominic, Lanre Amodu, Akunna Ebere Azuh, Toluwalope Oresanya, and Oluwatoyi Matthew. 2017. Factors of Gender Inequality and Development among Selected Low Human Development Countries in Sub-Saharan Africa. Journal of Humanities and Social Science (IOSR-JHSS) 22: 1–7. [Google Scholar]
  11. Banque Mondiale. 2019. Vue d’ensemble sur la situation économique du Sénégal. Sénégal-Vue d’ensemble. Available online: banquemondiale.org (accessed on 15 January 2020).
  12. Barro, Robert J. 1991. Government spending in a simple model of endogeneous growth. Journal of Political Economy 98: 103–25. [Google Scholar] [CrossRef] [Green Version]
  13. Boccanfuso, Dorothée, François Joseph Cabral, Fatou Cissé, Abdoulaye Diagne, and Luc Savard. 2007. Stratégie de réduction de la pauvreté par la modélisation en équilibre général calculable microsimulé. Revue d’analyse économique, L’actualité économique 83: 483–528. [Google Scholar]
  14. Boserup, Ester. 1970. Women’s Role in Economic Development. New York: St. Martin’s Press. [Google Scholar]
  15. Burlea-Schiopoiu, Adriana. 2009. Success Factors for an Information Systems Projects Team: Creating New Context, Innovation and Knowledge Management in Twin Track Economies. Paper presented at the IBIMA Conference, Cairo, Egypt, January 4–6; pp. 4–6. [Google Scholar]
  16. Burlea-Schiopoiu, Adriana, Samuel O. Idowu, and Stephan Vertigas, eds. 2017. Corporate Social Responsibility in Times of Crisis: A Summary. New York: Springer. [Google Scholar]
  17. Burlea-Schiopoiu, Adriana, Simina Brostescu, and Liviu Popescu. 2021. The impact of foreign direct investment on the economic development of emerging countries of the European Union. International Journal Finance Economics, 1–30. [Google Scholar] [CrossRef]
  18. Cabral, François Joseph. 2009. La stratégie de croissance accélérée du Sénégal est-elle pro pauvre. Working Paper. Espoo: GREDI, Sherbrooke: Université de Sherbrook. [Google Scholar]
  19. Cabral, François Joseph. 2012. Aléas pluviométries et disparités régionales de pauvreté au Sénégal. Revue d’économie de développement 26: 69–95. [Google Scholar] [CrossRef]
  20. Cabral, François Joseph. 2013. Corruption, croissance et pauvreté: Le cas du Sénégal. Working paper. Espoo: GREDI, Sherbrooke: Université de Sherbrook. [Google Scholar]
  21. Cabral, François Joseph, Fatou Cissé, and Abdoulaye Diagne. 2017. Modélisation de l’impact du PSE agricole sur la demande de travail au Sénégal. Dakar: Miméo. [Google Scholar]
  22. Casale, Daniela, and Dorrit Posel. 2005. Women and the economy: How far have we come? Agenda 64: 21–29. [Google Scholar]
  23. Cavalcanti, Tago V. De V., and Jose Tavares. 2011. Women prefer larger governments: Growth, structural transformation, and government size. Economic Inquiry 49: 155–71. [Google Scholar] [CrossRef]
  24. Chetboun, David. 2015. Où en est l’économie Sénégalaise après trois ans d’alternance? In Macroéconomie et Développement; n°21. Paris: Agence Française de Développement, pp. 1–32. [Google Scholar]
  25. Costa-I-Font, Joan, and Eduardo Rodriguez-Oreggia. 2005. Is the Impact of Public Investment Neutral Across the Regional Income Distribution? Evidence from Mexico. Economic Geography 81: 305–22. [Google Scholar] [CrossRef] [Green Version]
  26. Darreau, Philippe. 2003. Croissance et politique économique. Limoges: Université de Limoges. [Google Scholar]
  27. Decaluwe, Bernard, Andre Lemelin, Veronique Robichaud, and Helene Maisonnave. 2013. PEP-1-t: The PEP Standard Single-Country, Recursive Dynamic CGE Model. Québec: Partenership for Economic Policy (PEP). [Google Scholar]
  28. Direction de la Prévision et des Etudes Economiques (DPEE). 2018. Impact des Dépenses Publiques sur la Pauvreté et les Inégalités Sociales au Sénégal: Bourses de Sécurité Familiale et CMU; Document d’étude n°38. Dakar: Minister de l’Economie, du Plan et de la Cooperation.
  29. Domar, Evsey D. 1946. Capital expansion, rate of growth and employment. Econometrica 14: 137–47. [Google Scholar] [CrossRef]
  30. Fatima, Ambreen, and Humera Sultana. 2009. Tracing out the U-Shape Relationship between Female Labour Force Participation Rate and Economic Development for Pakistan. Karachi: Applied Economics Research Centre, University of Karachi. [Google Scholar]
  31. Fernández, Raquel. 2013. Cultural change as learning: The evolution of female labor force participation over a century. The American Economic Review 103: 472–500. [Google Scholar] [CrossRef] [Green Version]
  32. Fonds Monétaire International (FMI). 2019. Le coût économique de la sous-estimation du travail des femmes, finances et développement. Publication trimestrielle du Fonds Monétaire International Octobre 2019. Washington, DC: Fonds Monétaire International, vol. 56. [Google Scholar]
  33. Gaddis, Isis, and Stephan Klasen. 2014. Economic Development, Structural Change, and Women’s Labor Force Participation. Journal of Population Economics 27: 639–81. [Google Scholar] [CrossRef]
  34. Goumrhar, Hicham. 2017. Capital humain, inégalités et croissance économique dans les pays en développement: Une analyse en données de panel. International Journal of Innovation and Applied Studies 20: 441–60. [Google Scholar]
  35. Harrod, Robert F. 1939. An essay in Dynamic theory. Economic Journal 4: 14–33. [Google Scholar] [CrossRef]
  36. Kim, Kijong, İpek İlkkaracan, and Tolga Kaya. 2019. Public investment in care services in Turkey: Promoting employment and gender inclusive growth. Jounal of Policy Modeling 41: 1210–29. [Google Scholar] [CrossRef]
  37. Kuznets, Simon. 1955. Economic Growth and Income Inequality. The American Economic Review 45: 1–28. [Google Scholar]
  38. Lahoti, Rahul, and Hema Swaminathan. 2013. Economic Development and Female Labor Force Participation in India (June 28, 2013). Research Paper No. 414. Bengaluru: Indian Institute of Management Bangalore. [Google Scholar] [CrossRef]
  39. Lechman, Eva, and Harleen Kauer. 2015. Economic Growth and Female Labor Force Participation–Verifying the U-Feminization Hypothesis. New evidence for 162 countries over the period 1990–2012. Economics of Sociology 8: 246–57. [Google Scholar] [CrossRef] [PubMed]
  40. Lincove, Jane Arnold. 2008. Growth Girls Education, and Female Labor: A longitudinal Analysis. The Journal of Developing Areas 41: 45–68. [Google Scholar] [CrossRef]
  41. Lucas, Robert E. 1988. On the mechanics of economic development. Journal of Monetary Economics 22: 3–42. [Google Scholar] [CrossRef]
  42. Mammen, Kristin, and Paxson Christina. 2000. Women’s Work and Economic Development. The Journal of Economic Perspectives 14: 141–64. [Google Scholar] [CrossRef] [Green Version]
  43. Mansour, Sari, and Diane-Gabrielle Tremblay. 2018. Psychosocial safety climate as resource passageways to alleviate work-family conflict: A study in the health sector in Quebec. Personnel 47: 474–93. [Google Scholar] [CrossRef]
  44. Nassar, Heba. 2003. Egypt: Structural Adjustment and Women’s Employment. In Women and Globalization in the Arab Middle East. New Cairo: American University in Cairo, pp. 95–118. [Google Scholar]
  45. République du Sénégal. 2014. Plan Sénégal Emergent; Dakar: Ministère de l’économie et des Finances et du Plan.
  46. Romer, Paul M. 1986. Increasing Returns and Long-Run Growth. Journal of Political Economy 94: 1002–37. [Google Scholar] [CrossRef] [Green Version]
  47. Sall, Mame Cheikh Anta. 2018. Disparités salariales et genre sur le marché du travail au Sénégal. Revue d’Economie et de Gestion (REG) 2: 1–16. [Google Scholar]
  48. Solow, Robert M. 1956. A Contribution to the Theory of Economic Growth. Quarterly Journal of Economics 70: 65–94. [Google Scholar] [CrossRef]
  49. Suwa, Akiko. 1991. Les modèles d’équilibre général calculable. In Economie & Prévision. n°97. Numéro Thématique: L’économie du développement, pp. 69–76. [Google Scholar]
  50. Tam, Henry. 2011. U-shaped Female Labor Participation with Economic Development: Some panel Data Evidence. Economics Letters 110: 140–42. [Google Scholar] [CrossRef]
  51. Tansel, Aysit. 2002. Economic Development and Female Labor Force Participation in Turkey: Time-Series Evidence and Cross-Province Estimates. Working Paper in Economics. Hong Kong: Economic Research Center. [Google Scholar]
  52. Verme, Paolo. 2015. Economic Development and Female Labor Participation in the Middle East and North Africa. A Test of the U-shape Hypothesis. IZA Journal of Labor and Development 4: 1–21. [Google Scholar] [CrossRef] [Green Version]
  53. Wolch, Jennifer R., and Michael J. Dear. 2014. The Power of Geography: How Territory Shapes Social Life. London: Routledge. [Google Scholar]
  54. World Economic Forum. 2015. The Global Competitiveness Report 2015–2016. Geneva: The World Economic Forum. [Google Scholar]
Figure 1. Evolution of the activity rate by gender. Source: Authors, based on ANSD data.
Jrfm 14 00580 g001
Figure 2. Evolution of the employment rate by gender. Source: Authors, based on ANSD data.
Jrfm 14 00580 g002
Figure 3. Evolution of the unemployment rate by gender. Source: Authors, based on ANSD data.
Jrfm 14 00580 g003
Figure 4. Change in GDP (in% compared to the BAU scenario). Source: Authors, based on simulations.
Jrfm 14 00580 g004
Figure 5. Evolution of sectoral added value (in% compared to the BAU scenario). Source: Authors, based on simulations.
Jrfm 14 00580 g005
Figure 6. Evolution of labor demand from segments of the labor market (in% compared to the BAU scenario). Source: Authors, based on simulations. Note: CSI = senior executive and engineer; CMAM = middle manager and supervisor; EOQ = employee and skilled worker; EOSQ = employee and semi-skilled worker; Man = maneuver; Ind = independent; AF = family helpers; App = apprentice.
Jrfm 14 00580 g006
Table 1. Increase in sectoral public investment.
Activity AreaThe Average Change in Sector Investment between 2010–2013 and 2014–2016
Agriculture+30%
Mines and industries+100%
Fisheries–aquaculture+28%
Highways-roads+35%
Ports–airports+41%
Digital Economy+32%
Source: Direction de la Prévision et des Etudes Economiques (DPEE 2018).
Table 2. Evolution of the wage rate according to the labor market segments (in % compared to the BAU).
Labor Market Segments20142015201620172018
CSI_H0−0.2420.1190.2850.377
CSI_F0−0.1580.3180.6461.091
CMAM_H0−0.2680.050.1590.138
CMAM_F0−0.240.1150.2780.371
EOQ_H00.0790.711.3082.345
EOQ_F00.1050.7551.3912.52
EOSQ_H00.0320.6091.1262.01
EOSQ_F00.0870.7141.3172.384
Man_H0−0.0040.6191.1612.01
Man_F0−0.0040.5941.1252.024
Employer_H0−0.0680.4640.8881.559
Employer_F00.0390.6981.3182.432
Ind_H0−0.39−0.261−0.424−0.976
Ind_F0−0.1280..3240.6311.07
AF_H00.0010.3110.3970.034
AF_F00.4041.1621.9433.137
App_H00.7441.8823.2565.796
App_F00.6741.7012.9365.226
Others_H00.270.821.3762.323
Others_F00.5231.3682.3514.163
Source: Authors, based on simulations.
Publisher’s Note: MDPI stays neutral with regard to jurisdictional claims in published maps and institutional affiliations.

