Article

GARCH (1,1) Models and Analysis of Stock Market Turmoil during COVID-19 Outbreak in an Emerging and Developed Economy

by
Budi Setiawan
1,2,*,
Marwa Ben Abdallah
1,*,
Maria Fekete-Farkas
1,
Robert Jeyakumar Nathan
3 and
Zoltan Zeman
1
1
Doctoral School of Economic and Regional Sciences, Hungarian University of Agriculture and Life Sciences, 2100 Godollo, Hungary
2
Faculty of Economics, Universitas Indo Global Mandiri, Palembang 30129, Indonesia
3
Faculty of Business, Multimedia University, Melaka 75450, Malaysia
*
Authors to whom correspondence should be addressed.
J. Risk Financial Manag. 2021, 14(12), 576; https://doi.org/10.3390/jrfm14120576
Submission received: 21 October 2021 / Revised: 19 November 2021 / Accepted: 21 November 2021 / Published: 1 December 2021
(This article belongs to the Special Issue Economic and Financial Implications of COVID-19)

Abstract

:
COVID-19 pandemic has led to uncertainties in the financial markets around the globe. The pandemic has caused volatilities in the financial market at varying magnitudes, in the emerging versus developed economy. To examine this phenomenon, this study investigates the impact of COVID-19 pandemic on stock market returns and volatility in an emerging economy, i.e., Indonesia, versus developed country, i.e., Hungary, using an event-study approach methodology utilizing GARCH (1,1) model. In this study, the Jakarta Composite Index (JCI) and the b (BUX) data were obtained from Investing and Bloomberg, covering two global events observed within the selected period from 27 September 2006 to 31 August 2021. The data is compared with the stock market volatility data from the global financial crisis in 2007/08. Findings reveal that the recent COVID-19 pandemic had negative stock market returns at a greater magnitude compared to the global financial crisis, in both the emerging and developed economy’s equity market. Stock markets in Indonesia and Hungary have experienced volatility during the crisis. While comparing the result between COVID-19 and the global financial crisis, we found that the volatility on the stock markets is higher in the COVID-19 pandemic than during the global financial crisis. The higher stock market negative returns and volatility during the COVID-19 pandemic triggered the lockdown and limited economic activities, which impacted supply and demand shock. The virus’s propagation and mutation are continually evolving, reminding us that the pandemic is far from over. Developed countries with larger fiscal space seem to find it easier to make responsive policies than countries with a tighter financial budget. Fiscal and monetary policies seem to be a quick solution to stabilize the economy and maintain investor confidence in the Indonesian and Hungarian capital markets. Furthermore, the extension of stock market volatility understanding ensures relevant information for investors, which benefits to mitigate the risk and build sustainable investments of the unprecedented events and enables the promotion of Sustainable Development Goal number 8 (SDG8) to communities, with access to financial products including the stock market, especially during economic and financial uncertainties.

1. Introduction

The World Health Organization (WHO) announced the COVID-19 outbreak for the first time on 31 December 2019. Initially, COVID-19 was only considered an epidemic when the virus’s spread stayed limited in Wuhan, China. On 26 February 2020, the virus spread to all continents, except Antarctica. After that, WHO upgraded the status of COVID-19 from epidemic to global pandemic on 11 March 2020, Worldometer, as one of the organizations that actively provides the latest news related to COVID-19, states that there have been more than 150 million positive cases of COVID-19 with a death rate of more than three million people by the end of April 2021. In addition, the first infection of the virus spread to Indonesia and Hungary, the two countries in the center of ASEAN and Europe, occurred in the same month, in March 2020. Information about the COVID-19 update in Indonesia, Hungary, and the world is presented in Table 1.
The first cases of COVID-19 in Indonesia and Hungary occurred in the first week of March 2020. The number of positive cases of COVID-19 in Indonesia reached more than 1.6 million people, and Hungary had more than 700,000 people as of the end of April 2021. The average death rate in Hungary reaches 169 people per 1 million population, compared to Indonesia with 164 deaths. The increasing number of new cases of COVID-19 has encouraged WHO to recommend the government take precautionary measures to reduce the spread of COVID-19. The approaches recommended by WHO include imposing social distancing, limiting non-essential travel, wearing masks, and closing schools, and prohibiting activities that create crowds (Baker et al. 2020).
Restrictions on mobility and business activities have the potential to reduce the spread of the COVID-19 new case as well as causing negative consequences for the economy (Chang et al. 2020). The negative economic growth worldwide reflects a decline in economic activity, which has disrupted financial market stability and the stock market. The stock market is a platform on which public companies are traded. The equity market is viewed as an essential variable for the financial sector and has a vital role in the economy (Twerefou and Nimo 2005). The Morgan Stanley Composite Index (MSCI), which is considered a barometer of the global capital market performance, grew-21%, and the MSCI Emerging Market performed −24% in the first quarter of 2020.
Jakarta Composite Index (JCI) and Budapest Stock Exchange (BUX) are the leading capital market indices in Indonesia and Hungary. The stock markets in these countries have a long history that can be traced back to more than 100 years ago. The JCI first operated in 1912, and BUX was founded in 1864. The capital markets in Indonesia and Hungary had been inactive for several years as economic and political dynamics changes. The capital market in Indonesia was re-active at the end of 1983, marked by the initial listing of JCI, while the Hungarian stock market was a break during the socialist system, and it re-opened again in early 1990.
Geographically, Indonesia and Hungary are two countries strategically located on the continents of Asia and Europe. Economically, Indonesia is included in the list of middle-income group countries, while Hungary is recognized as a high-income country with Gross National Income (GNI) per capita of USD 4.050 and USD 16.140 in 2019. The World Bank defines a high-income country when the GNI per capita is more than USD 12,536 (World Bank 2021). Even though Indonesia has a lower per capita income than Hungary, the percentage of market capitalization value of listed domestic companies to Indonesia’s Gross Domestic Product (GDP) is higher than Hungary, accounting for 47% compared to 18% in 2020. Furthermore, the liquidity of the capital market in Indonesia by proxy of the percentage of total stock traded to GDP reached 12.4% in 2020, compared to Hungary’s 7.3% in the same year. Therefore, it is interesting to compare the reaction of the Indonesian and Hungarian capital markets from the point of view of return and volatility, especially during the COVID-19 pandemic. This information will be helpful for investors to diversify their financial portfolios, especially during the market shock.
The stock market fluctuation was triggered by the spread of news about the increasing number of positive cases and deaths of COVID-19. The study of (Yilmazkuday 2020) looked at the Standard & Poor’s 500 index’s responses daily, weekly, and monthly to the global death rate due to COVID-19. Finding reveals that each 1% increase in mortality resulted in a decrease in cumulative returns of 0.02% after one day, 0.06%, and 0.08% after a week and a month, respectively. (O’Donnell et al. 2021) investigates the stock market in five regional epicenters, plus the MSCI World Index, reveals total cases of COVID-19 explain changes in stock prices in Spain, Italy, Britain, and the United States, but not in China and world stock indices. In contrast, Cookson et al. (2020) find evidence that the COVID-19 pandemic has no effect on the stock market in China, and the Vietnamese government’s decision to lockdown to prevent the spread of COVID-19 has a positive and significant impact on the stock market.
Further, Czech et al. (2020) depict an increase in the number of COVID-19 cases has a negative and significant correlation to the capital market in the Visegrad countries. In addition, a recent study by Liu et al. (2020) investigated the stock market response to the short-term of the COVID-19 pandemic by dividing the observation period into five-event windows for a total of 35 trading days after the event date. The study found that the COVID-19 outbreak harms the stock markets of 21 countries in the world, including Indonesia. Whilst Chaudhary et al. (2020) apply the GARCH method to measure the stock market volatility amid COVID-19, find that stock market risk in the top 10 countries based on GDP is higher during the COVID-19 pandemic than the normal period.
Due to the fact that the COVID-19 pandemic is very recent, thus far, few studies have analyzed the stock market response to the COVID-19 outbreak as it is still developing. We expect this study to fill the gap and provide the novelty in the following contribution as follows: (1) investigating the stock market reaction in an emerging country (Indonesia), and a developed economy (Hungary), (2) comparing the stock market response to COVID-19 during the epidemic, pandemic, and global financial crisis; (3) analyzing the stock market volatility before and during an extraordinary health event and financial crisis. Recent studies also highlight the benefits of cross-national studies that analyze emerging and developed economies. Such comparative studies are found to provide specific recommendations that are beneficial to both countries as well as the regions (Nathan et al. 2019; Lee et al. 2020; Nathan et al. 2021).
This study is also motivated by the need for more comprehensive information on the response of financial markets to unexpected or unpredictable events. This information plays a pivotal role in expanding financial literacy which is essential for investors’ analysis before making investment decisions in the capital market. Exploring the best practices of financial literacy and inclusion is in line with United Nations Sustainable Development Goals (UNSDGs), goal number eight on promoting access to formal financial services and financial development including stock market (Klapper et al. 2016).
This research paper is structured in the following sections: Section 1 explains the research background and the novelty of the study. Section 2 presents a critical review of previous literature in this area of research to form at heoretical background. The third section deals with the data and research methodology, and Section 4 displays empirical results based on statistical analysis; and finally Section 5 presents the conclusion, limitations, and suggestions for future study.

2. Literature Review

The shock in the financial market due to COVID-19 has reignited interest in empirical research. Interestingly, this outbreak has permeated into the sphere of the stock market, which has been viewed as one of portfolio assets diversification. Efficient market hypothesis (EMH) theory assumes that a stock’s price fully reflects all relevant market information (Fama 1970). However, the theory has faced pros and cons. For example, Malkiel (2003); Charfeddine et al. (2018); Chu et al. (2019) find that stock and other financial markets, such as bond and cryptocurrency, are efficient, while other studies reveal the equity price is not only incorporated with the information in the market but also as a result of psychological and behavioral finance (Shiller 2003; Can and Dizdarlar 2021; Khan et al. 2021). The discussion on the theory is still ongoing and has no ultimate conclusion of academic researchers and financial practitioners; therefore, this study contributes to a better understanding of the stock market’s return and volatility.

2.1. COVID-19 Pandemic and Its Impact on Stock Market

Previous research related to the impact of COVID-19 on the stock market is still developing. However, cases of similar pandemics have occurred since the 13th century, for example, the Black Death pandemic, the 1918 Spanish Flu, to SARS. Chen et al. (2007) investigate the impact of the SARS virus on the Taiwanese hotel stock performance using an event study approach. The result states that SARS has a significantly negative impact on the Taiwanese stock market. A study related to the stock market and COVID-19 conducted by Liu et al. (2020) explained that capital markets in developed countries (Japan, America, Germany, Italy, and the UK) were quickly affected by COVID-19. Another study carried out by Baker et al. (2020) depicts that COVID-19 has the greatest negative impact on the capital market, even greater than other extraordinary health events, including the Spanish Flu. Besides, the COVID-19 pandemic is an event that has the greatest negative impact on the stock market, compared to the Swine influenza, Ebola, and Zika viruses (Schell et al. 2020).
New evidence from (Ramelli and Wagner 2020) finds that globally oriented companies that have exposure to China have experienced a decline in stock returns. On the contrary, companies dealing with natural gas, software, food, and healthcare sectors in America achieved positive returns during the COVID-19 pandemic (Mazur et al. 2021). Companies with social trust also had better performance with a higher stock return of 3% to 4% than companies with a lower level of social trust (Mazumder 2020). In addition, (Thorbecke 2021) compared the response of capital markets in South Korea and France by analyzing the exposure of stock returns to the COVID-19 pandemic. The study found that the stock market in South Korea has more resilient than the France stock market during the pandemic.

2.2. COVID-19 and Stock Market Volatility

The volatility of financial assets is a level of price movement where high volatility when changes in the price of financial assets occur over a broad range over time. Xiao and Aydemir (2007) explain that financial volatility is often associated with a simple risk measure, although the two are different. The higher the volatility, the more risky financial asset prices are. Understanding stock market volatility is a crucial factor in making investment decisions (Hatch et al. 2018). The method proposed by (Engle 1982) regarding autoregressive conditional heteroscedasticity (ARCH), and is developed by Bollerslev (1986) to generalized autoregressive conditional heteroscedasticity (GARCH) become a pioneer in measuring the volatility of financial assets which is still being applied today.
GARCH models have been used to catch the price volatility of different commodities and assets. It was proved that GARCH model is a suitable approach to detect the volatility along the meat supply chain (Ben Abdallah et al. 2020). Also, it was a convenient model to examine the relationship between macroeconomic determinants and the Bulgarian stock market index (Hsing 2011). For instance, the GARCH model for forecasting the volatility of the Islamic stock index (Saleem et al. 2021); Bitcoin (Aras 2021); bond yield (Kim et al. 2021). Different GARCH models serve as a tool to describe the volatility movement (i.e magnitude and speed) of financial time series. The EGARCH model helped to detect the volatility magnitude of banking stock prices in Pakistan (Mohsin et al. 2020). ARMA-GARCH model was used by Fink et al. (2017) to predict the magnitude of uncertainty of the stock market. For nearly every major stock market there exist equity and implied volatility indices (Fink et al. 2017). The specificity of Markov-Switching GARCH has been proved that it allows the examination of the time variation and non-linear financial stock market (Haas et al. 2004). The stationarity condition should be satisfied before the estimation of GARCH model. It is proved that GARCH models help to forecast and simulate the volatility of financial returns (Mittnik et al. 2002).
Chaudhary et al. (2020) used GARCH (1,1) to analyze stock indices’ volatility during the COVID-19 pandemic. Using data on the top 10 countries based on GDP from January 2019 to June 2020, revealed that the volatility during COVID-19 is higher than the normal period. The new evidence from (Dungore and Patel 2021) estimates the volatility volume and open interest for the Nifty Index future on India’s National Stock Exchange by applying the GARCH model. They suggest that volume has a stronger impact on volatility than open interest or the outstanding unclosed futures market contracts. A long-term perspective of stock market volatility was conducted by (Bai et al. 2021), focus on the infection pandemic and volatility on the US, China, UK, and Japan equity market from 2005 to 2020 by applying GARCH-MIDA. They find that there is a significant positive impact on the permanent volatility of international stock markets up to 24-month lag of pandemic. Gunay et al. (2021) analyzed the volatility of capital markets in Australia during the first wave of COVID-19. Data were analyzed using the Modified Iterative Cumulative Sum of Squares (MICSS), reveal that structural breaks in volatility in many sectors, except for the consumer goods sector, information technology, and property.
This study further expands the scope of previous works by looking at stock market volatility using GARCH for multiple events. The global financial crisis is measured by looking at volatility when there wasan increase in LIBOR-OIS- denote as GFC (first event) and Lehman Brothers bankruptcy, while the volatility during the COVID-19 outbreak is divided into epidemic and pandemic periods. Furthermore, this study considers a recent dataset until 31 August 2021to provide a more recent account of this phenomenon.

3. Data and Methodology

This study uses secondary data obtained from Investing and Bloomberg. The data includes the daily close stock price of Jakarta Composite Index (JCI) which presents Indonesia stock market data; and Budapest Stock Exchange (BUX) as a proxy of the stock market in Hungary. The Morgan Stanley Composite Index Emerging Market (MSCIEM) represents a global market index to measure the market return. Daily stock prices are carried out because they provide a more accurate analysis to describe the event’s market response. The collected data is then analyzed using two methodologies, namely the event study to investigate cumulative abnormal returns and GARCH (1,1) to analyze the volatility of the Indonesian and Hungarian capital markets during the COVID-19 outbreak and the global financial crisis.

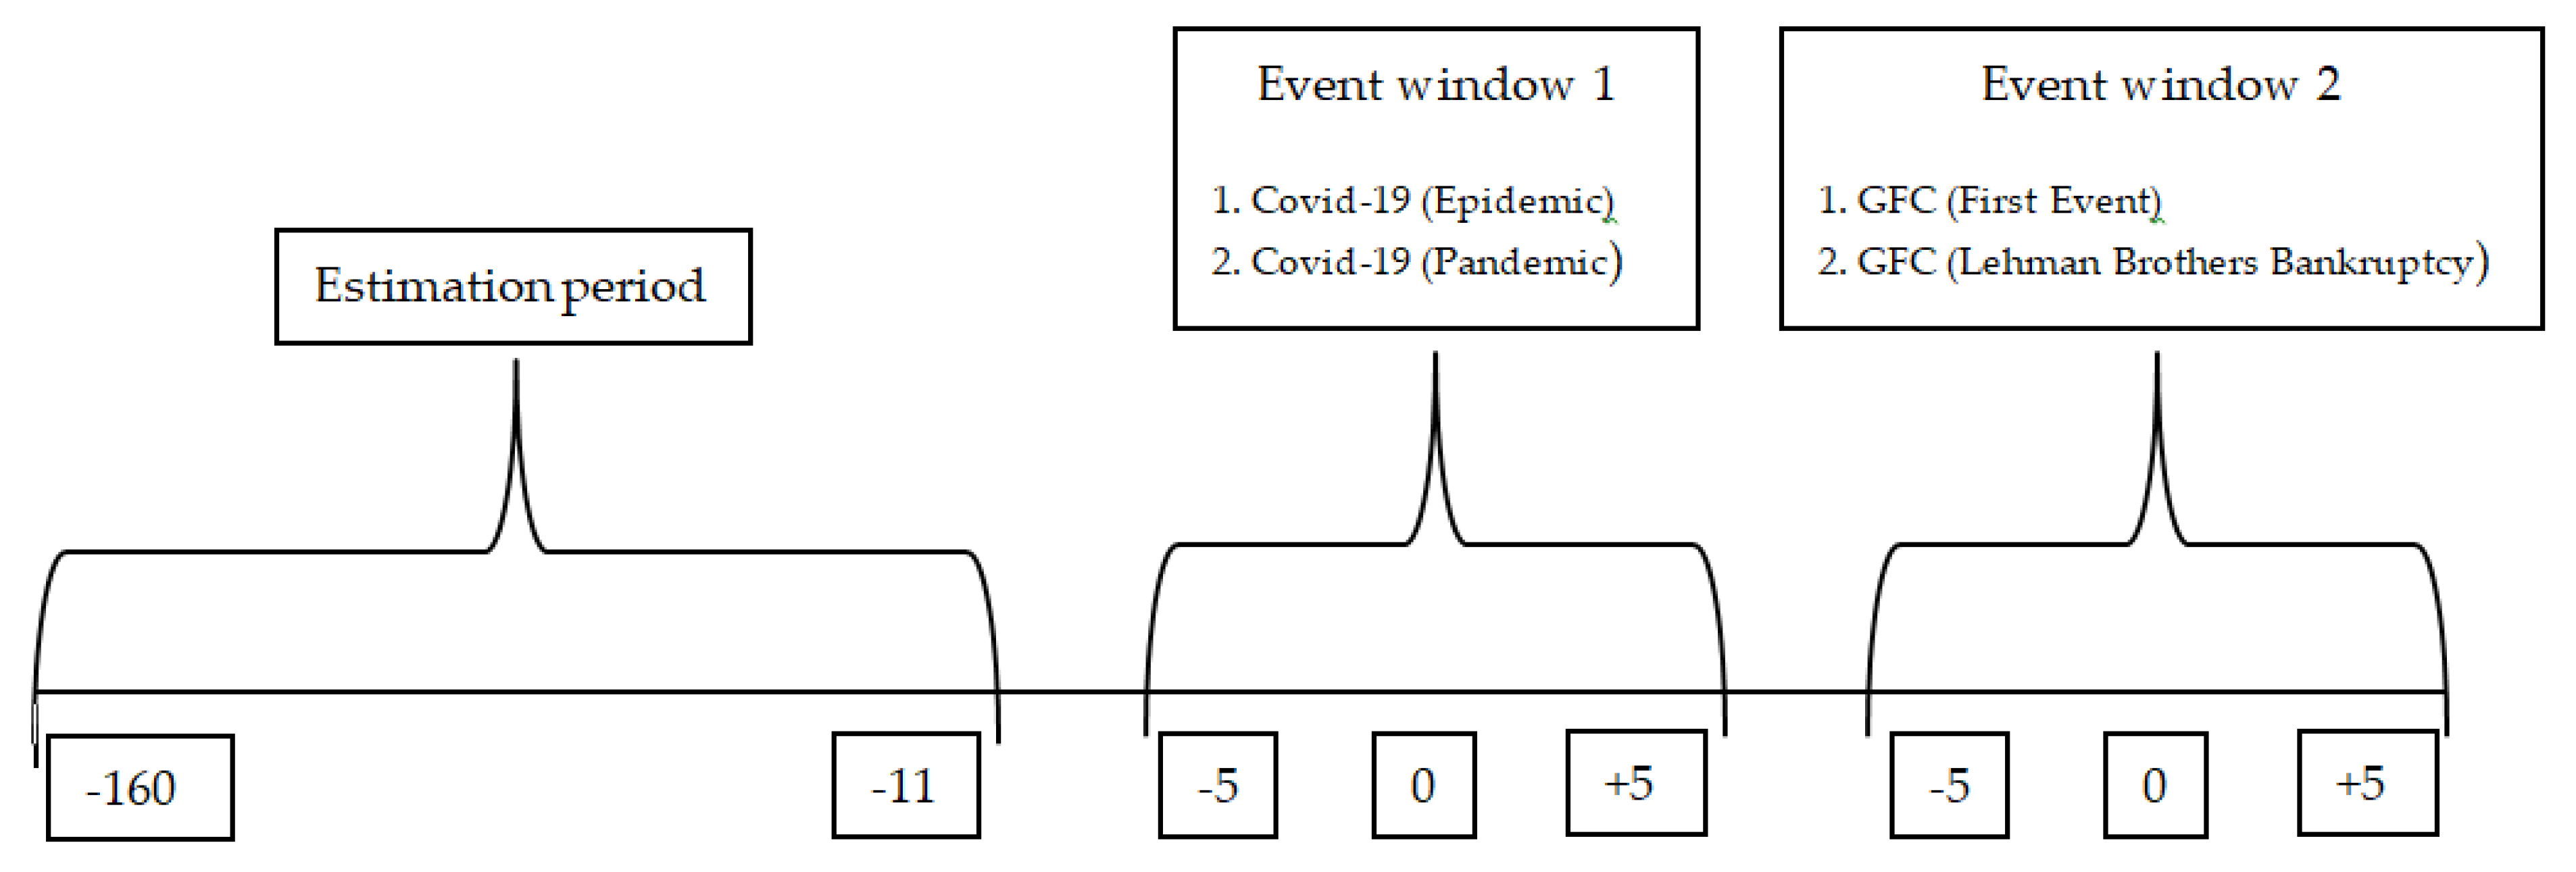
3.1. Event Study Set-Up

The event study is used to test market efficiency as captured from Indonesian and Hungarian stock market reactions during the COVID-19 and global financial crisis. This method is implemented to analyze stock prices’ reaction when the events occur (observation period) compared to normal conditions (estimation period). Event study calculations are carried out sequentially by calculating: Return (Ri,t), Expected Return (Er), Abnormal Return (ARi,t), Cumulative Abnormal Return (CAR), and finally, testing the significance of abnormal return within the event window or observation period. In this study, we evaluate the event study methodology by following Ullah et al. (2021).

3.1.1. Identifying the Event

In general, this paper investigates two main events related to COVID-19 (2 May 2019 to 31 August 2021) and global financial crisis (27 September 2006 to 22 September 2008).

3.1.2. Selecting the Estimation and Events

The estimation period for daily event studies can be from 100 to 300 days, and the event period ranges from 2 to 121 days (Chang et al. 2018). For this study, we used 150 days as the estimation period (−160 to −11), and 5 days from −10 to −6 is defined as the gap period between the estimation period and the event window. The event window is then defined from −5 to +5, where t = 0 denotes as event date as prescribed by (Feria-Domínguez et al. 2020). Khotari and Warner (2006) explain that the short-term period, for instance, 11 days, is acceptable to measure the impact of a specific event on the stock price.

3.1.3. Estimation Parameters

This study devides tha event into two parameters; first, the event window related to the COVID-19 epidemic began when WHO announced the first COVID-19, 31 December 2019 (−5, +5); and the event window when WHO announces COVID-19 as a global pandemic on 11 March 2020 (−5, +5). Second, the event window for the first global financial crisis is defined when there was an increase in LIBOR-OIS on 1 June 2007 (−5, +5), abbreviated as GFC (first event). Furthermore, the second event window was drawn on 15 September 2008, when Lehman Brothers has declared bankruptcy. The event study period is displayed in the Figure 1.

3.1.4. Data Analysis

The first step of event study in the market model is calculating the stock market returns. The daily return for a stock market index is calculated as follows:
Rt = (Pt − Pt−1)/Pt−1 ∗ 100
where, Pt is denoted as the price of the Jakarta Composite Index (JCI) or Budapest Stock Exchange (BUX) in the current time frameand Pt−1 is the price of each stock market in the previous period. So, the daily return for the stock market index can be calculated through Equation (2).
Rmt = (Pt − Pt−1)/Pt−1 ∗ 100
Rmt represents the daily actual return of Morgan Stanley Capital International Emerging Market (MSCIEM) as a proxy of the market return. The next step is calculating the expected return as follow:
E ( R i , t ) = α ^ i + β ^ i R mt
The expected return is calculated by using the market model. In this study, MSCIEM represents the market index. After obtaining the expected return, we can calculate the abnormal return (ARi,t), which is displayed in Equation (4).
ARi,t = Ri,t − E(Ri,t)
ARi,t denotes the abnormal return of stock price i on day t, and Ri,t is the expected return of the stock i on day t. Then, cumulative actual return (CAR) is calculated in Equation (5).
CAR t ( t 0 , t 1 ) = t = t 0 t 1 AR i , t
This study calculates CAR for four events window, namely COVID-19 during epidemic and pandemic, and the first global financial crisis (GFC first event), and when Lehman Brothers stated bankruptcy.
t stat = C A R i ¯ standarerror
Thus, a t-test is performed to define stock market response to COVID-19 and the global financial crisis in Indonesia and Hungary with significance at 5%. The critical value for the null hypothesis rejection is ±1.96 with aconfidence level of 95%, the significance level of each event will be calculated using a statistical test based on the observed cumulative abnormal return divided by the standard error, with the significance level at 5%. If the t-test is higher than the critical value (1.96), the event has statistically significance, and if the t-test value is lower than 1.96, it means statistically insignificant (Brav and Heaton 2015; Ullah et al. 2021).

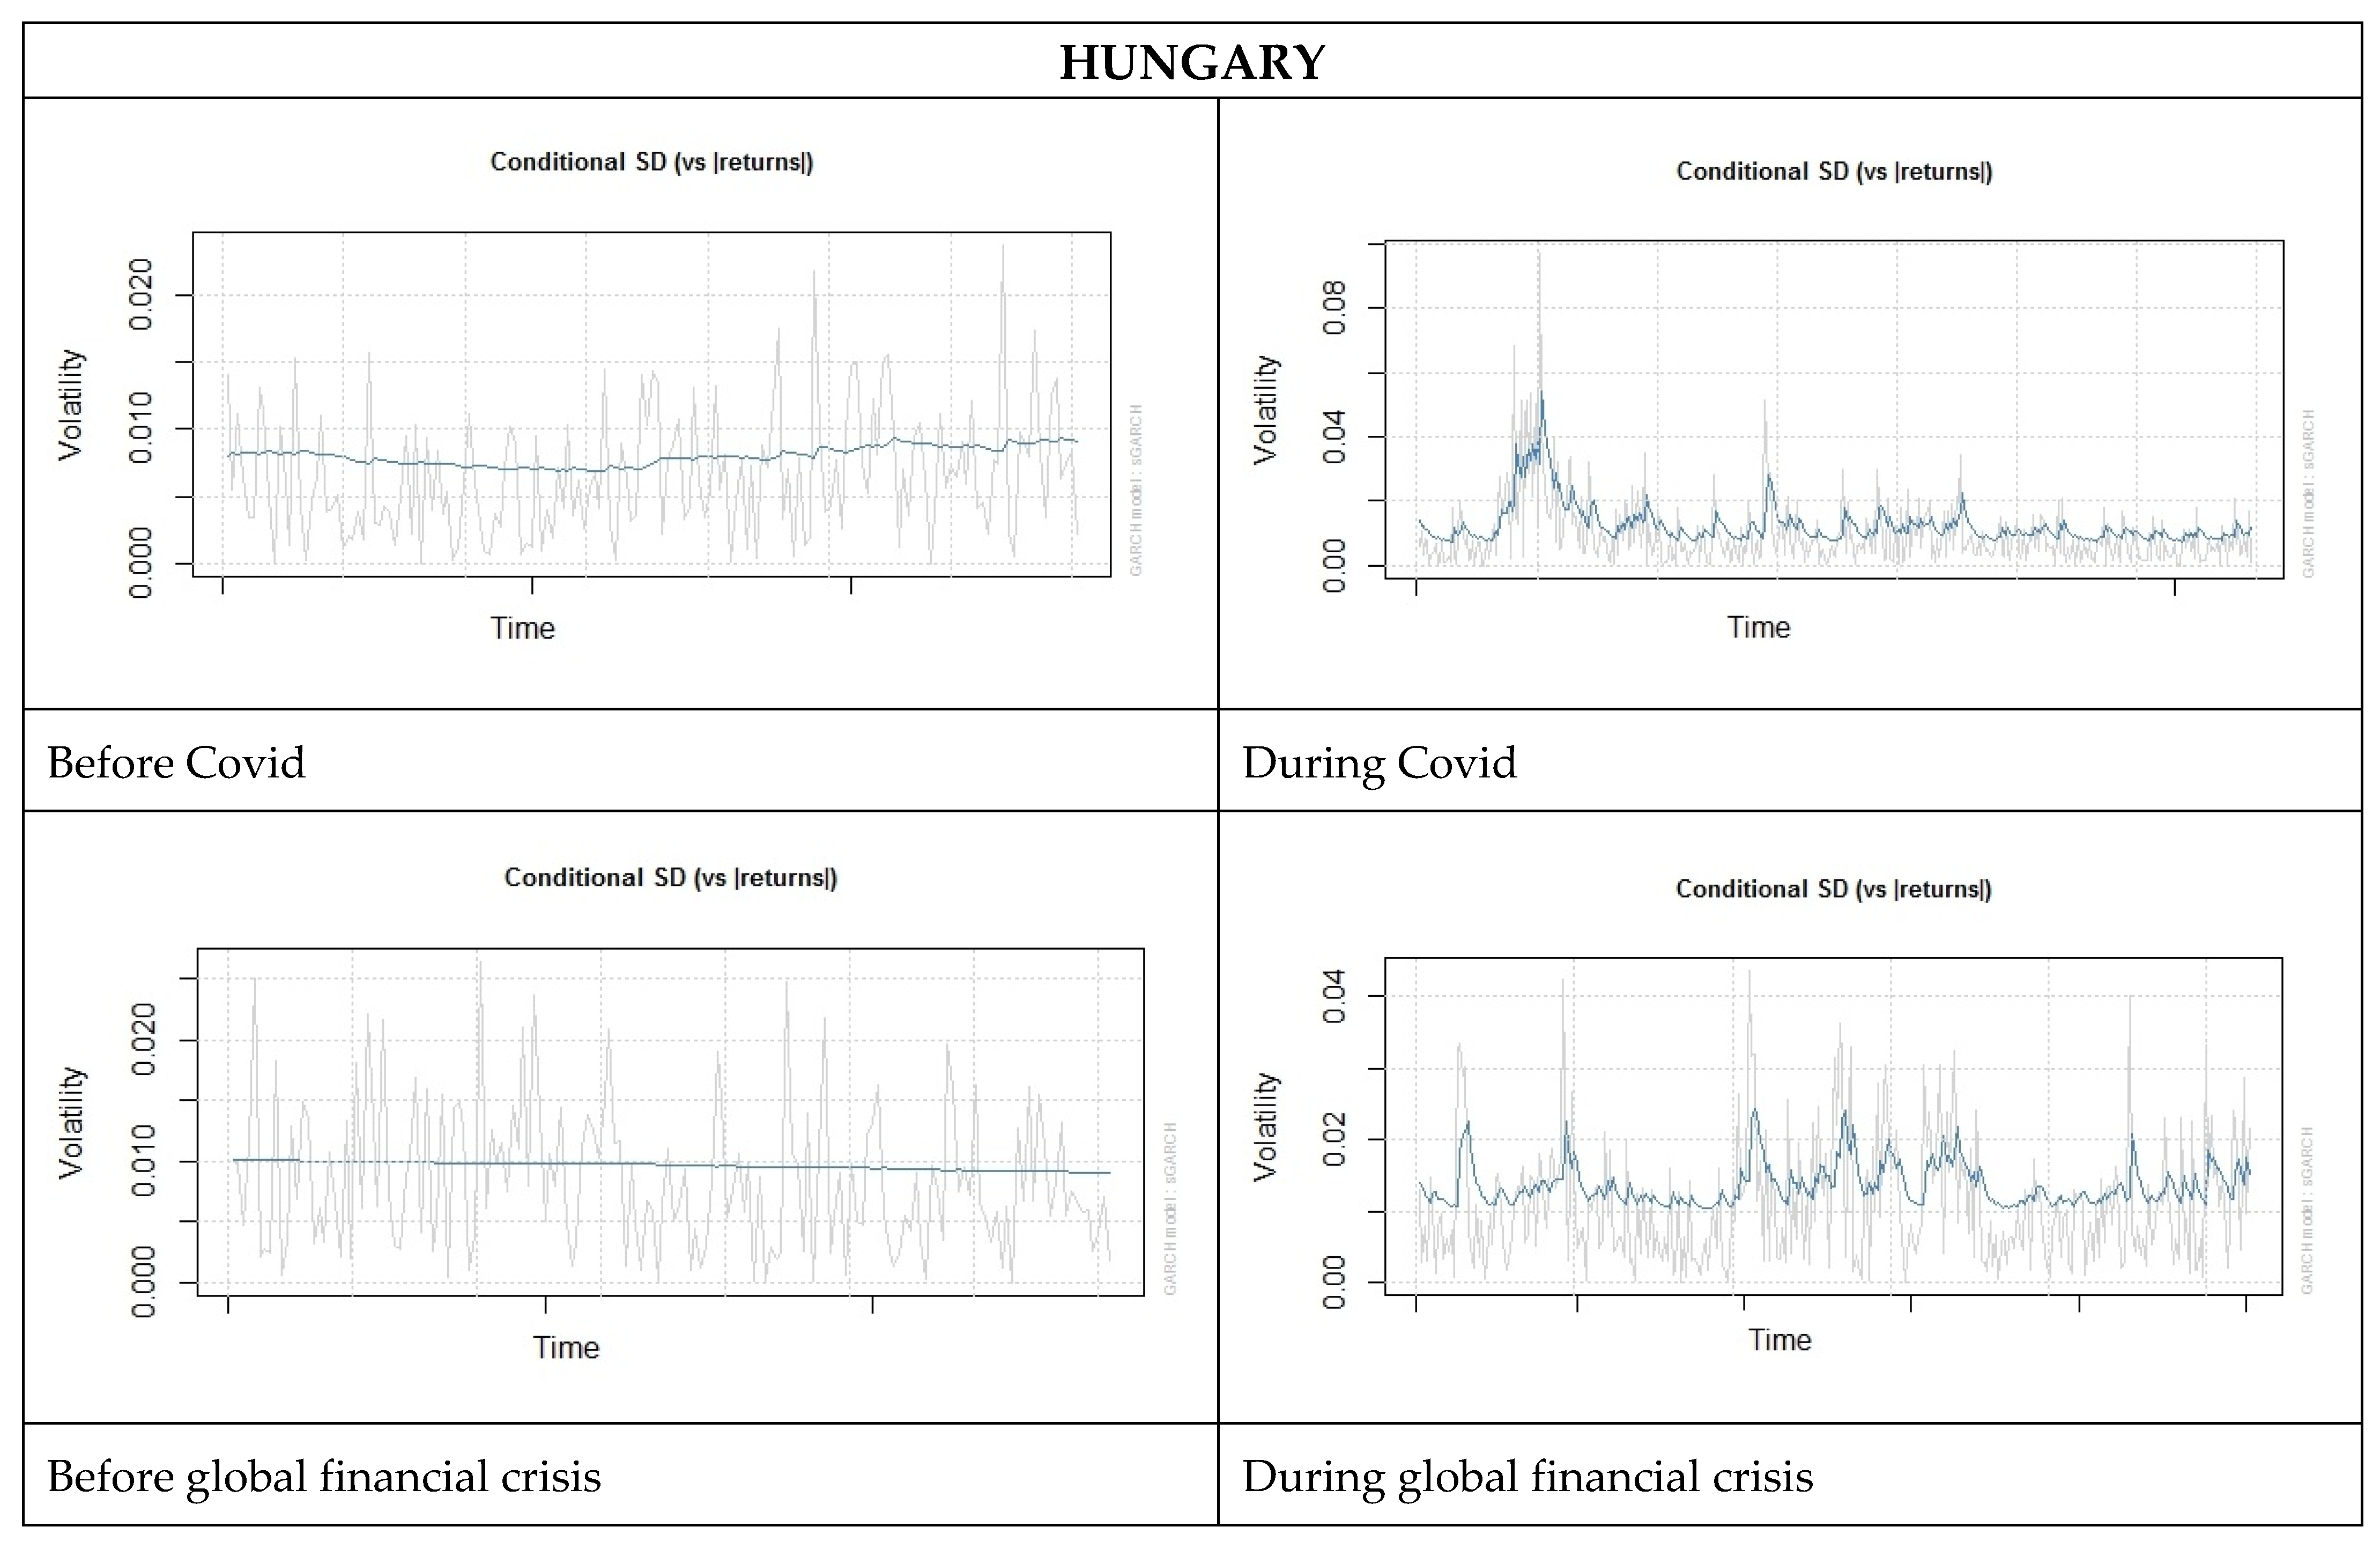
3.2. Stock Market Volatility Set-Up

For the volatility analysis, the period of the study is divided into two sections. The first part is before the COVID-19 (16 May 2019–19 December 2019) and during the COVID-19 period (2 January 2020–31 August 2021); the second section consists of before the global financial crisis (3 October 2006–14 May 2007) and during the financial crisis (4 June 2007–22 September 2008). The parameters will give comprehensive information on stock market volatility in responding to the unprecedented events from the health and finance sector. ARMA-GARCH(1,1) model has been estimated. ARMA captures the changes of the mean return, while GARCH presents the variance change of the residuals issued from the mean equation. GARCH(1,1) has been used because it is the most popular, simplest and the most robust comparing other specifications. It is sufficient to capture the volatility clustering in the data (Brooks 2008). It is expressed in the following equations (Equations (7) and (8)).
Rt = μ + ϕrt−1 + ϴ εt−1 + εt
Equation (7) is the mean equation where Rt is the return stock market, μ is a constant of the mean equation, ϕ is the autoregressive term, and ϴ is the moving average term. In our case, we took only one lag.
σt = α0 + α1εt−12 + β1σt−12
Equation (8) presents the variance equation. α0is the constant, α1 detects the ARCH effect and β1 detects the GARCH effect.
Where α0, α1 and β1 are non negative and α1 + β1 ≤ 1. The sum of α1 and β1 shows the magnitude of volatility persistance.

4. Results and Discussion

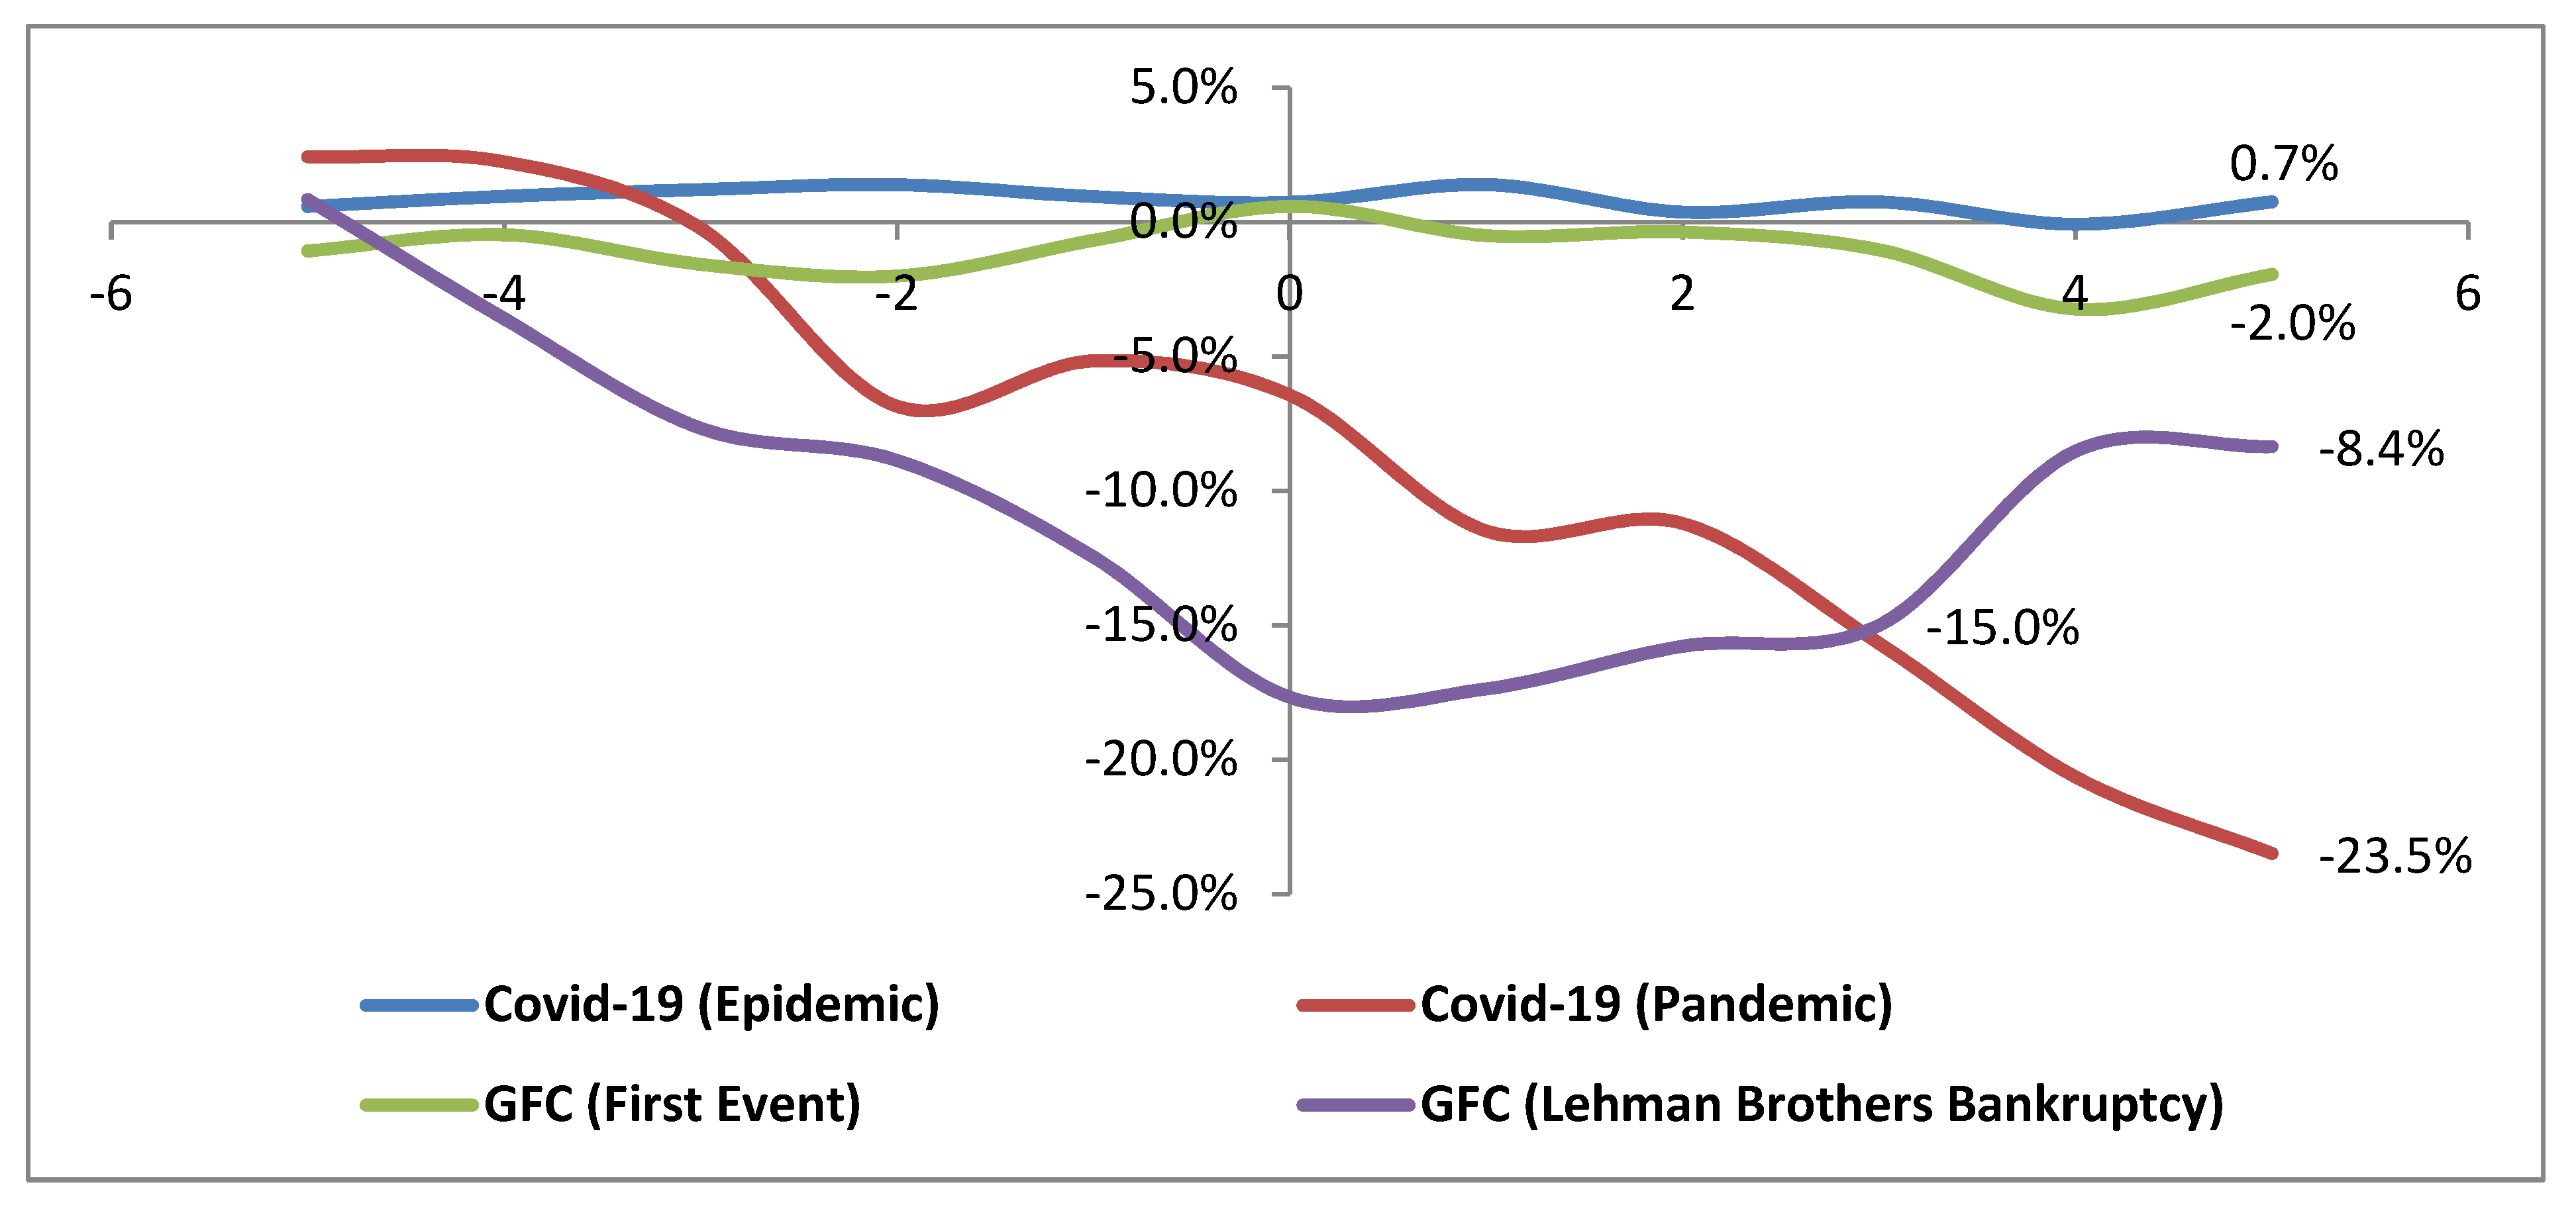
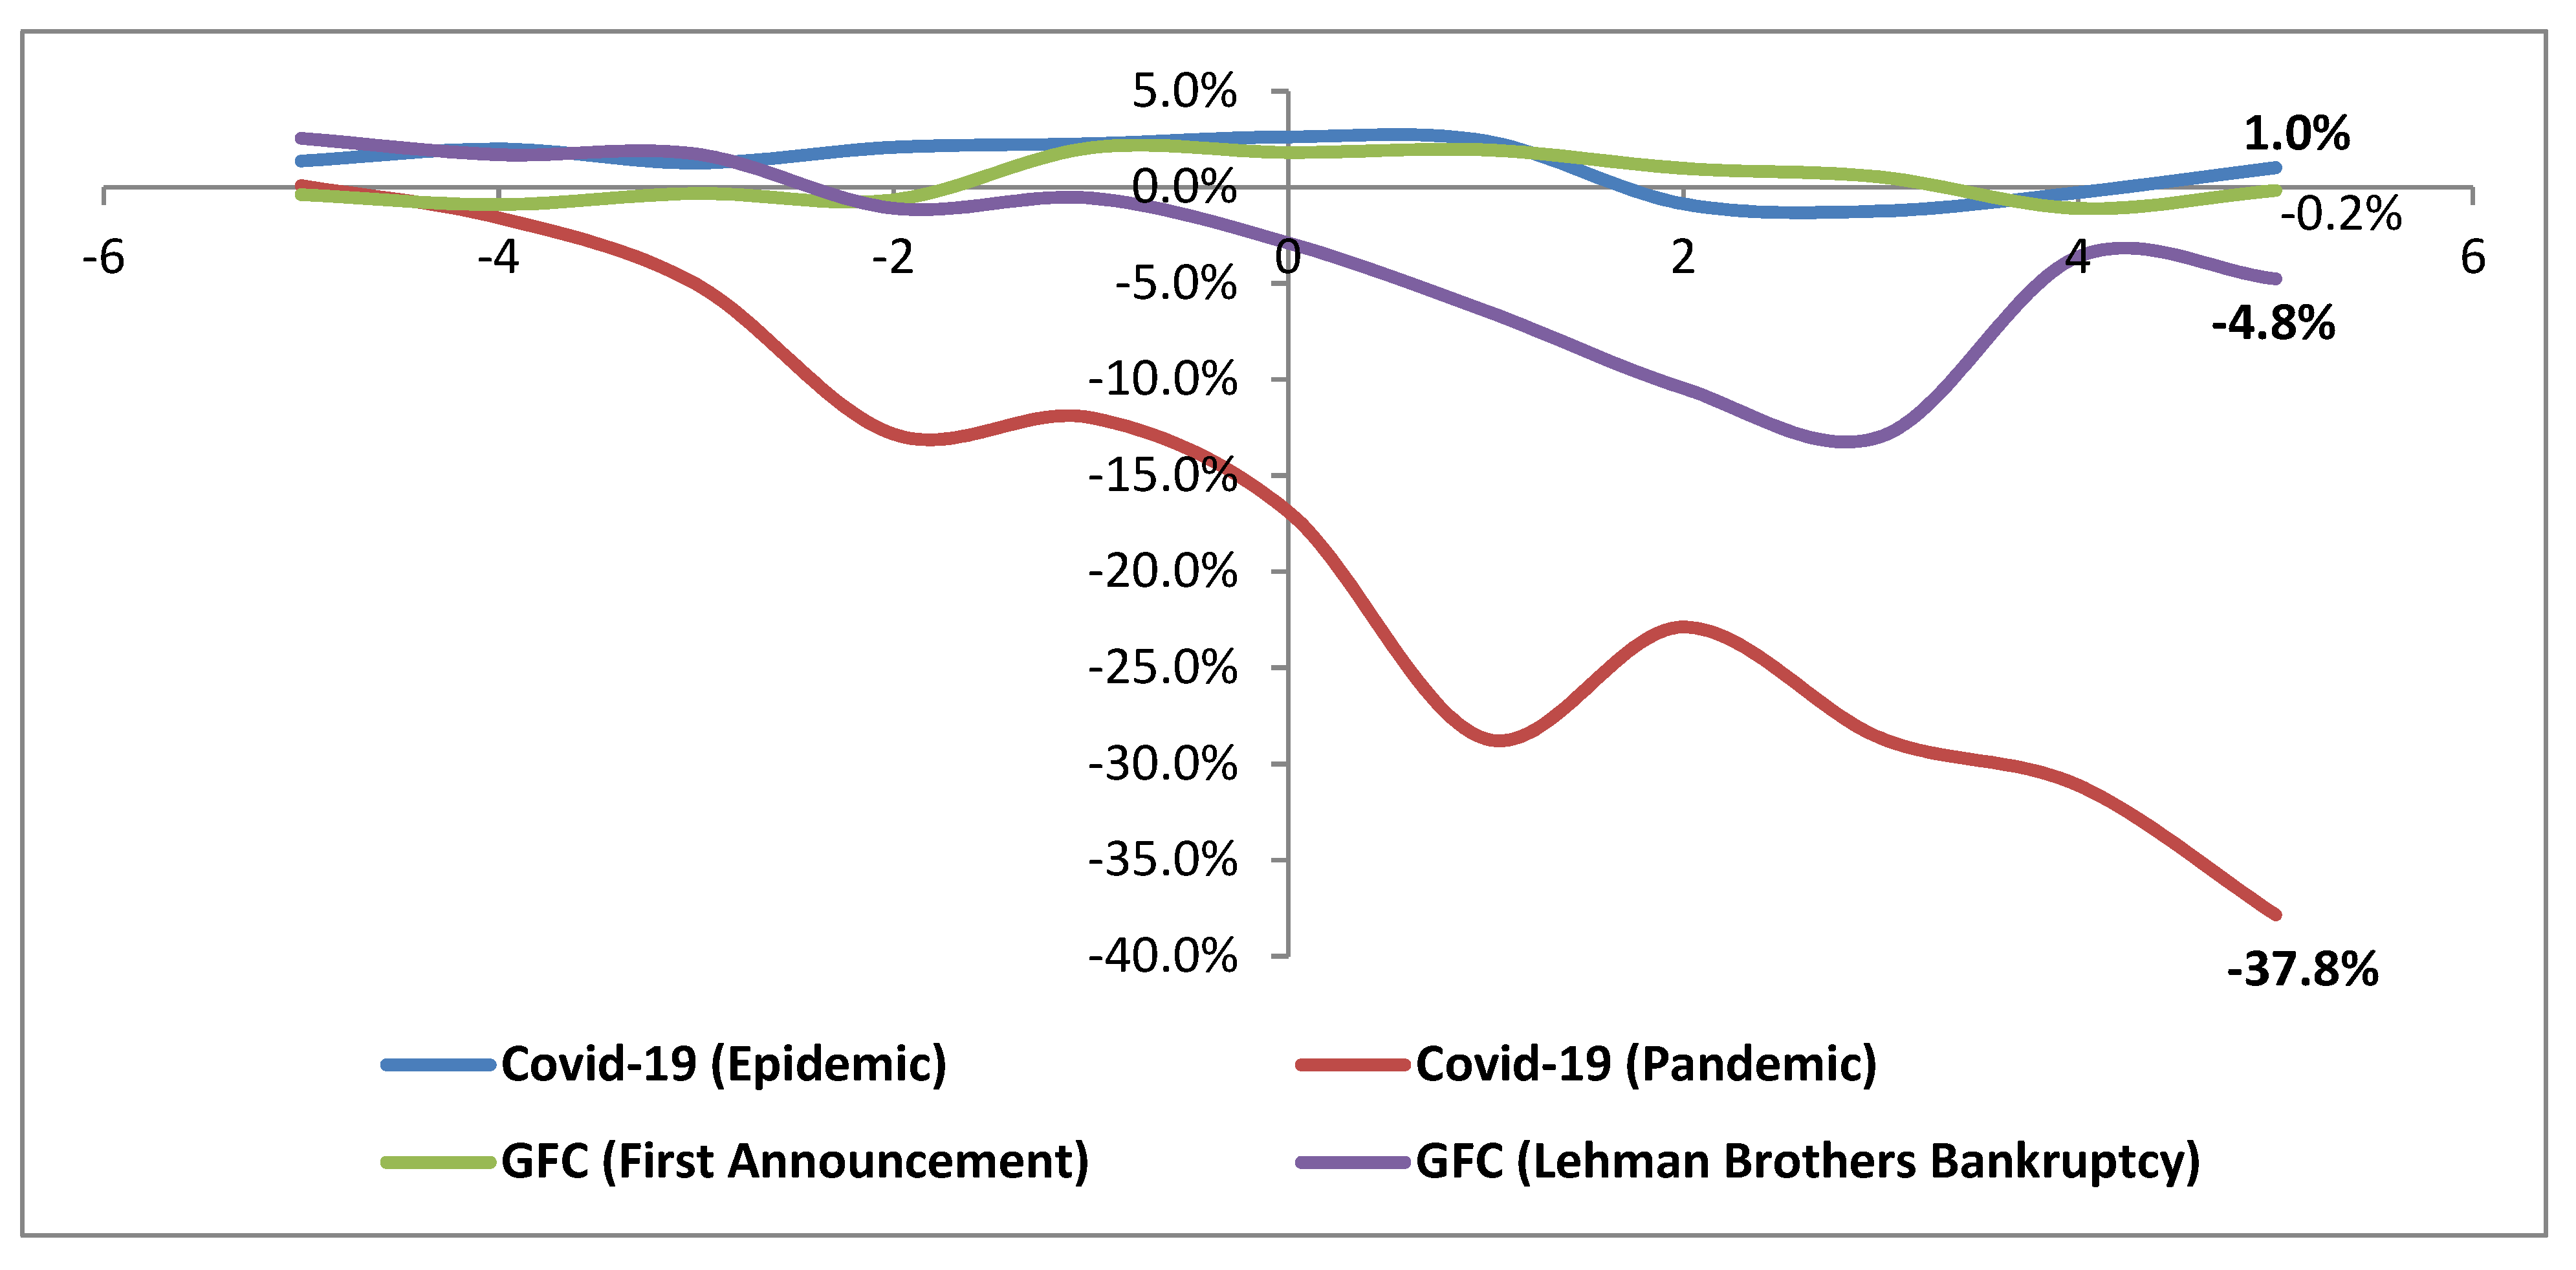
4.1. Event-Study Result

Table 2 shows the statistical summary of JCI and BUX during the COVID-19 outbreak and global financial crisis. Using the 150 days estimation window and the 11 days event window, JCI’s average return before COVID-19 was −0.03%, or 0.02% lower than the average return during the COVID-19 epidemic (−0.01%). However, the average JCI return slumped by −2.14 when the COVID-19 status become a global pandemic. In Hungary, the BUX has an average positive return of 0.01% on the 150 days during the estimation period. The BUX performance continued to be positive during the COVID-19 epidemic period, and it can be seen from the 11 days average return for the COVID-19 period of 0.10%. BUX’s performance was only bearish when WHO raised the status of the COVID-19 pandemic, where the average BUX’s return was −3.34%, even lower than JCI’s performance in the same period of −2.14%.
Unlike the average return fluctuation during the COVID-19 pandemic, JCI and BUX’s performance was relatively stable amid the global financial crisis of September 2008. The return of Indonesia and Hungary’s stock markets are still positive, with average returns of 0.03% and 0.11% during the GFC (first event). However, JCI and BUX slightly decrease when Lehman Brothers declared bankruptcy of −0.53% and −0.30%, respectively. Table 2 also illustrates that COVID-19 has a greater impact on stock market return performance than during the global financial crisis.
Table 3 depicts the average JCI and BUX returns compared to market returns with the Morgan Stanley Composite Index Emerging Market (MSCIEM) as a proxy. In general, the Indonesian and Hungarian stock markets performed lower than MSCIEM, except during the COVID-19 pandemic, JCI outperformed MSCIEM by 0.20%. Meanwhile, BUX has a better performance during the GFC (first event), with an average return of 0.01% higher than MSCIEM.
Table 4 shows that JCI and BUX have more negative abnormal returns during the COVID-19 pandemic than the epidemic. After the event date, JCI experienced negative abnormal returns four times during the COVID-19 pandemic than only two times during the epidemic period. The highest negative return occurred on the first day (+1) after the event date, JCI performance was −5.1% or higher than the abnormal return when WHO increased COVID-19 status to the pandemic by −1.3%. These findings support the efficient market theory which reveals stock prices reflect very quickly all the information (Fama 1970).
In Hungary, BUX also experienced a similar trend to JCI, except that the negative abnormal return was twice as large during the event date of the COVID-19 pandemic. BUX’s abnormal return was −4.9% when WHO announced COVID-19 as a global pandemic. In contrast, BUX’s abnormal return was in the positive territory of 0.4% during the COVID-19 epidemic period. Furthermore, BUX’s abnormal return was the highest negative return at one day after the event date of the COVID-19 pandemic (−11.8%), or twice as high as JCI’s negative abnormal return in the same period (−5.1%). The BUX abnormal return for the COVID-19 pandemic period was −3.4% on average, higher than the JCI’s average abnormal return of −2.1%.
The t-test statistics reveal that there is no significant effect of the COVID-19 epidemic on JCI and BUX. It can be seen from the t-test value of abnormal return from −5 to +5, lower than 1.96. Changing the status of COVID-19 to pandemic also had no significant impact on JCI and BUX, as displayed from the t-test values of −1650 and −6334, respectively. However, one day before the COVID-19 event date, the t-test value of JCI is 2189 (higher than 1.96), meaning that the COVID-19 pandemic has a significant impact on the JCI one day before WHO announces an increase in the status of COVID-19 to a pandemic. Meanwhile, the significant impact of the new COVID-19 pandemic on BUX occurred on the second day after the event date with a t-test value of 7529.
In contrast with the COVID-19 pandemic, the GFC has relatively less impact on JCI and BUX. Table 5 shows that during the first event of GFC, the average abnormal return of JCI and BUX was −0.2% and 0.0%, while during the event date, JCI has positive abnormal returns (1.3%). However, the JCI responds to GFC with a negative abnormal return the next day with −1.1%. In reverse, BUX experienced a negative abnormal return during the event date of GFC (first event) with −0.2%, and rebound to 0.1% in the next day. Furthermore, JCI and BUX responded to the announcement of Lehman Brothers’ bankruptcy with negative abnormal returns. JCI experienced a negative abnormal return of −5.2%, or two times higher than BUX of −2.3%. The average JCI and BUX abnormal returns are negative, with an average of −0.08% and −0.4% when Lehman Brothers declared bankruptcy.
The impact of GFC (first event) is not significant to JCI and BUX, it can be seen from all the t-test values (−5 to +5), which are lower than 1.96. However, GFC (first event) has a significant impact on BUX one day before the event date, with a t-test value is 2.559. The Lehman Brothers bankruptcy did not significantly impact JCI and BUX, as seen from the t-test values at the event date of −4180 and −2207, respectively, lower than 1.96.
Figure 2 chart line of cumulative abnormal return of JCI during COVID-19 (epidemic and pandemic) and Global Financial Crisis (First event and Lehman Brothers Bankruptcy) from event day −5 to event day +5. The abnormal return is calculated using the market model with the proxy of MSCIEM.
Figure 3 illustrates the cumulative abnormal return of JCI during the four-event windows. Overall, the JCI has a negative abnormal return from −5 to +5, except during the COVID-19 epidemic, JCI has a positive abnormal return. At the start of the period (−5), JCI has a positive cumulative abnormal return, except for the GFC first event (−1.1%). About the event date, the cumulative abnormal return with the highest negative return occurred when Lehman Brothers declared bankruptcy (−17.7%), while during the COVID-19 pandemic, JCI was only −6.4%. After that, the JCI cumulative abnormal return during the Lehman Brothers collapse continued to decrease, and a reversal occurred with the COVID-19 pandemic at the three days after the event date, at −15%. At the end of the event window (+5), the cumulative abnormal return of JCI for the COVID-19 pandemic period is −23.5%, the highest compared to the cumulative abnormal return of JCI in other event window periods such as Lehman Brothers bankrupt (−8.4%) and GFC first event (−2.0%). In contrast, JCI has responded to the COVID-19 epidemic with a positive cumulative abnormal return of 0.7%.
Figure 3 chart line of cumulative abnormal return of BUX for COVID-19 (epidemic and pandemic) and Global Financial Crisis (First event and Lehman Brothers Bankruptcy) from event day −5 to event day +5. The abnormal return is calculated using the market model with a proxy of MSCIEM.
Figure 3 shows the cumulative abnormal return of BUX during the COVID-19 outbreak and global financial crisis. The stock market trend during the COVID-19 (epidemic) and GFC (first event) remains fairly stable, around −0.2% to 1.0% throughout the event window, from day −5 to +5. The BUX’s cumulative abnormal return before the event date (−5) for the first event of GFC and pandemic COVID-19 begins around 1%, but GFC (first event) fluctuates during the event window period, and it ends at −0.2% in 5 days after the event date. However, the COVID-19 pandemic has declined the cumulative abnormal return from 0.1% at the beginning of the event window to −37.8% until the end of the event period. The pandemic status of COVID-19 has the highest impact on the BUX compare to other events such as GFC (first event) and Lehman Brothers collapse, with the cumulative abnormal returns at 1.02% and −4.8%.

4.2. Stock Market Volatility Result

Before the estimation of the GARCH model, we should test the stationarity of variables. According to the Schwarz info criterion (SIC), the optimal lag order has been estimated. Using the VARSELECT function from the VARS package in R studio, we obtained the optimal lag number of the variables. One lag is the optimal lag that has been found for different variables (Table 6).
To check the stationarity of the different variables, two tests were applied; Augmented Dickey-Fuller (ADF) and Philips Peron (PP) test. At level, all variables are non-stationary, they have a unit root. At first difference ADF and PP test are significant at 1% level (P value less than 0.01) which allow to reject the null hypothesis of non-stationary data and accept the alternative hypothesis which says that the variables do not have a unit root, they are stationary. The standard GARCH (1,1) has been applied to our data. The four periods are defined, as shown below:
ARCH Test:
To detect the autoregressive conditional heteroskedasticity (ARCH) of the variables, the ArchTest command from the FinTS package in R has been used. It calculates the Lagrange Multiplier coefficient to affirm the homoskedasticity or heteroskedasticity of the studied variables (Tsay 2005). The optimal lag has been selected based on SIC criterion which is equal to 1.
Table 7 proves the acceptance of the ARCH test thatmeans the residuals of the mean return equation do not exhibit homoskedastistic residuals, they have heteroskedastic residuals that allow the use of the GARCH model
During the COVID-19 and financial crisis, we have both ARCH and GARCH coefficients (Alpha and Beta) that are significant at 5% and 1%. The volatility persistence is higher during the COVID-19 period. The constant (omega), the ARCH (Alpha), and the GARCH term (beta) are positive that justifies the positive value of the conditional variance. The coefficient β ishighly statistically significant. These could be explained that previous news could reveal the present volatility. The total α + β indicates the short-run movement of the volatility response of the return stock market.
As it is presented in Table 8 and Table 9, during COVID-19, the sum of α and β is very slightly close to one (equal to 0.99), which shows that when a shock takes place at a specific time, it will be transmitted future time. The summation of α and β is smaller than one which reflects that the unconditional variance of the error term εt is stationary. The α is smaller than β, this could be explained by that the stock market’s volatility is more sensitive to their past volatility more than their past shocks. BUX and JCI exhibit higher volatility during COVID-19 than the financial crisis. The model results show significant α and β parameters, which implies that both stock markets register a significant impact of their past variance on the present volatility and their sensitivity to external shocks. BUX and JCI volatility are more persistent during le COVID-19. For BUX 89% of its past volatilityis transmitted to the present one during COVID-19, while, during the financial crisis, 83% of the previous day persists the next day. JCI has also greater volatility persistence during COVID-19. It registered a persistence of 71%, during the pandemic, and 60% during the financial crisis. Figure 4 shows the movement of the conditional variance of the two stock prices (JCI and BUX) before and during COVID-19, and financial crisis.
Table 10 proves the stability of the model. The non-significance of the Ljung-Box test demonstrates that residuals do not fit the ARMA model, which means that there is no serial correlation. All p-values are greater than 0.01, except lag (5) during the crisis, which justifies the failure to reject the null hypothesis confirming that there is no serial correlation of GARCH model residuals.

5. Conclusions

This study analyzed the capital markets’ return and volatility of one of ASEAN’s largest emerging economies, Indonesia, and a developed country of the Central European region, Hungary. The volatility in financial assets has been a natural phenomenon due to positive or negative information at the domestic or international level. Several academic researchers have looked into the stock market’s return and volatility. However, the findings have yet to reach a consensus, particularly in the case of the COVID-19 pandemic, which is still evolving. Stock market volatility caused by the health crisis is attractive since the virus has spread almost to the entire world, unlike the previous outbreaks like SARS, EBOLA, and MARS, which are restricted to specific geographic locations.
This study investigated the impact of two major crises in the last two decades, namely the global financial crisis and COVID-19, on the return and volatility of Indonesian and Hungarian stock indices. The results indicate that the stock markets in Indonesia and Hungary responded to the COVID-19 pandemic with the highest negative cumulative abnormal return and significant volatility compared to the pre-crisis period. Apart from differences in economic aspects and the financial industry’s progress in the two countries, the COVID-19 pandemic heavily disrupted the capital market. It can be concluded that the Indonesian and Hungarian stock markets cannot be a place for portfolio diversification during the crisis period, especially during the global financial crisis and the COVID-19 outbreak. Further, the uncertainty in the capital markets presents opportunity to reallocate the portfolio to safer investment options for investors.
For the policymakers, it requires a proactive and continuous strategy to intervene in fiscal and monetary policy to maintain stability and positive sentiment in the market. In addition, the government’s efforts to increase capital market participation can be achieved by simplifying regulations and promoting potential corporations to become public companies through an initial public offering (IPO), as well as encouraging the openness of the financial industry, which can increase the role of local and foreign investors in the Indonesian and Hungarian stock market. Furthermore, government participation in educating people on financial literacy needs to be improved to have sufficient knowledge about investing in financial markets. Increasing financial literacy will encourage financial inclusion and contributing to the United Nation’s target listed in SDGs number 8 related to optimizing access to formal financial services for the society by 2030, especially in dealing with financial uncertainties.

6. Limitations and Suggestions for Future Study

This study analyzes the short-term response of the stock market to the health crisis compared to shocks in the financial sector at the country level. It focuses on the macro level, considering that some companies from specific sectors respond to extraordinary events with positive performance. An in-depth study can be carried out with a sample of corporations classified by sector and incorporating other research dimensions such as the COVID-19 daily new cases, deaths levels, and the country’s policy response to the reaction of company stocks. Future research could investigate the performance of stocks at both the corporate and country levels over time because the short, medium, and long-term stock market reactions often result in different findings. In addition (Goodell 2020) depicts that comparing the stock market reaction to an event that is global (COVID-19) and local (terrorist event) scale has gain attention. Our research considers only the standard GARCH that studies the symmetric volatility; further studies could use other GARCH family model (i.e., EGARCH, GJRGARCH, etc…) to assess the asymmetric volatility of the stock prices.

Author Contributions

Conceptualization, B.S. and M.B.A.; methodology, B.S., M.B.A., M.F.-F. and R.J.N.; software, B.S. and M.B.A.; validation, B.S., M.B.A., M.F.-F. and R.J.N.; formal analysis, B.S., M.B.A., M.F.-F. and R.J.N.; investigation, B.S., M.B.A. and M.F.-F.; resources, B.S.; data curation, B.S. and M.B.A.; writing—original draft preparation, B.S., M.B.A. and R.J.N.; writing—review and editing, B.S., M.B.A., M.F.-F., R.J.N. and Z.Z.; supervision, M.F.-F., R.J.N. and Z.Z.; project administration, B.S., M.B.A. and Z.Z.; funding acquisition, B.S., M.B.A. and Z.Z. All authors have read and agreed to the published version of the manuscript.

Funding

This research received no external funding.

Institutional Review Board Statement

Not applicable.

Informed Consent Statement

Not applicable.

Data Availability Statement

The data presented in this study are available on request from the corresponding author.

Acknowledgments

The authors would like to thankthe reviewers who gave us suggestions on how to develop this article. The Hungarian University of Agriculture and Life Sciences to support this article and Tempus Public Foundation for their support.

Conflicts of Interest

The authors declare no conflict of interest.

References

  1. Aras, Serkan. 2021. Stacking hybrid GARCH models for forecasting Bitcoin volatility. Expert Systems with Applications 174: 114747. [Google Scholar] [CrossRef]
  2. Bai, Lan, Yu Wei, Guiwu Wei, Xiafei Li, and Songyun Zhang. 2021. Infectious disease pandemic and permanent volatility of international stock markets: A long-term perspective. Finance Research Letters 40: 101709. [Google Scholar] [CrossRef]
  3. Baker, Scott, Nicholas Bloom, Steven Davis, Kyle Kost, Marco Sammon, and Tasaneeya Viratyosin. 2020. The Unprecedented Stock Market Impact of COVID-19. No. w26945. Cambridge: National Bureau of Economic Research. [Google Scholar]
  4. Ben Abdallah, Marwa, Maria Fekete Farkas, and Zoltan Lakner. 2020. Analysis of meat price volatility and volatility spillovers in Finland. Agricultural Economics 66: 84–91. [Google Scholar] [CrossRef]
  5. Bollerslev, Tim. 1986. Generalized autoregressive conditional heteroskedasticity. Journal of Econometrics 31: 307–27. [Google Scholar] [CrossRef] [Green Version]
  6. Brav, Alon, and John Brian Heaton. 2015. Event studies in securities litigation: Low power, confounding effects, and bias. Washington University Law Review 93: 583. [Google Scholar] [CrossRef] [Green Version]
  7. Brooks, Chris. 2008. Introductory Econometrics for Finance, 2nd ed. Cambridge: Cambridge University Press. [Google Scholar]
  8. Can, Reyhan, and Hatice Isin Dizdarlar. 2021. Do Investors Overreact to Firm Merger and Acquisition Decisions? In Contemporary Issues in Social Science (Contemporary Studies in Economic and Financial Analysis). Edited by Simon Grima, Ercan Özen and Hakan Boz. Bingley: Emerald Publishing Limited, vol. 106, pp. 103–18. [Google Scholar] [CrossRef]
  9. Chang, Chia-Lin, Michael McAleer, and Wing-Keung Wong. 2020. Risk and financial management of COVID-19 in business, economics and finance. Journal of Risk and Financial Management 13: 102. [Google Scholar] [CrossRef]
  10. Chang, Chia-Lin, Shu-Han Hsu, and Michael McAleer. 2018. An event study analysis of political events, disasters, and accidents for Chinese tourists to Taiwan. Sustainability 10: 4307. [Google Scholar] [CrossRef] [Green Version]
  11. Charfeddine, Lanouar, Karim Ben Khediri, Goodness C. Aye, and Rangan Gupta. 2018. Time-varying efficiency of developed and emerging bond markets: Evidence from long-spans of historical data. Physica A 505: 632–47. [Google Scholar] [CrossRef] [Green Version]
  12. Chaudhary, Rashmi, Priti Bakhshi, and Hemendra Gupta. 2020. Volatility in International Stock Markets: An Empirical Study during COVID-19. Journal of Risk and Financial Management 13: 208. [Google Scholar] [CrossRef]
  13. Chen, Ming-Hsiang, SooCheong Shawn Jang, and Woo Gon Kim. 2007. The impact of the SARS outbreak on Taiwanese hotel stock performance: An event-study approach. International Journal of Hospitality Management 26: 200–12. [Google Scholar] [CrossRef]
  14. Chu, Jeffrey, Yuanyuan Zhang, and Stephen Chan. 2019. The adaptive market hypothesis in the high frequency cryptocurrency market. International Review of Financial Analysis 64: 221–31. [Google Scholar] [CrossRef]
  15. Cookson, J. Anthony, Joseph E. Engelberg, and William Mullins. 2020. Does partisanship shape investor beliefs? Evidence from the COVID-19 pandemic. The Review of Asset Pricing Studies 10: 863–93. [Google Scholar] [CrossRef]
  16. Czech, Katarzyna, Michał Wielechowski, Pavel Kotyza, Irena Benešová, and Adriana Laputková. 2020. Shaking stability: COVID-19 impact on the Visegrad Group countries’ financial markets. Sustainability 12: 6282. [Google Scholar] [CrossRef]
  17. Dungore, Parizad Phiroze, and Sarosh Hosi Patel. 2021. Analysis of Volatility Volume and Open Interest for Nifty Index Futures Using GARCH Analysis and VAR Model. International Journal of Financial Studie 9: 7. [Google Scholar] [CrossRef]
  18. Engle, Robert F. 1982. Autoregressive conditional heteroscedasticity with estimates of the variance of United Kingdom inflation. Econometrica: Journal of the Econometric Society 50: 987–1007. [Google Scholar]
  19. Fama, Eugene. 1970. Efficient capital market: A review of theory and empirical work. Journal of Finance 25: 382–417. [Google Scholar] [CrossRef]
  20. Feria-Domínguez, José Manuel, Pilar Paneque, and Fanny de la Piedra. 2020. Are the Financial Markets Sensitive to Hydrological Risk? Evidence from the Bovespa. Water 12: 3011. [Google Scholar] [CrossRef]
  21. Fink, Holger, Yulia Klimova, Claudia Czado, and Jakob Stöber. 2017. Regime switching vine copula models for global equity and volatility indices. Econometrics 5: 3. [Google Scholar] [CrossRef] [Green Version]
  22. Goodell, John W. 2020. COVID-19 and finance: Agendas for future research. Finance Research Letters 35: 101512. [Google Scholar] [CrossRef]
  23. Gunay, Samet, Walid Bakry, and Somar Al-Mohamad. 2021. The Australian stock market’s reaction to the first wave of the COVID-19 pandemic and black summer bushfires: A sectoral analysis. Journal of Risk and Financial Management 14: 175. [Google Scholar] [CrossRef]
  24. Haas, Markus, Stefan Mittnik, and Marc S. Paolella. 2004. A new approach to Markov-switching GARCH models. Journal of Financial Econometrics 2: 493–530. [Google Scholar] [CrossRef]
  25. Hatch, Courtney Droms, Kurt Carlson, and William G. Droms. 2018. Effects of market returns and market volatility on investor risk tolerance. Journal of Financial Services Marketing 23: 77–90. [Google Scholar] [CrossRef]
  26. Hsing, Yu. 2011. Impacts of macroeconomic variables on the stock market in Bulgaria and policy implications. Journal of Economics and Business 14: 41–53. [Google Scholar]
  27. Khan, Abbas, Muhammad Yar Khan, Abdul Qayyum Khan, Majid Jamal Khan, and Zia Ur Rahman. 2021. Testing the weak form of efficient market hypothesis for socially responsible and Shariah indexes in the USA. Journal of Islamic Accounting and Business Research 12: 625–45. [Google Scholar] [CrossRef]
  28. Kothari, Sagar P., and Jerold B. Warner. 2006. Econometrics of event studies. In Handbook of Empirical Corporate Finance. Amsterdam: Elsevier, pp. 3–36. [Google Scholar]
  29. Kim, Jong-Min, Dong H. Kim, and Hojin Jung. 2021. Estimating yield spreads volatility using GARCH-type models. The North American Journal of Economics and Finance 57: 101396. [Google Scholar] [CrossRef]
  30. Klapper, Leora, Mayada El-Zoghbi, and Jake Hess. 2016. Achieving the Sustainable Development Goals: The Role of Financial Inclusion. Washington, DC: CGAP, Available online: http://www.cgap.org/publications/achieving-sustainabledevelopment-goals (accessed on 1 October 2021).
  31. Lee, Yu Lim, Minji Jung, Robert Jeyakumar Nathan, and Jae-Eun Chung. 2020. Cross-National Study on the Perception of the Korean Wave and Cultural Hybridity in Indonesia and Malaysia Using Discourse on Social Media. Sustainability 12: 6072. [Google Scholar] [CrossRef]
  32. Liu, HaiYue, Aqsa Manzoor, CangYu Wang, Lei Zhang, and Zaira Manzoor. 2020. The COVID-19 outbreak and affected countries stock markets response. International Journal of Environmental Research and Public Health 17: 2800. [Google Scholar] [CrossRef] [PubMed] [Green Version]
  33. Malkiel, Burton G. 2003. The Efficient Market Hypothesis and Its Critic. Journal of Economic Perspectives 17: 59–82. [Google Scholar] [CrossRef] [Green Version]
  34. Mazumder, Sharif. 2020. How important is social trust during the COVID-19 crisis period? Evidence from the Fed announcements. Journal of Behavioral and Experimental Finance 28: 100387. [Google Scholar] [CrossRef] [PubMed]
  35. Mazur, Mieszko, Man Dang, and Miguel Vega. 2021. COVID-19 and the march 2020 stock market crash. Evidence from S&P1500. Finance Research Letters 38: 101690. [Google Scholar] [CrossRef]
  36. Mittnik, Stefan, Marc S. Paolella, and Svetlozar T. Rachev. 2002. Stationarity of stable power-GARCH processes. Journal of Econometrics 106: 97–107. [Google Scholar] [CrossRef]
  37. Mohsin, Muhammad, Li Naiwen, Muhammad Zia-UR-Rehman, Sobia Naseem, and Sajjad Ahmad Baig. 2020. The volatility of bank stock prices and macroeconomic fundamentals in the Pakistani context: An application of GARCH and EGARCH models. Oeconomia Copernicana 11: 609–36. [Google Scholar] [CrossRef]
  38. Nathan, Robert Jeyakumar, Vijay Victor, Chin Lay Gan, and Sebastian Kot. 2019. Electronic commerce for home-based businesses in emerging and developed economy. Eurasian Business Review 9: 463–83. [Google Scholar] [CrossRef]
  39. Nathan, Robert Jeyakumar, Vijay Victor, József Popp, Mária Fekete-Farkas, and Judit Oláh. 2021. Food Innovation Adoption and Organic Food Consumerism—A Cross National Study between Malaysia and Hungary. Foods 10: 363. [Google Scholar] [CrossRef]
  40. O’Donnell, Niall, Darren Shannon, and Barry Sheehan. 2021. Immune or at-risk? Stock markets and the significance of the COVID-19 pandemic. Journal of Behavioral and Experimental Finance 30: 100477. [Google Scholar] [CrossRef]
  41. Ramelli, Stefano, and Alexander F. Wagne. 2020. Feverish stock price reactions to COVID-19. The Review of Corporate Finance Studies 9: 622–55. [Google Scholar] [CrossRef]
  42. Saleem, Adil, Judit Bárczi, and Judit Sági. 2021. COVID-19 and Islamic Stock Index: Evidence of Market Behavior and Volatility Persistence. Journal of Risk and Financial Management 14: 389. [Google Scholar] [CrossRef]
  43. Schell, Daniel, Mei Wang, and Toan Luu Duc Huynh. 2020. This time is indeed different: A study on global market reactions to public health crisis. Journal of Behavioral and Experimental Finance 27: 100349. [Google Scholar] [CrossRef]
  44. Shiller, Robert James. 2003. From Efficient Market Theory to Behavioral Finance. Journal of Economic Perspectives 17: 83–104. [Google Scholar] [CrossRef] [Green Version]
  45. Thorbecke, Willem. 2021. The Exposure of French and South Korean Firm Stock Returns to Exchange Rates and the COVID-19 Pandemic. Journal of Risk and Financial Management 14: 154. [Google Scholar] [CrossRef]
  46. Tsay, Ruey S. 2005. Analysis of Financial Time Series. New York: John Wiley & Sons, vol. 543. [Google Scholar]
  47. Twerefou, Daniel Kwabena, and Michael K. Nimo. 2005. The Impact of Macroeconomic Risk on Asset Prices in Ghana, 1997–2002. African Development Review 17: 168–92. [Google Scholar] [CrossRef]
  48. Ullah, Subhan, Ghasem Zaefarian, Rizwan Ahmed, and Danson Kimani. 2021. How to apply the event study methodology in STATA: An overview and a step-by-step guide for authors. Industrial Marketing Management. in press. [Google Scholar] [CrossRef]
  49. World Bank. 2021. World Bank Country and Lending Groups. Available online: https://datahelpdesk.worldbank.org/knowledgebase/articles/906519-world-bank-country-and-lending-groups%20/ (accessed on 1 October 2021).
  50. Xiao, Linlan, and Abdurrahman Aydemir. 2007. Volatility modelling and forecasting in finance. In Forecasting Volatility in the Financial Markets. Oxford: Butterworth-Heinemann, pp. 1–45. [Google Scholar]
  51. Yilmazkuday, Hakan. 2020. COVID-19 Effects on the S&P 500 inde. Applied Economics Letters, 1–7. [Google Scholar] [CrossRef]
Figure 1. Timeline for Event Study.
Jrfm 14 00576 g001
Figure 2. The JCI Cumulative Abnormal Return in the COVID-19 Outbreak and Global Financial Crisis.
Jrfm 14 00576 g002
Figure 3. The BUX Cumulative Abnormal Return in the COVID-19 Outbreak and Global Financial Crisis.
Jrfm 14 00576 g003
Figure 4. Conditional variances of the GARCH MODEL.
Jrfm 14 00576 g004aJrfm 14 00576 g004b
Table 1. COVID-19 Reported Cases, Deaths, and Test in Indonesia, Hungary and the World.
CountryIndonesiaHungaryWorld
First case2 March 20204 March 202031 December 2020
Number of cases1,662,868776,983150,333,988
Number of cases/1M population602780,59919,286
Number of deaths45,33427,3583,166,814
Number of deaths/1M population164169406
Total tests14,487,3965,349,792-
Total tests/1M population52,509554,952-
Deaths/cases0.0270.0350.021
Population274,463,8799,652,245-
Source. Authors’ own elaboration based on Worldometers data (29 April 2021).
Table 2. Statistical summary of Actual Return for JCI and BUX return (%).
Trading DaysMeanMedianMinMaxStandard Deviation
Panel A. JCI Statistical Summary
COVID-19 Outbreak
Estimation period150−0.03%−0.03%−2.59%1.97%0.007638
COVID-19 (Epidemic)11−0.01%0.19%−1.04%0.78%0.005860
COVID-19 (Pandemic)11−2.14%−2.48%−6.58%2.38%0.028072
Global Financial Crisis (GFC)
Estimation period1500.21%0.23%−3.96%3.12%0.010793
GFC (First Announcement)110.03%−0.16%−1.8%1.44%0.010714
GFC (Lehman Brothers Bankruptcy)11−0.53%0.30%−4.70%5.82%0.030410
Panel B. BUX Statistical Summary
COVID-19 Outbreak
Estimation period1500.01%0.05%−1.73%2.19%0.007672
COVID-19 (Epidemic) 110.10%0.32%−3.21%1.38%0.012290
COVID-19 (Pandemic)11−3.34%−3.34%−11.55%5.79%0.044508
Global Financial Crisis (GFC)
Estimation period1500.13%0.12%−2.44%2.85%0.010679
GFC (First Announcement)110.11%−0.18%−1.46%2.79%0.010630
GFC (Lehman Brothers Bankruptcy)11−0.30%−1.34%−3.83%9.15%0.034804
Source: Authors’ own elaboration based on Investing and Bloomberg data (Accessed on: 25 May 2021).
Table 3. The JCI and BUX return relative to MSCIEM.
Trading DaysAverage Stock Return Average Stock Return vs. MSCIEM
JCIBUXMSCIEMJCIBUX
COVID-19 Outbreak
Estimation period150−0.03%0.01%0.03%−0.05%−0.01%
COVID-19 (Epidemic)11−0.01%0.10%0.17%−0.18%−0.07%
COVID-19 (Pandemic)11−2.14%−3.34%−2.34%0.20%−1.00%
Global Financial Crisis (GFC)
Estimation period1500.21%0.13%0.16%0.05%−0.02%
GFC (First Announcement)110.03%0.11%0.10%−0.07%0.01%
GFC (Lehman Brothers Bankruptcy)11−0.53%−0.30%−0.12%−0.41%−0.17%
Source: Authors’ own elaboration based on Investing and Bloomberg data (Accessed on: 25 May 2021).
Table 4. The JCI and BUX Abnormal Return and t-test during COVID-19 Outbreak.
COVID-19 OutbreakDaysAbnormal Return (AR)t-Test
JCIBUXJCIBUX
COVID-19
(Epidemic)
−50.6%1.4%0.7541.771
−40.4%0.6%0.4870.813
−30.2%−0.7%0.325−0.942
−20.2%0.8%0.2401.056
−1−0.4%0.2%−0.5790.244
Event Date−0.2%0.4%−0.2750.457
+10.7%−0.2%0.858−0.284
+2−1.0%−3.3%−1.335−4.229
+30.4%−0.4%0.498−0.489
+4−0.8%1.0%−1.0791.249
+50.8%1.3%1.0791.681
Average Abnormal Return0.1%0.1%0.0880.121
COVID-19 (Pandemic)−52.4%0.1%3.1500.111
−4−0.2%−1.7%−0.237−2.162
−3−2.5%−3.5%−3.218−4.473
−2−6.6%−7.8%−8.605−10.113
−11.7%0.9%2.1891.107
Event Date−1.3%−4.9%−1.650−6.334
+1−5.1%−11.8%−6.574−15.307
+20.3%5.8%0.3647.529
+3−4.5%−5.8%−5.800−7.481
+4−5.0%−2.5%−6.459−3.179
+5−2.8%−6.7%−3.706−8.721
Average Abnormal Return−2.1%−3.4%−2.777−4.457
Note: Abnormal returns (AR) for an event study of the epidemic and pandemic COVID-19 announcements. The sample consists of daily stock prices in the JCI and BUX from 2 May to 18 March 2020. We applythe market model and define MSCIEM as a proxy of the market return. AR is the sample of abnormal for the specified day in event time both epidemic and pandemic of COVID-19. The t-test is applied to investigate whether the event has a significant or not significant impact on JCI and BUX.
Table 5. The JCI and BUX Abnormal Return and t-test during Global Financial Crisis.
Global Financial Crisis (GFC)DaysAbnormal Return (AR)t-Test
JCIBUXJCIBUX
GFC
(First Announcement)
−5−1.1%−0.4%−0.993−0.359
−40.6%−0.5%0.556−0.489
−3−1.1%0.6%−1.0130.545
−2−0.4%−0.3%−0.402−0.312
−11.3%2.7%1.2212.559
Event Date1.3%−0.2%1.168−0.232
+1−1.1%0.1%−1.0040.129
+20.1%−1.0%0.124−0.906
+3−0.7%−0.5%−0.611−0.432
+4−2.2%−1.6%−2.030−1.541
+51.3%0.9%1.1860.887
Average Abnormal Return−0.2%0.0%−0.081−0.014
GFC
(Lehman Brothers Bankruptcy)
−50.8%2.6%0.7662.411
−4−4.4%−0.9%−4.080−0.805
−3−4.1%0.0%−3.7540.033
−2−1.2%−2.8%−1.104−2.669
−1−3.6%0.5%−3.3070.498
Event Date−5.2%−2.3%−4.180−2.207
+10.3%−3.5%0.288−3.334
+21.6%−4.0%1.462−3.809
+30.8%−2.5%0.716−2.376
+46.5%9.4%5.9688.845
+50.2%−1.2%0.159−1.091
Average Abnormal Return−0.8%−0.4%−0.700−0.409
Note: Abnormal returns (AR) for an event study of the global financial crisisevent. The sample consists of daily stock prices in the JCI and BUX from 27 September 2006, to 22 September 2008. We applythe market model and define MSCIEM as a proxy of the market return. AR is the sample of abnormal for the specified day in event time for the first global financial crisis announcement and Lehman Brothers state bankruptcy. The t-test is applied to investigate whether the global financial crisis has a significant or not significant impact on JCI and BUX.
Table 6. Unit Roots Test.
Before COVID-19During COVID-19Before Global Financial CrisisDuring Global Financial Crisis
JCIADF test at level−3.68
(0.01)
−2.65
(0.303)
−0.737
(0.789)
−0.3671
(0.499)
ADF at first difference−9.51
(0.01)
−7.05
(0.01)
−8.91
(0.01)
−12.3707
(0.01)
PP at level0.0523
(0.701)
−8.16
(0.569)
−1.31
(0.845)
−4.94
(0.465)
PP at first difference−126
(0.01)
−393
(0.01)
−146
(0.01)
−288
(0.01)
BUXADF test at level−0.765
(0.963)
−2.57
(0.338)
−1.96
(0.588)
−3.35
(0.0626)
ADF at first difference−5.13
(0.01)
−8.18
(0.01)
−6.07
(0.01)
−15.97
(0.01)
PP at level−2.73
(0.946)
−7.46
(0.621)
−10
(0.451)
1.34
(0.843)
PP at first difference−130
(0.01)
−434
(0.01)
−154
(0.01)
−257
(0.01)
Table 7. ARCH test result.
Variables ARCH Test
JCIBefore Financial crisis134.4 (0.00)
During Financial crisis297.71 (0.00)
Before COVID-19119.21(0.00)
During COVID-19385.87 (0.00)
BUXBefore Financial crisis 129.2 (0.00)
During Financial crisis288.95(0.00)
Before COVID-19133.89 (0.00)
During COVID-19 401.89 (0.00)
Table 8. GARCH (1,1) Parameters of JCI.
EstimateStd. Errort Value Pr (>|t|)
Before COVID-19Mu2.202493.8844850.5669970.570717
Ar1−0.568560.341611−1.6643550.096042
Ma10.665000.3072562.1643030.030441
Omega0.4285126.4749200.0161850.987087
Alpha0.000000.0119960.0000001.000000
Beta0.999000.0001955116.8290810.000000
During COVID-19Mu3.100772.8232911.09830.272081
Ar1−0.695920.145174−4.79370.000002
Ma10.757630.1276525.93510.000000
Omega452.22575195.8215712.30940.020923
Alpha0.191290.0647692.95340.003143
Beta0.719350.0822608.74490.000000
Before global financial crisisMu3.392301.6234332.089590.036655
Ar1−0.886410.038787−22.853460.000000
Ma10.981520.001339732.947090.000000
Omega7.130779.3784590.760330.447054
Alpha0.000000.0033740.000001.000000
Beta0.982340.02275643.168180.000000
During global financial crisisMu1.626392.5212510.645060.518889
Ar10.519440.3727611.393500.163468
Ma1−0.389230.3956700.983720.325253
Omega254.53845100.4666792.533560.011291
Alpha0.267420.0744183.593440.000326
Beta0.600590.0923596.502740.000000
Table 9. GARCH (1,1) Parameters of BUX.
EstimateStd. Errort ValuePr (>|t|)
Before COVID-19Mu25.25518722.5491.119990.262717
Ar10.8618330.269673.195860.001394
Ma1−0.8839470.24857−3.556160.000376
Omega777.4117163567.00.217950.827471
Alpha0.0383060.0293001.307380.191084
Beta0.9606945.0516 × 10−219.017760.000000
During COVID-19Mu30.2032425.0651.205020.228196
Ar10.674880.4.19741.607850.107869
Ma1−0.639070.4.3768−1.460120.14425
Omega369.992352716.30.136210.891653
Alpha0.105200.0268113.923650.000087
Beta0.893800.02455236.404220.000000
Before global financial crisisMu31.4614919.7870601.590000.111834
Ar10.126560.4699550.269300.787697
Ma1−0.173180.499280−0.346850.728703
Omega65.23314520.1334850.125420.900194
Alpha0.000000.0095240.000001.000000
Beta0.998180.001445690.778970.000000
During global financial crisisMu−16.26700619.171−0.848530.396145
Ar1−0.0818460.28927−0.282940.777223
Ma10.1799790.2.83300.635310.525229
Omega3321.30542440.31.361050.173499
Alpha0.1630040.07797614.245040.036579
Beta0.8359960.05868714.245040.000000
Table 10. Weighted Ljung-Box Test on Standardized Residual: d.o.f = 2.
StatisticP-Value
Before COVID-19Lag[1]0.41940.5172
Lag[2∗(p+q)+(p+q)−1][5]1.65750.9936
Lag[4∗(p+q)+(p+q)−1][9]5.26550.3952
During COVID-19Lag[1]0.19340.6601
Lag[2∗(p+q)+(p+q)−1][5]3.76450.1174
Lag[4∗(p+q)+(p+q)−1][9]5.73110.3030
Before Global Financial CrisisLag[1]0.41940.5172
Lag[2∗(p+q)+(p+q)−1][5]1.65750.9936
Lag[4∗(p+q)+(p+q)−1][9]5.26550.3952
During Global Financial CrisisLag[1]1.0270.310857
Lag[2∗(p+q)+(p+q)−1][5]4.9910.003418
Lag[4∗(p+q)+(p+q)−1][9]6.7960.148820
Before COVID-19Lag[1]0.93860.332636
Lag[2∗(p+q)+(p+q)−1][5]5.00390.003267
Lag[4∗(p+q)+(p+q)−1][9]6.33080.206417
During COVID-19Lag[1]0.34650.5561
Lag[2∗(p+q)+(p+q)−1][5]1.90470.9732
Lag[4∗(p+q)+(p+q)−1][9]2.71440.9291
Before Global Financial CrisisLag[1]0.00051140.9820
Lag[2∗(p+q)+(p+q)−1][5]1.21267270.9999
Lag[4∗(p+q)+(p+q)−1][9]3.42691440.8159
During Global Financial CrisisLag[1]0.079640.7778
Lag[2∗(p+q)+(p+q)−1][5]3.776200.1143
Lag[4∗(p+q)+(p+q)−1][9]5.648760.3183
Publisher’s Note: MDPI stays neutral with regard to jurisdictional claims in published maps and institutional affiliations.

