Article

A Wavelet Perspective of Crisis Contagion between Advanced Economies and the BRIC Markets

by
Constantin Gurdgiev
1,2,* and
Conor O’Riordan
2
1
Monfort College of Business, University of Northern Colorado, 800 17th St., Greeley, CO 80639, USA
2
Trinity Business School, Trinity College, Dublin, Ireland
*
Author to whom correspondence should be addressed.
J. Risk Financial Manag. 2021, 14(10), 503; https://doi.org/10.3390/jrfm14100503
Submission received: 21 July 2021 / Revised: 13 October 2021 / Accepted: 13 October 2021 / Published: 19 October 2021
(This article belongs to the Special Issue Wavelet Applications in Finance)

Abstract

:
This paper investigates the relationship between the BRICs’ and the advanced economies’ stock markets from 2000 to 2016 utilizing continuous wavelet transform. The continuous wavelet transform allows us to explore these relationships in the time–frequency domain to capture short- and long-term investors’ perspectives. Bi-directional spillovers are captured in terms of returns and volatility. In addition to covering the periods of the dot.com crash, the 11 September 2001 events, the pre-2007 financialization bubble period and the resulting Global Financial Crisis, we study volatility spillovers arising from the BRIC, U.S. and European market shocks post the Global Financial Crisis. Based on our results, we confirm findings in relatively fragmented literature that document time-varying and imperfect BRIC markets’ integration with mature economies. Overall, we show that arbitrage opportunities continue to exist in international stock market portfolios with respect to BRIC assets. In a major addition to the literature, our study captures spillovers from the advanced economies’ shocks to BRIC markets, as well as contagion from BRIC markets’ shocks to advanced economies’ markets.

1. Introduction

Since 2001, when the term ‘BRIC’ was coined by Jim O’Neill (2001), the world’s largest middle income and emerging economies of Brazil, Russia, India and China have taken increasingly distinct paths to economic growth. As the BRIC developed relatively distinct investment markets in terms of their institutional maturity, market depth and breadth, after the Global Financial Crisis (GFC), the idea of the BRIC being synchronized engines of global growth has faded (Myles 2020). With this, BRIC stock markets portfolio risk diversification properties changed as well (Mensi et al. 2017). Yet, owing significantly to the emergence of the risks of bi-directional spillovers between mature and emerging markets (Yellen 2016), BRIC markets continue to influence the global financial stability environment. These spillovers appear to analysts and policymakers alike to be significantly heterogeneous. On one side of this spectrum, China potentially leads global markets and has stronger contagion channels to the global financial markets. On the other side of the spectrum, Russia has appeared to significantly decouple from international financial flows volatility and trends, especially the rapid deterioration in the U.S.–Russia geopolitical relations starting in 2011. While these observations are common in media and political science literature, they are yet to be examined robustly in volatility and risk spillovers literature in finance.
The purpose of this paper is to capture how individual BRIC markets and advanced economies markets are coupled or interconnected in terms of risk spillover channels, and how this interconnectedness is evolving over time and across periods of general markets uncertainty (crises) and recoveries. In this context, we present two major innovations to the literature on the dynamic analysis of contagion channels between BRIC markets and advanced economies. Firstly, we look at each individual market pair (individual BRIC market versus individual advanced economy market) in our analysis of contagion. As detailed in the Literature Review section below, wavelet analysis literature on such contagion channels is mostly focused on portfolio analysis that creates relatively ad hoc portfolios of emerging markets equities (BRIC equities) and looks for contagion channels between such portfolio and the advanced economies portfolio. Secondly, we look at all major financial markets shocks, global and BRIC-specific, over the period of 2000–2016. Currently, there is no existent research that combines these two features of analysis while deploying wavelet methodology.
Stock market contagion and interdependence literature traces its origins to periods of significant volatility of the late 1980s. In particular, the Latin American, Russian and Asian crises of the 1990s form the backdrop to the beginnings of the literature on contagion or spillovers of risks across the markets. Forbes and Rigobon (2002) observed that the shocks of the US 1987 stock market crash, the Tequila Crisis in 1994 and the Asian Crisis in 1997 reverberated beyond domestic borders. In their view, this contagion put a question mark around the idea of the internationally diversified portfolio, the cornerstone of the mainstream investment literature. As the result, in more recent years, we have seen the emergence of a wealth of literature on spillovers of uncertainty in monetary policy particularly surrounding Taper Tantrum in 2013 and 2014 (BIS 2021). This literature largely focuses on advanced economies’ markets and ignores the BRICs’.
Today, shocks emanating from emerging markets are equally important and influence advanced economies’ monetary policy consideration (Yellen 2016). Central banks and global institutions such as the IMF increasingly reference analysis of the coupling between advanced and emerging markets in their decisions on monetary policy, systemic risks monitoring and crises prevention (see, for example, IMF 2016, 2020; Ozkan and Unsal 2012). Multiple foreign exchange swap lines opened during and post-GFC by the major central banks in the advanced economies stand as a testament to the importance of such risk contagion/spillover channels (for a good survey of recent literature on this subject, see Eguren-Martin 2020).
To this point, academic and central banking/prudential regulation literature explored linkages between stock market risks over the period of 1995 to 2016. Yet, this literature has substantial gaps in methodological quality and scope of research.
Firstly, it is evident from our review of the literature that the wavelet methodology—the modern workhorse for investigating contagion channels and risk spillovers (Gallegati 2012)—has not been utilized in cited literature to investigate the potential contagion channels that exist between advanced economies and the BRICs in the period following the GFC. Even in the case of the world’s second-largest economy, China, studies using wavelet methodology to uncover the existence of risk contagion channels between the advanced economies financial markets and their Chinese counterparts are scarce (Youssef et al. 2021). Cărăuşu et al. (2018) provide a survey of literature on the advantages of the wavelet methodology in their analysis of emerging markets contagion.
Secondly, prior literature on risk contagion between the advanced economies’ stock markets and those of the BRIC economies has relied exclusively on daily or weekly data analysis. Such analysis only captures the behavior and trading environment of relevance to a subset of markets participants and does not allow for a scale-by-scale analysis (Gallegati and Gallegati 2007; Gallegati 2012; Cărăuşu et al. 2018), which can help identify diversification opportunities open to both long-term and short-term investors simultaneously.
To contribute to the existing body of knowledge on the subject of financial risk contagion channels that exist between the advanced economies’ markets and the markets of the BRIC economies, our study will deploy wavelet analysis on the data from 2000 through 2016. This allows us not only to provide comprehensive coverage of the topic across the four largest middle-income economies but also capture nine major periods of amplified markets volatility: the dot.com bubble, the events of 9/11, the U.S. subprime mortgage crisis, the subsequent GFC, the European Sovereign Debt Crisis, the U.S. sovereign debt downgrade, the Taper Tantrum, the 2015 Chinese Stock market crash and the subsequent Chinese circuit break in January 2016. To keep our analysis focused on major markets events, we end our data span following the Chinese circuit break that started in January 2016. From the end of the first quarter of 2016 through 2019, there were no systemic financial market shocks that can be viewed as potentially transmittable across the global financial markets until the start of 2020 when the COVID-19 pandemic led to major markets’ upheaval.
We deploy continuous wavelet transform methodology to test the directionality and strength of contagion channels from the BRIC economies’ stock markets to the advanced economies’ markets and the reverse direction of risk spillovers. This methodology also allows us to look at the contagion channels from the long-term and the short-term investors’ perspectives, simultaneously, as detailed in Gallegati (2012), without imposing specific scales on the time–frequency of our analysis. In doing so, we also test the proposition that BRIC markets and the U.S. markets are linked by high order contagion channels for risk transmission as indicated in Yellen (2016).
To achieve the aforementioned objectives this paper explores prior literature in Section 2. This allows us to position our hypotheses, methodology and key study objectives in relation to prior studies. We discuss the advantages of using continuous wavelet transform methodology in Section 3, which also describes the data utilized in this study, followed by a brief discussion of data used in our study in Section 4. Results obtained from the wavelet transform are presented and analyzed in Section 5, while the main conclusions of the study and their implications to the broader literature are covered in Section 6.

2. Literature Review

2.1. Risk Spillover Channels

The literature on risk spillovers across markets and exchanges traces its origins from the large bouts of volatility in the late 1980s and through the 1990s, starting with the U.S. 1987 stock market crash. Contagion triggered by these events and the long-run nature of their aftershocks put a significant question mark around the idea of the feasibility of achieving fully diversified portfolios (Forbes and Rigobon 2002). Claessens et al. (2001) further explore the roots of financial globalization through the prism of interlinked stock markets. They distinguish two basic elements of financial globalization—the concepts of interdependence between the markets and the concept of contagion across the financial markets. Claessens et al. (2001) identify contagion as a substantial increase in correlation between financial markets after the onset of a shock. In contrast, interdependence is defined as continued high levels of correlation persisting from before the inception of a crisis.
Both of these phenomena—the risk of contagion and the existence of interdependence—are crucial to investors seeking international assets for the purpose of diversification (Levy and Sarnat 1970). Not surprisingly, research into the linkages (contagion and interdependence channels) between markets is of deep importance to portfolio managers, regulators and policymakers. There is a wealth of recent literature on spillovers of uncertainty in monetary policy, particularly surrounding the Taper Tantrum in 2013 and 2014. During this period, the U.S. Federal Reserve’s announcements surrounding the tightening of the monetary policy regime led to the depreciation of exchange rates, increases in stock markets volatility and widening of CDS spreads in emerging markets (Aizenman et al. 2016; Mishra et al. 2014; Eichengreen and Gupta 2014). Shocks emanating from emerging markets are equally important, especially those arising from China, for monetary policy formation in advanced economies (Yellen 2016).
Yellen (2016) repeatedly refers to bidirectional spillovers from mature to emerging markets. Beirne et al. (2013), conducted a large-scale analysis of the relationship between emerging and mature stock markets across 41 emerging and six advanced economies. Using a trivariate GARCH-BEKK over a 15-year period ending in 2008, they show that more than 75% of the emerging markets’ volatility was interlinked with mature markets. In addition, crisis contagion was noticeable amongst volatility spillovers over the entire sample. This stands in contrast to their finding that there were limited spillovers in the first decade of the millennium. A drawback of this paper is the lack of results for crises during the post-GFC period. The study also does not distinguish the direction of spillovers or whether spillovers from advanced economies (emerging markets) to emerging markets (advanced economies) are associated with feedback spillovers from emerging markets (advanced economies) to advanced economies (emerging markets).
Beirne et al.’s (2013) study laid the foundations for the idea of the presence of a time-varying relationship between emerging and mature markets, as these economies continued to develop and integrate within the global financial system prior to the GFC. Bhar and Nikolova (2007) narrowed the research focus to spillover effects from global equity markets to the BRIC economies. The authors find, using weekly data from 1995 to 2006 and a bivariate EGARCH and DCC models, that the BRIC had a relatively low level of integration with the global markets, providing a source of risk diversification to investors. Bhar and Nikolova’s (2007) paper does not include data for the 2007 subprime mortgages crisis in the U.S., the GFC of 2008–2010, nor the data for the periods thereafter.
The aforementioned papers inspired some limited analysis of BRIC markets’ integration in the periods during and after the GFC. Zhang et al. (2013) include the GFC in their analysis and establish this crisis as a structural break for the BRICs which changed emerging stock markets’ relationship with mature markets. In contrast to Bhar and Nikolova (2007), Zhang et al. (2013) found that Brazil and Russia were the most correlated stock markets with advanced economies and advised against assuming that the benefits of international diversification preceding the GFC will continue into the future. Kenourgios et al. (2011) and Sheu and Liao (2011) utilizing AG-DCC and M-TAR models, respectively, reached similar conclusions. In addition, Sheu and Liao (2011) note that since 2006, the BRICs began exerting influence on the US market in the short run, mirroring Yellen’s (2016) concerns. However, the paper noted that the US stock market has maintained its dominance in terms of the direction of spillovers across the markets in the long run.
Other papers, including Mensi et al. (2017) and Gurdgiev and Trueick (2016), explore global economic factors such as the CBOE VIX as a source of contagion between mature and emerging stock markets. The latter paper utilized a bivariate GARCH model with weekly data and quantile regression with daily data and shows that VIX, as a fear gauge for the U.S. markets, has a significant negative relationship with BRIC stock market performance. However, Gurdgiev and Trueick (2016) find that the VIX and BRIC risk spillovers channels are statistically insignificant. Overall, Mensi et al. (2017) represent a notable exception to the general lack of wavelet methodology applications in research into the contagion channels that exist between the BRIC and the advanced economies’ stock markets, as detailed in Section 2.2 below.
In more recent studies, Singh and Singh (2017) published a study of stock markets’ contagion effects from the U.S. to BRIC stock markets using a vector autoregression (p) dynamic conditional correlation (DCC)-asymmetric generalized autoregressive conditional heteroskedastic (1,1) model. The study utilized heat mapping methodology to trace the co-movement between the U.S. and the BRIC equity markets during the period 2007–2009. The findings are limited to the peak sub-period of the Global Financial Crisis and the methodology used does not allow to identify the direction of contagion effects. Qualitatively, the conclusions are in line with the literature reviewed above.
Su (2020a) uses quantile variance decomposition to measure extreme risk spillovers between G7 and BRIC stock markets. While the author does detect significant risk spillovers, the methodology deployed allows for a limited interpretation of the directionality of these spillovers and their dynamics. In a separate study, Su (2020b) looks at the dynamic properties of the same risk spillovers using linear regression and fixed effects panel models, concluding that “volatility spillovers across G7 stock markets are crisis-sensitive and are, in fact, closer to a memory-less process” (Su 2020b, p. 1). Yet, as the author notes, this methodology did not permit them to make any conclusions based on the directionality of contagion shocks. Both of the studies covered the period from 2003 to 2015, which represents a shorter time horizon than our study and excludes a range of major shocks, such as the Dot.Com bubble pre-2003 and the China stock market shock of 2016.
Crucially, however, unlike the literature using wavelet coherence methodologies, the above literature does not provide a. robust analysis of the contagion effects’ dynamics and direction, nor are its findings robust with respect to the choice of time scale selected (Wang et al. 2017). Thus, our study expands the literature on spillovers by using wavelet methodology.

2.2. The Links between Emerging and Mature Economy Stock Markets—A Wavelet Perspective

While the literature on contagion linkages between various stock markets is relatively developed, it remains hardly comprehensive when it comes to assessing the longer-range effects of contagion crises between emerging markets and advanced economies. Mensi et al. (2017) is the only study to date that looks at all of the following key markets events from 2000 to 2015: the dot.com bubble, the events of the 9/11, the U.S. subprime mortgage crisis, the subsequent GFC and the European Sovereign Debt Crisis, the U.S sovereign debt downgrade, the U.S. Taper Tantrum and the 2015 Chinese Stock market crash. In the rest of the literature, these events have been covered in isolation. It is also worth noting that the period of 2000–2016 covers tremendous variation in oil price volatility that is of interest to the study of Chinese and Russian economies. We end our data window at the end of April 2016. From the end of 2016 to 2019, there have been no substantial globally distributed systemic market shocks of note. In other words, data through to April 2016 covers all modern systemic shocks that had the potential for cross-markets global risk contagion until the arrival of the COVID-19 pandemic in 2020. In contrast to prior shocks, the COVID-19 event was driven not by financial market dynamics, but by the pandemic’s evolution, resulting in very different contagion channels and directionality to financial shocks.
A notable paper to study the integration of the BRIC and advanced economies is Lehkonen and Heimonen (2014). The authors use a DCC model and decompose their results utilizing discrete wavelet analysis to obtain an analysis over a range of timescales. The paper concludes that diversification benefits exist between the BRIC and the U.S., and particularly between China and the U.S. for short-term investors. However, the benefits of international portfolio diversification have diminished over time, as the BRIC economies have matured. A major drawback of this paper is its failure to capture post-GFC shocks. Another drawback of the study is that it used discrete wavelet analysis—a methodology that is more suited for de-noising the data, as opposed to interpreting data insights (Grinsted et al. 2004). The latter objective is best served by the use of continuous wavelet methodology.
The continuous wavelet transform has, to our knowledge, never been utilized to systemically analyze interdependencies between individual BRIC and mature stock markets covering both directions of spillovers. Although Madaleno and Pinho (2012) investigated the relationship between the U.S., UK, Japanese and Brazilian stock markets via continuous wavelet transform, they do not include other BRIC economies. Their study of stock market contagion covers the period from the Asian Crisis in 1997 right through to 2009 following the peak of the GFC. The authors show that the relationship between stock markets over this period is not homogenous and financial crises provide structural breaks which may skew results from less equipped methodologies. Madaleno and Pinho (2012) also highlight the strength of the continuous wavelet time–frequency analysis over the discrete wavelet methodologies. Madaleno and Pinho (2012) show that Brazil has stronger stock market ties with geographically closer regions, i.e., the U.S., and particularly so at higher frequencies following the GFC. In contrast, the authors find almost no meaningful coherence between Japanese and Brazilian stock markets prior to 2006. Loh (2013) tests the relationship between Asian-Pacific stock markets and the U.S. and European stock markets via the continuous wavelet transform. Similar to Madaleno and Pinho (2012), the authors conclude that Asia-Pacific emerging markets and the U.S. and European stock markets are interdependent in the long run, but at high-frequency levels, their relationship is unpredictable. Both Madaleno and Pinho (2012) and Loh (2013) raise interesting questions worth exploring from the perspective of all BRIC markets, across different time scales (short- and long-term) and over the periods of post-GFC shocks, as mentioned earlier.
As noted in Section 2.1 and above, Mensi et al. (2017) represents a notable exception to the general lack of wavelet methodology applications in research into the contagion channels between the BRIC and the advanced economies’ stock markets. Mensi et al.’s (2017) study looked at portfolio risk spillovers between the BRIC emerging and South Asian frontier stock markets and the major developed stock markets (U.S., UK and Japan). The study used the wavelet squared coherence approach as well as the wavelet-based Value at Risk (VaR) method. The authors found that co-movements and diversification benefits between these markets vary over time and across frequencies. Additionally, co-movements are intensified in the wake of the global financial crisis and the Eurozone sovereign debt crisis. The time horizon for that study was 1 January 2000 to 30 June 2016, which is very similar to our chosen time horizon. In contrast with our analysis, Mensi et al. (2017) use a portfolio of stocks representing advanced economies instead of individual country market indices. This allows the authors to explicitly test the risk diversification properties of each emerging market stock market against the overall portfolio of advanced economies’ markets. However, this insight comes at the expense of Mensi et al. (2017) omitting the consideration of individual risk contagion channels between advanced economy markets and individual BRIC market pairs—something that our study contributes to the literature.

2.3. Our Motivation

Past literature makes it evident that the continuous wavelet methodology is best suited to investigate the advanced economy–BRIC relationships following the GFC. In so far as time scales are involved, prior literature has been focused on daily or weekly price data which only captures certain types of investors and does not allow for a scale-by-scale analysis suitable for studying both long-term and short-term investors simultaneously. Past literature also indicates the complex and dynamically evolving nature of volatility spillovers between the emerging markets and the advanced economies. However, the literatureto datee fails to consider all systemic bouts of volatility that impacted financial markets post-GFC and even those prior to the GFC. Similarly, the existing literature does not provide an analysis of contagion between individual BRIC markets and individual advanced economies’ markets.
Consequently, in the present study, we aim to determine whether mature and BRIC stock markets are individually interdependent over time during the structural volatility flare-ups in the years from 2000 to 2016, including post-2010 events, such as the two Taper Tantrums, the 2015 Chinese Stock market crash and the subsequent Chinese circuit break in January 2016. We also aim to study the dynamic nature of volatility contagion across the BRIC economies and the mature markets that took place during the larger-scale crises, such as the dot.com bubble, the 9/11 events, the U.S. subprime mortgage crisis, the subsequent GFC, the European Sovereign Debt Crisis and the U.S. sovereign debt downgrade. In addition, we test whether the U.S. markets lead the BRICs’ volatility and/or whether, as Yellen (2016) notes, BRIC markets have the ability to influence advanced stock markets.

3. Methodology

Aguiar-Conraria and Soares (2010) and Gallegati (2012) highlight the major advantages of wavelet analysis methodology in capturing varying objectives of financial markets participants that, optimally, should be considered in tandem. For example, across a range of popular investment strategies, fund managers split portfolios under management into passively held, longer-term investments and actively traded funds with shorter investment horizons. Wavelet analysis offers researchers the ability to study the spectral characteristics of time series to capture the relationship between time series at varying frequencies. Thus, wavelet analysis allows for the integration of different time perspectives in research—covering investor types ranging from day traders to pension fund managers. Another useful feature of the wavelets is their ability to analyze non-stationary data without requiring data adjustments (Aguiar-Conraria et al. 2008; Cărăuşu et al. 2018). These advantages have led researchers to deploy wavelet methodologies across a wide range of studies of the interlinkages between stock markets (e.g., Madaleno and Pinho 2012; Aguiar-Conraria et al. 2008; Rua and Nunes 2009; Loh 2013; Lehkonen and Heimonen 2014, to name just a few).
The continuous wavelet transform is a more recent addition to the wavelet analysis toolbox that improves the empirical power of the wavelet analysis relative to the discrete wavelet transform. Subsequently, we use continuous Morlet wavelet transform owing to its superior pattern extraction capabilities (Grinsted et al. 2004; Barunik et al. 2011) and ability to produce representations in the time–frequency domain, which enable us to capture both transient and long-term patterns between and within time-series. With this in mind, we use the wavelet power spectrum, cross wavelet coherence and phase difference analysis tools, as discussed below. Technical details of our specifications are provided in Appendix C and closely follow Barunik et al. (2011).
The wavelet power spectrum captures the local variance of a time series in a time–frequency domain. This results in a representation of the variance of the time-series over time for frequencies ranging between 1 day to over 1000 days without the need to impose prior restrictions on frequencies used in the analysis. The wavelet power spectrum tests for significance against a null hypothesis that the underlying time-series is stationary, with statistical significance derived from Monte Carlo simulations (Grinsted et al. 2004; Aguiar-Conraria et al. 2008).
The wavelet power spectrum allows us to identify nine significant periods of volatility in BRIC and mature stock markets. These periods are later utilized in the wavelet coherence analysis to distinguish between crisis contagion and interdependence. Consistent with Claessens et al. (2001), increases in correlation or coherence following a crisis indicate a contagion effect, while a consistently high correlation between markets is noted as interdependence.
Wavelet coherence can be interpreted as the squared correlation coefficient between two variables at varying frequencies with the values ranging from zero, signifying no coherence, to a perfect coherence value of 1. A potential drawback of the wavelet coherence analysis conducted in isolation is the failure to differentiate between negative and positive variations. However, this limitation is corrected via the phase difference analysis. In addition, Conlon et al. (2018) note that the Monte Carlo simulation should be applied to determine the significance level for wavelet coherence due to the indefinite distribution of the wavelet coherence tool.
In the wavelet analysis below, the phase arrows indicate the differentiation between positive and negative relationships, comparable to a positive and negative correlation (Madaleno and Pinho 2012). In addition, leading and lagging relationships are distinguished by determining the dominant variable in the positive or negative relationship. Arrows pointing to the right indicate a positive synchronization (an in-phase relationship), while arrows facing to the left indicate a negative synchronization (an out-of-phase relationship). Arrows pointing upward indicate that variable y leads variable x, and the reverse holds for arrows facing downward.

4. Data

Our dataset comprises of daily continuously compounded returns from January 2000 to April 2016 for the following stock markets: Ibovespa (Brazil), Micex (Russia), Sensex (India), Hang Seng (China), EuroStoxx 50 (Europe), S&P 500 (the U.S.) and Nikkei (Japan). The VIX index was included as a fear gauge and potential spillover source to the BRIC stock markets which proved effective in Gurdgiev and Trueick (2016). It should be noted that continuously compounded returns do not require to be tested for stationarity, given wavelet tools’ flexibility and their ability to compress and expand to capture relationships at high and low frequencies (Aguiar-Conraria and Soares 2010). Some papers, e.g., Madaleno and Pinho (2012), utilize level prices data in their analysis via wavelet methodology. We chose to utilize returns for completeness and comparison purposes while correcting for the difference in time zones, trading days and local currencies.
As noted earlier, our data includes nine identifiable bouts of volatility detected via the wavelet power spectrum. These are: the dot.com bubble, the events of 9/11, the U.S. subprime mortgage crisis, the subsequent Global Financial Crisis, the European Sovereign Debt Crisis, the U.S. sovereign debt downgrade, the U.S. Taper Tantrums of 2013 and 2014, the 2015 Chinese Stock market crash and the subsequent Chinese circuit break in January 2016. The time period of our study, therefore, covers multiple periods of high and low liquidity, which is a major addition to the volatility spillover literature (Beirne et al. 2013; Gurdgiev and Trueick 2016).
From Table 1, all BRIC stock markets have positive mean returns. Interestingly, the stock markets with the highest returns exhibit the highest Sharpe Ratio. Gurdgiev and Trueick (2016) note that Russia experienced the most volatile returns in the BRIC due to the economy’s dependence on the oil and gas sector and the large percentage of banking equities within the Micex. Consequently, Russia’s Sharpe Ratio is the highest, at 0.025, with India’s Sharpe ratio of 0.024 being a proximate second, followed by Brazil (0.015) and China (0.004). All BRIC stock markets are negatively skewed, as discussed in Brooks (2014) and Galagedera and Brooks (2007). This observation is amplified by the leptokurtic distribution of stock market returns found in all BRIC cases, which implies ‘black swan’ events are more likely and hence these assets are more risky than assets with normally distributed returns.
From Table 2, the advanced economy stock markets all have lower average returns than their BRIC counterparts and all, bar the S&P500, offer inferior expected returns per unit of risk. In fact, both EuroStoxx and Nikkei have on average negative returns. The Nikkei and EuroStoxx suffered in the aftermath of the dot.com bubble similar to other stock exchanges. However, both markets exhibited more volatile returns post-GFC, with the subsequent European Sovereign Debt Crisis leading to heightened uncertainty in the EuroStoxx. By contrast, the Nikkei recovered quicker post-GFC following the introduction of Abenomics in December 2012. Europe is the only stock market to possess positive skew in returns. All stock exchanges exhibit leptokurtic distributions, which amplify the effects of negative skew.
From Table 3, the stock markets with the highest correlations between advanced and emerging markets appear to be geographically close, i.e., Brazil–US and Japan–China with unconditional correlations over 0.5. Interestingly, Europe appears to have the highest correlation on average with the BRIC with all unconditional correlation coefficients over 0.3. Japan–Brazil has an extremely low correlation of 0.15. In addition, the U.S. has a quite low correlation with Russia, India and China. All correlations are statistically significant at 5% confidence levels or better.
In line with Zhang et al. (2013), Table 4 shows that advanced economies and BRIC stock markets are becoming increasingly integrated post-GFC and that the crisis potentially acted as a structural break to the prior relationship. This integration is not as relevant for Japan and the BRIC stock markets, with India and Japan actually having a lower correlation since the GFC. Generally, of the advanced economies, Japan shows the lowest increases in correlations with the BRIC markets, compared to both the U.S. and Europe. This is probably related to the distinct nature of Japanese economic development following the GFC. Similarly, of all the BRIC economies, Brazil shows the lowest range of changes in correlations with the advanced economies’ markets. While analysis of causality for this phenomenon is outside the scope of the present study, this feature of the data likely reflects the fact that Brazil endured a lengthy period of political and economic instability post-GFC, not present in other BRIC economies. Overall, descriptive statistics point towards a time-varying relationship between mature and BRIC stock markets and the imperfect integration of the BRIC markets into the global financial system.

5. Results

5.1. Continuous Wavelet Power Spectrum

As noted in Section 3 above, we use a continuous wavelet power spectrum to identify significant periods of volatility in the BRIC and mature stock markets. These periods are subsequently used in the wavelet coherence analysis to distinguish between crisis contagion and interdependence between the markets. Increases in correlation or coherence following a crisis indicate a contagion effect, while a consistently high correlation between markets is noted as interdependence.
Before we begin the discussion of results, we provide a brief introduction on how the following charts can be interpreted. The wavelet power spectrum allows for the characterization of the spectral energy (variance) of a time series across both time and frequency. High levels of coherency or correlation are represented by warm colors (e.g., orange and red) while low coherency is depicted by cooler colors (e.g., blue and green). Significant results are framed in black and their significance level is determined via a Monte-Carlo simulation. In the related continuous wavelet charts (presented in Appendix A, Appendix B and Appendix C), phase-difference arrows in an upward direction indicate that a specific BRIC market leads a specific mature market, or put differently, a BRIC market dominates the BRIC–mature stock market relationship. Conversely, an arrow pointing in a downward direction indicates a mature stock market is leading the BRIC–advanced stock markets relationship. Arrows facing to the left indicate an out-of-phase or negative relationship between the two markets, while arrows facing to the right indicate an in-phase or positive relationship.
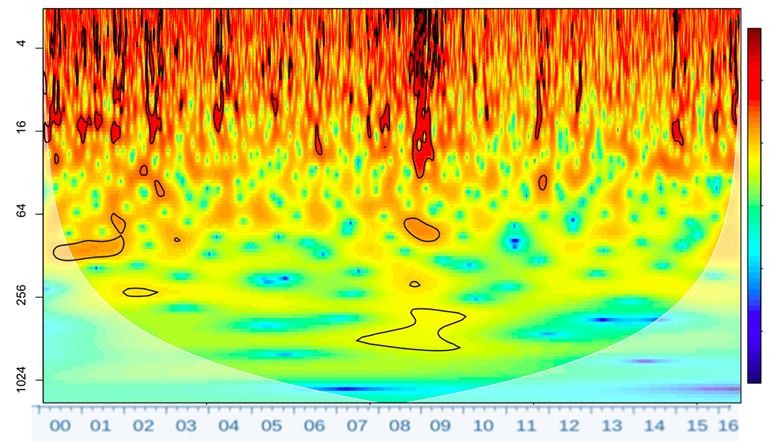
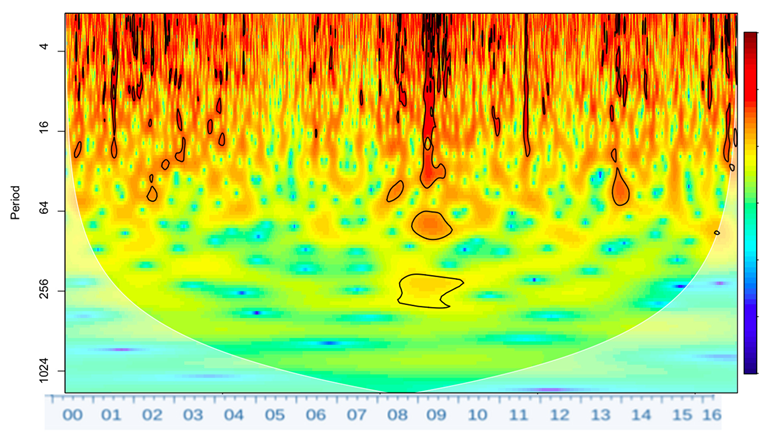
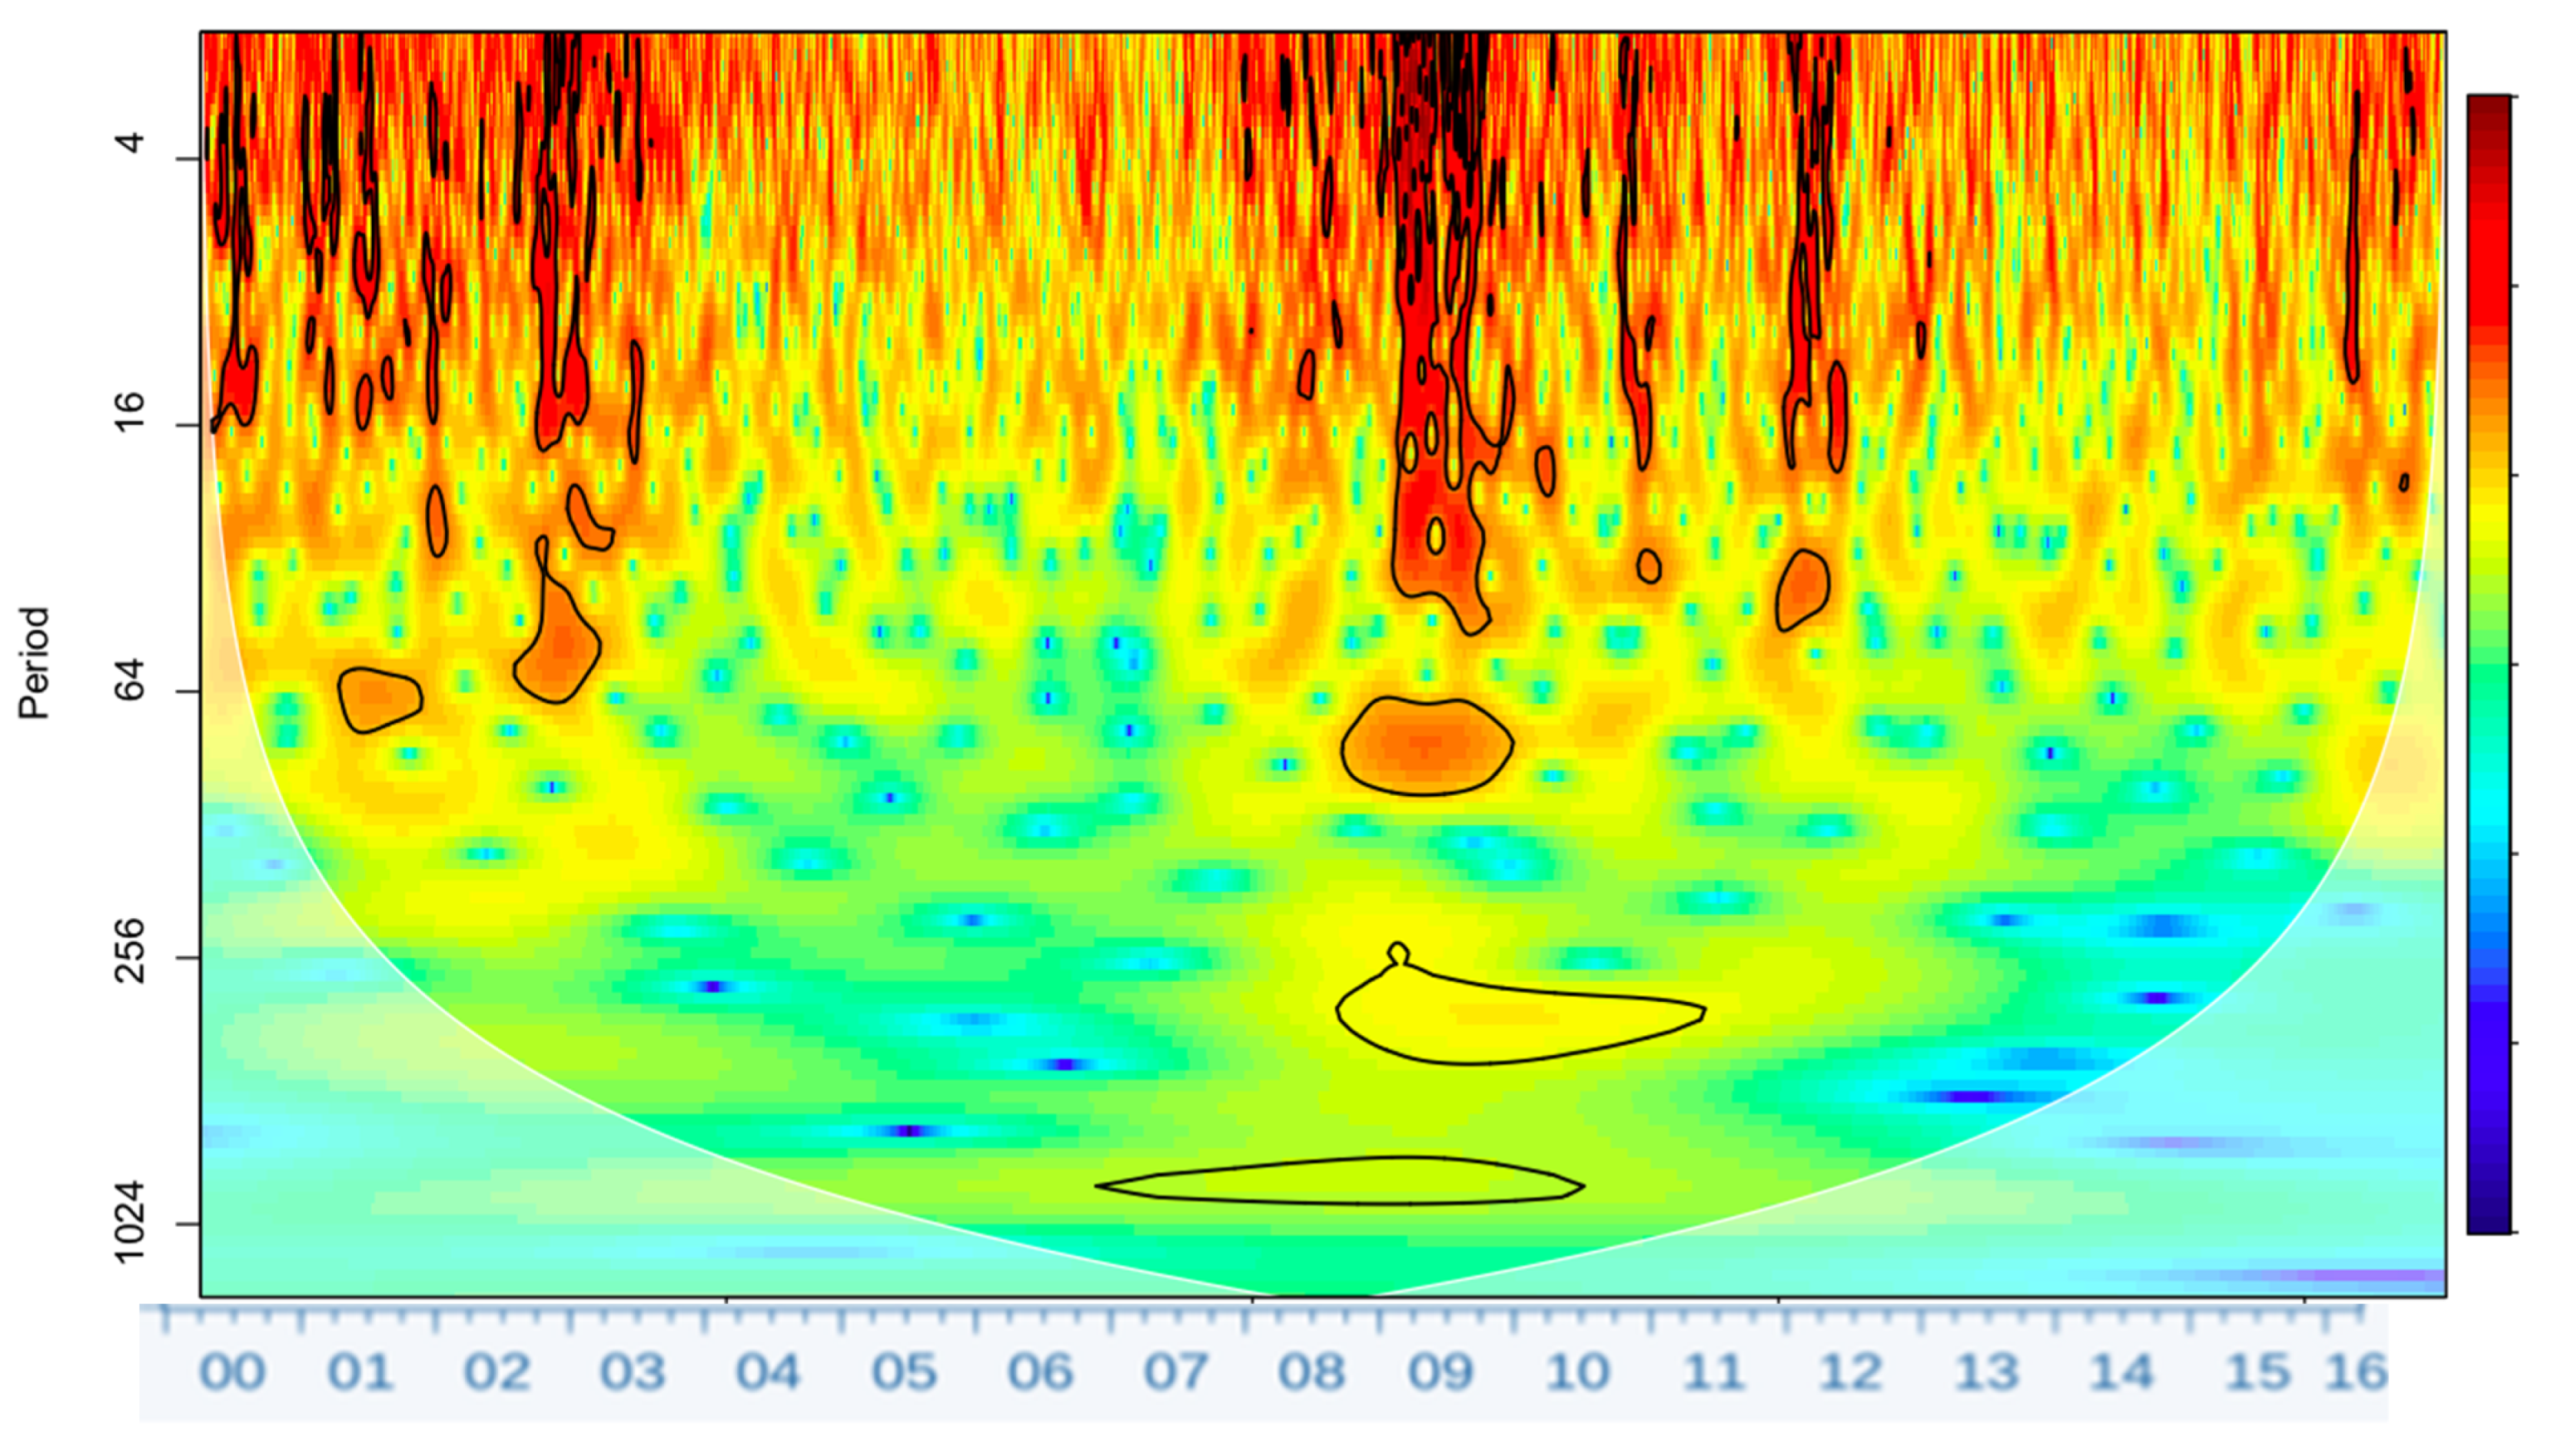
Figure 1 shows a continuous wavelet spectrum analysis of S&P500 compounded returns. Time is captured on the horizontal axis and frequency is shown on the vertical axis. We cover frequencies from one day to over 1000 days. Volatility (spectrum power) ranges in color from blue to red, representing low to high volatility. Results inside the shaded white region should not be included in the analysis due to potentially spurious correlations, deriving from edge effects mentioned in Section 3 above.
Across all frequencies, nine significant bouts of volatility are identified via the wavelet power spectrum: the dot.com bubble, 9/11, the U.S. subprime mortgage crisis, the subsequent GFC, the European Sovereign Debt Crisis, the U.S. sovereign debt downgrade, the Taper Tantrum initiation in May 2013, the 2015 Chinese Stock market collapse and the subsequent Chinese circuit break in January 2016.
The first immediately identifiable crisis lies at the start of the sample period, March 2000. This was the period of explosive volatility associated with the dot.com bubble. This increased volatility is detectable at frequencies between 1 day and 16 days over the first year, leading up to 64 days of significantly high power in 2002 and 2003. 9/11 effects are also evident between 2002 and 2003. The September 2001 terrorist attacks on the U.S. resulted in a spike in volatility which lasted up to 65 days.
Following 2003, the recovery from the dot.com-related recession and subsequent boom underpinned by the rapid financialization of the global economy demonstrated no significant bouts of volatility up until the subprime mortgage crisis that started in August 2007 and the subsequent Global Financial Crisis of September 2008. In comparison to the dot.com bubble, which exhibits periods of highly significant volatility followed by a rapid calming of the markets, the GFC resulted in 18 months of persistently high and significant volatility. In addition, the GFC period shows phases of significant volatility at frequencies of 250 to 1000 trading days, further highlighting the scale of the crisis.
In May 2010, the European Sovereign Debt Crisis spread uncertainty and fear regarding the future of the world’s largest economic union, and this uncertainty spilled over to the S&P500. In contrast to the GFC, this bout of volatility, despite reaching a significant frequency of 64 days, was not persistent and shows a shorter duration.
The next period of high volatility arose from the Standard and Poor’s downgrade of the U.S. sovereign debt from AAA to AA+ and Moody’s altering their ratings to incorporate a negative outlook for the U.S., triggered by the failure of the U.S. Congress to raise the U.S. debt ceiling. Generally, however, Figure 1 shows the U.S. markets to be relatively free of significant volatility at frequencies above 64 days outside the global crises (dot.com crisis and the GFC).
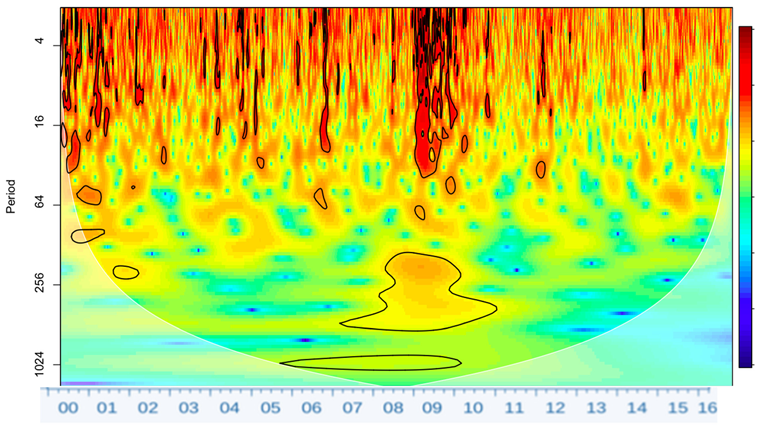
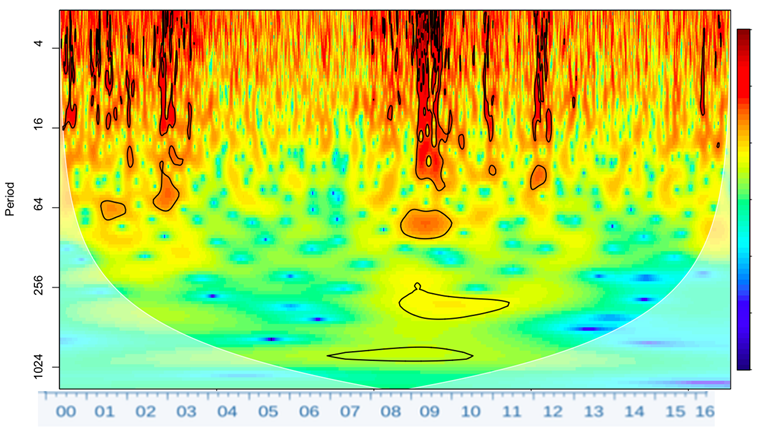
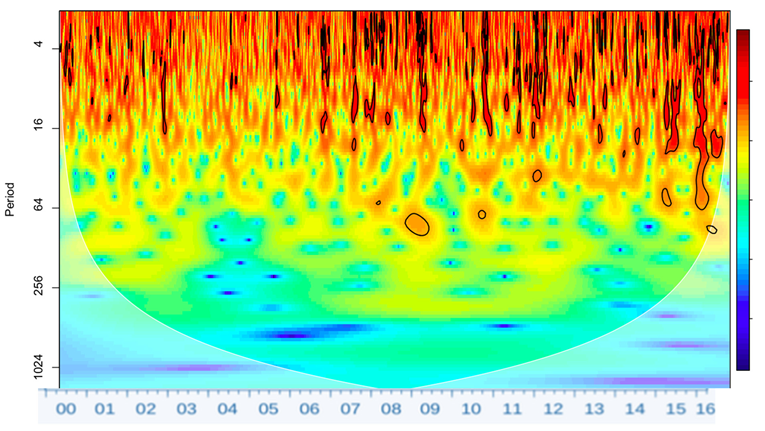
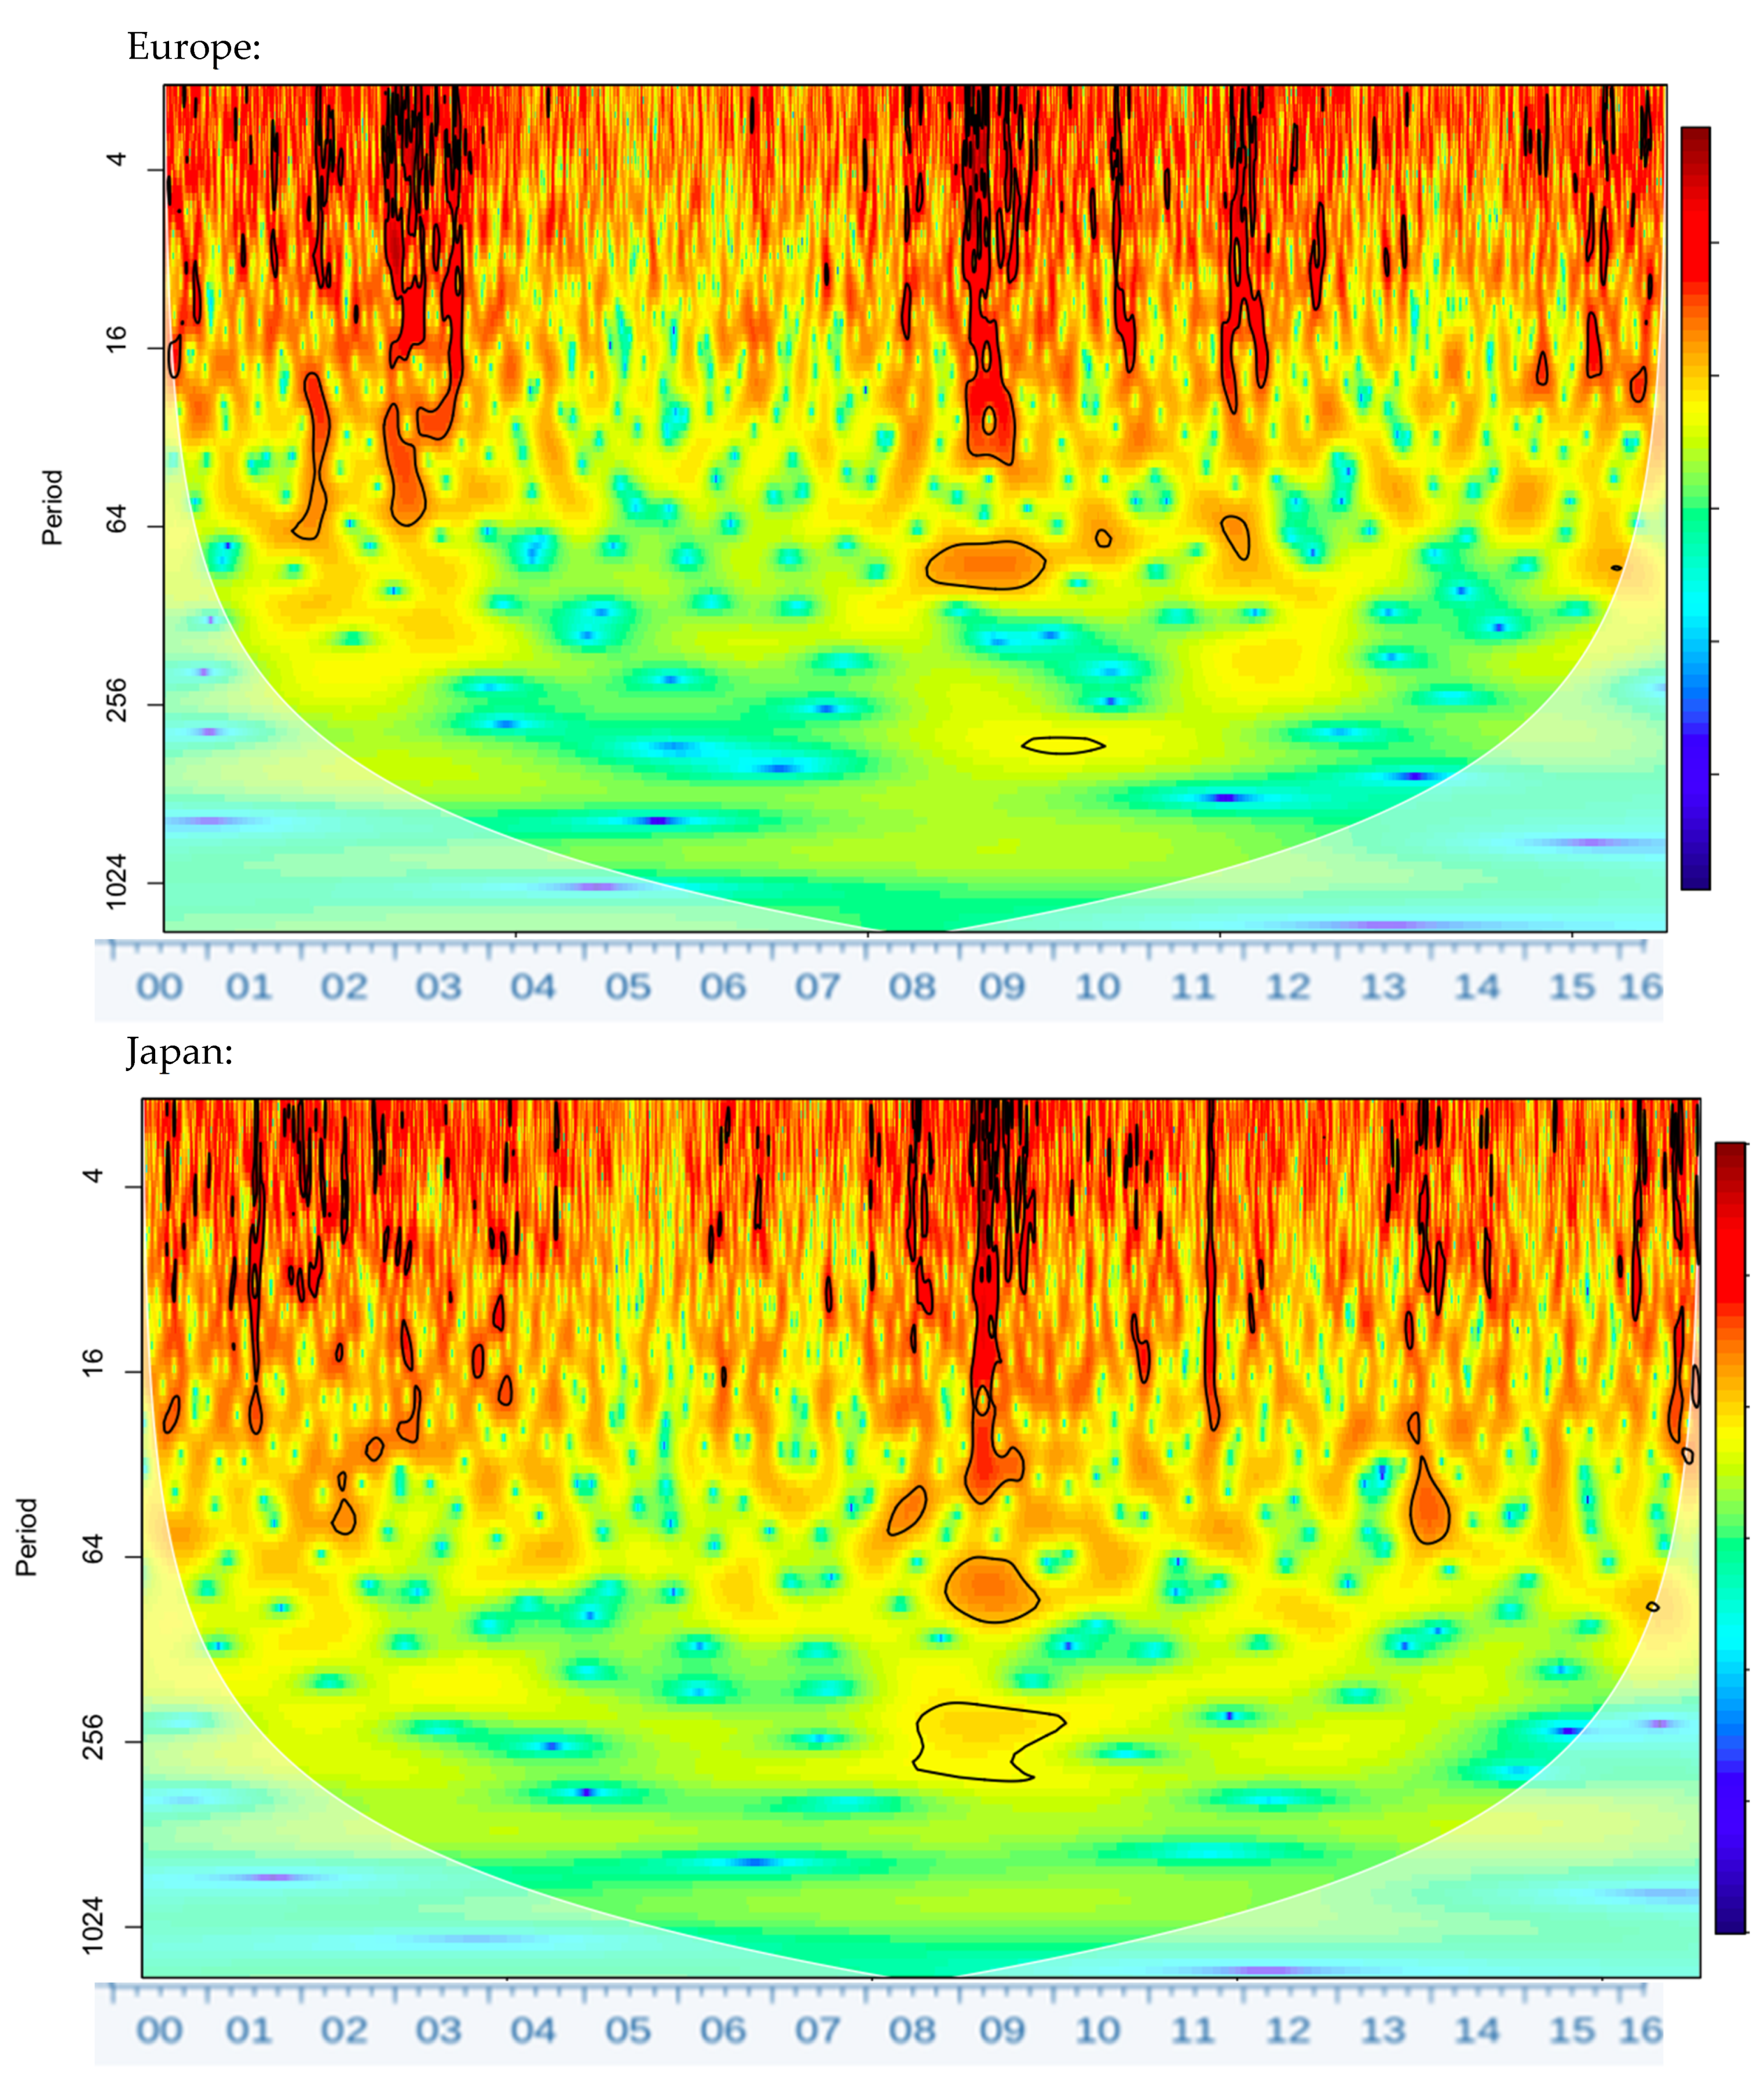
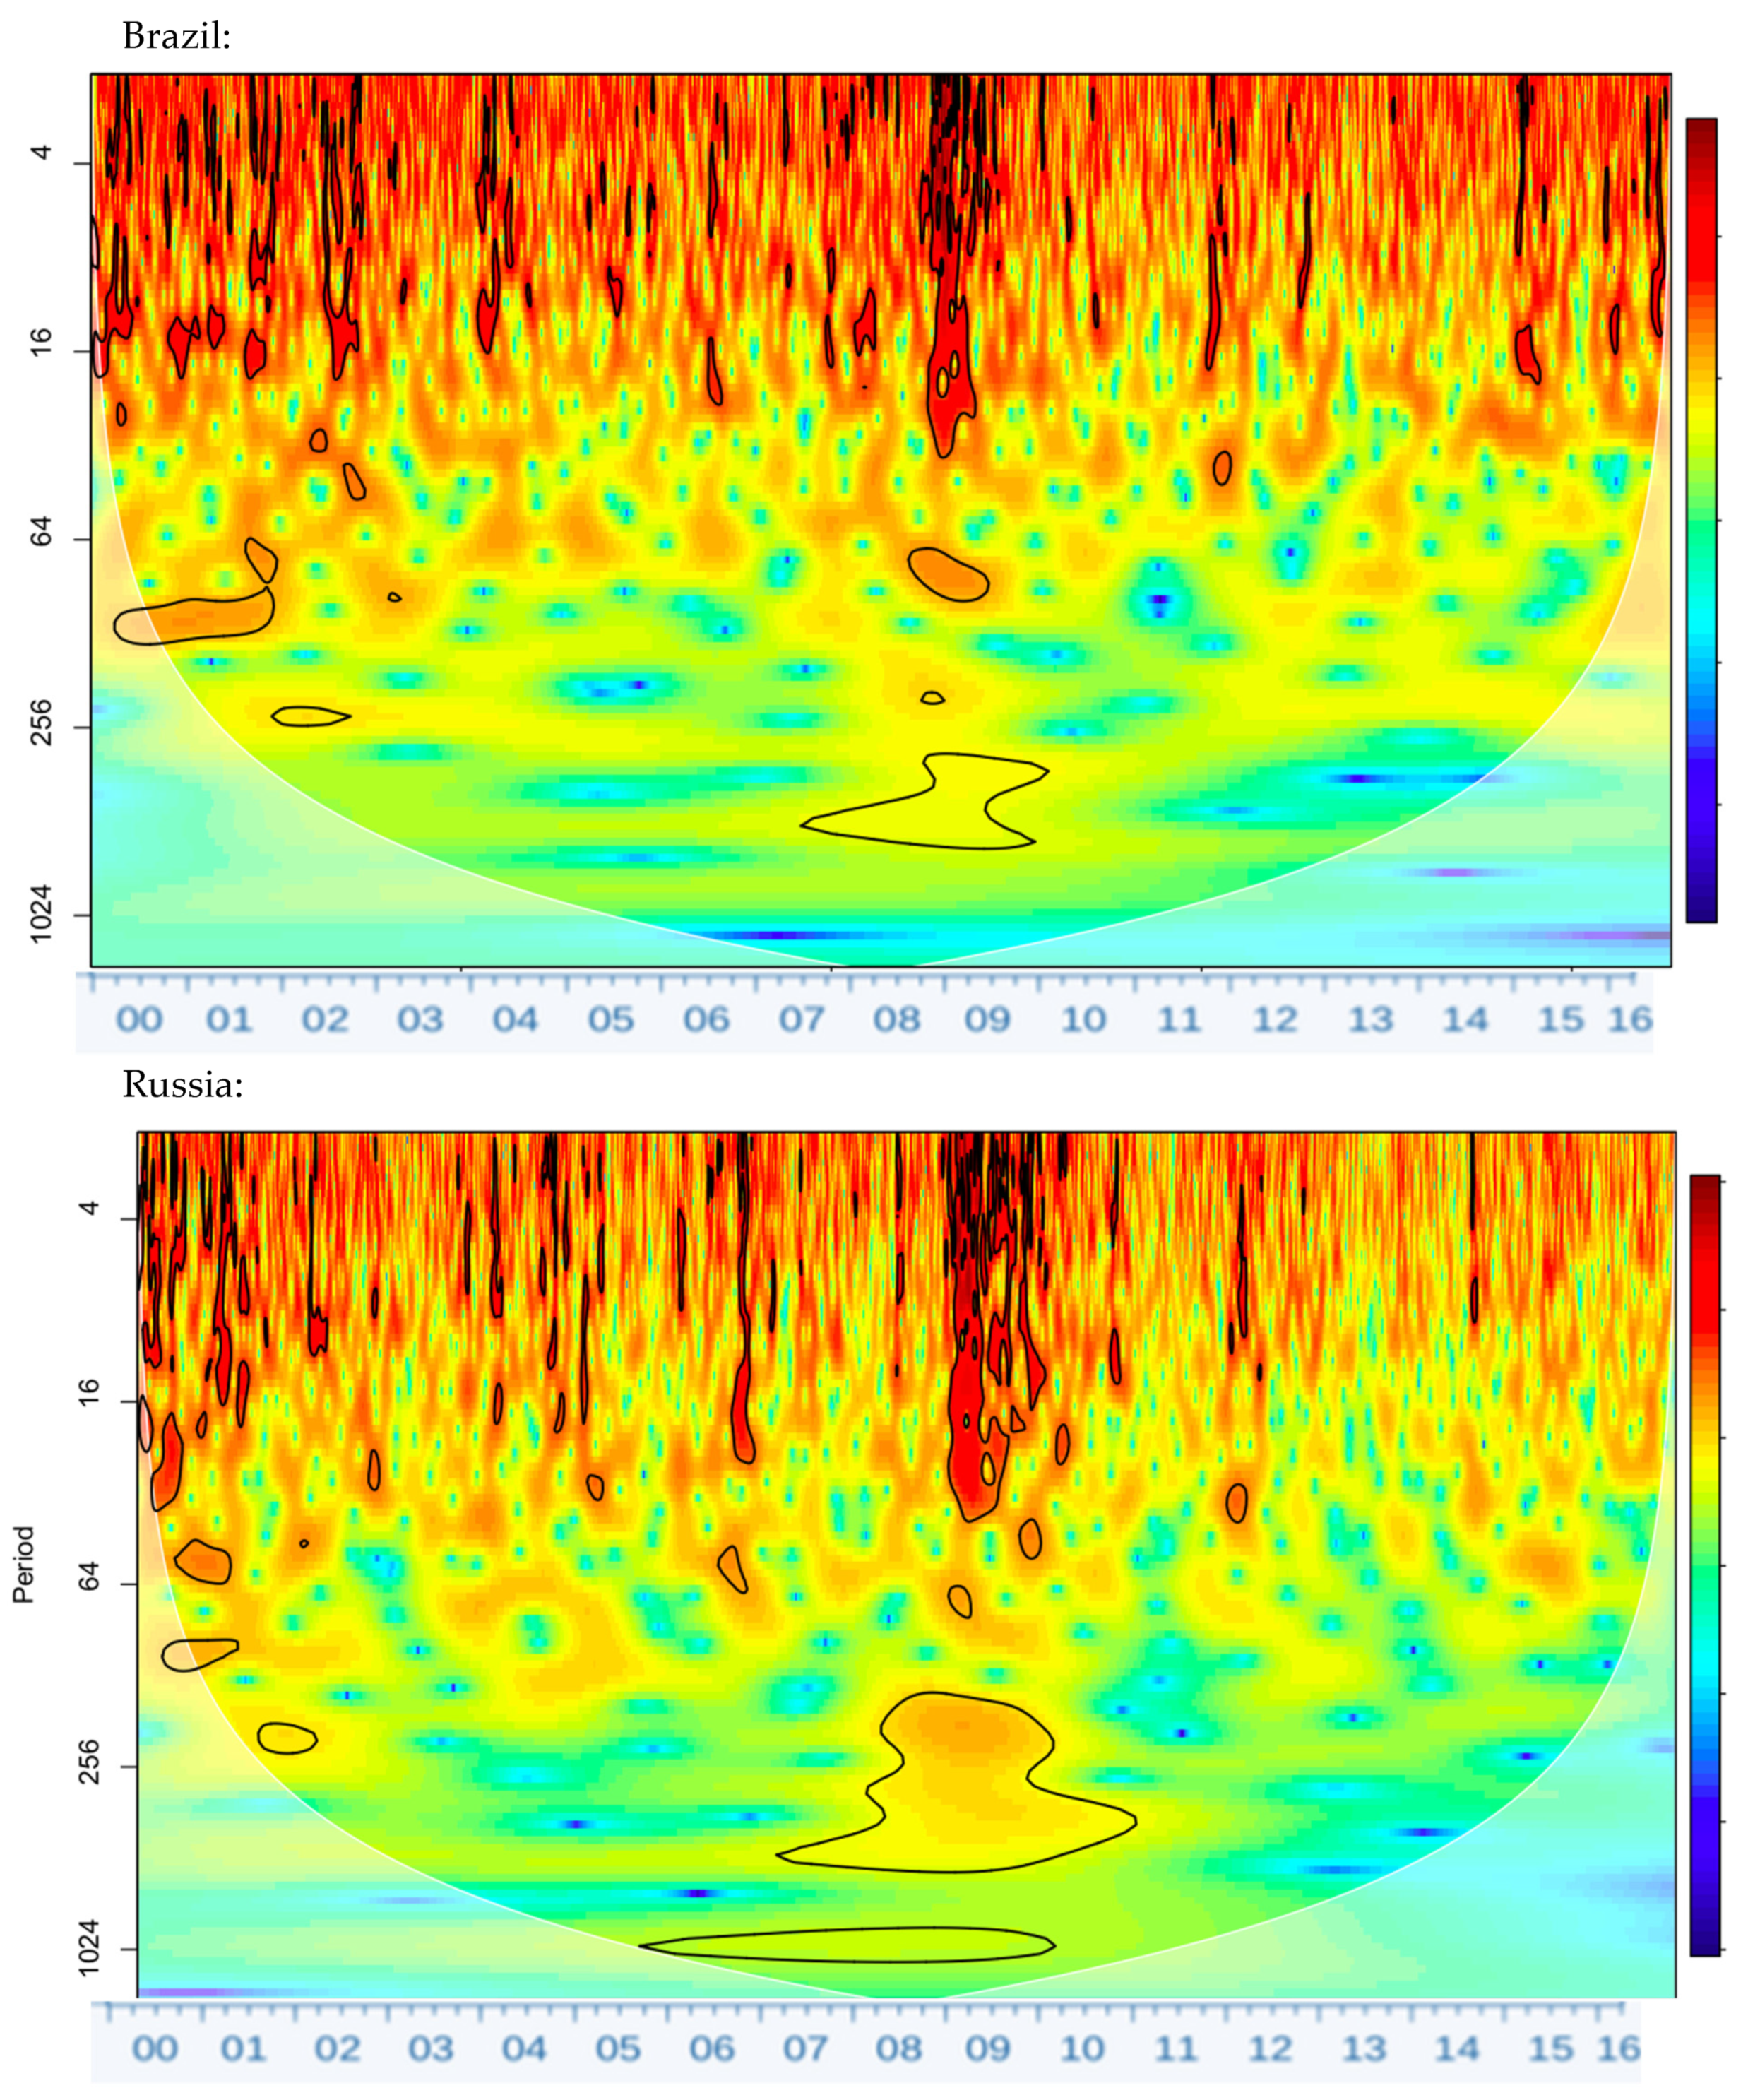
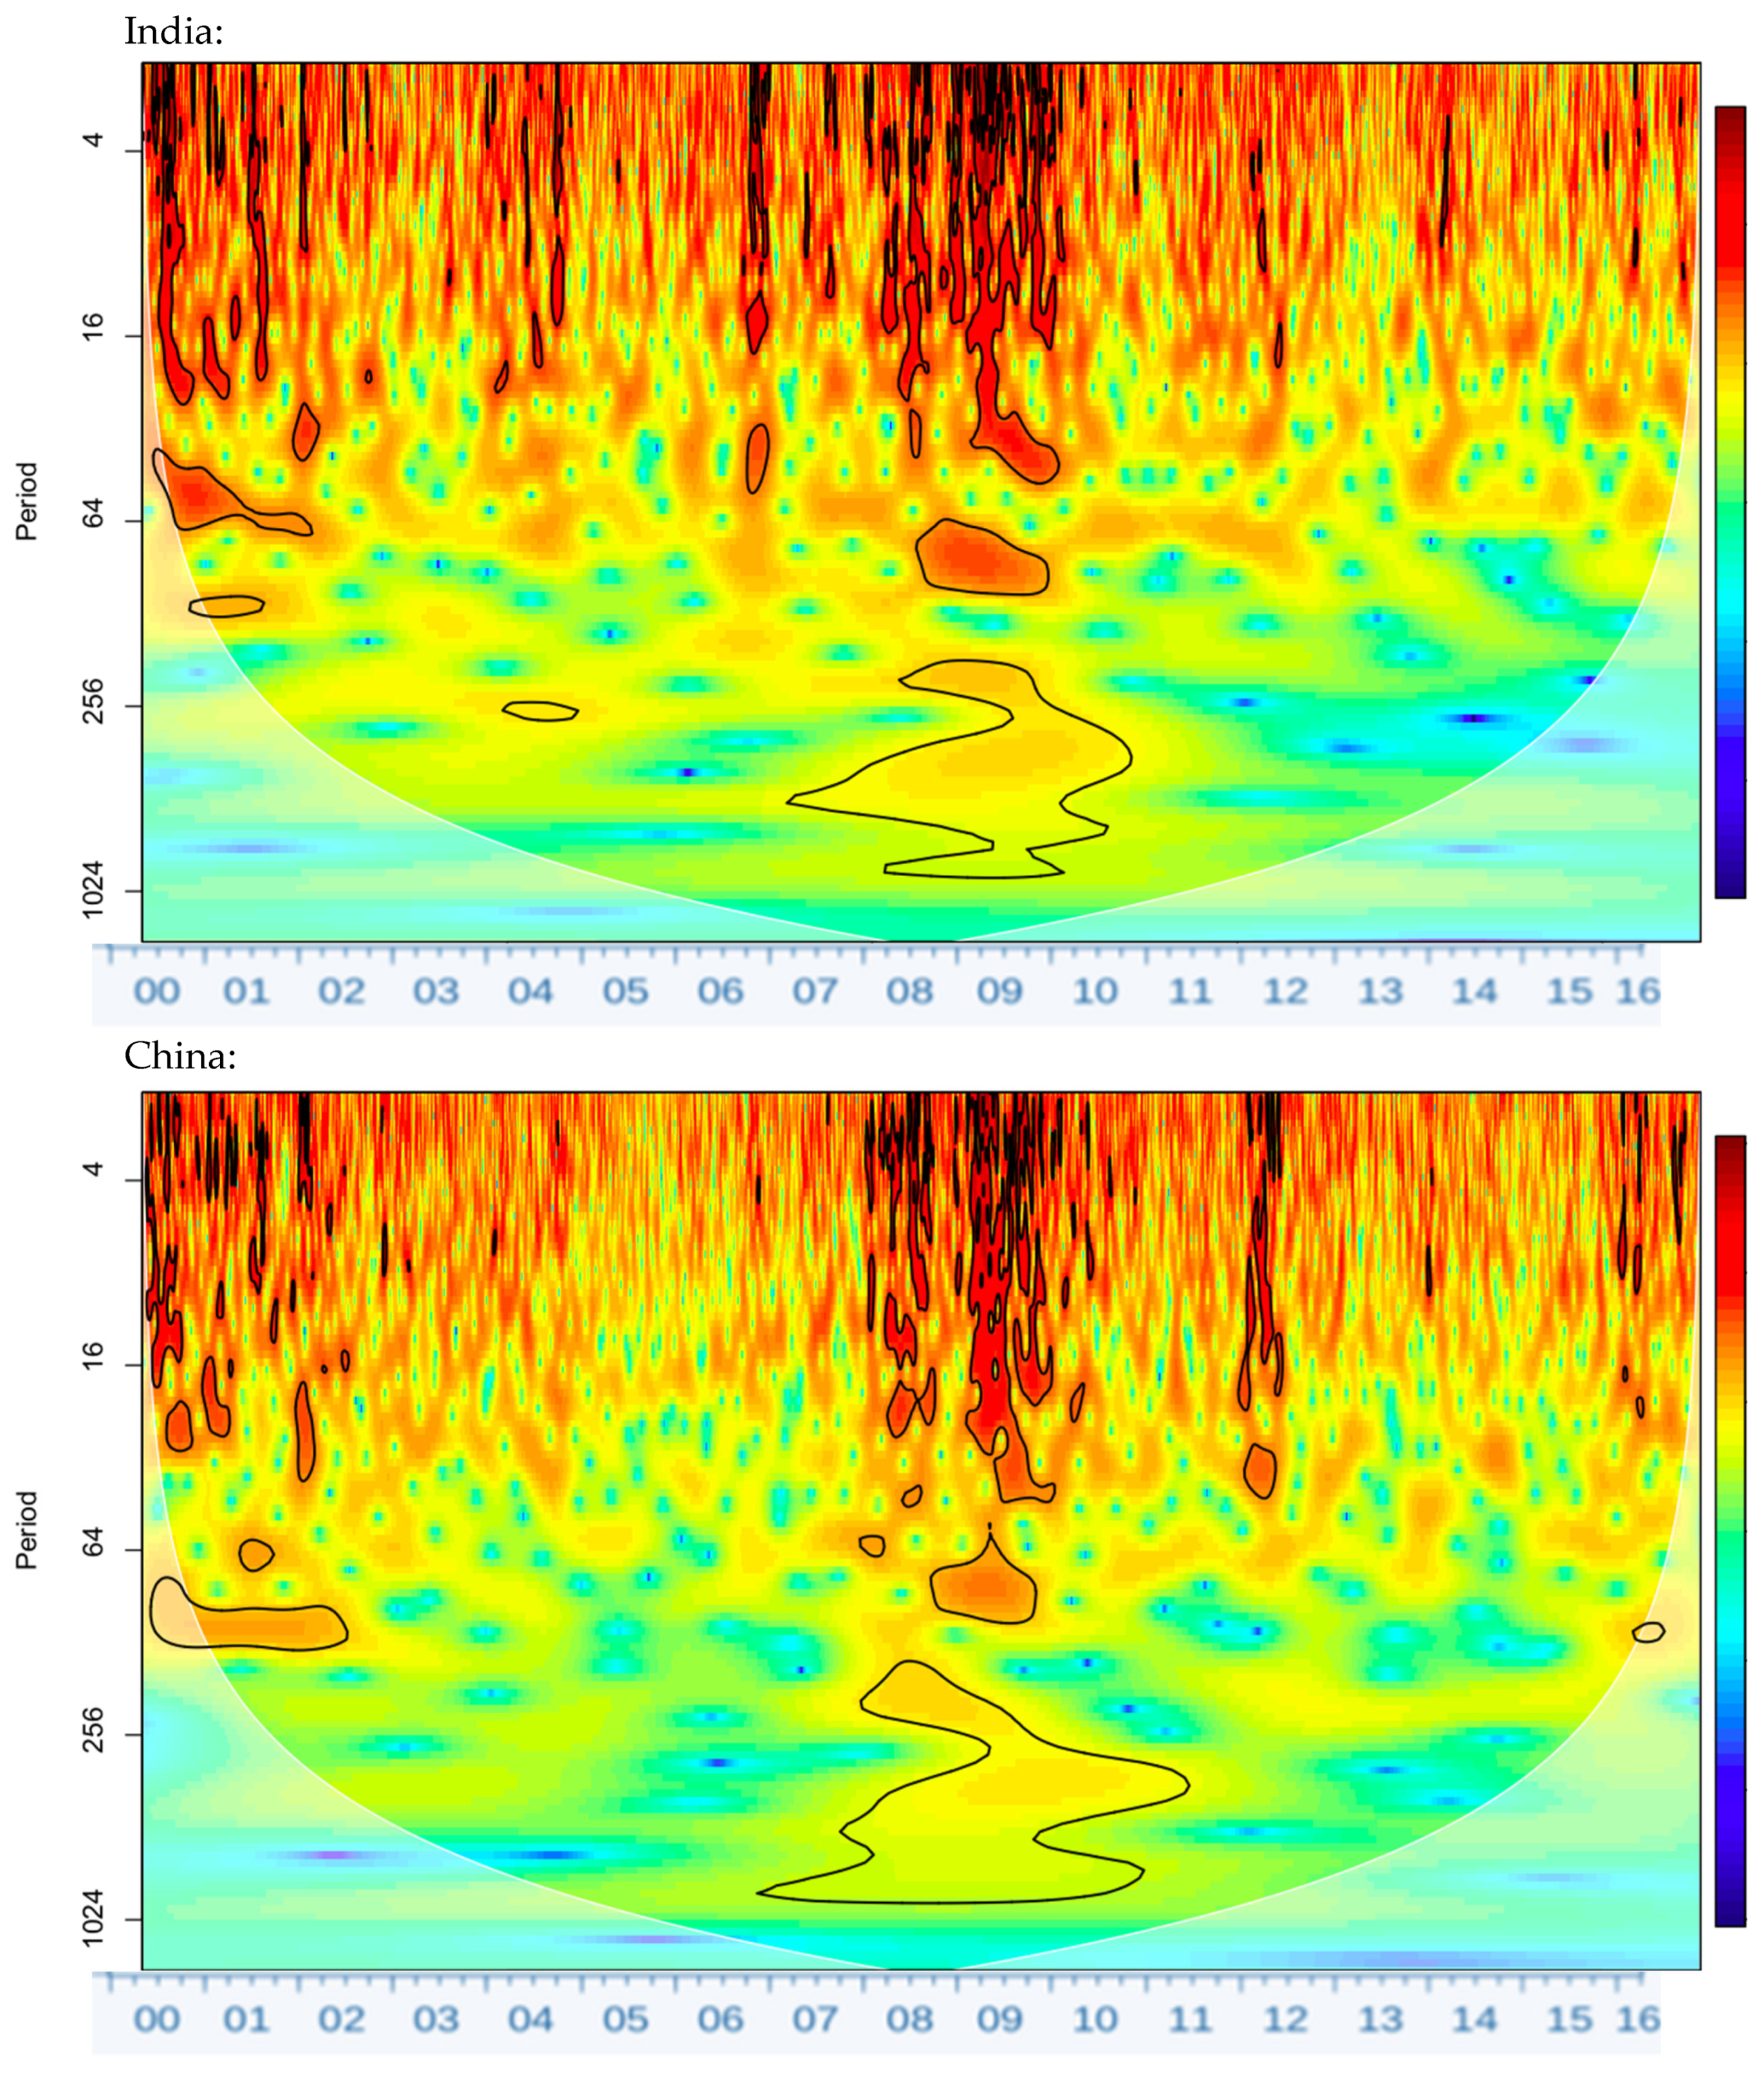
Figure 2 demonstrates that the dot.com bubble implosion in the early 2000s was more short-lived in the BRIC markets and significant levels of volatility ceased in early 2002 compared to 2003 for Europe and the U.S. Volatility is evident in all BRIC markets between 1 and 64-day frequencies. However, in addition, in earlier years of the sample, all of the BRIC markets exhibited significant volatility at up to the 100-day frequency. Most likely, this result in part stems from the extremely high levels of volatility emerging markets were exposed to during the late 1990s.
The subprime mortgage crisis of 2007 and subsequent GFC are highly significant in all BRIC markets and their continuous wavelet power spectrums closely resemble that of the U.S. wavelet power spectrum (Figure 1 and Appendix B). Additionally, India and China appear more volatile than the other BRIC. This result is potentially due to the high commodity prices persisting during the period, which provided a cushion for the commodities-exporting Brazil and Russia.
From Figure 2, it is clear that the bouts of volatility identified in the U.S. are similarly shared in emerging and advanced economies—indicating that crisis contagion is present in international stock markets. However, China was relatively immune to the European sovereign debt crisis. In addition, European, Japanese and Chinese stock markets were the only stock markets to show a significant reaction up to a 16-day frequency to the commencement of the Taper Tantrum in 2013. The Brazilian and Chinese stock markets exhibited a shorter frequency reaction, significant for two to four days. Russia exhibited no evidence of crisis contagion.
The most interesting volatility bouts in this study are in fact those originating from emerging markets, in particular China. The 2015 Chinese stock market crash and the 2016 circuit break are isolated and highlighted by white dashed lines. These periods of volatility are highly significant in the advanced stock markets. This result implies that spillovers between the BRICs’ and the advanced economies’ markets are becoming increasingly bidirectional and that the BRIC markets have now reached both depth and scale that enables BRIC economies to originate contagion to the advanced economies. Since the GFC, China and Brazil appear to be more integrated in the global financial system in terms of significant shared bouts of volatility. However, China acted as a potential strong diversifier to advanced economies’ markets during the European Sovereign Debt crisis and Russia during the Taper Tantrum.

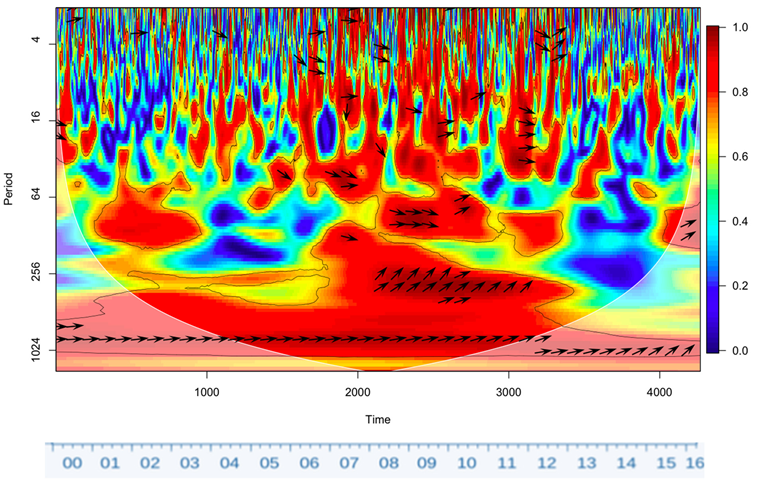
5.2. Wavelet Coherence and Phase Difference

Continuous wavelet coherence and phase difference are captured in one graph which displays the relationship between the U.S., Europe, Japan, the VIX and each BRIC stock market. This analysis enables further study of crisis contagion and the levels of integration between emerging and advanced economies. Hence, this section will determine the benefits of international diversification and test Zhang et al.’s (2013) hypothesis that the financial crisis was a structural break that increased the integration between the BRIC and advanced economies.
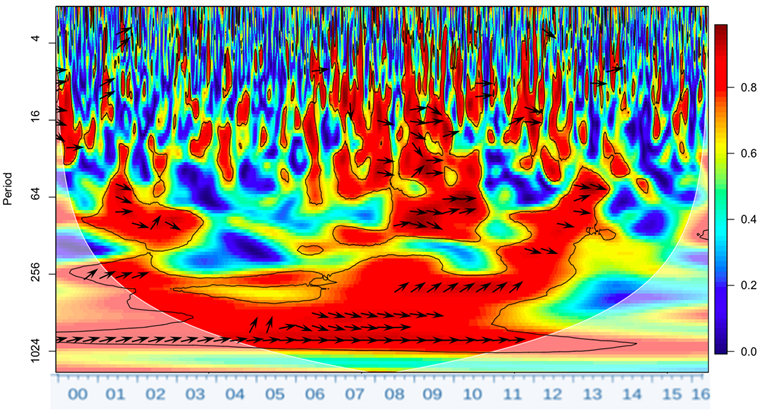
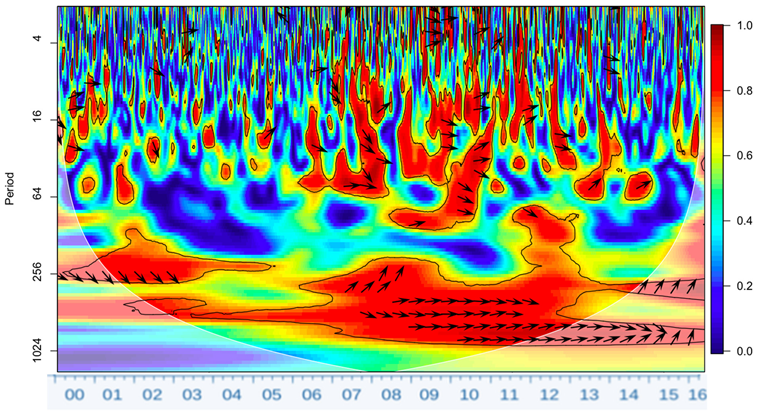
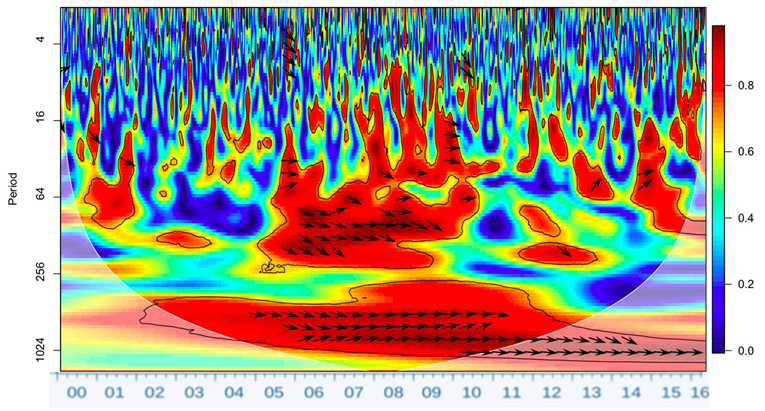
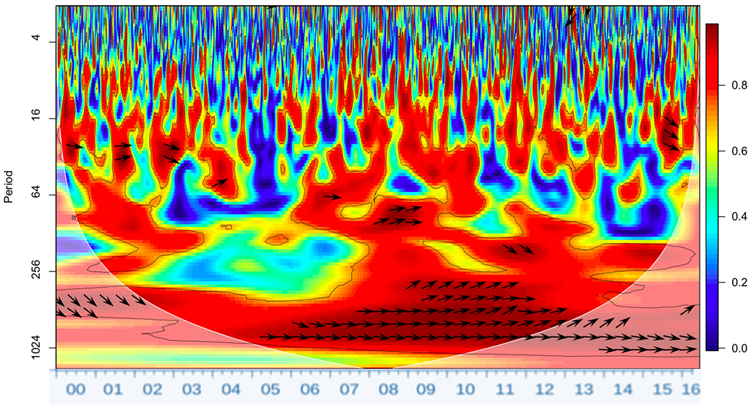
Appendix A presents wavelet coherency plots. High levels of coherency or correlation are represented by warm colors while low coherency is depicted by cooler colors such as blue and green. Significant results are framed in black and their significance level is determined via a Monte-Carlo simulation. Similar to the wavelet power spectrum, results in the white shaded area, the cone of influence, should be ignored as their interpretation may lead to spurious results. Phase difference arrows in an upward direction indicate that a BRIC leads or dominates the BRIC-mature stock market relationship. Conversely, an arrow pointing in a downward direction indicates that a mature stock market is leading the BRIC-advanced economy stock market relationship. Arrows facing to the left indicate an out-of-phase or negative relationship, while arrows facing to the right indicate an in-phase or positive relationship.

5.2.1. The U.S. and the BRIC

In Appendix B, in the figures covering continuous wavelet transforms between the U.S. and the BRIC, the most noticeable relationship common between the U.S., Brazil, India and China is the black-boarded (statistically significant) relationship between the U.S. and the aforementioned BRIC in the long run at low frequencies. This relationship is significant at the 500-day frequency level and higher for the entire sample period. In this, the U.S, stock market leads as evidenced by the downward-right direction of the phase arrows in Appendix B. The Russian index is the least correlated with the U.S., as indicated by the large blue regions present especially prior to 2007 and particularly at high frequencies.
In addition, crisis contagion is quite evident: in each crisis, there appears to be an increase in coherence between stocks markets. The dot.com bubble and 9/11 caused increases in the correlation between the U.S. and both Brazil and China. Prior to the GFC, Russia and India appear less correlated during crises. From a U.S. investor perspective, this suggests that pre-2008, these emerging markets were a good source of diversification, particularly at shorter frequencies up to 16 days. Prior to 2007, China was the most integrated market vis-à-vis the advanced economies, followed by Brazil, India and Russia. Post-2007, all BRIC markets became increasingly more strongly correlated with the U.S., albeit to a varying degree, indicating growing global stock markets integration. From 2007-on, the subprime mortgage crisis, the subsequent GFC, European Sovereign Debt Crisis and U.S. sovereign debt downgrade lead to five years of increased interdependency at lower frequencies and evident stock market contagion. During and post the GFC, Brazil was the most integrated of the BRIC markets with the U.S., echoing Zhang et al.’s (2013) findings of the GFC as a structural break in global market integration trends. Interestingly, despite the increased integration of all of the BRIC, the aforementioned arbitrage opportunity for international portfolio holders at high frequencies remained evident for the Indian and Russian stock markets. However, the opportunity window decreased to 10 days from 16 days in the prior periods.
The Chinese stock market crash in 2015 presented an example of stock market contagion that mirrors Yellen’s (2016) observations and skepticism about an increasingly globalized nature of the financial markets, where the U.S. is no longer the only originator of contagion. Hence, bi-directional contagion is found in this paper originating from China to the U.S. and it is highly significant, particularly in the 6-day to 70-day frequency range.
From the above, we can conclude that there is evidence of interdependence between the BRIC and the U.S. in the long run and significant crisis contagion at higher frequencies from 1 day up to 64 days during most crises excluding the GFC, which was significant at all frequencies. This interdependence is not perfect: India and Russia are less interlinked with the U.S. stock markets. In addition, emerging markets now have the ability to originate contagion and policymakers and investors can no longer ignore this channel for global shocks transmission.

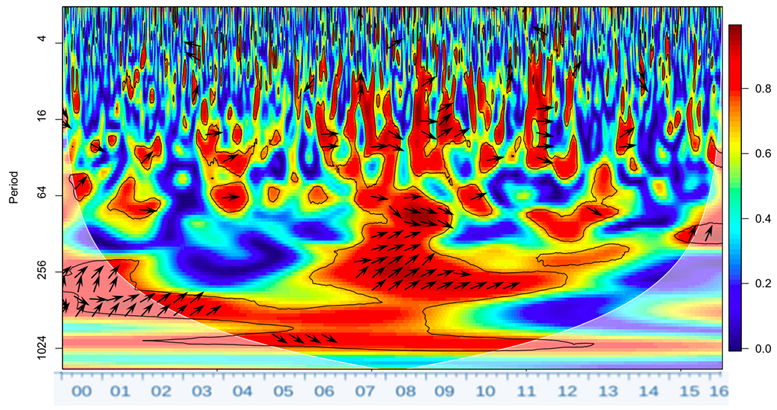
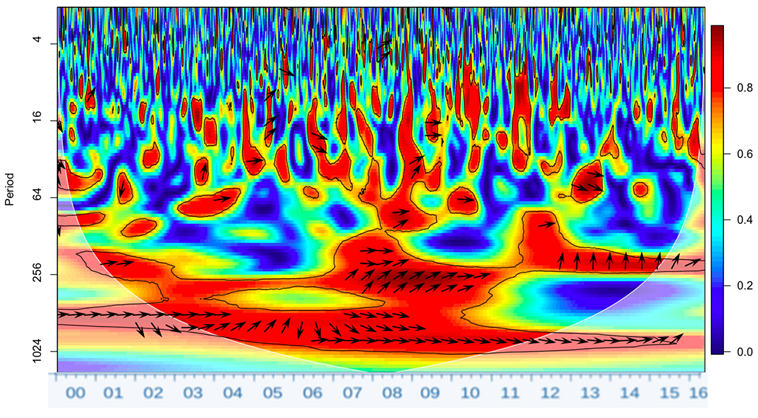
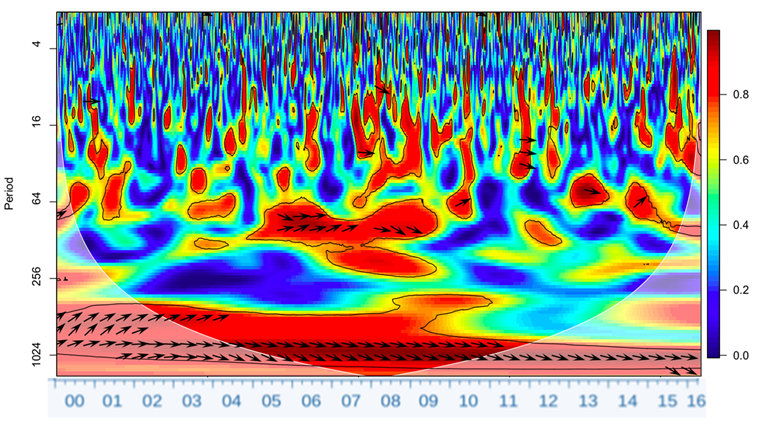
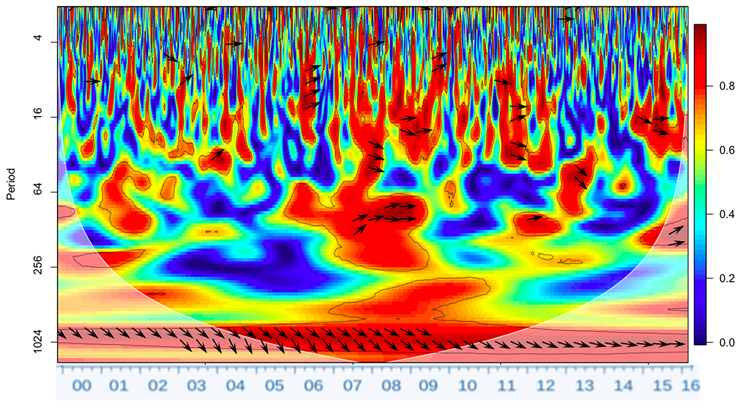
5.2.2. Europe and the BRIC

Similar to the findings relating to the U.S. markets, India and Russia are also the least integrated markets with respect to Europe, as indicated by the smaller areas of significant correlations (black-framed regions) and lower strength of correlations (blue regions) in figures covering continuous wavelet transforms between Europe and the BRIC, as shown in Appendix B. In the opposite direction of spillovers, Europe appears less correlated with the BRICs. However, the European Sovereign Debt Crisis resulted in contagion to both Russia and India. Likewise, the Chinese stock market implosion in 2015 and the circuit break episode in 2016 transmitted volatility to Europe. In terms of Zhang et al.’s (2013) proposition that the GFC resulted in a structural break in the prior regime of contagion, Russia and Brazil appear less integrated with Europe, particularly at frequencies under 30 days.

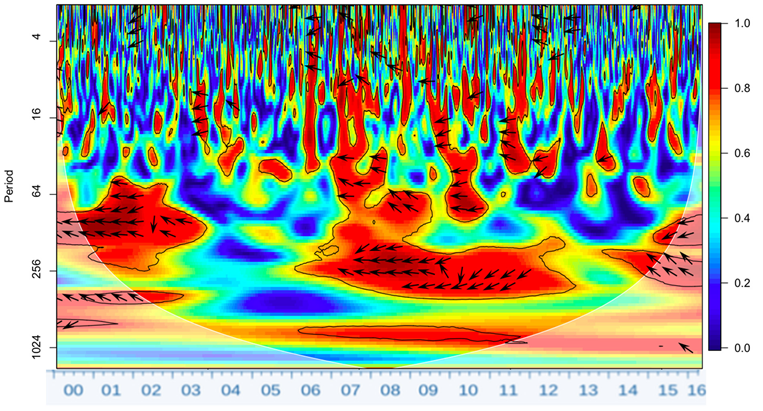
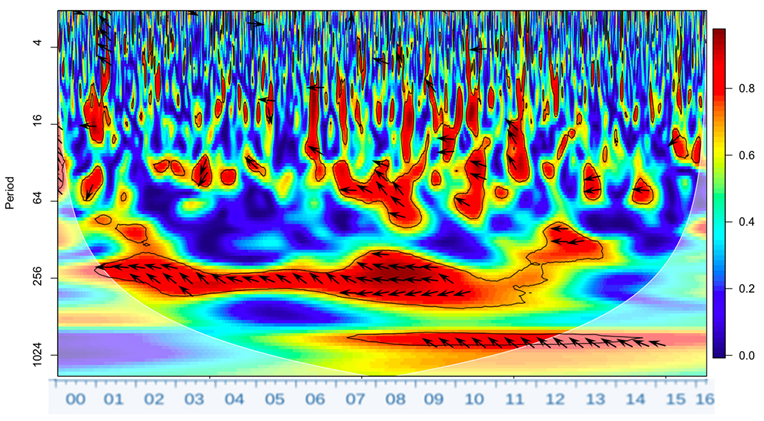
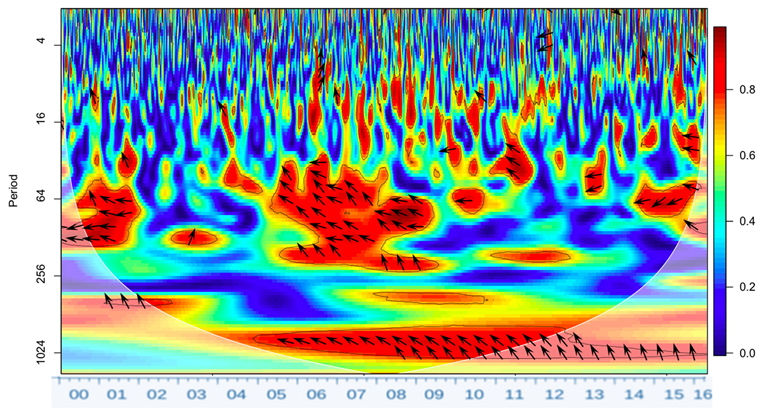
5.2.3. Japan and the BRIC

Figures covering continuous wavelet transforms between Japan and the BRICs in Appendix B show the relationship between Japan and the BRIC that strongly contrasts with the U.S. and European perspectives. Over a five-year period following the GFC, the Japanese and Russian stock markets were negatively correlated, with Japan leading this relationship, as indicated by the downward phase-difference arrows. There is no coherent relationship at shorter frequencies, and hence the Russian stock market presented an excellent diversification addition to Nikkei. In addition, China leads the relationship between the Hang Seng and Nikkei at low frequencies. Following the initiation of Abenomics in December 2012, there appears to be little integration in the short run between both stock markets. However, Japan was strongly affected by the Chinese stock market crash in 2015.

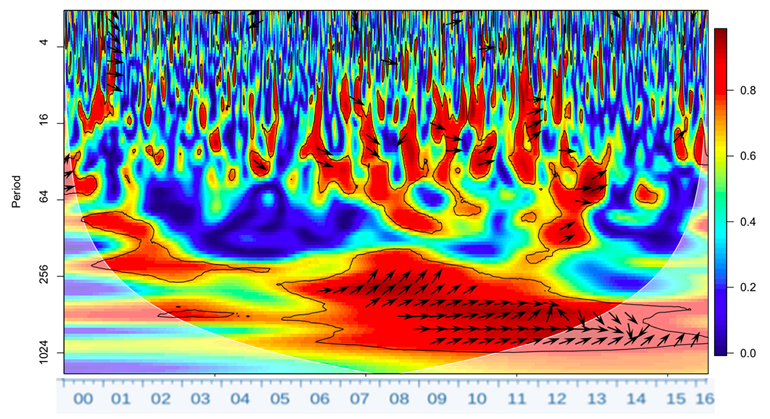
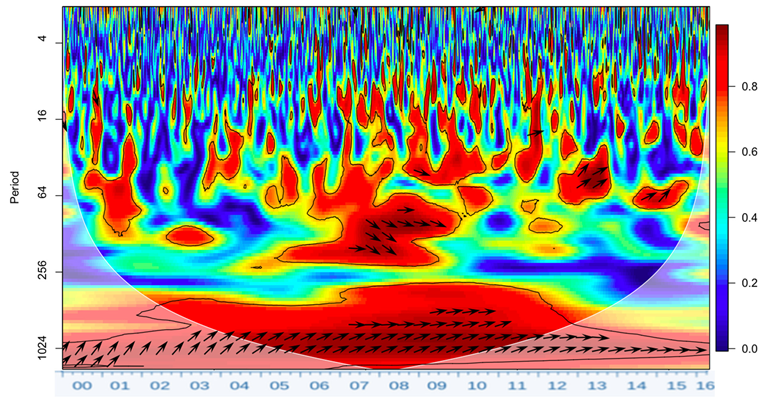
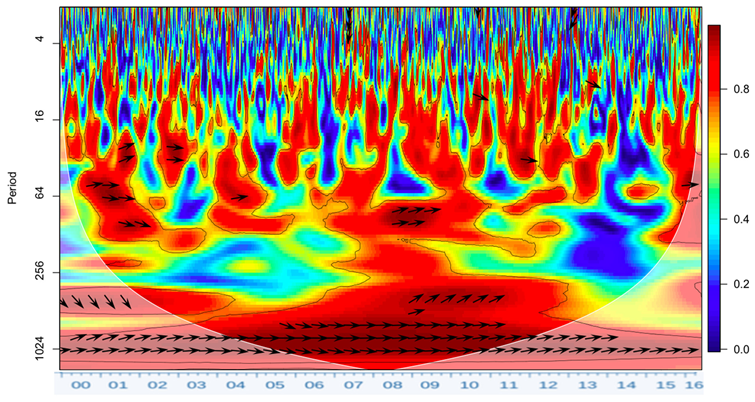
5.2.4. The VIX and the BRIC

The VIX is utilized in this study as a fear gauge and provides a database for the analysis of forward-looking volatility spillovers from the U.S. to BRIC stock markets. Based on the literature reviewed earlier and intuitively, we should expect that an increase in the S&P 500 futures volatility would translate into lower returns in BRIC markets. This expectation is confirmed in the figures covering continuous wavelet transforms between VIX and the BRIC in Appendix B, which show an out-of-phase relationship between VIX and the BRIC, particularly for Brazil and China. This is also consistent with our findings regarding U.S.–BRIC market contagion channels. From a wavelet perspective, there is a strong and time-varying relationship between VIX and Indian stock markets that was particularly significant in the GFC period and in 2013 at low frequencies. At higher frequencies, the VIX –India relationship is significant, particularly at frequencies greater than seven trading days.

6. Conclusions

Our findings show that following the GFC, volatility spillovers between BRIC markets and advanced economies became bidirectional in nature. This new nature of volatility contagion is confirmed in our analysis of spillovers in reaction to the Chinese stock market collapse in August 2015 and the subsequent circuit break in January 2016. In addition, strong volatility spillovers from advanced economies were documented in the dot.com bubble crisis, during the GFC, the European Sovereign Debt Crisis and the U.S. sovereign debt downgrade. The Chinese stock market acted as a strong diversifier to advanced economies’ markets during the European Sovereign Debt Crisis. Despite the increasingly integrated nature of the BRIC stock markets with respect to global markets, arbitrage opportunities based on the BRIC markets’ correlations with the advanced economies’ markets continue to exist during major crises and market shocks. When a crisis emanates from the U.S. or Europe, it can take up to 16 trading days to transmit volatility from the crisis source to the BRIC stock markets, implying potential opportunities for investors to liquidate BRIC portions at minimum cost. In addition, it appears Russian and Indian stock markets remain the least integrated in the global financial system and have the potential to provide diversification benefits in international portfolios. In particular, from a Japanese investors’ perspective, the Russian stock market has had a negative volatility spillover relationship with the Nikkei market post-2012.
Overall, arbitrage and diversification benefits, including BRIC stocks, are evident for international stocks portfolios with a bias toward the U.S., European and Japanese equities. However, these benefits are time-varying and heterogeneously distributed across the BRIC, as channels for contagion and volatility transmission from the advanced economies to the BRIC and vice versa grow stronger over time. The equity home bias in advanced economies investors’ portfolios is becoming more justified.

Author Contributions

C.G. acted as a lead supervisor of the research project, contributing to the formulation of the core research idea, main hypotheses and identifying events and markets covered, leading the process of writing, interpreting results, and ensuring the robustness of the empirical analysis. C.O. was involved in data preparation and analysis, as well as the preliminary preparation of the paper. All authors have read and agreed to the published version of the manuscript.

Funding

Authors received no external funding in relation to this research.

Institutional Review Board Statement

Not applicable.

Informed Consent Statement

Not applicable.

Data Availability Statement

All data used in the study is available from the corresponding author upon a request.

Conflicts of Interest

There is no conflict of interest to disclose with respect to this paper.

Appendix A. Charts for Wavelet Power Spectrum

The wavelet power spectrum allows for the characterization of the spectral energy (variance) of a time series across both time and frequency. Bouts of volatility/variance are highly persistent during global crises, particularly the GFC, from a high frequency of 1 day right up to 50 days during the GFC.
Brazil (Ibovespa):
Jrfm 14 00503 i001
  • Dotcom Bubble volatility was evident between 2000 and 2001 following the Asian Financial Crisis in 1997—this volatility continued until late 2002, fueled by the default of a large trade partner—Argentina. Volatility remains significant in this period up to 16 days during the 2000–2002 period.
  • The stock market remained relatively stable until the second half of 2007. Then, the GFC occurred and in 2008, volatility was extremely persistent from one holding day to approximately 32 holding days.
  • Since then, the stock market has replicated the 2003 to 2007 period of relatively low volatility. Although the Sovereign Debt Crisis in Europe in 2011 and FED Tapering in mid-2014 appear to have led to a bout of volatility, the early global stock market 2016 rout-in as China appeared to crumble is evident.
Russia (Micex):
Jrfm 14 00503 i002
  • The DotCom Bubble and GFC-related volatility is evident. However, this volatility is shorter-lived in the case of Russia than in Brazil.
  • Brazil, Russia and India all experienced bouts of volatility unique to their economies in 2003 and 2006, consistent with the strong bull market trends in the advanced economies during this period.
  • There is no evidence of early 2016 volatility and 2014 volatility following the deterioration of Russian finances.
India (Sensex):
Jrfm 14 00503 i003
  • India was particularly affected by the dot.com bubble and the GFC, however, following these major crises, the Indian stock market has been relatively stable.
China (Hang Seng):
Jrfm 14 00503 i004
  • The recent Chinese Circuit Break event of 2016 shows strong volatility contagion, although Brazil is the only other emerging market that shows significant volatility during this period.
  • Hang Seng also appeared to be particularly affected by the European Sovereign Debt Crisis in 2011–2012, following a two-year period of insignificant volatility.
Japan (Nikkei):
Jrfm 14 00503 i005
  • Japan was relatively less affected by the dot.com bubble than any other stock market.
  • In contrast, Nikkei has been highly volatile following the GFC, particularly in 2011, 2013 and 2015/2016.
US (S&P500):
Jrfm 14 00503 i006
  • Both Europe and the U.S. were severely impacted by the dot.com bubble and the GFC, as well as by the Sovereign Debt Crisis.
  • Compared to the U.S., Europe appears to be relatively more impacted by market uncertainty arising from China.
Europe (EuroStoxx50):
Jrfm 14 00503 i007
Volatility Index (VIX):
Jrfm 14 00503 i008
  • Volatility of VIX is increasing over time at higher frequencies, following the GFC.

Appendix B. Charts for Continuous Wavelet Time–Frequency

Interpretation Key:
The horizontal axis shows calendar time. The vertical axis represents the time period studied/Holding Period. The thick black line represents a 5% significance level estimated from the Monte Carlo simulation. The cone of influence, which represents areas influenced by border effects, is shown with a white line. Regions of differing power are represented using a heat map, which ranges from blue (low power) to red (high power). Regions of differing coherency are represented using a heat map, which ranges from blue (low coherency) to red (high coherency). Phases/arrows are to be interpreted as follows: arrows pointing to the right mean that x and y are in phase; arrows pointing to the left mean that x and y are out-of-phase; arrows pointing up mean that y leads x by 90 degrees; and arrows pointing down mean that x leads y by 90 degrees.
Brazil–U.S.:
Jrfm 14 00503 i009
  • Overall, Brazil is in phase/correlated with all advanced economies’ stock markets and in the long run, Brazil lags behind mature markets.
  • Brazil was particularly correlated with S&P500 between 2004 and 2013. However, this has become less significant in subsequent years.
  • For a one-year holding period, Brazilian returns are significantly correlated with S&P from 2002 to 2013, at all times.
Brazil–Europe:
Jrfm 14 00503 i010
  • Interestingly, Brazil has become increasingly uncorrelated with the EuroStoxx50 since 2013. Compared to the U.S., this relationship appears to be more significant at lower frequencies. For the U.S., this relationship with Bovespa is more significant at higher frequencies, potentially due to Fed Tapering effects in the later years.
  • There is a significant relationship between Ibovespa & EuroStoxx50 from 2000 to 2013 over a year holding period (250 trading days).
Brazil–Japan:
Jrfm 14 00503 i011
  • Overall, Japan does lead Brazil, although the relationship is not as significant over time especially at higher frequencies.
Brazil–VIX:
Jrfm 14 00503 i012
  • Bovespa volatility is uncorrelated with VIX. The relationship was significant over 2006–2013 and during the dot.com bubble.
Russia–US:
Jrfm 14 00503 i013
  • The U.S. is less integrated with Russia than Europe.
  • There is some evidence that Russian market volatility led U.S. market volatility in 2004–2005 at low frequencies.
  • Russia is less affected by the U.S. stock market at high frequencies than Brazil, particularly during crises.
Russia–Europe:
Jrfm 14 00503 i014
  • Europe is more integrated with Russia at higher and lower frequencies.
Russia–Japan:
Jrfm 14 00503 i015
  • There is a strong relationship between Russian market volatility and Nikkei, but only at low frequencies greater than 10 days.
Russia–VIX:
Jrfm 14 00503 i016
  • Russian market volatility is less affected by VIX than Brazilian market volatility, and both are significantly uncorrelated with VIX volatility.
India–U.S.:
Jrfm 14 00503 i017
  • Indian market volatility shows a significant relationship with the U.S. and Europe over time, and unlike in the case of Russia and Brazil, this integration is not fading and is in fact, since 2015, increasing with Europe.
India–Europe:
Jrfm 14 00503 i018
India–Japan:
Jrfm 14 00503 i019
  • The Japanese market is less integrated with India but a strong relationship does exist since 2015.
India–VIX:
Jrfm 14 00503 i020
  • The Indian market is uncorrelated with VIX.
China–US:
Jrfm 14 00503 i021
  • China is one emerging market that shows it has the power to intermittently lead advanced economies’ stock markets with significant evidence in 2006, 2010 and 2012.
  • Of all the BRIC markets, Brazil and China are by far the most integrated with the U.S.
China–Europe:
Jrfm 14 00503 i022
  • There is a strong positive correlation between China and Europe, with China volatility leading European market volatility.
China–Japan:
Jrfm 14 00503 i023
  • The Chinese market is less integrated with the Japanese market.

Appendix C. Methodological Note on the Empirical Wavelet Approach

Generally, Morlet wavelet coherence methodology allows us to study the behavior of stock prices time series jointly across time and time–frequency dimensions. The wavelet is specified, as detailed in Barunik et al. (2011):
γ u , s ( t ) = γ ( t u s ) s
where: u is the parameter providing the location of the wavelet, γ is an integrable wavelet function and s is the scale dilation parameter, while normalization by the square root of s ensures unit variance of the wavelet. Per Barunik et al. (2011), for ω 0 denoting the central frequency of the wavelet, Morlet wavelet is defined as:
γ M ( t ) = ω 0 e i i 2 2 π 4
We follow Barunik et al. (2011) in specifying ω 0 .
In addition to the Morlet wavelet, we cover continuous wavelet transform, specified as:
Γ ( x , u , s ) = x ( t ) γ ( t u s ) s d t
Specification (A3) allows us to define variance of x as detailed in Barunik et al. (2011).

References

  1. Aguiar-Conraria, Luis, and Maria Joana Soares. 2010. The Continuous Wavelet Transform: A Primer. Working Paper NIPE-WP 16/2011. Braga: University of Minho. [Google Scholar]
  2. Aguiar-Conraria, Luis, Nuno Azevedo, and Maria Joana Soares. 2008. Using wavelets to decompose the time-frequency effects of monetary policy. Physica A: Statistical Mechanics and Its Applications 387: 2863–78. [Google Scholar] [CrossRef] [Green Version]
  3. Aizenman, Joshua, Mahir Binici, and Michael M. Hutchison. 2016. The transmission of Federal Reserve tapering news to emerging financial markets. International Journal of Central Banking, 3117–356. [Google Scholar]
  4. Bank for International Settlements (BIS). 2021. Changing Patterns of Capital Flows. CGFS Papers, Bank for International Settlements Number 66. Bank for International Settlements, Basel, Switzerland. Available online: http://www.bis.org/publ/cgfs66.pdf (accessed on 9 October 2021).
  5. Barunik, Jozef, Lukas Vacha, and Ladislav Krištoufek. 2011. Co-Movement of Central European Stock Markets Using Wavelet Coherence: Evidence from High-Frequency Data. IES Working Paper 22/2011, IESFSV. Prague: Charles University. [Google Scholar]
  6. Beirne, John, Guglielmo Maria Caporale, Marieanne Schulze-Ghattas, and Nicola Spagnolo. 2013. Volatility Spillovers and Contagion from Mature to Emerging Stock Markets. Review of International Economics 21: 1060–75. [Google Scholar] [CrossRef] [Green Version]
  7. Bhar, Ramaprasad, and Biljana Nikolova. 2007. Analysis of Mean and Volatility Spillover Using BRIC Countries, Regional and World Index Returns. Journal of Economic Integration 22: 369–81. [Google Scholar] [CrossRef] [Green Version]
  8. Brooks, Chris. 2014. Introductory Econometrics for Finance, 3rd ed. Cambridge: Cambridge University Press. [Google Scholar]
  9. Cărăuşu, Dimitru Nicusor, Bogdan Florin Filip, Elena Cigu, and Carmen Toderaşcu. 2018. Contagion of Capital Markets in CEE Countries: Evidence from Wavelet Analysis, Emerging Markets Finance and Trade. Taylor & Francis Journals 54: 618–41. [Google Scholar]
  10. Claessens, Stijin, Rudiger Dornbusch, and Yung Chul Park. 2001. Contagion: Why Crises Spread and How This Can Be Stopped. In International Financial Contagion. Edited by Stijn Claessens and Kristin Forbes. Boston: Kluwer Academic Publishing, pp. 19–41. [Google Scholar]
  11. Conlon, Thomas, Brian M. Lucey, and Gazi Salah Uddin. 2018. Is gold a hedge against inflation? A wavelet time-scale perspective. Review of Quantitative Finance and Accounting 51. [Google Scholar] [CrossRef]
  12. Eguren-Martin, Fernando. 2020. Dollar Shortages and Central Bank Swap Lines. Bank of England Working Papers 879. London: Bank of England. [Google Scholar]
  13. Eichengreen, Barry, and Paanam Gupta. 2014. Tapering Talk: The Impact of Expectations of Reduced Federal Reserve Security Purchases on Emerging Markets. Policy Research Working Paper No. 6754. World Bank. Available online: https://openknowledge.worldbank.org/handle/10986/16826 (accessed on 9 October 2021).
  14. Forbes, Kristin, and Roberto Rigobon. 2002. No contagion, only interdependence: Measuring stock market co-movements. Journal of Finance 57: 2223–61. [Google Scholar] [CrossRef]
  15. Galagedera, Don U. A., and Robert Brooks. 2007. Is co-skewness a better measure of risk in the downside than downside beta? Evidence in emerging market data July 2007. Journal of Multinational Financial Management 17: 214–30. [Google Scholar] [CrossRef]
  16. Gallegati, Marco. 2012. A wavelet-based approach to test for financial market contagion. Computational Statistics & Data Analysis 56: 3491–97. [Google Scholar] [CrossRef]
  17. Gallegati, Marco, and Mauro Gallegati. 2007. Wavelet Variance Analysis of Output in G-7 Countries. Studies in Nonlinear Dynamics & Econometrics, De Gruyter 11: 1–25. [Google Scholar]
  18. Grinsted, Aslak, John C. Moore, and Svetlana Jevrejeva. 2004. Application of the cross wavelet transform and wavelet coherence to geophysical time series. Nonlinear Processes in Geophysics 11: 561–66. [Google Scholar] [CrossRef]
  19. Gurdgiev, Constantin, and Barry Trueick. 2016. Crisis Contagion from Advanced Economies into BRIC: Not as Simple as in the Old Days. In Chapter 11 in Lessons from the Great Recession: At the Crossroads of Sustainability and Recovery. Edited by Constantin Gurdgiev, Liam Leonard and Alejandra Maria Gonzalez-Perez. Bingley: Emerald, vol. 18, pp. 1–20. ISBN 978-1-78560-743-1. [Google Scholar]
  20. IMF. 2016. IMF Survey: Emerging Economies Affect Global Financial Changes. Washington, DC: International Monetary Fund. [Google Scholar]
  21. IMF. 2020. Emerging and Frontier Markets: Managing Volatile Portfolio Flows. In The Global Financial Stability Report (GFSR). Washington, DC: International Monetary Fund, Chp. 3. ISBN 978-1-51352-919-6. [Google Scholar]
  22. Kenourgios, Demitris, Aristeidis Samitas, and Nikos Paltalidis. 2011. Financial crises and stock market contagion in a multivariate time-varying asymmetric framework. Journal of International Financial Markets, Institutions and Money 21: 92–106. [Google Scholar] [CrossRef]
  23. Lehkonen, Heikki, and Karl Heimonen. 2014. Timescale-dependent stock market comovement: BRICs vs. developed markets. Journal of Empirical Finance 28: 90–103. [Google Scholar] [CrossRef] [Green Version]
  24. Levy, Haim, and Marshall Sarnat. 1970. International Diversification of Investment Portfolios. The American Economic Review 60: 668–75. [Google Scholar]
  25. Loh, Lixia. 2013. Co-movement of Asia-Pacific with European and US stock market returns: A cross-time–frequency analysis. Research in International Business and Finance 29: 1–13. [Google Scholar] [CrossRef]
  26. Madaleno, Mara, and Carlos Pinho. 2012. International stock market indices comovements: A new look. International Journal of Finance and Economics 17: 89–102. [Google Scholar] [CrossRef]
  27. Mensi, Waid, Sayed Jawad Hussein Shahzadb, Shawkat Hammoudeh, Rami Zeitunes, and Mobin Ur Rehman. 2017. Diversification potential of Asian frontier, BRIC emerging and major developed stock markets: A wavelet-based value at risk approach. Emerging Markets Review 32: 130–147. [Google Scholar] [CrossRef]
  28. Mishra, Prachi, Kenji Moriyama, Papa M. B. P. N’Diaye, and Lam Nguyen. 2014. Impact of Fed Tapering Announcements on Emerging Markets. IMF Working Paper No. 14/10. Washington, DC: International Monetary Fund. [Google Scholar]
  29. Myles, Danielle. 2020. COVID-19 Lays Bare Brics Fading Appeal. FDI Intelligence. London: Financial Times, Ltd., Available online: https://www.fdiintelligence.com/article/78991 (accessed on 9 October 2021).
  30. O’Neill, Jim. 2001. Building Better Global Economic BRICs. Global Economics Paper No: 66. New York: Goldman Sachs, Available online: https://www.goldmansachs.com/insights/archive/archive-pdfs/build-better-brics.pdf (accessed on 7 December 2020).
  31. Ozkan, F. Gulcin, and Feliz D. Unsal. 2012. Global Financial Crisis, Financial Contagion, and Emerging Markets. IMF Working Paper 12/293. Washington, DC: International Monetary Fund. [Google Scholar]
  32. Rua, Antonio, and Luis C. Nunes. 2009. International comovement of stock market returns: A wavelet analysis. Journal of Empirical Finance 16: 632–39. [Google Scholar] [CrossRef] [Green Version]
  33. Sheu, Her-Jiun, and Chunhuang Liao. 2011. Dynamics of stock market integration between the US and the BRIC. African Journal of Business Management 5: 3674–89. [Google Scholar]
  34. Singh, Amanjot, and Manjit Singh. 2017. A revisit to stock market contagion and portfolio hedging strategies: BRIC equity markets and financial crisis. International Journal of Law and Management 59: 618–35. [Google Scholar] [CrossRef]
  35. Su, Xianfang. 2020a. Measuring extreme risk spillovers across international stock markets: A quantile variance decomposition analysis. The North American Journal of Economics and Finance 51: 101098. [Google Scholar] [CrossRef]
  36. Su, Xianfang. 2020b. Dynamic behaviors and contributing factors of volatility spillovers across G7 stock markets. The North American Journal of Economics and Finance 53: 101218. [Google Scholar] [CrossRef]
  37. Wang, Gang-Jin, Chi Xie, Min Lin, and Eugene H. Stanley. 2017. Stock market contagion during the global financial crisis: A multiscale approach. Finance Research Letters 22: 163–68. [Google Scholar] [CrossRef]
  38. Yellen, Janet. 2016. The Outlook, Uncertainty, and Monetary Policy. Board of Governors of the Federal Reserve System, Speech Delivered at the Economic Club of New York. March 29. Available online: https://www.federalreserve.gov/newsevents/speech/yellen20160329a.htm (accessed on 9 October 2021).
  39. Youssef, Manuel, Khaled Mokni, and Ahdi Noomen Ajmi. 2021. Dynamic connectedness between stock markets in the presence of the COVID-19 pandemic: Does economic policy uncertainty matter? Journal of Financial Innovation 7: 13. [Google Scholar] [CrossRef]
  40. Zhang, Bing, Xindan Li, and Honghai Yu. 2013. Has recent financial crisis permanently the correlations between BRICS and developed stock markets? The North American Journal of Economics and Finance 26: 725–38. [Google Scholar] [CrossRef]
Figure 1. Wavelet Power Spectrum for the U.S.
Jrfm 14 00503 g001
Figure 2. Wavelet Power Spectrum for Europe, Japan, Brazil, Russia, India and China.
Jrfm 14 00503 g002aJrfm 14 00503 g002bJrfm 14 00503 g002c
Table 1. BRIC Stock Market Summary Statistics.
BrazilRussiaIndiaChina
Max5.940%10.956%6.944%5.823%
Mean0.012%0.023%0.016%0.003%
Median0.000%0.002%0.012%0.000%
Min−5.253%−8.971%−5.129%−5.899%
Skew(0.064)(0.264)(0.196)(0.048)
Kurtosis4.03414.9007.5598.389
Std. Deviation0.775%0.914%0.653%0.646%
No. of Obs.4269426942694269
Table 2. Advanced Economy Stock Market Summary Statistics.
SP500EuroStoxxNikkei
Max4.759%4.533%5.748%
Mean0.004%−0.005%−0.001%
Median0.007%0.000%0.000%
Min−4.113%−3.565%−5.260%
Skew−0.1830.001−0.377
Kurtosis8.4504.2766.528
Std. Deviation0.537%0.653%0.656%
No. of Obs.426942694269
Table 3. Unconditional Daily Correlation between BRIC and Advanced Economies from January 2000 to May 2016 (p-values in parentheses).
U.S.EuropeJapan
Brazil0.590.460.15
(0.0000)(0.0002)(0.0201)
Russia0.270.450.28
(0.0070)(0.0001)(0.0064)
India0.210.320.31
(0.0099)(0.0014)(0.0013)
China0.200.350.56
(0.0105)(0.0007)(0.0000)
Table 4. Percentage Change in Unconditional Correlation between BRIC and Advanced Economies Pre July 2008 and Post June 2008.
U.S.EuropeJapan
Brazil33%43%33%
Russia122%68%46%
India321%110%−2%
China171%48%6%
Publisher’s Note: MDPI stays neutral with regard to jurisdictional claims in published maps and institutional affiliations.

