A Review of the Regulatory Impact Analysis of Risk-Based Capital and Related Liquidity Rules

Abstract
1. Introduction
2. The Role of Cost-Benefit Analysis
Executive Order 12866 requires preparation of an economic analysis for agency actions that are “significant regulatory actions.” “Significant regulatory actions” include, among other things, regulations that “have an annual effect on the economy of $100 million or more or adversely affect in a material way the economy, a sector of the economy, productivity, competition, jobs, the environment, public health or safety, or state, local, or tribal governments or communities.”
3. Background on Risk-Based Capital Rules
4. The Costs and Benefits of Risk-Based Capital
4.1. Benefits of RBC Rules
4.2. Costs of RBC Rules
4.3. Capital Levels
4.4. Distributional Effects
5. Regulatory Impact Analysis of Risk-Based Capital
5.1. Basel RBC Rules
5.2. Lack of Quantitative Evidence
5.2.1. Basel II
- “Better allocation of capital and reduced impact of moral hazard.”
- “Improved signal quality of capital as an indicator of solvency.”
- “More efficient use of required bank capital.”
Cost and benefit analysis of changes in minimum capital requirements entail considerable measurement problems. On the cost side, it can be difficult to attribute particular expenditures incurred by banks to the costs of implementation because banks would likely incur some of these costs as part of their ongoing efforts to improve risk measurement and management systems. On the benefits side, measurement problems are even greater because the benefits of the rule are more qualitative than quantitative.
5.2.2. Standardized RBC Framework
The broad social and economic benefit that derives from a safe and sound banking system supported by vigorous and comprehensive supervision, including ensuring adequate capital, clearly dwarfs any direct benefits that might accrue to institutions adopting the Standardized Option. Similarly, the social and economic cost of any reduction in the safety and soundness of the banking system would dramatically overshadow any cost borne by banking organizations subject to the rule.
The banking agencies are confident that the enhanced risk sensitivity of the proposed rule could allow banking organizations to more effectively achieve objectives that are consistent with a safe and sound banking system.
5.2.3. Market Risk Capital Rules
5.2.4. Liquidity Coverage Ratio
5.2.5. Supplementary Leverage Ratio
5.2.6. Net Stable Funding Ratio
If the NSFR reduces the probability of a financial crisis even slightly, then the benefits of avoiding the costs of a crisis, specifically a decline in output, would outweigh the relatively modest aggregate cost of the rule.
A BCBS study BCBS (2010a), estimated that, prior to the regulatory reforms undertaken since 2009, the probability that a financial crisis could occur in a given year was between 3.5 percent and 5.2 percent and that the cumulative economic cost of any single crisis was between 20 percent and 100 percent of annual global economic output.
5.2.7. Total Loss-Absorbing Capital
5.2.8. Revised eSLR
5.3. Revised Capital & Liquidity Thresholds
- “the reduction in LCR requirements would modestly reduce the liquidity buffers.”
- “the reduction in LCR requirements would modestly increase the net interest margin.”
- “the likelihood of experiencing material financial distress during a period of elevated economic stress or market volatility would increase only modestly.”
Summary
5.4. Cases of Negative Benefits
5.4.1. Revised eSLR
5.4.2. Net Stable Funding Ratio
6. Conclusions
Funding
Institutional Review Board Statement
Informed Consent Statement
Data Availability Statement
Conflicts of Interest
References
- Acharya, Viral, Robert Engle, and Diane Pierret. 2014. Testing macroprudential stress tests: The risk of regulatory risk weights. Journal of Monetary Economics 65: 36–53. [Google Scholar] [CrossRef]
- Acharya, Viral, and Philipp Schabl. 2009. How banks played the leverage game. In Restoring Financial Stability: How to Repair a Failed System. Edited by Viral V. Acharya and Matthew Richarson. Hoboken: Wiley, pp. 83–100. [Google Scholar]
- Adrian, Tobias, and Nina Boyarchenko. 2018. Liquidity policies and systemic risk. Journal of Financial Intermediation 35: 45–60. [Google Scholar] [CrossRef]
- Ashcraft, Adam, Paul Goldsmith-Pinkham, and James Vickery. 2010. MBS Ratings and the Mortgage Credit Boom. Staff Report No. 449. New York: Federal Reserve Bank of New York. [Google Scholar]
- Avery, Robert B., and Allan N. Berger. 1991. Risk-based capital and deposit insurance reform. Journal of Banking and Finance 15: 847–74. [Google Scholar] [CrossRef]
- Ayadia, Rym, Sami Ben Naceur, Barbara Casu, and Barry Quinn. 2016. Does Basel compliance matter for bank performance? Journal of Financial Stability 23: 15–32. [Google Scholar] [CrossRef]
- Barth, James R., and Stephen Matteo Miller. 2018. On the Rising Complexity of Bank Regulatory Capital Requirements: From Global Guidelines to their United States (US) Implementation. Journal of Risk and Financial Management 11: 77. [Google Scholar] [CrossRef]
- Basel Committee on Bank Supervision. 1988. International Convergence of Capital Measurement and Capital Standards. Basel: Bank for International Settlements. [Google Scholar]
- Basel Committee on Bank Supervision. 2004. International Convergence of Capital Measurement and Capital Standards: A Revised Framework. Basel: Bank for International Settlements. [Google Scholar]
- Basel Committee on Bank Supervision. 2009. Revisions to the Basel II Market Risk Framework. Basel: Bank for International Settlements. [Google Scholar]
- Basel Committee on Bank Supervision. 2010a. An Assessment of the Long-Term Economic Impact of Stronger Capital and Liquidity Requirements. Basel: Bank for International Settlements. [Google Scholar]
- Basel Committee on Bank Supervision. 2010b. Basel III: International Framework for Liquidity Risk Measurement, Standards and Monitoring. Basel: Bank for International Settlements. [Google Scholar]
- Basel Committee on Bank Supervision. 2011. Global Systemically Important Banks: Assessment Methodology and the Additional Loss Absorbency Requirement. Basel: Bank for International Settlements. [Google Scholar]
- Basel Committee on Bank Supervision. 2016. Literature Review on Integration of Regulatory Capital and Liquidity Instruments. Basel Committee Working Paper No. 30. Basel: Basel Committee. [Google Scholar]
- Beck, Thorsten, Ross Levine, and Alexey Levkov. 2010. Big Bad Banks? The Winners and Losers from Bank Deregulation in the United States. Journal of Finance 65: 1637–67. [Google Scholar] [CrossRef]
- Bernanke, Ben S. 2006. Modern Risk Management and Banking Supervision. Paper presented at the Stonier Graduate School of Banking, Washington, DC, USA, June 12. [Google Scholar]
- Bim, Martin, Olivier de Bandt, Simon Firestone, Matías Gutiérrez Girault, Diana Hancock, Tord Krogh, Hitoshi Mio, Donald P. Morgan, Ajay Palvia, Valerio Scalone, and et al. 2020. The Costs and Benefits of Bank Capital—A Review of the Literature. Journal of Risk and Financial Management 13: 74. [Google Scholar]
- Cline, William R. 2016. Benefits and Costs of Higher Capital Requirements for Banks. Working Paper 16-6. Washington: Peterson Institute for International Economics. [Google Scholar]
- Coates, John C., IV. 2015. Cost-Benefit Analysis of Financial Regulation: Case Studies and Implications. Yale Law Journal 124: 882–1011. [Google Scholar] [CrossRef]
- Cochrane, John H. 2014. Challenges for Cost-Benefit Analysis of Financial Regulation. Journal of Legal Studies 43: S63–S105. [Google Scholar] [CrossRef]
- Coen, William. 2017. Global Adoption of the Basel Framework: Enhancing Financial Stability Across Countries. Paper presented at 9th Islamic Financial Services Board Public Lecture on Financial Policy and Stability, Kuala Lumpur, Malaysia, April 5. [Google Scholar]
- Dagher, Jihad, Giovanni Dell’Ariccia, Luc Laeven, Lev Ratnovski, and Hui Tong. 2016. Benefits and Costs of Bank Capital. Staff Discussion Notes No. 16/04. Washington: International Monetary Fund. [Google Scholar]
- Demirgüç-Kunt, Asli, and Enrica Detragiache. 2011. Basel Core Principles and bank soundness: Does compliance matter? Journal of Financial Stability 7: 179–90. [Google Scholar] [CrossRef]
- Demirgüç-Kunt, Asli, Enrica Detragiache, and Ouarda Merrouche. 2013. Bank capital: Lessons from the financial crisis. Journal of Money, Credit and Banking 45: 1147–64. [Google Scholar] [CrossRef]
- Duca, John V., and David C. Ling. 2020. The other (commercial) real estate boom and bust: The effects of risk premia and regulatory capital arbitrage. Journal of Banking and Finance 112: 105317. [Google Scholar] [CrossRef]
- Efing, Matthias. 2019. Reaching for Yield in the ABS Market: Evidence from German Bank Investments. Review of Finance 24: 929–59. [Google Scholar] [CrossRef]
- Ellig, Jerry. 2016. Evaluating the Quality and Use of Regulatory Impact Analysis: The Mercatus Center’s Regulatory Report Card, 2008–2013. Mercatus Working Paper. Arlington: Mercatus Center at George Mason University. [Google Scholar]
- Ellig, Jerry. 2018. Why and How Independent Agencies Should Conduct Regulatory Impact Analysis. Mercatus Working Paper. Arlington: Mercatus Center at George Mason University. [Google Scholar]
- Erel, Isil, Taylor Nadauld, and René M. Stulz. 2014. Why Did Holdings of Highly Rated Securitization Tranches Differ So Much across Banks? Review of Financial Studies 27: 404–53. [Google Scholar] [CrossRef]
- Estrella, Arturo, Sangkyun Park, and Stavros Peristiani. 2000. Capital Ratios and Credit Ratings as Predictors of Bank Failures. FRBNY Economic Policy Review 6: 33–52. [Google Scholar]
- Federal Deposit Insurance Corporation. 2012. FDIC Community Banking Study. Washington: Federal Deposit Insurance Corporation. [Google Scholar]
- Federal Deposit Insurance Corporation. 2013. Regulatory Capital Rules: Regulatory Capital, Implementation of Basel III, Capital Adequacy, Transition Provisions, Prompt Corrective Action, Standardized Approach for Risk-weighted Assets, Market Discipline and Disclosure Requirements, Advanced Approaches Risk-Based Capital Rule, and Market Risk Capital Rule. Federal Register 78: 55340–598. [Google Scholar]
- Federal Reserve System. 1989. Capital; Risk-Based Capital Guidelines. Federal Register 54: 4186–221. [Google Scholar]
- Federal Reserve System. 2011a. Resolution Plans and Credit Exposure Reports Required. Federal Register 76: 22648–62. [Google Scholar]
- Federal Reserve System. 2011b. Resolution Plans Required. Federal Register 76: 67323–40. [Google Scholar]
- Federal Reserve System. 2012a. Enhanced Prudential Standards and Early Remediation Requirements for Covered Companies. Federal Register 77: 594–663. [Google Scholar]
- Federal Reserve System. 2012b. Annual Company-Run Stress Test Requirements for Banking Organizations With Total Consolidated Assets Over $10 Billion Other Than Covered Companies. Federal Register 77: 62396–409. [Google Scholar]
- Federal Reserve System. 2014. Risk-Based Capital Guidelines: Implementation of Capital Requirements for Global Systemically Important Bank Holding Companies. Federal Register 79: 75473–96. [Google Scholar]
- Federal Reserve System. 2015a. Regulatory Capital Rules: Implementation of Risk-Based Capital Surcharges for Global Systemically Important Bank Holding Companies. Federal Register 80: 49082–116. [Google Scholar]
- Federal Reserve System. 2015b. Total Loss-Absorbing Capacity, Long-Term Debt, and Clean Holding Company Requirements for Systemically Important U.S. Bank Holding Companies and Intermediate Holding Companies of Systemically Important Foreign Banking Organizations; Regulatory Capital Deduction for Investments in Certain Unsecured Debt of Systemically Important U.S. Bank Holding Companies. Federal Register 80: 74926–64. [Google Scholar]
- Federal Reserve System. 2016. Regulatory Capital Rules: The Federal Reserve Board’s Framework for Implementing the U.S. Basel III Countercyclical Capital Buffer. Federal Register 81: 5661–66. [Google Scholar]
- Federal Reserve System. 2017. Total Loss-Absorbing Capacity, Long-Term Debt, and Clean Holding Company Requirements for Systemically Important U.S. Bank Holding Companies and Intermediate Holding Companies of Systemically Important Foreign Banking Organization. Federal Register 82: 8266–315. [Google Scholar]
- Federal Reserve System, and Federal Deposit Insurance Corporation. 2011a. Resolution Plans and Credit Exposure Reports Required. Federal Register 76: 22648–62. [Google Scholar]
- Federal Reserve System, and Federal Deposit Insurance Corporation. 2011b. Resolution Plans Required. Federal Register 76: 67323–40. [Google Scholar]
- Ferri, Giovanni, and Valerio Pesic. 2017. Bank regulatory arbitrage via risk weighted assets dispersion. Journal of Financial Stability 33: 331–45. [Google Scholar] [CrossRef]
- Firestone, Simon, Amy Lorenc, and Ben Ranish. 2017. An Empirical Economic Assessment of the Costs and Benefits of Bank Capital in the US. Finance and Economics Discussion Series 2017–034. Washington: Board of Governors of the Federal Reserve System. [Google Scholar]
- Friedman, Jeffrey. 2011. Capitalism and the crisis: Bankers, bonuses, ideology, and ignorance. In What Caused the Financial Crisis. Edited by Jeffrey Friedman. Philadelphia: University of Pennsylvania Press, pp. 1–66. [Google Scholar]
- Gordon, Jeffrey N. 2014. The Empty Call for Benefit-Cost Analysis in Financial Regulation. Journal of Legal Studies 43: S351–S378. [Google Scholar] [CrossRef]
- Gorton, Gary. 2009. Information, liquidity, and the (ongoing) panic of 2007. American Economic Review 99: 567–72. [Google Scholar] [CrossRef]
- Gorton, Gary, and Anderw Metrick. 2012. Securitized banking and the run on repo. Journal of Financial Economics 104: 425–51. [Google Scholar] [CrossRef]
- Government Accountability Office. 2011. Dodd–Frank Act Regulations: Implementation Could Benefit from Additional Analyses and Coordination. Washington: United States Government Accountability Office. [Google Scholar]
- Haldane, Andrew G. 2010. The $100 billion question. Paper presented at the Institute of Regulation & Risk, North Asia (IRRNA), Hong Kong, China, March 30. [Google Scholar]
- Haldane, Andrew G. 2015. Multi-Polar Regulation. International Journal of Central Banking 11: 385–401. [Google Scholar]
- Haldane, Andrew G., and Vasileios Madouros. 2012. The Dog and the Frisbee. presented at Federal Reserve Bank of Kansas City’s 36th Economic Policy Symposium, Jackson Hole, Wyoming, August 31. [Google Scholar]
- Herring, Richard. 2016. Less Really Can be More: Why Simplicity & Comparability Should be Regulatory Objectives. Atlantic Economic Journal 4: 33–50. [Google Scholar]
- Herring, Richard. 2018. The Evolving Complexity of Capital Regulation. Journal of Financial Services Research 53: 183–205. [Google Scholar] [CrossRef]
- Hogan, Thomas L. 2015. Capital and risk in commercial banking: A comparison of capital and risk-based capital ratios. Quarterly Review of Economics and Finance 57: 32–45. [Google Scholar] [CrossRef]
- Hogan, Thomas L., and Scott Burns. 2019. Has Dodd–Frank affected bank expenses? Journal of Regulatory Economics 55: 214–36. [Google Scholar] [CrossRef]
- Hogan, Thomas L., and G. P. Manish. 2016. Banking Regulation and Knowledge Problems. Advances in Austrian Economics 20: 213–234. [Google Scholar]
- Hogan, Thomas L., and Neil R. Meredith. 2016. Risk and risk-based capital of U.S. bank holding companies. Journal of Regulatory Economics 49: 86–112. [Google Scholar] [CrossRef]
- Hogan, Thomas L., Neil R. Meredith, and Xuhao (Harry) Pan. 2015. Risk-based capital regulation revisited: evidence from the early 2000s. Journal of Financial Regulation and Compliance 23: 115–34. [Google Scholar] [CrossRef]
- Hogan, Thomas L., Neil R. Meredith, and Xuhao (Harry) Pan. 2018. Evaluating risk-based capital regulation. Review of Financial Economics 36: 83–96. [Google Scholar] [CrossRef]
- Jones, David. 2000. Emerging problems with the Basel Capital Accord: Regulatory capital arbitrage and related issues. Journal of Banking and Finance 24: 35–58. [Google Scholar] [CrossRef]
- Krishnamurthy, Prasad. 2014. Rules, Standards, and Complexity in Capital Regulation. Journal of Legal Studies 43: S273–S296. [Google Scholar] [CrossRef]
- Mariathasan, Mike, and Ouarda Merrouche. 2014. The manipulation of Basel risk-weights. Journal of Financial Intermediation 23: 300–21. [Google Scholar] [CrossRef]
- Merrill, Craig B., Taylor D. Nadauld, René M. Stulz, and Shane Sherlund. 2012. Did Capital Requirements and Fair Value Accounting Spark Fire Sales in Distressed Mortgage-Backed Securities? Working Paper No. 18270. Cambridge: National Bureau of Economic Research. [Google Scholar]
- Miles, David, Jing Yang, and Gilberto Marcheggiano. 2013. Optimal Bank Capital. Economic Journal 123: 1–37. [Google Scholar] [CrossRef]
- Miller, Stephen Matteo. 2018. The recourse rule, regulatory arbitrage, and the financial crisis. Journal of Regulatory Economics 54: 195–217. [Google Scholar] [CrossRef]
- Office of the Comptroller of the Currency. 1986. Minimum Capital Ratios: Risk-Based Capital Standard for National Banks. Federal Register 51: 10602–7. [Google Scholar]
- Office of the Comptroller of the Currency. 1987. Minimum Capital Ratios: Issuance of Directives. Federal Register 52: 23045–54. [Google Scholar]
- Office of the Comptroller of the Currency. 1989. Risk-Based Capital Guidelines. Federal Register 54: 4168–84. [Google Scholar]
- Office of the Comptroller of the Currency. 2014. Impact Assessment for the Liquidity Coverage Ratio, Final Rule. In Memorandum to Patrick Tierney, OCC Assistant Director of Legislative and Regulatory Activities, from Douglas Robertson, OCC Acting Director of the Policy Analysis Division. Washington: Office of the Comptroller of the Currency. [Google Scholar]
- Office of the Comptroller of the Currency. 2015. Guidelines Establishing Standards for Recovery Planning by Certain Large Insured National Banks, Insured Federal Savings Associations, and Insured Federal Branches. Federal Register 80: 78681–89. [Google Scholar]
- Office of the Comptroller of the Currency. 2016. OCC Guidelines Establishing Standards for Recovery Planning by Certain Large Insured National Banks, Insured Federal Savings Associations, and Insured Federal Branches; Technical Amendments. Federal Register 81: 66791–801. [Google Scholar]
- Office of the Comptroller of the Currency. 2018a. OCC Guidelines Establishing Standards for Recovery Planning by Certain Large Insured National Banks, Insured Federal Savings Associations, and Insured Federal Branches; Technical Amendments. Federal Register 83: 47313–15. [Google Scholar]
- Office of the Comptroller of the Currency. 2018b. OCC Guidelines Establishing Standards for Recovery Planning by Certain Large Insured National Banks, Insured Federal Savings Associations, and Insured Federal Branches; Technical Amendments. Federal Register 83: 66604–7. [Google Scholar]
- Office of the Comptroller of the Currency, and Federal Reserve System. 2013. Regulatory Capital Rules: Regulatory Capital, Implementation of Basel III, Capital Adequacy, Transition Provisions, Prompt Corrective Action, Standardized Approach for Risk-weighted Assets, Market Discipline and Disclosure Requirements, Advanced Approaches Risk-Based Capital Rule, and Market Risk Capital Rule. Federal Register 78: 62018–91. [Google Scholar]
- Office of the Comptroller of the Currency, and Federal Reserve System. 2018. Regulatory Capital Rules: Regulatory Capital, Enhanced Supplementary Leverage Ratio Standards for U.S. Global Systemically Important Bank Holding Companies and Certain of Their Subsidiary Insured Depository Institutions; Total Loss-Absorbing Capacity Requirements for U.S. Global Systemically Important Bank Holding Companies. Federal Register 83: 17317–27. [Google Scholar]
- Office of the Comptroller of the Currency, Federal Reserve System, and Federal Deposit Insurance Corporation. 1988. Capital: Risk-Based Capital Guidelines. Federal Register 53: 8550–71. [Google Scholar]
- Office of the Comptroller of the Currency, Federal Reserve System, and Federal Deposit Insurance Corporation. 1995. Risk-Based Capital Standards: Market Risk. Federal Register 60: 38082–142. [Google Scholar]
- Office of the Comptroller of the Currency, Federal Reserve System, and Federal Deposit Insurance Corporation. 1996. Risk-Based Capital Standards: Market Risk. Federal Register 61: 47358–78. [Google Scholar]
- Office of the Comptroller of the Currency, Federal Reserve System, Federal Deposit Insurance Corporation, and Office of Thrift Supervision. 2000. Risk-Based Capital Standards; Recourse and Direct Credit Substitutes. Federal Register 65: 12320–52. [Google Scholar]
- Office of the Comptroller of the Currency, Federal Reserve System, Federal Deposit Insurance Corporation, and Office of Thrift Supervision. 2001. Risk-Based Capital Guidelines; Capital Adequacy Guidelines; Capital Maintenance: Capital Treatment of Recourse, Direct Credit Substitutes and Residual Interests in Asset Securitizations. Federal Register 66: 59614–67. [Google Scholar]
- Office of the Comptroller of the Currency, Federal Reserve System, Federal Deposit Insurance Corporation, and Office of Thrift Supervision. 2003. Risk-Based Capital Guidelines; Implementation of New Basel Capital Accord. Federal Register 68: 45900–48. [Google Scholar]
- Office of the Comptroller of the Currency, Federal Reserve System, Federal Deposit Insurance Corporation, and Office of Thrift Supervision. 2007. Risk-Based Capital Standards: Advanced Capital Adequacy Framework—Basel II. Federal Register 72: 69288–445. [Google Scholar]
- Office of the Comptroller of the Currency, Federal Reserve System, Federal Deposit Insurance Corporation, and Office of Thrift Supervision. 2008. Risk-Based Capital Guidelines; Capital Adequacy Guidelines: Standardized Framework. Federal Register 73: 43982–4060. [Google Scholar]
- Office of the Comptroller of the Currency, Federal Reserve System, Federal Deposit Insurance Corporation, and Securities and Exchange Commission. 2011a. Prohibitions and Restrictions on Proprietary Trading and Certain Interests in, and Relationships with, Hedge Funds and Private Equity Funds. Federal Register 76: 68846–972. [Google Scholar]
- Office of the Comptroller of the Currency, Federal Reserve System, and Federal Deposit Insurance Corporation. 2011b. Risk-Based Capital Guidelines: Market Risk; Alternatives to Credit Ratings for Debt and Securitization Positions. Federal Register 76: 79380–407. [Google Scholar]
- Office of the Comptroller of the Currency, Federal Reserve System, and Federal Deposit Insurance Corporation. 2012a. Regulatory Capital Rules: Advanced Approaches Risk-Based Capital Rule; Market Risk Capital Rule. Federal Register 77: 52978–3057. [Google Scholar]
- Office of the Comptroller of the Currency, Federal Reserve System, and Federal Deposit Insurance Corporation. 2012b. Regulatory Capital Rules: Regulatory Capital, Implementation of Basel III, Minimum Regulatory Capital Ratios, Capital Adequacy, Transition Provisions, and Prompt Corrective Action. Federal Register 77: 52792–886. [Google Scholar]
- Office of the Comptroller of the Currency, Federal Reserve System, and Federal Deposit Insurance Corporation. 2012c. Regulatory Capital Rules: Standardized Approach for Risk-Weighted Assets; Market Discipline and Disclosure Requirements. Federal Register 77: 52888–975. [Google Scholar]
- Office of the Comptroller of the Currency, Federal Reserve System, and Federal Deposit Insurance Corporation. 2013a. Liquidity Coverage Ratio: Liquidity Risk Measurement, Standards, and Monitoring. Federal Register 78: 71818–68. [Google Scholar]
- Office of the Comptroller of the Currency, Federal Reserve System, and Federal Deposit Insurance Corporation. 2013b. Regulatory Capital Rules: Regulatory Capital, Enhanced Supplementary Leverage Ratio Standards for Certain Bank Holding Companies and Their Subsidiary Insured Depository Institutions. Federal Register 78: 51101–15. [Google Scholar]
- Office of the Comptroller of the Currency, Federal Reserve System, and Federal Deposit Insurance Corporation. 2014a. Liquidity Coverage Ratio: Liquidity Risk Measurement Standards. Federal Register 79: 61440–541. [Google Scholar]
- Office of the Comptroller of the Currency, Federal Reserve System, and Federal Deposit Insurance Corporation. 2014b. Regulatory Capital Rules: Regulatory Capital, Enhanced Supplementary Leverage Ratio Standards for Certain Bank Holding Companies and Their Subsidiary Insured Depository Institutions. Federal Register 79: 24528–41. [Google Scholar]
- Office of the Comptroller of the Currency, Federal Reserve System, Federal Deposit Insurance Corporation, and Securities and Exchange Commission. 2014c. Prohibitions and Restrictions on Proprietary Trading and Certain Interests in, and Relationships With, Hedge Funds and Private Equity Funds. Federal Register 79: 5536–806. [Google Scholar]
- Office of the Comptroller of the Currency, Federal Reserve System, and Federal Deposit Insurance Corporation. 2016. Net Stable Funding Ratio: Liquidity Risk Measurement Standards and Disclosure Requirements. Federal Register 81: 35124–83. [Google Scholar]
- Office of the Comptroller of the Currency, Federal Reserve System, and Federal Deposit Insurance Corporation. 2018a. Liquidity Coverage Ratio Rule: Treatment of Certain Municipal Obligations as High-Quality Liquid Assets. Federal Register 83: 44451–55. [Google Scholar]
- Office of the Comptroller of the Currency, Federal Reserve System, and Federal Deposit Insurance Corporation. 2018b. Proposed Changes to Applicability Thresholds for Regulatory Capital and Liquidity Requirements. Federal Register 83: 66024–59. [Google Scholar]
- Office of the Comptroller of the Currency, Federal Reserve System, and Federal Deposit Insurance Corporation. 2020. Net Stable Funding Ratio: Liquidity Risk Measurement Standards and Disclosure Requirements. In Federal Register; notice. Available online: https://www.federalreserve.gov/newsevents/pressreleases/files/bcreg20201020b1.pdf (accessed on 20 October 2020).
- Office of Management and Budget. 2003. Circular A–4, Regulatory Analysis. Washington: Office of Management and Budget. [Google Scholar]
- Peirce, Hester. 2012. Economic Analysis by Federal Financial Regulators. Mercatus Working Paper No. 12-31. Arlington: Mercatus Center at George Mason University. [Google Scholar]
- Peirce, Hester, Ian Robinson, and Thomas Stratmann. 2014. How Are Small Banks Faring under Dodd–Frank? Mercatus Working Paper No. 14-05. Arlington: Mercatus Center at George Mason University. [Google Scholar]
- Posner, Eric. 2014. How Do Bank Regulators Determine Capital Adequacy Requirements? Coase-Sandor Institute for Law & Economics Working Paper No. 698. Chicago: Coase-Sandor Institute at the University of Chicago Law School. [Google Scholar]
- Powell, Jerome. 2018. Semiannual Monetary Report to the Congress. In Hearing before the Committee on Banking, Housing, and Urban Affairs. Washington: United States Senate. [Google Scholar]
- Selgin, George. 2010. Central Banks as Sources of Financial Instability. Independent Review 14: 485–96. [Google Scholar]
- Selgin, George, William D. Lastrapes, and Lawrence H. White. 2012. Has the Fed been a failure? Journal of Macroeconomics 34: 569–96. [Google Scholar] [CrossRef]
- Slovik, Patrick. 2012. Systemically Important Banks and Capital Regulations Challenges. OECD Economics Department Working Paper No. 916. Paris: OECD Economics Department. [Google Scholar]
- Sunstein, Cass R. 2015. Financial Regulation and Cost-Benefit Analysis. Yale Law Journal Forum 124: 263–79. [Google Scholar]
- Van den Heuvel, Skander J. 2008. The welfare cost of bank capital requirements. Journal of Monetary Economics 55: 298–320. [Google Scholar] [CrossRef]
- VanHoose, David. 2007. Theories of Bank Behavior under Capital Regulation. Journal of Banking and Finance 31: 3680–97. [Google Scholar] [CrossRef]
- Woods, Louis Lee, II. 2012. The Federal Home Loan Bank Board, Redlining, and the National Proliferation of Racial Lending Discrimination, 1921–1950. Journal of Urban History 38: 1036–59. [Google Scholar] [CrossRef]
- Yellen, Janet. 2015. Monetary Policy and the State of the Economy. In Hearing before the Committee on Financial Services. Washington: United States House of Representatives. [Google Scholar]
- Zimmer, David M. 2014. Time-varying correlation in housing prices. Journal of Real Estate Finance and Economics 51: 86–100. [Google Scholar] [CrossRef]
| 1 | Prior to the adoption of RBC standards, banks were required to maintain “primary capital equal to at least 5.5 percent of total assets and total capital equal to at least 6.0 percent of total assets” (OCC 1986, p. 10602). |
| 2 | The term “leverage” may sometimes refer to the ratio of equity capital divided by total assets or to its reciprocal of assets over equity. This paper uses the term as a synonym for the simple capital ratio of total equity over total assets. We find this preferable to the term “capital ratio,” which has a variety of definitions. |
| 3 | A similar critique applies to monetary policy. Selgin et al. (2012) find that the Federal Reserve has not achieved its stated goal of improving macroeconomic stability, while Selgin (2010) considers central banks as sources of financial instability. |
| 4 | |
| 5 | For further background on the BCBS and the Basel Accords, see https://www.bis.org/bcbs/history.htm. |
| 6 | |
| 7 | Estrella et al. (2000) and Haldane and Madouros (2012) find that RBC ratios may be better predictors of long-term risk for US banks, but Hogan et al. (2018) find that those results do not hold using more recent data. RBC ratios may be better or worse, depending on the sample period and are therefore not accurate for long-term predictions. |
| 8 | Studies also find that compliance with the Basel Core Principles for Effective Bank Supervision have no effect on bank stability (Demirgüç-Kunt and Detragiache 2011) or efficiency (Ayadi et al. 2016). |
| 9 | |
| 10 | |
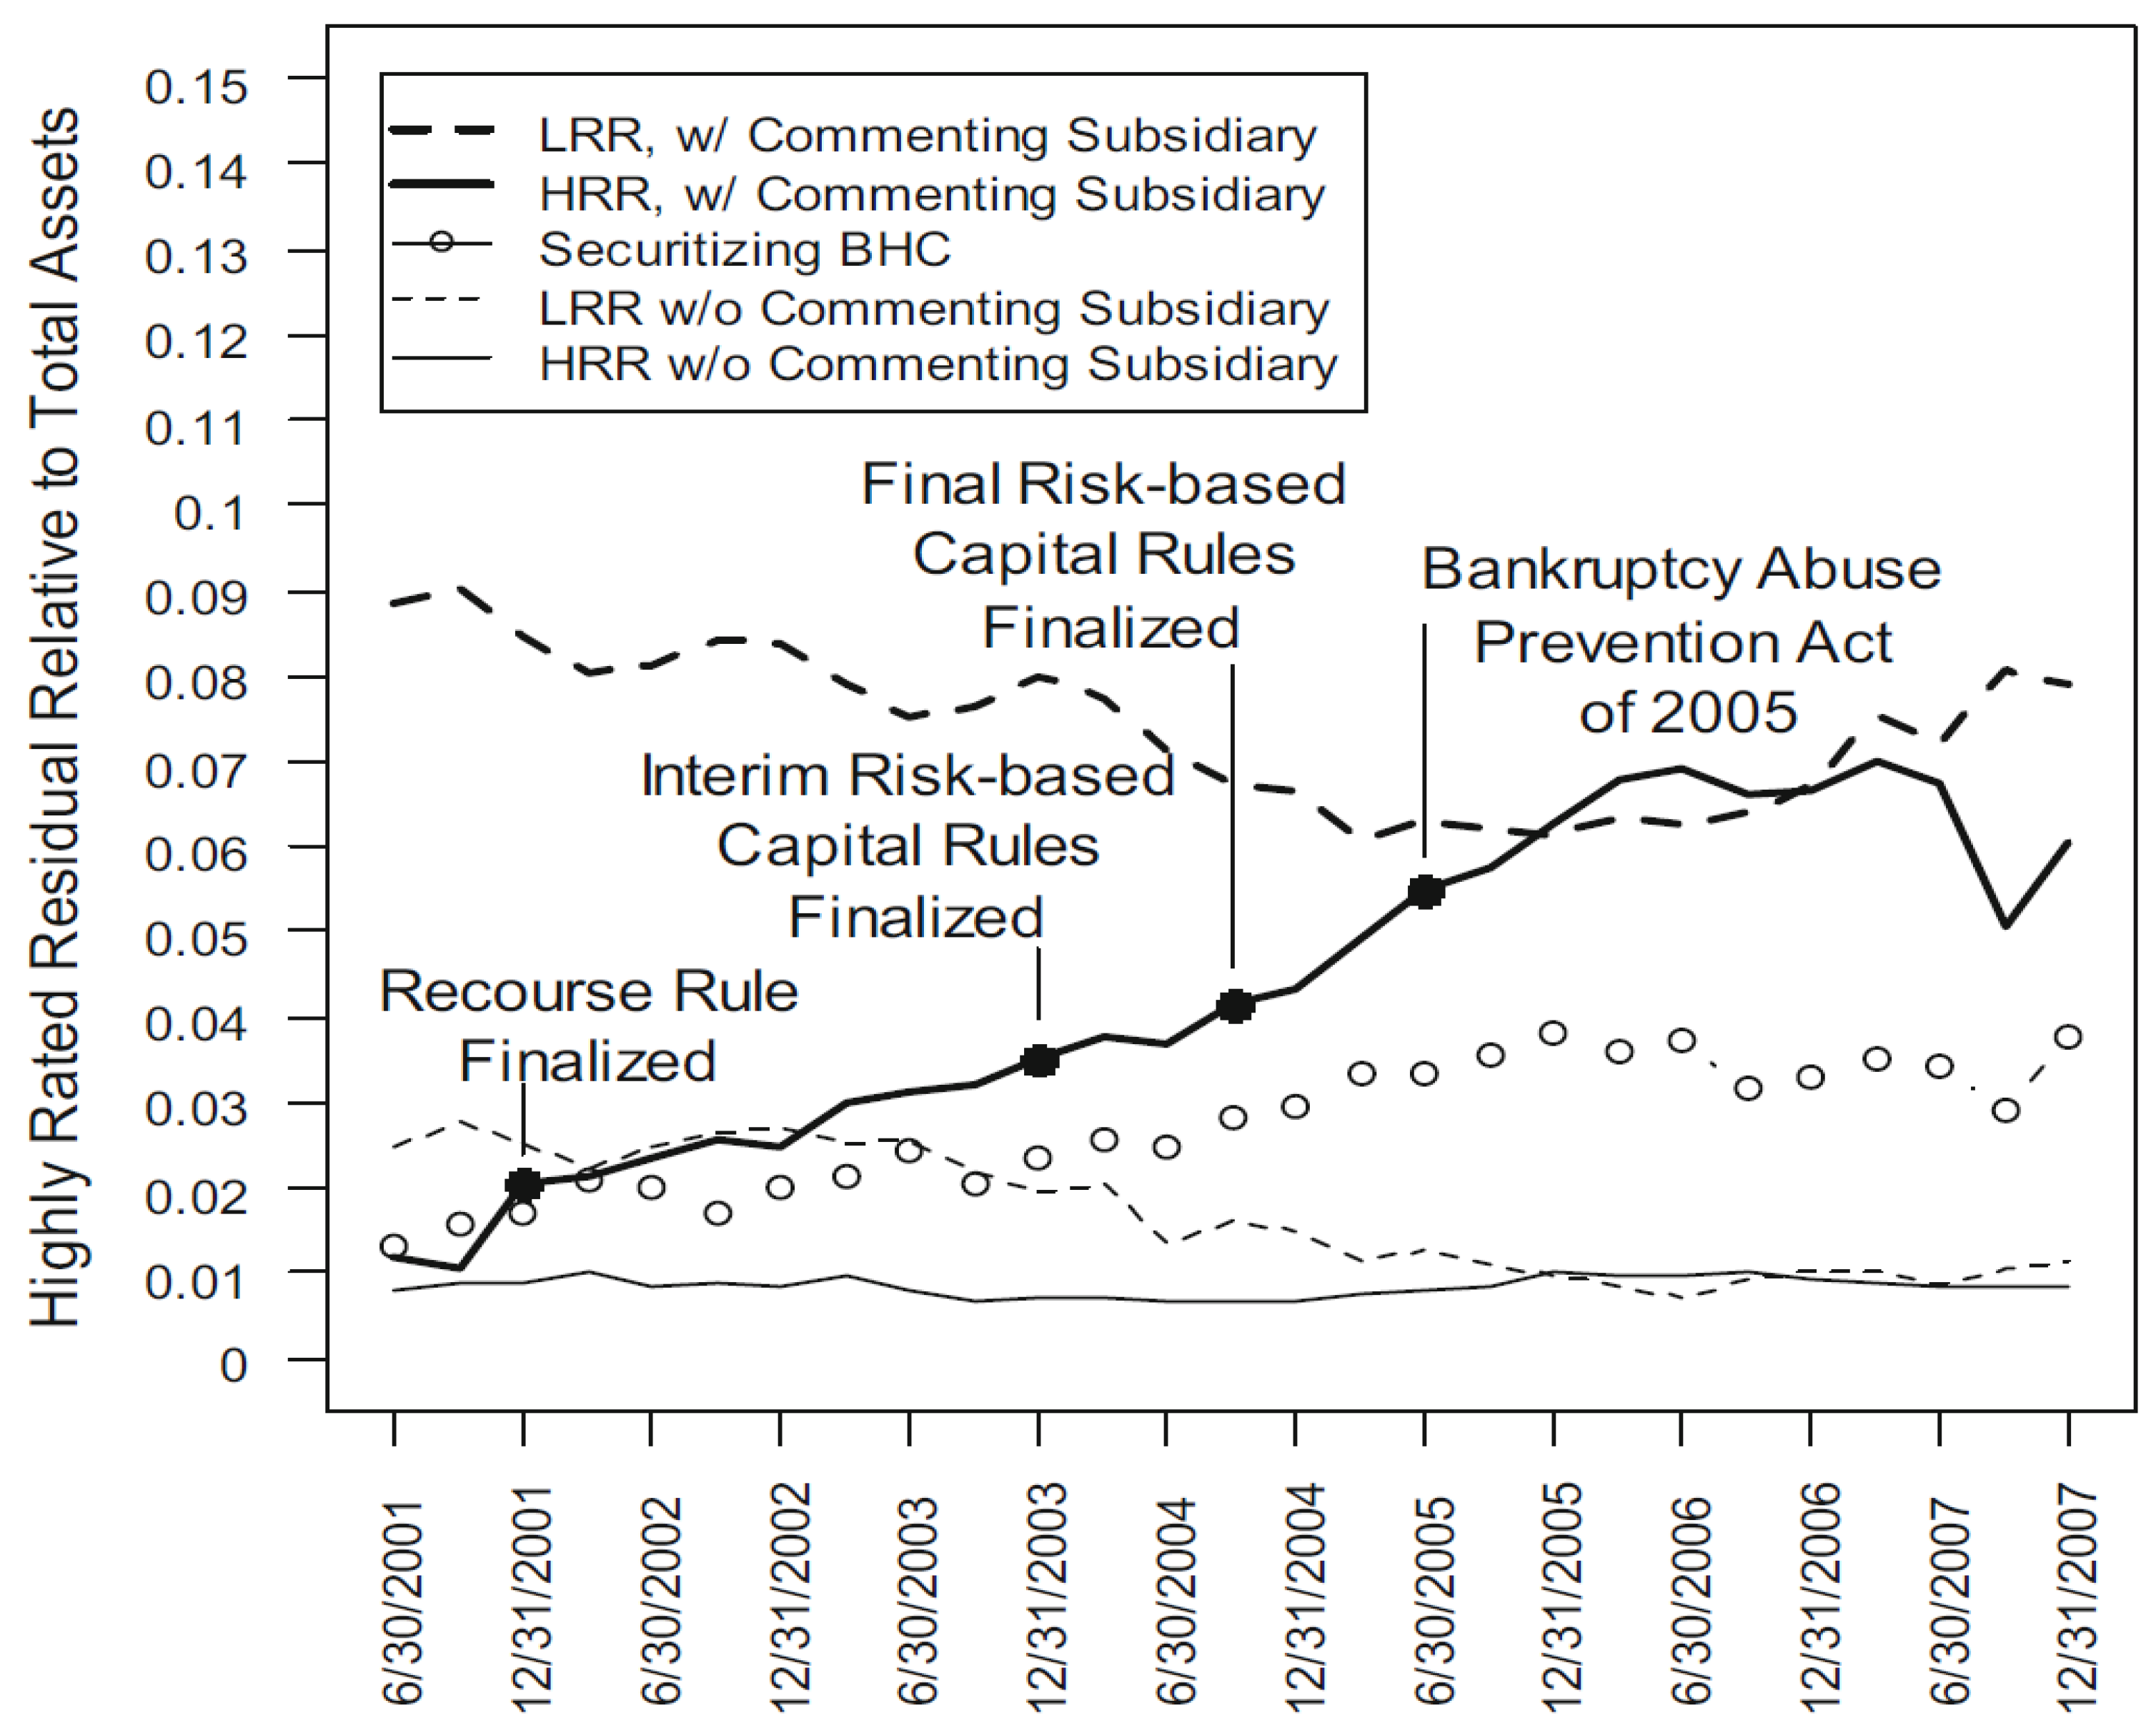
| 11 | Erel et al. (2014) do not find explicit evidence of regulatory arbitrage, but they note (p. 407) that their results “are consistent with a more sophisticated view of regulatory arbitrage.” Extending Erel et al. (2014), Miller (2018) does find evidence of regulatory arbitrage as previously discussed. |
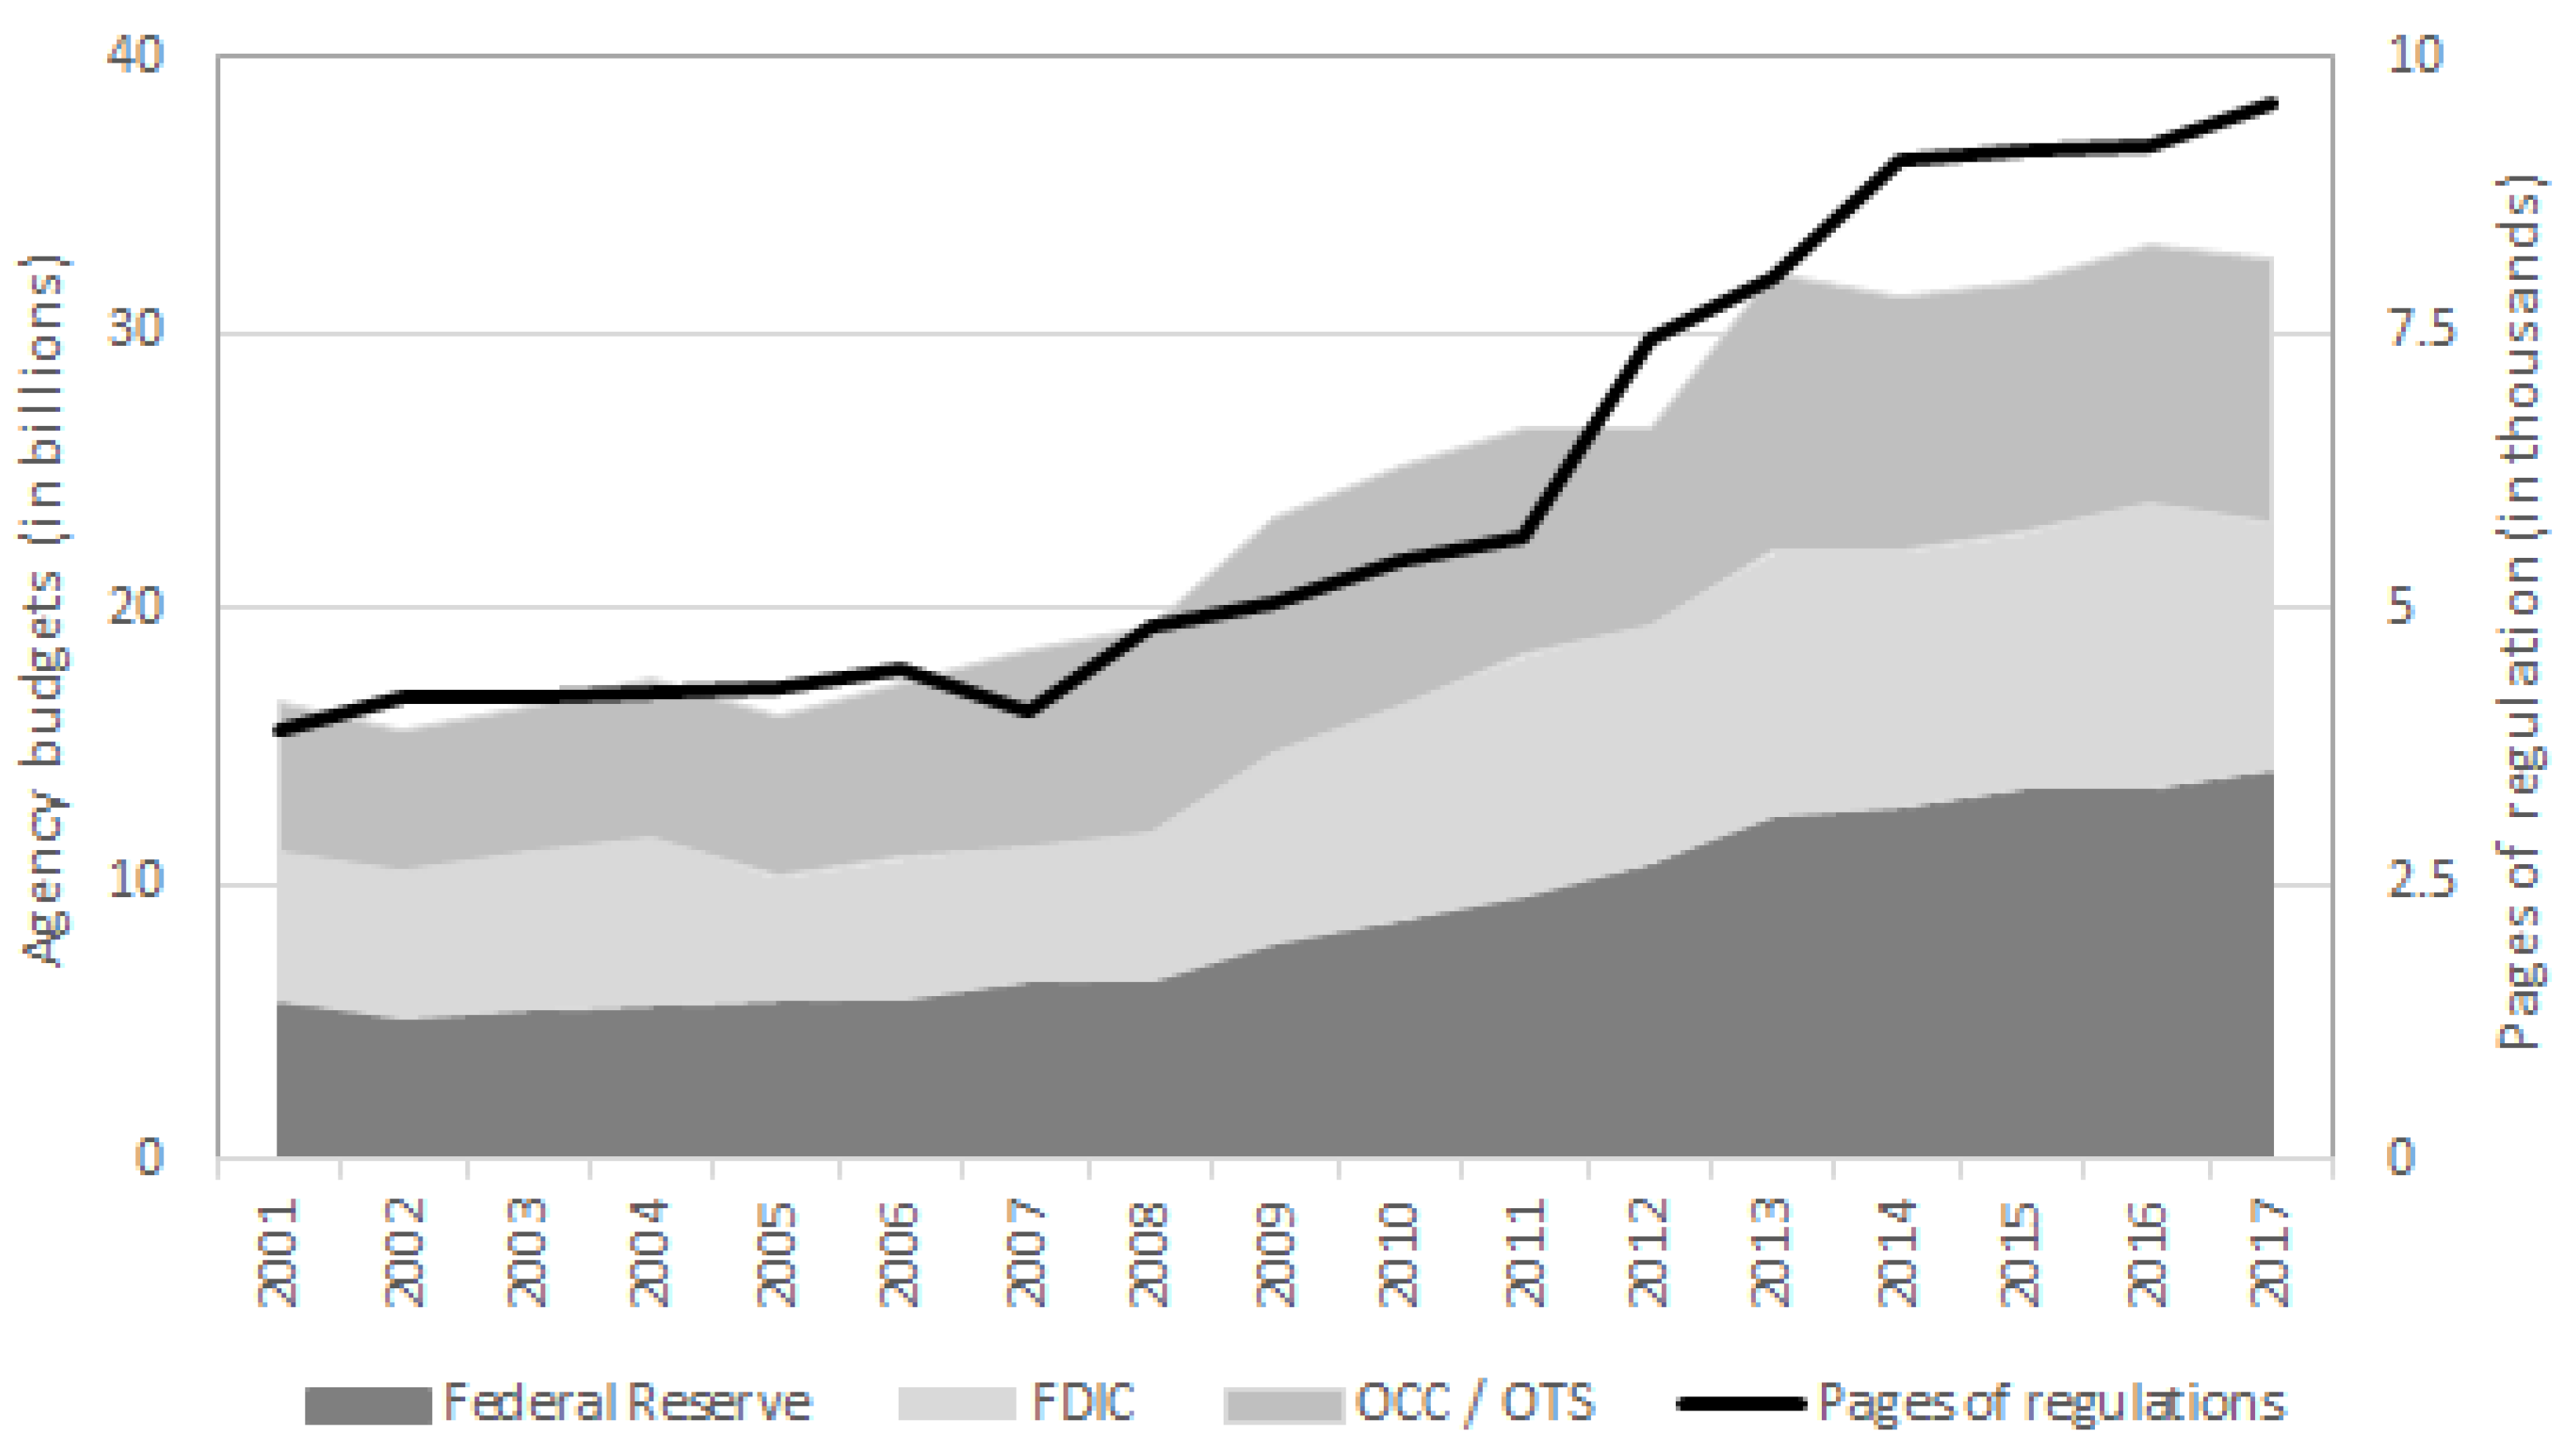
| 12 | Data gathered from the Regulators’ Budget reports by the Weidenbaum Center on the Economy, Government, and Public Policy at Washington University in St. Louis and the George Washington University Regulatory Studies Center, available online at https://regulatorystudies.columbian.gwu.edu/regulators-budget. |
| 13 | Some banks are also subject to rules by other regulatory angencies such as the Consumer Financial Protection Bureau (CFPB) and the Securities and Exchange Commission (SEC). |
| 14 | Another proxy for regulations is the number of regulatory restrictions estimated by QuantGov based on restrictive lanuguage such as “shall” or “shall not” and “may” and “may not.” For Title 12, the number of pages and number of restrictions show very similar patterns. Data on regulatory restrictions are available online at https://www.quantgov.org. |
| 15 | For more information, see https://www.federalreserve.gov/publications/other-reports/credit-ratings-report-201107.htm. |
| 16 | |
| 17 | As discussed in Section 4.1, RBC ratios are also not better predictors for horizons longer than two years. |
| 18 | As the study describes (p. 29), “Net benefits are the difference between expected benefits and costs; expected benefits are calculated assuming a crisis has a moderate permanent effect (cost of a crisis equals 63%), no permanent effect (cost of a crisis equals 19%) and large permanent effect (cost of a crisis equals 158%).” |
| 19 | This excludes other costs such as misincentives and market distortions omitted by the OCC et al. (2016). |
| 20 | |
| 21 | Available online at https://www.federalregister.gov. |
| 22 | Available online at https://regulatorystudies.columbian.gwu.edu/regulators-budget. |
| 23 | Available online at https://www.chicagofed.org/banking/financial-institution-reports/bhc-data. |


| Bank A | Bank B | |||||||
|---|---|---|---|---|---|---|---|---|
| Assets (risk weight) | Liabilities and equity | Assets (risk weight) | Liabilities and equity | |||||
| Cash (0.0) | $10 | Equity | $21 | Cash (0.0) | $10 | Equity | $18 | |
| Loans (0.5) | $80 | Debt | $79 | Loans (0.5) | $60 | Debt | $82 | |
| MBSs (0.2) | $10 | MBSs (0.2) | $30 | |||||
| Total | $100 | Total | $100 | Total | $100 | Total | $100 | |
| Capital ratio = 21% | Capital ratio = 18% | |||||||
| RBC Ratio = 50% | RBC Ratio = 50% | |||||||
| Year | Rule | Regulatory Agency | Includes RIA | Claims Net Benefits | Quantitative Evidence |
|---|---|---|---|---|---|
| 1986 | RBC Standards ANPR | OCC | |||
| 1987 | RBC Standards for national banks | OCC | |||
| 1988 | RBC Standards for all large banks | OCC, Fed, FDIC | |||
| 1996 | Market Risk Capital Rules | OCC, Fed, FDIC | |||
| 2001 | Recourse Rule | OCC, Fed, FDIC, OTS | |||
| 2003 | Basel II | OCC, Fed, FDIC, OTS | √ | √ | |
| 2008 | Standardized Framework | OCC, Fed, FDIC, OTS | √ | √ | |
| 2011 | Orderly Resolution Plans | Fed, FDIC | |||
| 2011 | Revised Market Risk Rules | OCC, Fed, FDIC | √ | √ | |
| 2011 | Volcker Rule | OCC, Fed, FDIC | |||
| 2011 | CCAR Stress Tests | Fed | |||
| 2012 | DFAST Stress Tests | Fed | |||
| 2012 | Advanced Approaches | OCC, Fed, FDIC | |||
| 2012 | Basel III | OCC, Fed, FDIC | |||
| 2012 | Standardized Approach | OCC, Fed, FDIC | |||
| 2013 | LCR | OCC, Fed, FDIC | √ | ||
| 2013 | SLR & eSLR | OCC, Fed, FDIC | √ | ||
| 2014 | GSIB Rules | Fed | |||
| 2014 | Revised LCR | OCC, Fed, FDIC | |||
| 2015 | Recovery Plans | OCC | |||
| 2015 | TLAC | Fed | √ | √ | |
| 2016 | CCyB | Fed | |||
| 2016 | Revised Recovery Plan Threshold | OCC | |||
| 2016 | NSFR | OCC, Fed, FDIC | √ | √ | |
| 2018 | Revised eSLR | OCC, Fed | √ | ||
| 2018 | Revised LCR HQLA | OCC, Fed, FDIC | |||
| 2018 | Revised Capital Thresholds | OCC, Fed, FDIC | √ | ||
| Total | 27 | 9 | 5 | 0 |
| Capital Rules Only | Capital & Liquidity Rules | Benefit of Liquidity Rules | |||||||
|---|---|---|---|---|---|---|---|---|---|
| Permanent Effects: | None | Moderate | Large | None | Moderate | Large | None | Moderate | Large |
| Capital | |||||||||
| 8% | 0.20 | 0.87 | 2.32 | 0.25 | 1.23 | 3.33 | 0.05 | 0.36 | 1.01 |
| 9% | 0.31 | 1.44 | 3.87 | 0.29 | 1.56 | 4.30 | −0.02 | 0.12 | 0.43 |
| 10% | 0.33 | 1.71 | 4.70 | 0.28 | 1.75 | 4.91 | −0.05 | 0.04 | 0.21 |
| 11% | 0.31 | 1.87 | 5.23 | 0.25 | 1.85 | 5.30 | −0.06 | −0.02 | 0.07 |
| 12% | 0.27 | 1.94 | 5.54 | 0.20 | 1.89 | 5.55 | −0.07 | −0.05 | 0.01 |
| 13% | 0.21 | 1.96 | 5.73 | 0.14 | 1.90 | 5.70 | −0.07 | −0.06 | −0.03 |
| 14% | 0.15 | 1.95 | 5.84 | 0.07 | 1.89 | 5.80 | −0.08 | −0.06 | −0.04 |
| 15% | 0.08 | 1.92 | 5.90 | 0.00 | 1.85 | 5.85 | −0.08 | −0.07 | −0.05 |
| Bank Holding Company | Total Assets (in Billions) | TEC Ratio |
|---|---|---|
| JPMorgan Chase & Co. | $2490 | 11.17% |
| Bank of America Corporation | $2188 | 12.32% |
| Wells Fargo & Company | $1930 | 11.04% |
| Citigroup Inc. | $1792 | 15.43% |
| Goldman Sachs Group, Inc. | $860 | 15.31% |
| Morgan Stanley | $815 | 14.74% |
| Bank of New York Mellon | $333 | 15.04% |
| State Street Corporation | $243 | 14.90% |
| Simple average | 13.7% | |
| Weighted average | 12.9% |
Publisher’s Note: MDPI stays neutral with regard to jurisdictional claims in published maps and institutional affiliations. |
© 2021 by the author. Licensee MDPI, Basel, Switzerland. This article is an open access article distributed under the terms and conditions of the Creative Commons Attribution (CC BY) license (http://creativecommons.org/licenses/by/4.0/).
Share and Cite
Hogan, T.L. A Review of the Regulatory Impact Analysis of Risk-Based Capital and Related Liquidity Rules. J. Risk Financial Manag. 2021, 14, 24. https://doi.org/10.3390/jrfm14010024
Hogan TL. A Review of the Regulatory Impact Analysis of Risk-Based Capital and Related Liquidity Rules. Journal of Risk and Financial Management. 2021; 14(1):24. https://doi.org/10.3390/jrfm14010024
Chicago/Turabian StyleHogan, Thomas L. 2021. "A Review of the Regulatory Impact Analysis of Risk-Based Capital and Related Liquidity Rules" Journal of Risk and Financial Management 14, no. 1: 24. https://doi.org/10.3390/jrfm14010024
APA StyleHogan, T. L. (2021). A Review of the Regulatory Impact Analysis of Risk-Based Capital and Related Liquidity Rules. Journal of Risk and Financial Management, 14(1), 24. https://doi.org/10.3390/jrfm14010024