Article

Precious Metal Mutual Fund Performance Evaluation: A Series Two-Stage DEA Modeling Approach

by
Ioannis E. Tsolas
School of Applied Mathematics and Physics, National Technical University of Athens, 15780 Athens, Greece
J. Risk Financial Manag. 2020, 13(5), 87; https://doi.org/10.3390/jrfm13050087
Submission received: 18 March 2020 / Revised: 27 April 2020 / Accepted: 28 April 2020 / Published: 30 April 2020
(This article belongs to the Special Issue Volatility Modelling and Forecasting)

Abstract

:
This paper documents a new series two-stage data envelopment analysis (DEA) modeling framework for mutual fund performance evaluation in terms of operational and portfolio management efficiency that is implemented to a sample of precious metal mutual funds (PMMFs). In the first and second stage, one-input/one-output and multi-input/one-output settings are used, respectively. In the light of the results, the funds assessed are inefficient in both operational and portfolio management process and in particular, they seem to be more inefficiently operated. The operational management efficiency is correlated with portfolio management efficiency and, therefore, sample funds should give more emphasis on their operational policies to ensure their success in the industry. The research framework may not only benefit PMMFs, but also funds of other classes to quantify their performance and improve their competitive advantages.

1. Introduction

Investments in precious metals have increased in recent years with a notable transformation of commodities from physically tangible to financial investments. The increasing attention of investors to precious metals may be justified by the fact that they are deemed to have some diversification benefits and can act as safe havens during financial crises (Lucey and Li 2015). Although the findings of earlier studies support the evidence that precious metals provide low or negative correlation to other asset classes like stocks and bonds, recent studies raise doubts about the significance of precious metals diversification benefits (Qadan 2019).
A bulk of studies in the literature deals with the dynamics of precious metals. These studies constitute two main areas of interest. In the first area lie studies which aim to examine the relationship between precious metals and some factors such as macroeconomic fundamentals (business cycle (Batten et al. 2010; Kucher and McCoskey 2017), monetary environment and financial market sentiment (Batten et al. 2010)), exchange rates (Pierdzioch et al. 2016), inflation (Bilgin et al. 2018; Salisu et al. 2019), central bank announcements of asset purchases (Glick and Leduc 2012), uncertainty captured by the Chicago Board Options Exchange (CBOE) volatility index or VIX (Jubinski and Lipton 2013), financial crises (Öztek and Öcal 2017), oil prices (Rehman et al. 2018), risk aversion (Qadan 2019), and the S&P 500 (e.g., Piñeiro-Chousa et al. 2018). In the second area lie studies that explore the stochastic properties of precious metals and their volatility spillover (e.g., Kang et al. 2017; Balcilar and Ozdemir 2019). For recent surveys, the interested reader is referred to O’Connor et al. (2015), Vigne et al. (2017), and Talbi et al. (2020).
There are some alternative forms of investment in precious metals (e.g., mutual funds, exchange traded funds (ETFs), futures, and options), and in the current study, we focus on precious metal mutual funds (PMMFs) and in particular on their performance evaluation.
Mutual funds as a type of investment vehicle consist of shares of a portfolio of stocks, bonds, or other securities. Most mutual funds are open-end companies which mean that there is no predetermined maximum number of shares; the shares are issued and retired based on demand (Baker et al. 2018). The mutual fund sponsor sells shares to investors and also redeems them. The shares are priced daily based on their current net asset value (NAV) providing a margin for the various types of costs (e.g., management expenses and costs for buying and selling securities).
PMMFs as a special category of commodity mutual funds (CMFs) (Baker et al. 2018) have similarities with stock mutual funds as they offer different levels of investing in the shares of mining firms or in precious metals. PMMFs are seen by investors as a vehicle to gain exposure to metals such as gold, silver, platinum, and palladium at a low cost and investment scale (Otero and Reboredo 2018). Investors who buy PMMFs anticipate having greater returns in the long run than purchasing stocks by themselves (Tsolas 2014).
Mutual funds in the US are a type of registered investment companies that invest pooled shareholder funds in securities. In 2014, the worldwide assets invested in mutual funds were about US$31 trillion of which about US$16 trillion represent the total US net assets of mutual funds (Baker et al. 2015; ICI 2015). The mutual fund industry in the US concentrated almost half of the global mutual fund assets worth of about US$17.7 trillion in 2018 (Szmigiera 2019).
Gold, silver, platinum, and palladium constitute the majority of trading in precious metals and represented about 9% of the trading in commodity markets in 2008 (Batten et al. 2010).
There exist bodies of literature on methods for mutual fund performance evaluation, such as the Capital Asset Pricing Model (CAPM) (Sharpe 1964) as well as parametric and non-parametric frontier estimation methods, such as stochastic frontier analysis (Annaert et al. 2003) and data envelopment analysis (DEA) (Murthi et al. 1997), respectively.
DEA (Charnes et al. 1978) is an operational research-based approach that evaluates the efficiency of a set of decision-making units (DMUs); mutual funds, in our case. Ex-post mutual fund efficiency in the DEA context deals with the ability of a fund to obtain outputs (i.e., achievements, such as returns) with the minimum resources (i.e., inputs, such as costs and risk). Although there is a number of ex-post evaluation studies on the efficiency of mutual funds using DEA (see, for example, the pioneering research by Murthi et al. (1997), and recent reviews by Tsolas (2014), Basso and Funari (2016), and Premachandra et al. (2016)), they are focused mainly on evaluating the portfolio efficiency of the mutual fund schemes as a single (management) process. These works employ single stage DEA that does not reflect the internal structure of funds. Exceptions are the research by Premachandra et al. (2012) and the studies followed by Galagedera et al. (2016, 2018), Sánchez-González et al. (2017), Galagedera (2018, 2019), and Hsieh et al. (2020).
In this regard, there are few evaluation studies to assess the DEA-based efficiency of mutual fund schemes with an emphasis on the internal structure of the management process. Against this backdrop, the current study aims to improve over single black box DEA (Kao 2014) for the mutual fund scheme and evaluate the efficiency of a group of PMMFs by employing a two-stage DEA model with the aim to open the black box of the mutual fund management process. In the current analysis, a proposed series two-stage DEA model is employed. It should be noted that the series two-stage DEA model is wholly different from the two-stage DEA approach (Coelli et al. 2005) used to regress the produced efficiency scores on control variables not included in the DEA assessment (Tsolas 2015).
This study contributes to the existing literature in several ways. First, it provides new empirical evidence on the efficiency of the management process of PMMFs focusing in operational and portfolio management efficiency. Second, due to the black box of the mutual fund management process, this study aims to fill this gap by using a two-stage DEA model to evaluate the efficiency in both the operational and portfolio management sub-processes. The proposed framework improves upon the existing two-stage DEA mutual fund performance evaluation scheme introduced by Premachandra et al. (2012) as it modifies the first stage of analysis from multi-input/one-output setting to one-input/one-output setting. This modification to the first stage of analysis stems from our effort to evaluate PMMFs using an existing data set (Tsolas 2014).
In the current study, the following questions are addressed:
(1) What is the most efficient level of inputs associated with sampled PMMFs outputs in the two performance dimensions?
(2) Which are the top performers among the sampled PMMFs?
(3) Is there statistical significant correlation between the DEA metrics produced in the two performance dimensions?
The rest of the paper unfolds as follows. Section 2 provides the literature review. In Section 3, the proposed two-stage DEA model is presented. The data, along with selection of inputs and outputs for the case of a sample of PMMFs, are reported in Section 4. In Section 5, the results are presented and discussed. In Section 6, the policy implications are provided, and the final section concludes this paper.

2. Literature Review

2.1. Survey of DEA-Based Mutual Fund Performance Evaluation

In recent years, a growing body of studies has applied DEA for a mutual fund performance evaluation. These studies constitute two main research strands.
The first strand includes single DEA studies that use DEA models considering a mutual fund management process as a black box process with multiple inputs and multiple outputs. In this strand lie a huge number of studies which followed the research by Murthi et al. (1997). Morey and Morey (1999) propose the first diversification DEA model, and recently Lin and Li (2019) recommended a directional distance-based diversification super-efficiency DEA model. Recent contributions to the literature for the measurement of portfolio efficiency are the studies by Tarnaud and Leleu (2018) and Zhou et al. (2018). Baghdadabad et al. (2013) evaluated the efficiency of mutual fund managers followed by Banker et al. (2016) and recently by Andreu et al. (2019). For recent reviews on DEA, the interested reader is referred to Glawischnig and Sommersguter-Reichmann (2010), Tsolas (2014), Basso and Funari (2016), and Premachandra et al. (2016). For the topics of the diversification DEA models (non-linear DEA models; Zhou et al. 2018) and DEA-based mutual fund managers’ evaluation, recent reviews can be found in the studies by Lin and Li (2019) and Andreu et al. (2019), respectively.
In the second strand, model building is based on the series two-stage DEA. In contrast to the single DEA black box model, a two-stage DEA model identifies sub-processes and aims at measuring their efficiency (Kao 2014). In this strand lie the studies of Premachandra et al. (2012), Galagedera et al. (2016, 2018), Sánchez-González et al. (2017), Galagedera (2018, 2019), and Hsieh et al. (2020).
Premachandra et al. (2012) first introduced a series two-stage modeling for mutual fund performance evaluation considering operational and portfolio process. Galagedera et al. (2016) improved upon Premachandra et al. (2012) by proposing a two-stage network structure to accommodate an independent output at the first stage for mutual fund appraisal. Sánchez-González et al. (2017) evaluated the Spanish mutual fund companies by means of DEA aiming to assess both the portfolio management and marketing as processes that reflect the internal structure of funds. Galagedera et al. (2018) extended the analysis into a three-stage DEA modeling for fund appraisal. Galagedera (2018) assessed superannuation fund performance through a serially linked two sub-process (operational and portfolio management) by employing two-stage DEA modeling. Galagedera (2019) modeled social responsibility in mutual fund performance appraisal by means of a two-stage DEA using non-discretionary first stage output. In a recent study, Hsieh et al. (2020) employed a window two-stage DEA approach to assess the performance of mutual funds registered in Taiwan.
In a recent study by Tuzcu and Ertugay (2020), although they acknowledge DEA as a black box, they employed the one-stage DEA to investigate the role of size in mutual fund evaluation following an earlier study by Basso and Funari (2017).

2.2. Research Gaps in the Literature

Single- and two-stage DEA have been already employed for ex-post evaluation of mutual funds. To the best of the author’s knowledge the two-stage DEA has not been applied so far to assess the performance of PMMFs. The current study aims to fill this gap by employing two-stage DEA to assess the efficiency of a sample of PMMFs and open the black box of their management process. In addition, the current research contributes to the existing literature by modifying the first stage of existing two-stage DEA modeling from a multi-input/one-output setting to a one-input/one-output setting.

3. Research Methods

In this section the proposed series two-stage framework is described, the necessary variables and definitions are provided and the DEA modeling issues are discussed.

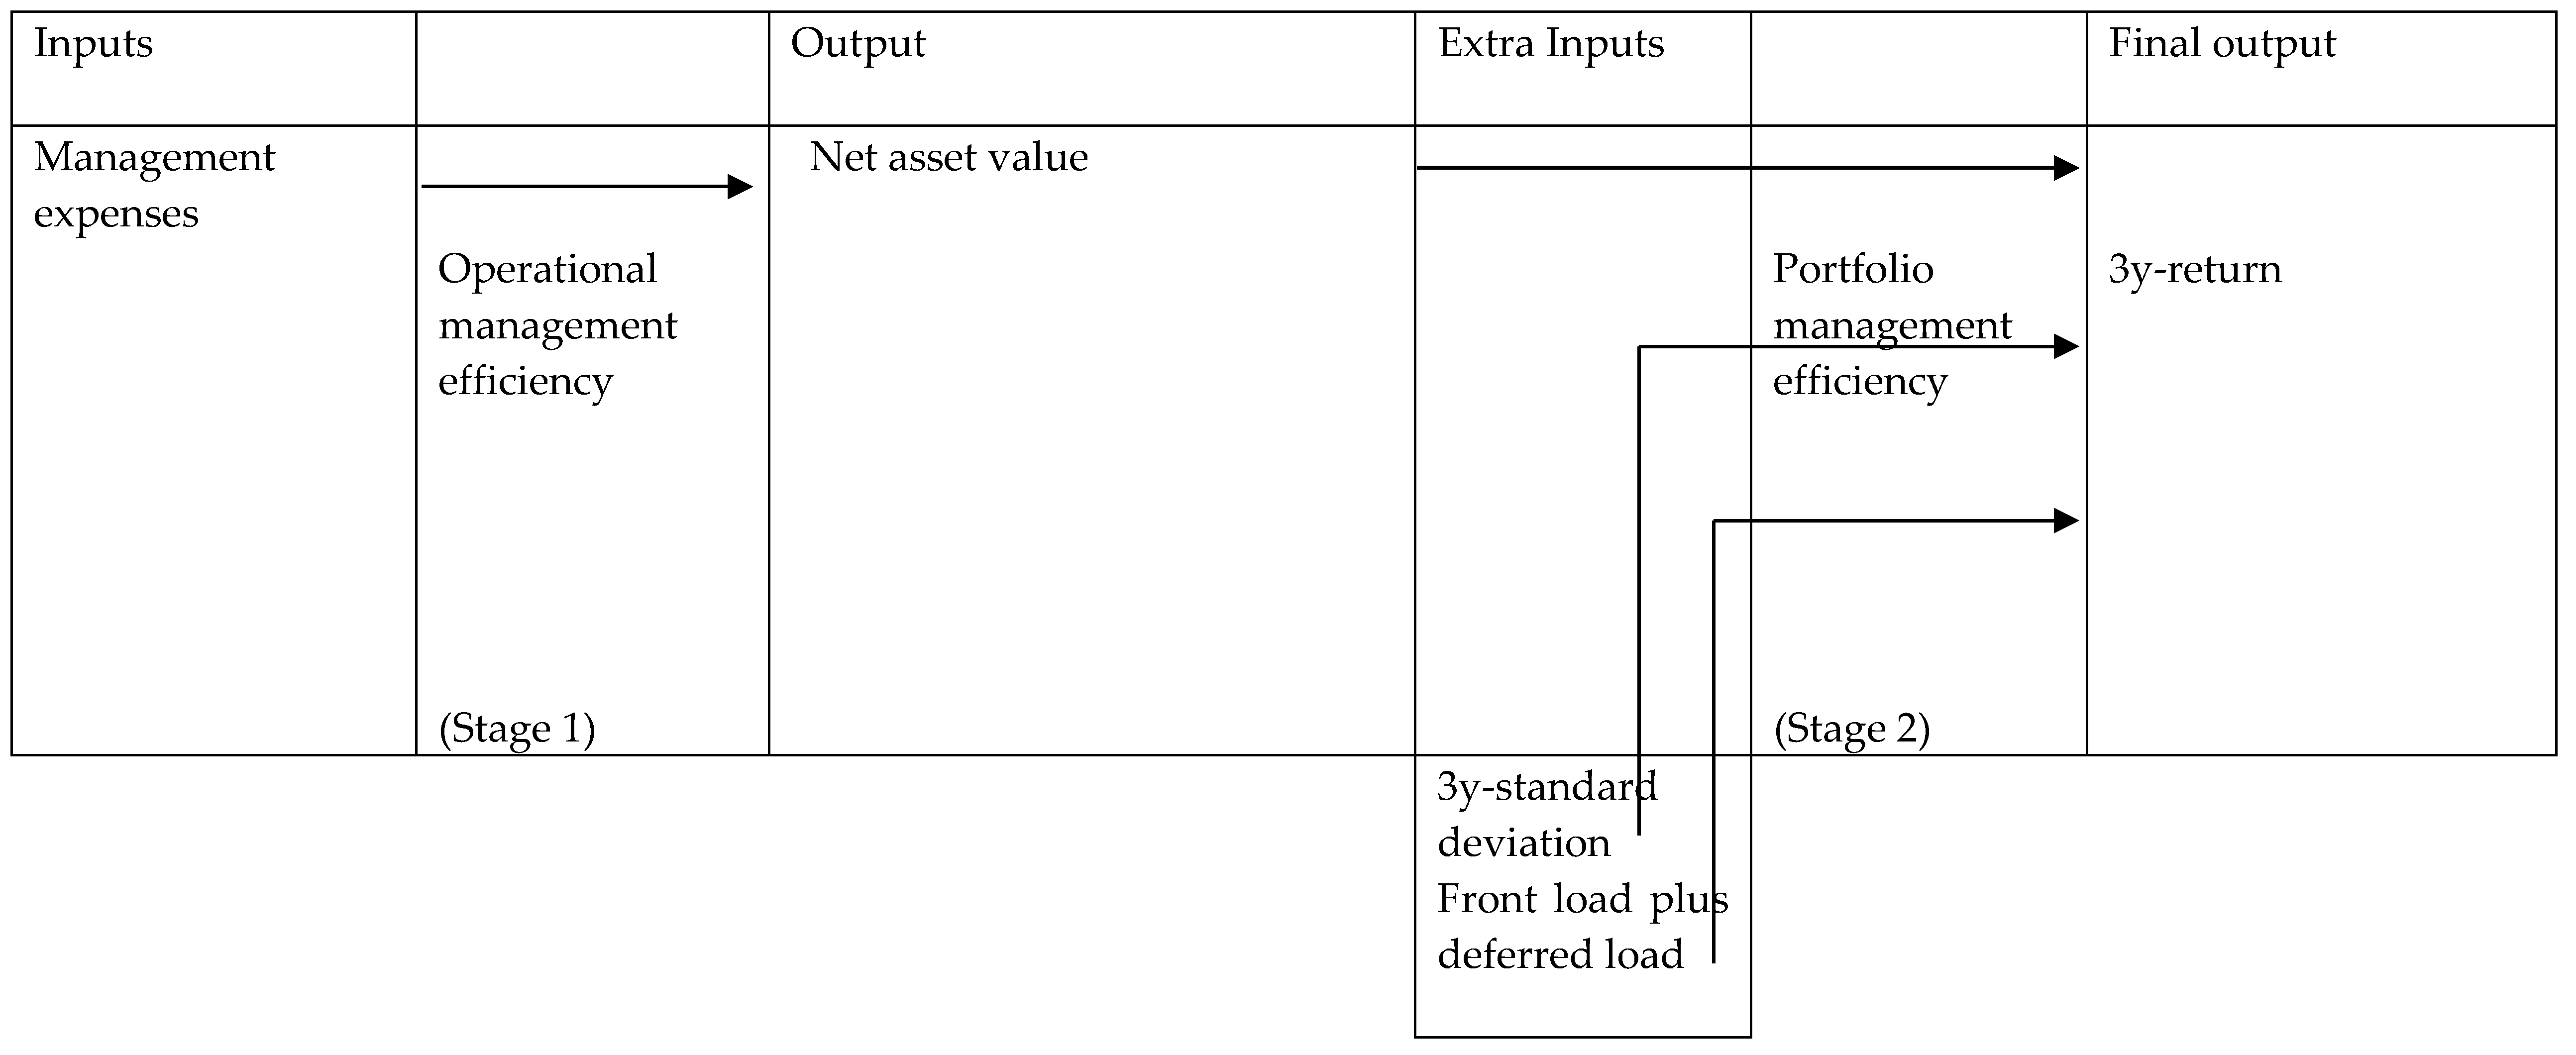
3.1. Definitions and Conceptual Framework

In line with Premachandra et al. (2012), mutual fund performance measurement is defined as the process of quantifying the operational management efficiency and portfolio management efficiency of the fund scheme. The performance measures employed are the metrics used to quantify the operational and portfolio management efficiency of a fund scheme as two performance dimensions.
We employ the independent approach (Koronakos 2019) for the assessment of mutual funds (i.e., each stage is treated as operating independently of the other), and thus we independently calculate the efficiency of each stage.
In particular, by employing the independent approach we adopt a two-stage structure in which the output of the first sub-stage (operational management) is treated as input for the second sub-stage (portfolio management) together with some other extra inputs. In summary, input management expenses (i.e., cost) represent the input in stage 1 used to form the fund schemes which are proxied by their net asset value (NAV). In stage 2, the fund NAV (of stage 1) together with risk (proxied by standard deviation) and other portfolio costs (front load plus deferred load) are treated as inputs where fund returns are the output. This two-stage structure is illustrated in Figure 1.
It is worth noting that our proposed modeling improves upon Premachandra et al. (2012)’s model. First, we avoid using fund size and NAV in the same side of DEA, as in Premachandra et al. (2012), because these two variables are correlated. Galagedera et al. (2018) recognize this weakness of Premachandra et al. (2012) and they aim to tackle it by proposing a three stage DEA modeling for fund appraisal. Second, we aim to improve the two-stage DEA modeling of Premachandra et al. (2012) by modifying the first stages analysis from multi-input/one-output setting to a one-input/one-output setting in order to provide a more simple tool for investors and researchers.

3.2. DEA Modeling

DEA modeling issues are mainly the model selection to account for possible scale effects and the model orientation (e.g., input or output orientation).
In regard to DEA evaluations, the group of funds assessed in the current study consists of funds of various sizes; hence, among conventional radial DEA models, the BCC model (Banker et al. 1984) that accounts for possible scale effects is a natural choice.
Radial DEA models are expressed as either input minimization or output maximization models. In input minimization modeling, the relative contraction of the inputs is sought while outputs remain the same. In output maximization, the relative expansion of output is sought while inputs remain the same. Input orientation analysis is most cited in the relevant literature, and in the case of funds of various sizes, the input-oriented BCC model is used. This can be explained by the fact that this model is translation invariant with respect to outputs, and thus its use overcomes the problem in the case of negative fund returns (Tsolas 2014).
In our analysis, we assume that we have a group of n PMMFs, j = 1,…, n, and the set of inputs XÎÂm+ is used to produce outputs YÎÂk; the amounts of the ith input and rth output used by the jth mutual fund are denoted by xij and yrj, respectively. The following input-oriented BCC (Banker et al. 1984) or value-based model (Thanassoulis 2001) is employed in the analysis.
M a x h   =   r = 1 k μ r y r j 0 + ω ,
s . t . ,
i = 1 m v i x i j 0   =   1   ,
r = 1 k μ r y r j   i = 1 m v i x i j + ω 0 j = 1 , 2 , , j 0 , n ,
μ r ε r = 1 , 2 , , k
v i ε i = 1 , 2 , , m ,
ω   f r e e   o n   s i g n ,
where
  • ε > 0, a convenient small positive number (non-Archimedean);
  • μr = output weights estimated by the model;
  • vi = input weights estimated by the model.
Input-orientation was chosen (i.e., BCC input-oriented model) for both stage 1 (operational management efficiency) and stage 2 (portfolio management efficiency). In both stages, fund DEA-based efficiency scores that take values between zero and unity (maximum efficiency) are produced. These efficiency scores reflect how well each fund is performing in each stage.

4. Data and Identification of Input and Output Variables

4.1. Data

The input and output variables on fifty PMMFs were used in this study. The data set is part of the data used by Tsolas (2014) and includes the bigger funds in terms of NAV. The data, publicly available on the Google Finance website, are from Morningstar.
The data set includes variables such as NAV, standard deviations, annualized returns, information on operating expenses generally used for the calculation of the management expense ratio, as well as front load and deferred load.

4.2. Input and Output Variable Specification for DEA

In stage 1, management expenses of the operational process (including fund administration and management of the asset) and NAV (i.e., the net value of fund’s assets) are put into input and output side of DEA, respectively.
The mutual fund industry shows that elements of monopolistic competition are present (U.S. GAO 2000; Luo 2002; Haslem et al. 2007; Haslem 2013) and fund competition is based on service (performance) and not on price (fees). Although fees may vary, they are not the major factor that catches the attention of investors. The majority of mutual funds seem to compete for assets based on performance (Gao and Livingston 2008).
Total cost components of the mutual funds are expenses of administration and asset management, marketing and other categories. The total expenses divided by the fund’s average net assets express the fund’s expense ratio (Sekhar 2017). Management fees for PMMFs remained constant on average over the 2005–2015 period (Otero and Reboredo 2018). According to a previous study on mutual funds, the largest component of total expense ratio reported as advisory fees (more than 65% on average) are essentially constant for larger funds; the second largest component, marketing fees, increases as the fund size increases (Gao and Livingston 2008). Since the data set in the current study is part of the data used by Tsolas (2014) and includes the bigger funds in terms of NAV, we believe that by using data on fund management expenses in stage 1 we will make the necessary effort to open the DEA black box by providing efficiency in two performance dimensions: operational and portfolio management efficiency.
In stage 2, the input variables used are the following: (i) NAV (the output of stage 1), (ii) standard deviation of three-year gross performance as a measure of risk, and (iii) front load plus deferred load. Standard deviation is the dispersion of return that represents the fund’s total risk. The front load (or sales charge) and deferred load expressed as percentages of the amount invested are the fees paid by the investors when they are buying shares of mutual funds and when they are redeeming their shares. The output is the annualized three-year return that is considered to capture the medium-term gross performances (Galagedera and Silvapulle 2002; Tsolas 2014).
The input-oriented BCC model is used to estimate efficiencies in both stages.
Descriptive statistics of the variables used in the analyses are depicted in Table 1.

5. Results

The following section presents and discusses the results of the input-oriented BCC model for both stages.

5.1. First Stage Analysis—Precious Metal Mutual Fund Operational Management Performance

The derived PMMF DEA-based performance metrics using the input-oriented BCC model are depicted in Table 2. The efficiency is on average about 44% (median efficiency: 37%). Only four funds (8% of the total sample) are efficient. The results indicate that there is scope for efficiency improvement in fund operational management performance by decreasing input (i.e., management expenses) of about 56% (= 1 − 0.44) (Table 2). This finding is in line with the selected results presented by Premachandra et al. (2012) who argue that huge reductions of management fees, which reach even 66% of expenditure, are needed for inefficient funds to become efficient.

5.2. Second Stage Analysis—Precious Metal Mutual Fund Portfolio Management Performance

The input-oriented BCC model suggests that out of the fifty funds twenty-seven (54% of the total sample) were found relatively efficient. The mean efficiency is about 96% and the median efficiency is of the order of 100%. Moreover, there is a potential of improvement in portfolio management efficiency by decreasing inputs of about 4% (= 1 − 0.96) (Table 2). This finding is not in line with the selected results presented by Premachandra et al. (2012) who argue that huge reductions of inputs (i.e., NAV, standard deviation) are needed for inefficient funds to become efficient. This difference is perhaps due to the fact that the set of PMMFs analyzed in the current study is more homogeneous as we focus only on PMMFs.

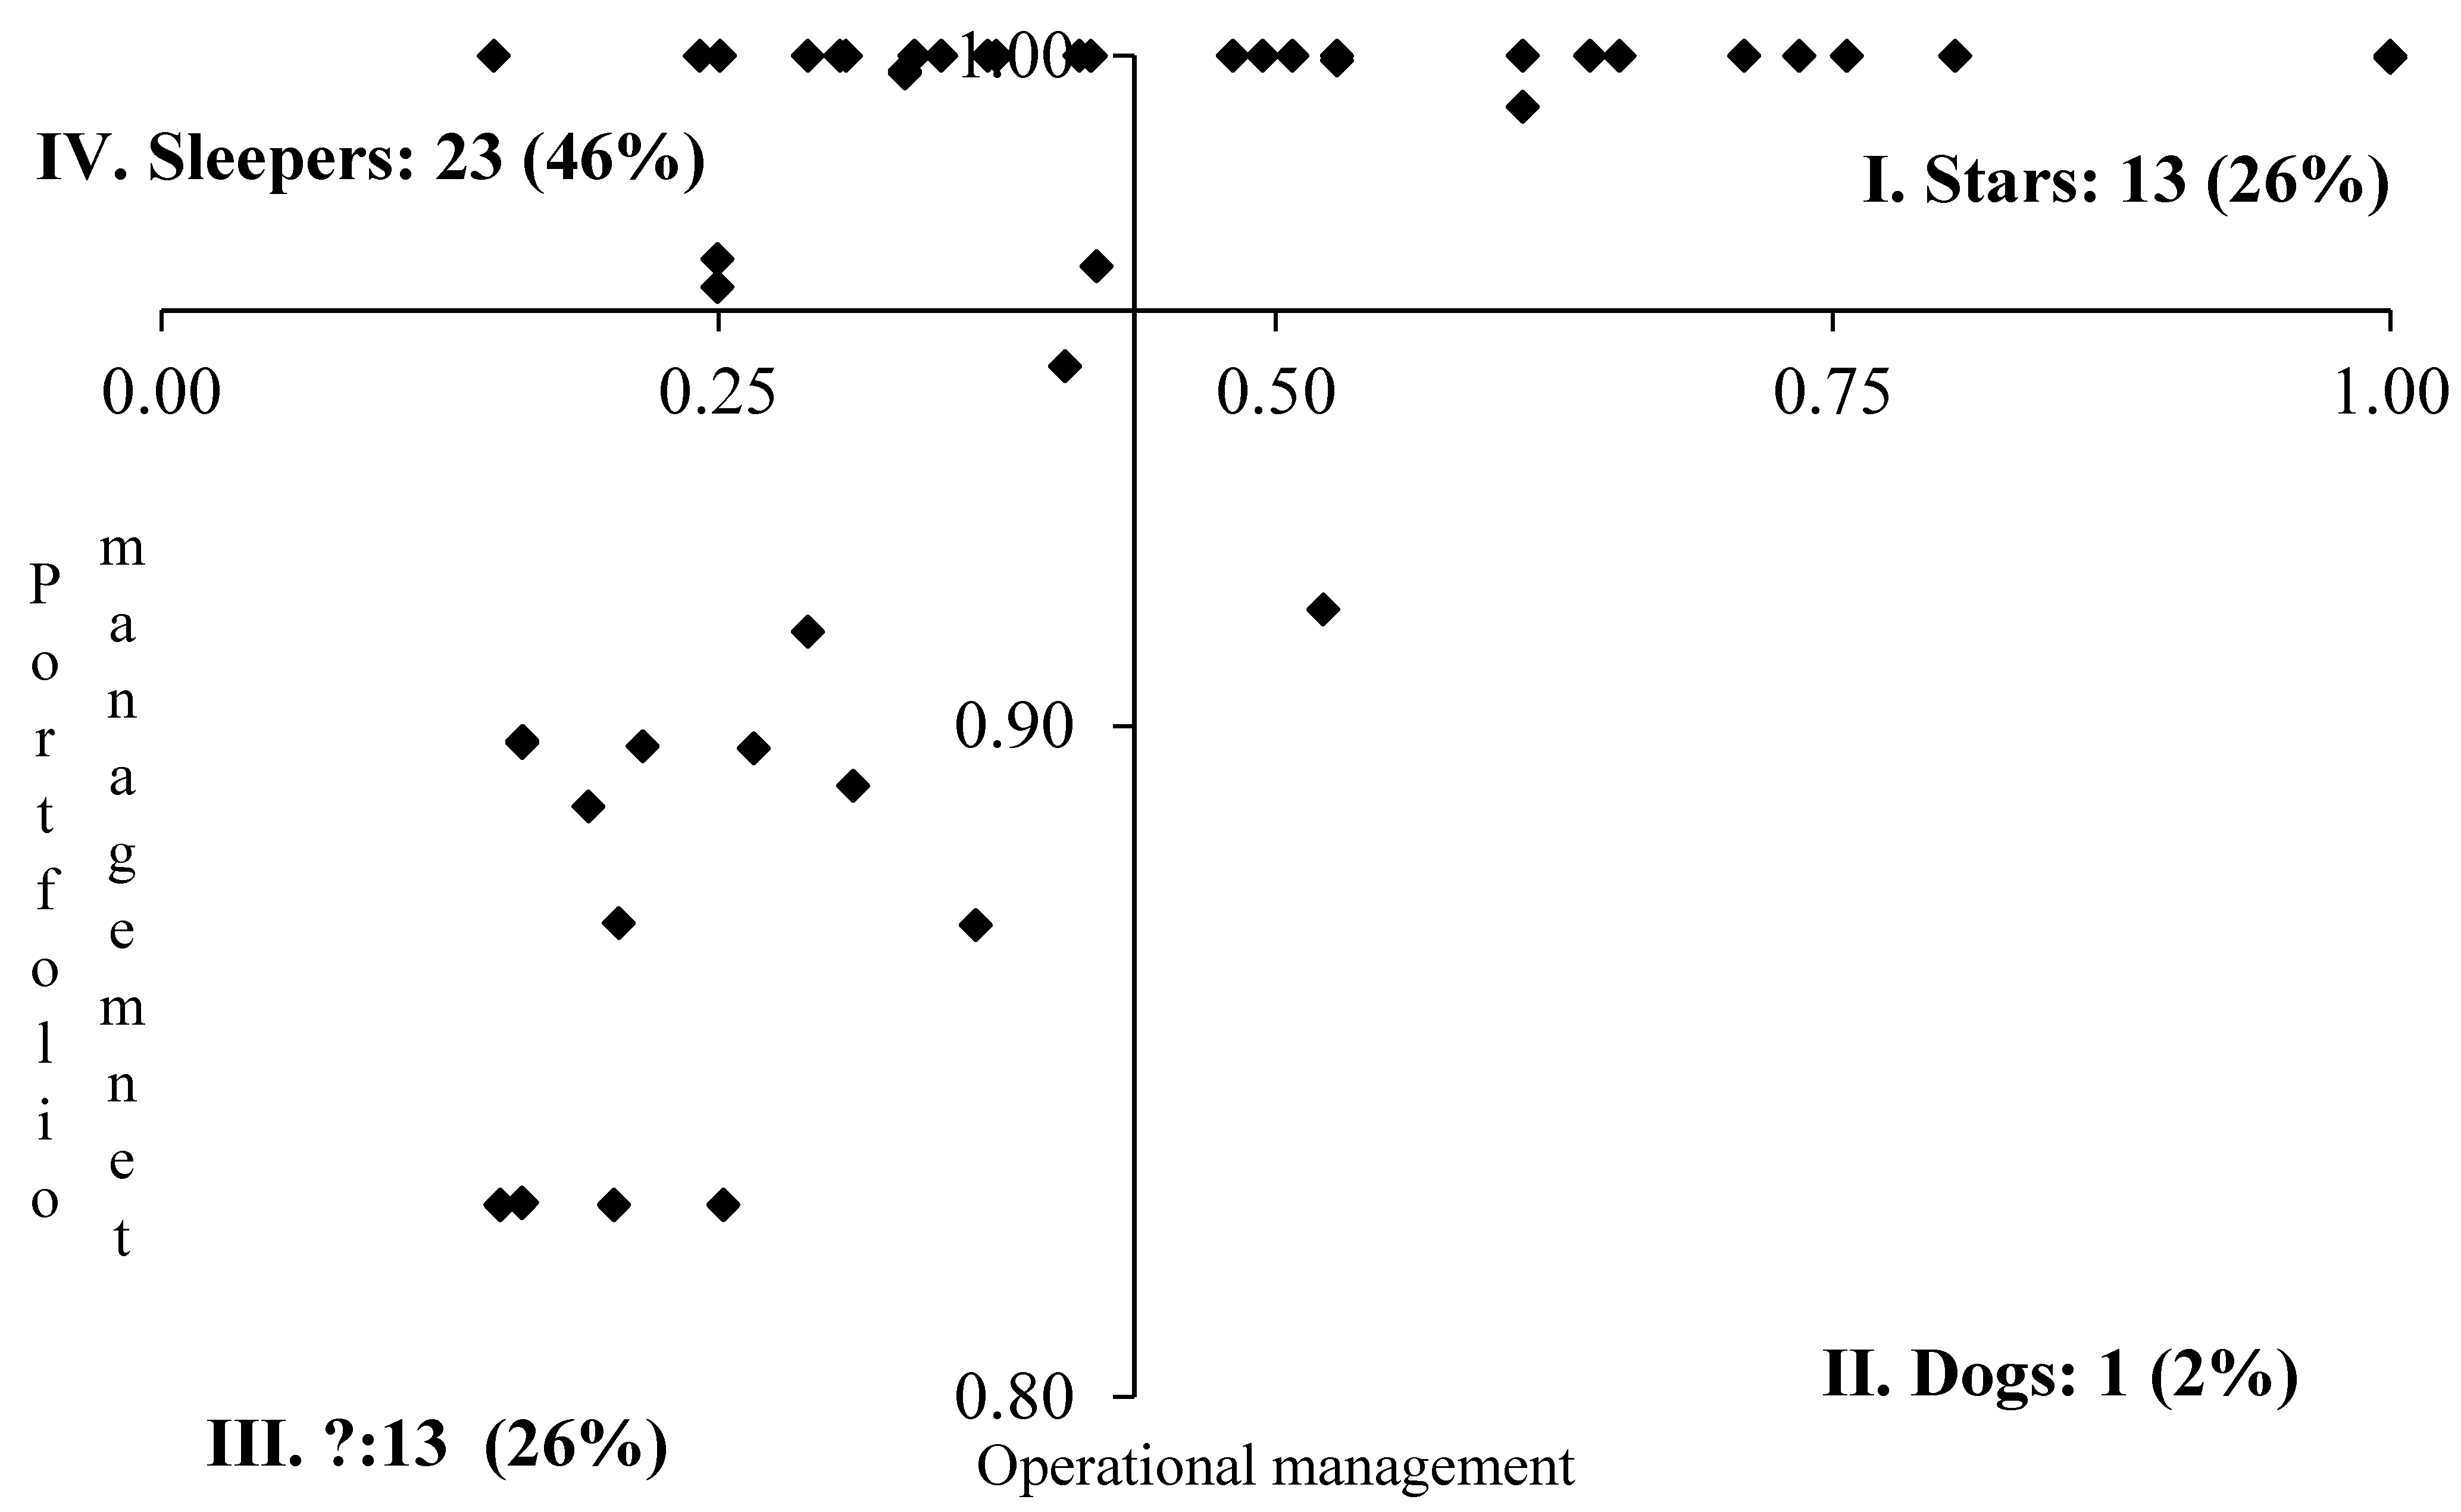
5.3. Fund Operational Management Performance vs. Portfolio Management Performance

In the light of the results, operating and portfolio management efficiency scores are correlated; Kendall’s (0.44) and Spearman’s (0.57) rank correlation coefficients are statistically significant. These results provide evidence that fund operational management performance is associated with portfolio management performance.
The comparison between operational management performance and portfolio management performance is illustrated by a matrix presented in Figure 2. Splitting half by the mean value was used to create the four quadrants of the operational management—portfolio management performance matrix. For the quadrants, the same names as in other DEA studies by Luo (2003) and Tsolas (2015) are used: stars, dogs, question marks, and sleepers. Funds that achieve higher levels of both operational and portfolio management performance can be classified as stars. Dogs are those funds that earn higher operational management performance but lower portfolio management performance operating. Question marks (problematic funds) perform inferiorly in both performance dimensions. Finally, sleepers experience a higher level of portfolio management performance but lower operational management performance.
The distribution included (Figure 2):
(I) Thirteen stars (26% of the total sample);
(II) One dog (2% of the total sample);
(II) Thirteen question marks (26% of the total sample);
(IV) Twenty-three sleepers (46% of the total sample).

5.4. Top Funds in Both Performance Dimensions

The top funds in both performance dimensions that can be used as benchmarks are American Century Global Gold Fund (AGGNX); DWS Gold & Precious Metals Fund (SGDIX); and Vanguard Precious Metals and Mining Fund, Investor (VGPMX).

5.5. Two-Stage vs. One-Stage DEA Structure

An interesting topic to be examined further is the use of single DEA structure to evaluate the sample of PMMFs. We use management expenses as percentage of NAV, standard deviation of three-year gross performance and front load plus deferred load as inputs, and the annualized three-year return as output. In this alternative model, we exclude NAV from the analysis in line with Tsolas (2014). The results of the single DEA model are strongly correlated with portfolio management performance (Pearson correlation coefficient = 0.82); the correlation with operational management performance is lower (Pearson correlation coefficient = 0.48). The results of the single DEA evaluation are depicted in Table 3. In the light of the above results, it is evident that the single DEA structure provides similar results with our proposed portfolio management performance model of stage 2. The operational management performance model of stage 1 provides new information concerning the PMMFs ex-post evaluation, and thus the two-stage DEA is deemed superior to the single DEA structure.

6. Conclusions and Implications

6.1. Contribution of the Study

This study proposed several enhancements to mutual fund performance evaluation. The first enhancement lies on the development of an enhanced approach by using a two-stage DEA model to evaluate the efficiency of mutual funds in both the operational and portfolio management sub-processes. The second enhancement is that the current study provides new empirical evidence on the efficiency of the management process of PMMFs focusing in operational and portfolio management efficiency.

6.2. Key Conclusions

The current study makes a first step towards deriving operational and portfolio management DEA-based efficiency scores for a sample of PMMFs. Our specification follows the input minimization BCC DEA model. In the light of the results, the funds assessed are inefficient in both operational and portfolio management process and in particular, they seem to be more inefficiently operated. Therefore, greater reductions in fund inputs are necessary for inefficient funds to become efficient. In addition, the employed two-stage approach can be seen as a screening process to identify the best-in-class funds in both performance dimensions. In the light of the results, there is evidence that fund operational management performance is associated with portfolio management performance. Thus, sample funds should give more emphasis on their operational policies to ensure their success in the industry.
Moreover, the two-stage DEA is deemed superior compared to the single DEA structure for the case of sample PMMFs.

6.3. Implications

The findings provided above may be useful to researchers and investors. Researches could use them to monitor not only the portfolio performance of PMMFs at a sectorial level but also the operational performance efficiency. The results may also be of interest for investors as they can use the produced efficiency scores to form an investment strategy for their portfolios. The best-in-class funds may be candidates to be picked up by potential investors who want to gain exposure to the precious metal markets through PMMFs.

6.4. Outlook

In the current research, we evaluated the performance of a sample of PMMFs and presented some implications. However, the results are sample specific, so future researches can use the research framework to appraise funds of other classes in order to quantify fund performance and investigate whether their findings are similar with those of our study.
Moreover, although the current analysis involved only static DEA models, future research can be based on dynamic analysis. If a long-time series on mutual fund performance and fund attributes will be made available, DEA can provide a dynamic evaluation of fund performance.

Funding

This research received no external funding.

Conflicts of Interest

The author declares no conflict of interest.

References

  1. Andreu, Laura, Miguel Serrano, and Luis Vicente. 2019. Efficiency of mutual fund managers: A slacks-based manager efficiency index. European Journal of Operational Research 273: 1180–93. [Google Scholar] [CrossRef] [Green Version]
  2. Annaert, Jan, Julien van den Broeck, and Rudi. V. Vennet. 2003. Determinants of mutual funds underperformance: A bayesian stochastic frontier approach. European Journal of Operational Research 151: 617–32. [Google Scholar] [CrossRef]
  3. Baghdadabad, Mohanmmad Reza Tavakoli, Farid Habibi Tanha, and Noreha Halid. 2013. The efficiency evaluation of mutual fund managers based on DARA, CARA, IARA. Journal of Business Economics and Management 14: 677–95. [Google Scholar] [CrossRef] [Green Version]
  4. Baker, H. Kent, Greg Filbeck, and Halil Kiymaz. 2015. Mutual Funds and Exchange-Traded Funds: Building Blocks to Wealth. New York: Oxford University Press. [Google Scholar]
  5. Baker, H. Kent, Greg Filbeck, and Jeffery H. Harris. 2018. Commodities: Markets, Performance, and Strategies. New York: Oxford University Press. [Google Scholar]
  6. Balcilar, Mehemet, and Zeynel Abidin Ozdemir. 2019. The volatility effect on precious metals price returns in a stochastic volatility in mean model with time-varying parameters. Physica A: Statistical Mechanics and Its Applications 534: 122329. [Google Scholar] [CrossRef]
  7. Banker, Rajiv D., Abraham Charnes, and William W. Cooper. 1984. Some models for estimating technical and scale inefficiencies in Data Envelopment Analysis. Management Science 30: 1078–92. [Google Scholar] [CrossRef] [Green Version]
  8. Banker, Rajiv, Janice Y. Chen, and Paul Klumpes. 2016. A Trade–Level DEA model to evaluate relative performance of investment fund managers. European Journal of Operational Research 255: 903–10. [Google Scholar] [CrossRef] [Green Version]
  9. Basso, Antonella, and Stefania Funari. 2016. DEA performance assessment of mutual funds. In Data Envelopment Analysis: A Handbook of Empirical Studies and Applications. Edited by Joe Zhu. New York: Springer, pp. 229–87. [Google Scholar]
  10. Basso, Antonella, and Stefania Funari. 2017. The role of fund size in the performance of mutual funds assessed with DEA models. The European Journal of Finance 23: 457–73. [Google Scholar] [CrossRef] [Green Version]
  11. Batten, Jonathan A., Cetin Ciner, and Brian M. Lucey. 2010. The macroeconomic determinants of volatility in precious metals markets. Resources Policy 35: 65–71. [Google Scholar] [CrossRef]
  12. Bilgin, Mehmet Huseyin, Fabian Gogolin, Marco Chi Keung Lau, and Samuel A. Vigne. 2018. Time-variation in the relationship between white precious metals and inflation: A cross-country analysis. Journal of International Financial Markets, Institutions and Money 56: 55–70. [Google Scholar] [CrossRef] [Green Version]
  13. Charnes, Abraham, William W. Cooper, and Edwardo Rhodes. 1978. Measuring the efficiency of decision making units. European Journal of Operational Research 2: 429–44. [Google Scholar] [CrossRef]
  14. Coelli, Timothy J., Dodla Sai Prasada Rao, Christopher J. O’Donnell, and George Edward Battese. 2005. An Introduction to Efficiency and Productivity Analysis, 2nd ed. New York: Springer. [Google Scholar]
  15. Galagedera, Don U. A. 2018. Modelling superannuation fund management function as a two-stage process for overall and stage-level performance appraisal. Applied Economics 50: 2439–58. [Google Scholar] [CrossRef]
  16. Galagedera, Don U. A. 2019. Modelling social responsibility in mutual fund performance appraisal: A two-stage data envelopment analysis model with non-discretionary first stage output. European Journal of Operational Research 273: 376–89. [Google Scholar] [CrossRef]
  17. Galagedera, Don U. A., and Param Silvapulle. 2002. Australian mutual fund performance appraisal using Data Envelopment Analysis. Managerial Finance 28: 60–73. [Google Scholar] [CrossRef]
  18. Galagedera, Don U. A., Jon Watson, Inguruwatt M. Premachandra, and Yao Chen. 2016. Modeling leakage in two-stage DEA models: An application to US mutual fund families. OMEGA International Journal of Management Science 61: 62–67. [Google Scholar] [CrossRef]
  19. Galagedera, Don U. A., Israfil Roshdi, Hirofumi Fukuyama, and Joe Zhu. 2018. A new network DEA model for mutual fund performance appraisal: An application to U.S. equity mutual funds. OMEGA International Journal of Management Science 77: 168–79. [Google Scholar] [CrossRef]
  20. Gao, Xiaohui, and Miles B. Livingston. 2008. The components of mutual fund fees. Financial Markets, Institutions & Instruments 17: 197–223. [Google Scholar]
  21. Glawischnig, Markus, and Margit Sommersguter-Reichmann. 2010. Assessing the performance of alternative investments using non-parametric efficiency measurement approaches: Is it convincing? Journal of Banking and Finance 34: 295–303. [Google Scholar] [CrossRef]
  22. Glick, Reuven, and Sylvain Leduc. 2012. Central bank announcements of asset purchases and the impact on global financial and commodity markets. Journal of International Money and Finance 31: 2078–101. [Google Scholar] [CrossRef]
  23. Haslem, John A. 2013. Mutual fund markets are imperfectly competitive. The Journal of Index Investing 4: 32–44. [Google Scholar] [CrossRef]
  24. Haslem, John A., H. Kent Baker, and David M. Smith. 2007. Identification and performance of equity mutual funds with high management fees and expense ratios. Journal of Investing 16: 32–51. [Google Scholar] [CrossRef]
  25. Hsieh, H. Pierre, Imen Tebourbi, Wen-Min Lu, and Nai-Yu Liu. 2020. Mutual fund performance: The decision quality and capital magnet efficiencies. Managerial and Decision Economics. [Google Scholar] [CrossRef]
  26. Investment Company Institute (ICI). 2015. Investment Company Fact Book, 55th ed. Washington, DC: ICI. [Google Scholar]
  27. Jubinski, Daniel, and Amy F. Lipton. 2013. VIX, gold, silver, and oil: How do commodities react to financial market volatility? Journal of Accounting and Finance 13: 70–88. [Google Scholar]
  28. Kang, Sang, Ron Mclver, and Seong-Min Yoon. 2017. Dynamic spillover effects among crude oil, precious metal, and agricultural commodity futures markets. Energy Economics 62: 19–32. [Google Scholar] [CrossRef]
  29. Kao, Chiang. 2014. Network data envelopment analysis: A review. European Journal of Operational Research 239: 1–16. [Google Scholar]
  30. Koronakos, Gregory. 2019. A taxonomy and review of the network data envelopment analysis literature. In Machine Learning Paradigms. Learning and Analytics in Intelligent Systems. Edited by George A. Tsihrintzis, Maria Virvou, Evangelos Sakkopoulos and Lakhmi C. Jain. Cham: Springer, pp. 255–311. [Google Scholar]
  31. Kucher, Oleg, and Suzanne McCoskey. 2017. The long-run relationship between precious metal prices and the business cycle. The Quarterly Review of Economics and Finance 65: 263–75. [Google Scholar] [CrossRef]
  32. Lin, Ruiyue, and Zongxin Li. 2019. Directional distance based diversification super-efficiency DEA models for mutual funds. OMEGA International Journal of Management Science. [Google Scholar] [CrossRef]
  33. Lucey, Brian M., and Sile Li. 2015. What precious metals act as safe havens, and when? Some US evidence, Applied Economics Letters 22: 35–45. [Google Scholar] [CrossRef]
  34. Luo, Guo Ying. 2002. Mutual fund fee-setting, market structure and mark-ups. Economica 69: 245–71. [Google Scholar]
  35. Luo, Xueming. 2003. Evaluating the profitability and marketability efficiency of large banks. An application of data envelopment analysis, Journal of Business Research 56: 627–35. [Google Scholar] [CrossRef]
  36. Morey, Mattew R., and Richard C. Morey. 1999. Mutual fund performance appraisals: amulti-horizon perspective with endogenous benchmarking. Omega 27: 241–58. [Google Scholar] [CrossRef]
  37. Murthi, B. P. S., Yoon K. Choi, and Preyas Desai. 1997. Efficiency of mutual funds and portfolio performance measurement: A non-parametric approach. European Journal of Operational Research 98: 408–18. [Google Scholar] [CrossRef]
  38. O’Connor, Fergal A., Brian M. Lucey, Jonathan A. Batten, and Dirk G. Baur. 2015. The financial economics of gold—A survey. International Review of Financial Analysis 41: 186–205. [Google Scholar] [CrossRef]
  39. Otero, Luis A., and Juan C. Reboredo. 2018. The performance of precious-metal mutual funds: Does uncertainty matter? International Review of Financial Analysis 57: 13–22. [Google Scholar] [CrossRef]
  40. Öztek, Mehmet F., and Nadir Öcal. 2017. Financial crises and the nature of correlation between commodity and stock markets. International Review of Economics and Finance 48: 56–68. [Google Scholar] [CrossRef]
  41. Pierdzioch, Christian, Marian Risse, and Sebastian Rohloff. 2016. Are precious metals a hedge against exchange-rate movements? An empirical exploration using bayesian additive regression trees. The North American Journal of Economics and Finance 38: 27–38. [Google Scholar] [CrossRef]
  42. Piñeiro-Chousa, Juan, M. Ángeles López-Cabarcos, Ada M. Pérez-Pico, and Belen Ribeiro-Navarrete. 2018. Does social network sentiment influence the relationship between the S&P 500 and gold returns? International Review of Financial Analysis 57: 57–64. [Google Scholar]
  43. Premachandra, Inguruwatt M., Joe Zhu, John Watson, and Don U.A. Galagedera. 2012. Best performing US mutual fund families from 1993 to 2008: Evidence from a novel two-stage DEA model for -efficiency decomposition. Journal of Banking Finance 36: 3302–17. [Google Scholar] [CrossRef]
  44. Premachandra, Inguruwatt M., Joe Zhu, John Watson, and Don U.A. Galagedera. 2016. Mutual Fund Industry Performance: A Network Data Envelopment Analysis Approach. In Data Envelopment Analysis: A Handbook of Empirical Studies and Applications. Edited by Joe Zhu. New York: Springer, pp. 165–228. [Google Scholar]
  45. Qadan, Mahmoud. 2019. Risk appetite and the prices of precious metals. Resources Policy 62: 136–53. [Google Scholar] [CrossRef]
  46. Rehman, Mobeen Ur., Syed Jawad Hussain Shahzad, Gazi Salah Uddin, and Axel Hedstrom. 2018. Precious metal returns and oil shocks: A time varying connectedness approach. Resources Policy 58: 77–89. [Google Scholar] [CrossRef]
  47. Salisu, Afees, Umar Ndako, and Tirimisiyu Oloko. 2019. Assessing the inflation hedging of gold and palladium in OECD countries. Resources Policy 62: 357–77. [Google Scholar] [CrossRef]
  48. Sánchez-González, Carlos, Jose Luis Sarto, and Luis Vicente. 2017. The efficiency of mutual fund companies: Evidence from an innovative network SBM approach. OMEGA, The International Journal of Management Science 71: 114–28. [Google Scholar] [CrossRef]
  49. Sekhar, G. V. Sekhar. 2017. The Management of Mutual Funds. Cham: Palgrave Macmillan. [Google Scholar]
  50. Sharpe, William F. 1964. Capital asset prices: A theory of market equilibrium under conditions of risk. Journal of Finance 19: 425–42. [Google Scholar]
  51. Szmigiera, M. 2019. Mutual Funds—Statistics and Facts. Available online: https://www.statista.com/topics/1441/mutual-funds/ (accessed on 24 November 2019).
  52. Talbi, Marwa, Christian de Peretti, and Lotfi Belkacem. 2020. Dynamics and causality in distribution between spot and future precious metals: A copula approach. Resources Policy 66: 101645. [Google Scholar] [CrossRef]
  53. Tarnaud, Albane Christine, and Heleu Leleu. 2018. Portfolio analysis with DEA: Prior to choosing a model. OMEGA, The International Journal of Management Science 75: 57–76. [Google Scholar] [CrossRef] [Green Version]
  54. Thanassoulis, Emmanuel. 2001. Introduction to the Theory and Application of Data Envelopment Analysis: A Foundation Text with Integrated Software. Dordrecht: Kluwer Academic Publishers. [Google Scholar]
  55. Tsolas, Ioannis E. 2014. Precious metal mutual fund performance appraisal using DEA modeling. Resources Policy 39: 54–60. [Google Scholar] [CrossRef]
  56. Tsolas, Ioannis E. 2015. Firm credit risk evaluation: A series two-stage DEA modeling framework. Annals of Operations Research 233: 483–500. [Google Scholar] [CrossRef]
  57. Tuzcu, Sevgi E., and Emrah Ertugay. 2020. Is size an input in the mutual fund performance evaluation with DEA? Eurasian Economic Review. [Google Scholar] [CrossRef]
  58. U.S. General Accounting Office (GAO). 2000. Mutual Fund Fees: Additional Disclosure Could Encourage Price Competition. Washington, DC: GAO. [Google Scholar]
  59. Vigne, Samuel A., Brian M. Lucey, Fergal A. O’Connor, and Larisa Yarovaya. 2017. The financial economics of white precious metals—A survey. International Review of Financial Analysis 52: 292–308. [Google Scholar] [CrossRef] [Green Version]
  60. Zhou, Zhongbao, Qianyin Jin, Helu Xiao, Qian Wu, and Wenbin Liu. 2018. Estimation of cardinality constrained portfolio efficiency via segmented DEA. OMEGA, The International Journal of Management Science 76: 28–37. [Google Scholar] [CrossRef]
Figure 1. Operational and portfolio management efficiency of sampled precious metal mutual funds (PMMFs).
Jrfm 13 00087 g001
Figure 2. Operational management vs. portfolio management efficiency of sampled PMMFs.
Jrfm 13 00087 g002
Table 1. Descriptive statistics of PMMFs data used in the assessments.
Descriptive StatisticsManagement Expenses, US$ MillionNAV, US$ Million3y-Standard Deviation (%) Frond Load and Deferred Load (%)3y-Returns (%)
Min1.61147.0225.720.00−21.52%
Max28.222250.0032.065.75−12.50%
Mean 9.05698.7029.851.90−17.15%
Median6.21496.4629.711.00−17.08%
Standard deviation7.07491.641.492.382.44%
Number of funds: 50.
Table 2. Two-stage series data envelopment analysis (DEA) structure. Mean (standard deviation), median, Min, Max values of efficiency measures, number and percentage of efficient funds.
Two-Stage DEA-Based PerformanceMin Max MeanMedian Standard DeviationEfficient Funds, Number (%)
Operational management efficiency (%)14.90100.0043.6436.8023.994 (8)
Portfolio management efficiency (%)82.86100.0096.20100.005.8027 (54)
Table 3. Single DEA structure. Mean (standard deviation), median, Min, Max values of efficiency measures, number and percentage of efficient funds.
Single DEA-Based PerformanceMin Max MeanMedian Standard DeviationEfficient Funds, Number (%)
Single DEA efficiency (%)80.25100.0092.8294.937.6025 (50)

