Article

Assessment of Bankruptcy Risk of Large Companies: European Countries Evolution Analysis

by
Nicoleta Bărbuță-Mișu
1,* and
Mara Madaleno
2
1
Department of Business Administration, “Dunarea de Jos” University of Galati, 800008 Galati, Romania
2
GOVCOPP—Research Unit in Governance, Competitiveness and Public Policy, Department of Economics, Management, Industrial Engineering and Tourism (DEGEIT), University of Aveiro, 3810-193 Aveiro, Portugal
*
Author to whom correspondence should be addressed.
J. Risk Financial Manag. 2020, 13(3), 58; https://doi.org/10.3390/jrfm13030058
Submission received: 27 January 2020 / Revised: 14 March 2020 / Accepted: 15 March 2020 / Published: 18 March 2020
(This article belongs to the Special Issue Modern Methods of Bankruptcy Prediction)

Abstract

:
Assessment and estimation of bankruptcy risk is important for managers in decision making for improving a firm’s financial performance, but also important for investors that consider it prior to making investment decision in equity or bonds, creditors and company itself. The aim of this paper is to improve the knowledge of bankruptcy prediction of companies and to analyse the predictive capacity of factor analysis using as basis the discriminant analysis and the following five models for assessing bankruptcy risk: Altman, Conan and Holder, Tafler, Springate and Zmijewski. Stata software was used for studying the effect of performance over risk and bankruptcy scores were obtained by year of analysis and country. Data used for non-financial large companies from European Union were provided by Amadeus database for the period 2006–2015. In order to analyse the effects of risk score over firm performance, we have applied a dynamic panel-data estimation model, with Generalized Method of Moments (GMM) estimators to regress firm performance indicator over risk by year and we have used Tobit models to infer about the influence of company performance measures over general bankruptcy risk scores. The results show that the Principal Component Analysis (PCA) used to build a bankruptcy risk scored based on discriminant analysis indices is effective for determining the influence of corporate performance over risk.

1. Introduction

Bankruptcy and bankruptcy prediction is a very real issue worldwide both in academic research and in practice considering the evolution at a global level: the upward trend in business insolvencies continued in 2018 (increase by 10% in 2018 compared to 2017), mainly due to the surge in China by 60% and, to a lesser extent, an increase in Western Europe by 2% (Euler Hermes 2019).
In Western Europe, although a downside trend in insolvencies was recorded from 2014 to 2017, the increase mentioned by 2% in 2018 compared to 2017 was determined by different evolution by other countries: a noticeable upturn of 12% in the UK due to the Brexit-related uncertainties that added headwinds on businesses; a stabilization of insolvencies can be seen in France, Spain and Belgium, although in France in 2018, 54,751 companies went bankrupt, corresponding to a fairly high 1.3% of the active business universe (Dun and Bradstreet 2019); an increase in the Nordic countries of 10% in Sweden, 3% in Norway, 19% in Finland and 25% in Denmark. This trend comes from economic and fiscal reasons or exceptional factors, especially for Denmark and Finland. At the same time, other countries of the region registered slower declines in 2018 compared to 2017, notably the Netherlands (from −23% to −6%), Portugal (−12%), Ireland (−10%) and Germany (−4%). In Italy, 11,207 companies filed for bankruptcy in 2018, down by a significant 5.8%, but the newly-elected populist government is likely to embark on a series of populist policies that are at odds with improving the country’s operating environment (Dun and Bradstreet 2019).
According to Euler Hermes (2019), in Central and Eastern Europe, we can see economies that forecast to moderate in line with the slowdown in the Eurozone, but remain robust enough to see another decrease in insolvencies, albeit at more limited time, i.e., Hungary from −18% in 2018 to −11% in 2019 and the Czech Republic, respectively −17% and −10%. Romania registered a rebound in insolvencies, −3% in 2018 and +3% in 2019. Other countries continued to rise in insolvencies: 3% for Bulgaria in 2019 where the changes in the Insolvency law done in 2017 kept on boosting the bankruptcies of sole proprietorships, Slovakia of 16%, Poland of 5% where businesses have a structural problem of profitability and will face a noticeable deceleration of the economy.
Over time, researchers have tried to find diverse methods to estimate business failure: patrimonial method based on net working capital and treasury; financial ratios method especially based on individual analysis of profitability, liquidity, solvency and financial autonomy; and score method highlighted in numerous models for which Altman (1968), Ohlson (1980), and Zmijewski (1984) models are the most cited ones and that are based on accounting variables (Avenhuis 2013). These bankruptcy prediction models use different explanatory variables and statistical techniques and may provide valuable information about the financial performance of the companies and their risks. More than that, we must mention that the predictive power of these bankruptcy prediction models differ between countries, sectors of activity, time periods, firms’ ages, or firms’ sizes.
There is a constant effort to use the models developed for firms in different economies, even if decision makers know or at least should know that assumptions used for fitting the original models are probably not valid anymore. There is a continuous concern and preoccupation for designing models for prediction risk of bankruptcy. Assessing of the level of advancement of bankruptcy prediction research in countries of the former Eastern Bloc, in comparison to the latest global research trends in this area, Prusak (2018) found that the most advanced research in this area is conducted in the Czech Republic, Poland, Slovakia, Estonia, Russia, and Hungary. In addition, the best world practices are reflected in the research provided in Poland, the Czech Republic, and Slovakia.
The main problem of the bankruptcy prediction models developed in the literature is that these models cannot be generalized because these were developed using a specific sample from a specific sector, specific time period and from a specific region or country. As the above-mentioned statistics show, there are many other specific factors that increase the bankruptcies in a country: changes in economic environments, law frameworks, incomparability of populations of interest, etc. (Král’ et al. 2016). That is why it is necessary to adapt these models to the specificity of the sector, country or time period analyzed and to use combined techniques of estimation in designing these specific models.
In this paper, considering the context presented, the large companies from the European Union are analysed. The aim of this research is twofold: to improve the knowledge of bankruptcy prediction for European large companies and to analyse the predictive capacity of factor analysis, such as Principal Component Analysis (PCA) using as a basis the discriminant analysis (models for assessing bankruptcy risk, commonly used in the literature). Our paper is distinguishing from other studies by using a sample of large companies active in the EU-28 countries in the period 2006–2015 and by own original selection of bankruptcy prediction models (Altman, Conan and Holder, Tafler, Springate and Zmijewski) used in the PCA analysis.
The rest of the paper is organised as follows: in Section 2, the literature review on risk, bankruptcy prediction, models and techniques used to assess and forecast the risk of bankruptcy is presented. The data and methodology are presented in the Section 3. The paper then follows with analysis of results and discussions in Section 4. Concluding remarks pointing out some policy implications, future research suggestions and limitations of the study are discussed in the Section 5.

2. Literature Review

Financial risks show the possibility of losses arising from the failure to achieve financial objectives. The financial risks related to the financial operation of a business may take many different forms: market risks determined by the changes in commodities, stocks and other financial instruments prices, foreign exchange risks, interest rate risks, credit risks, financing risks, liquidity risks, cash flow risk, and bankruptcy risk. These financial risks are not necessarily independent of each other, the interdependence being recognized when managers are designing risk management systems (Woods and Dowd 2008). The importance of these risks will vary from one firm to another, in function of the sector of activity of the firms, the firm size, development of international transactions, etc.
Bankruptcy refers to the situation in which the debtor company becomes unable to repay its debts and can be considered to be the consequence of a company’s inability to survive market competition, reflected in terms of job losses, the destruction of assets, and in a low productivity (Aleksanyan and Huiban 2016). The risk of bankruptcy or insolvency risk shows the possibility that a company will be unable to meet its debt obligations, respectively the probability of a company to go bankrupt in the next few years. Assessing of bankruptcy risk is important especially for investors in making equity or bond investment decisions, but also for managers in financial decision making of funding, investments and distribution policy. Failure prediction models are important tools also for bankers, rating agencies, and even distressed firms themselves (Altman et al. 2017).
The essential information for executive financial decisions, but also for investors decisions are provided by financial statements. Thus, companies’ financial managers should develop the financial performance analysis and problem-solving skills (Burns and Balvinsdottir 2005; Scapens 2006), without limiting their duties in verifying accounting data (Diakomihalis 2012) in order to maintain the firm attractive for investors. The image of financial performance of companies is affected by the estimation of its position in front of investors, creditors, and stakeholders (Ryu and Jang 2004). For this estimation there are used many indicators that reflect the company’s position such as: net working capital, net treasury, liquidity, solvency, profitability, funding capacity, cash-flow, etc., or a mix between them, such as Z-scores.
The design of reliable models to predict bankruptcy is crucial for many decision-making processes (Ouenniche and Tone 2017). The approach used for bankruptcy prediction has evolved over time starting to Beaver (1966, 1968) model based on univariate analysis for selected ratios and which had very good predictive power. Then, Altman (1968) made strides by developing a multiple discriminant analysis model called the Z-Score model. Bankruptcy prediction models could be divided into two general categories depending on the type of variable used: static models (Altman 1968, 2000, 2002; Taffler 1982, 1983, 1984; Ohlson 1980; Zmijewski 1984; Theodossiou 1991) or dynamic models (Shumway 2001; Hillegeist et al. 2004).
In the literature of bankruptcy prediction, the models of Altman (1968), Ohlson (1980), and Zmijewski (1984) are the most cited ones that are based on accounting variables. These bankruptcy prediction models use different explanatory variables and statistical techniques. Therefore, the predictive power of these bankruptcy prediction models differs. However, when the original statistical techniques are used, the accuracy rates for the models of Altman (1968), Ohlson (1980), and Zmijewski (1984) are respectively 80.6%, 93.8%, and 95.3% (Avenhuis 2013). Studying the efficacy of Altman’s z-score model in predicting bankruptcy of specialty retail firms doing business in contemporary times, Chaitanya (2005) found that all but two of the bankruptcies (94%) would have been accurately predicted.
Ashraf et al. (2019) found that both models by Altman (1968) and Zmijewski (1984) are still valuable for predicting the financial distress of emerging markets and can be used by businessmen, financial specialists, administrators, and other concerned parties who are thinking about investing in an organization and/or want to enhance their organization performance. Elviani et al. (2020) studied the accuracy of the Altman (1968), Ohlson (1980), Springate (1978) and Zmijewski (1984) models in bankruptcy predicting trade sector companies in Indonesia using binary logistic regression. Their results proved that the most appropriate and accurate models in predicting bankruptcy of trade sector companies in Indonesia are the Springate and Altman models.
Related to methodologies used in creating bankruptcy risk models we can mention bankruptcy prediction models based on: statistical methodologies (Models of Altman 1968, 2000, 2002; Altman et al. 2017; Model of Springate 1978; Model of Conan and Holder 1979; Models of Taffler 1982, 1983, 1984; Model of Fulmer et al. 1984), stochastic methodologies (Model of Ohlson 1980; Model of Zmijewski 1984; Model of Zavgren 1985; Theodossiou 1991), and artificial intelligence methodologies (Zhang et al. 1999; Kim and Han 2003; Shin et al. 2005; Li and Sun 2011) and data envelopment analysis (DEA) methodologies (Koh and Tan 1999; Cielen et al. 2004; Paradi et al. 2004; Shetty et al. 2012; Ouenniche and Tone 2017). Aziz and Dar (2006) reviewed 89 studies on the prediction of bankruptcy risk in the period 1968–2003 in order to carry out a critical analysis of the methodologies and empirical findings of the application of these models across 10 different countries (Finland, Norway, Sweden, Belgium, UK, Italy, Greece, USA, Korea and Australia). They found that the multi-variable models (Z-Score) and logit were most popular in the 89 papers studied.
The multitude of models created demonstrate an intense concern for bankruptcy prediction, considering also the evolution of number of bankruptcies in the world. However, the first bankruptcy models are still applied and provide important information. For example, Altman’s model was applied to Jordanian companies, non-financial service and industrial companies, for the years 1990–2006. The study shows that Altman’s model has an advantage in company bankruptcy prediction, with a 93.8% average predictive ability of the five years prior to the liquidation incident (Alkhatib and Bzour 2011). Chung et al. (2008) also examined the insolvency predictive ability of different financial ratios for ten failed financial companies during 2006–2007 in New Zealand and found that, one year prior to failure, four of the five Altman (1968) ratios were superior to other financial ratios for predicting corporate bankruptcy. In other countries, such as Romania aggregate indexes of financial performance assessment for the building sector companies were created (Bărbuţă-Mişu 2009; Bărbuță-Mișu and Codreanu 2014) or well-known modes, such as the Conan and Holder model were adjusted to the specificity of Romanian companies (Bărbuţă-Mişu and Stroe 2010). In studies about bankruptcy prediction, in Romania was preferred Conan and Holder (1979) model to evaluate the financial performance of the companies.
The majority of authors proposed models adapted to the specificity of the economies. Brédart (2014) developed an econometric forecasting model on United States companies using three simple and a few correlated and easily available financial ratios as explanatory variables and their results show a prediction accuracy of more than 80%. Dakovic et al. (2010) developed statistical models for bankruptcy prediction of Norwegian firms acting in the industry sector. They modelled the unobserved heterogeneity among different sectors through an industry-specific random factor in the generalized linear mixed model. The models developed are shown to outperform the model with Altman’s variables.
To solve the problem of bankruptcy prediction some statistical techniques such as regression analysis and logistic regression are used (De 2014). These techniques usually are used for the company’s financial data to predict the financial state of company as healthy, distressed, high probability of bankruptcy. As we know, Altman (1968) used financial ratios and multiple discriminant analysis (MDA) to predict financially distressed companies. However, further, it was found that the usage of statistical techniques or MDA depends on the constraint as linear separability, multivariate normality and independence of predictive variables (Ohlson 1980; Karels and Prakash 1987). Thus, bankruptcy prediction problem can be solved using various other types of classifiers, such as neural network that compared to MDA, logistic regression and k-nearest neighbour method proved a higher performance. For instance, Tam (1991) found that the neural network performs better than other prediction techniques.
Otherwise, Xu and Zhang (2009) have investigated whether the bankruptcy of certain companies can be predicted using traditional measures, such as Altman’s Z-score, Ohlson’s (1980) O-score, and the option pricing theory-based distance-to-default, previously developed for the U.S. market, in order to find if these models are useful for the Japanese market. They have found that the predictive power is substantially enhanced when these measures are combined.
In addition, Jouzbarkand et al. (2013) compiled two models for the prediction of bankruptcy, related to the Iranian economic situation. Using the logistic regression method, they studied the Ohlson (1980) and Shirata (1995) models, examining and comparing the performance of these models. Their results show that models created are able to predict the bankruptcy. For classifying and ranking the companies, they used their business law to determine the bankrupt companies and a simple Q-Tobin to specify the solvent companies.
Discriminant analysis was the prevailing method, and the most important financial ratios came from the solvency category, with profitability ratios also being important (Altman et al. 2017). The performance of five bankruptcy prediction models, such as Altman (1968), Ohlson (1980), Zmijewski (1984), Shumway (2001) and Hillegeist et al. (2004) was studied by Wu et al. (2010) building their own integrated model using a dataset for U.S.A. listed firms. Wu et al. (2010) found that Shumway’s (2001) model performed best, Hillegeist et al.’s (2004) model performed adequately, Ohlson’s (1980) and Zmijewski’s (1984) models performed adequately, but their performance deteriorated over time, while Altman’s Zscore performed poorly compared with all other four models analysed. However, the integrated model outperformed the other models by combining both accounting and market data, and firms’ characteristics.
The factor analysis is often used together with other methodologies, in order to improve bankruptcy prediction models (Cultrera et al. 2017). Principal Component Analysis (PCA), the statistical procedure that uses an orthogonal transformation to convert a set of observations of possibly correlated variables into a set of values of linearly uncorrelated variables called principal components started to be used in analysis and prediction of bankruptcy risk. Adalessossi (2015) used discriminant function named Z-scores model of Altman, financial ratio analysis, and the principal component analysis on a sample of 34 listed companies from different sectors and sizes in order to find out if the three methods used in this study converge toward similarity results. The comparison of the three methods indicates unanimously that, out of the 34 companies, only eight companies have had the best financial performances and are not likely to go on to bankruptcy.
Onofrei and Lupu (2014) have built a quick warning model for the Romanian companies in difficulty, using the following methodologies: the Principal Components Analysis, the multivariate discriminant analysis and the logit analysis in order to determine which are the best predictors of bankruptcy for the Romanian companies. They found that the best predictor for the Romanian market is the multiple discriminant analysis method with a predictive power between 68–95%, while the logit method registering slightly weaker results with a predictive power between 53–82%.
De (2014) developed the principal component analysis (PCA) and general regression auto associative neural network (GRAANN) based hybrid as a one-class classifier in order to test the effectiveness of PCA-GRAANN on bankruptcy prediction datasets of banks from Spain, Turkey, US and UK. They concluded that PCA-GRAANN can be used as a viable alternative for any one-class classifier. Checking related literature, we found that PCA is more used with artificial neural network methods for prediction bankruptcy risk where the effectiveness was proved. However, in this paper we proposed to use PCA based on the five discriminant analysis measures, i.e., Z-score determined by the following models: revised Z-score Altman, Conan and Holder, Tafler, Springate and Zmijewski in order to test the efficiency in predicting the risk of bankruptcy. Afterwards, we made use of econometric techniques and the PCA score created by country and year to test its influence over performance. The principal component analysis to build the bankruptcy risk score of the five models selected is used, since there is no consensus in the literature so as to which is the best bankruptcy prediction model. In this way we may capture the components that will exert more impact in bankruptcy prediction.

3. Data and Methodology

In this section we describe the data and all methodologies used to assess bankruptcy risk, as well as to create the bankruptcy risk indexes by year and country that are presented in the results section. It starts by describing the models used to assess bankruptcy risk measures, which are commonly used in the literature and afterwards describes the Principal Component Analysis (PCA) used to create the bankruptcy risk index measures by year and country (by country, Greece had to be taken out from the sample due to missing data able to allow us to create the index for this country).

3.1. Data Description

The source of the data is Amadeus database, provided by Bureau van Dijk Electronics. In the sample we have included only large non-financial companies from the former EU-28 countries, for the period 2006–2015, that act in all sectors of activity (with the conclusion of the Brexit, the EU is now with 27 countries, instead of 28. However, UK was used because at the beginning of the analysis it belonged to the EU-28 and we will keep this representation through the article). The selection criteria for large companies included in the sample are in accordance with the classification of the small and medium enterprises (SMEs) published in Commission Recommendation of 6 May 2003 (European Commission 2003) concerning the definition of micro, small and medium-sized enterprises. Thus, in order to select the large companies for EU-28 countries, as selection criteria of these companies we used: number of employees greater than 250, total assets greater than €43 million and turnover greater than €50 million. These criteria were applied simultaneously for the data available for the last year included in the sample, i.e., year 2015. We found 22,581 active large companies. We did not consider small and medium enterprises (SMEs) due to the high fluctuations over time in foundation and closing of these firms compared to large companies. Our intention was to study the risk of bankruptcy to large companies that had a more stable activity over time. Our data period was from 2006 until 2015.
Where it was applicable, because of some data missing, we deleted data for years and companies with no available information for calculation of variables of risk of bankruptcy models. In addition, we eliminated from database the inconclusive values and outliers. Thus, remained in the study 154,459 valid year-observations. However, we still worked with an unbalanced panel, due to missing years of data in the sample. Additionally, we have taken out from our sample all countries which did not present a number of companies higher than 1000. From the 28 available countries we ended up working with 20 of these countries.

3.2. Models for Assessing Bankruptcy Risk

As we mentioned in the literature review, there are numerous models for bankruptcy risk prediction based on Z score method, but in this paper we selected the following five models: Altman’s Models (1968, 2000), Conan and Holder Model (1979), Springate’s Model (1978), Taffler’s Model (1982, 1983), Zmijewski’s Model (1984). We used these five models since these are the most referenced one’s to predict bankruptcy and have a high level of accuracy as we presented in the Section 2. There are a number of key models that have been developed by various authors and presented in the bankruptcy prediction literature over the last three decades, but these five appear in most of the recent studies where bankruptcy models are tested. For these models we determined all variables necessary and the Z scores for all companies included in the sample for the period 2006–2015.

3.2.1. Altman’s Models

Altman (1968) is the dean of insolvency prediction models and the first researcher that successfully used the step-wise multiple discriminate analysis to develop a prediction model with a high degree of accuracy of 95%. The original study included a sample comprising 66 industrial companies, 33 bankrupts and other 33 non-bankrupts for a period of analysis of 20 years (1946–1965).
The author found a total of 22 potential variables, based on data provided by annual reports of the companies, and by them, he retains five variables with the highest significance, as a result of using statistical techniques and discrimination analysis. Generally, these variables include profitability ratios, coverage ratios, liquidity ratios, capitalization ratios, and earnings variability (Altman 2000).
The final discriminant function of first Altman model (1968) takes the following form:
Z1 Altman = 0.012 X1 + 0.014 X2 + 0.033 X3 + 0.006 X4 + 0.999 X5
where:
Z1 Altman = Overall Index Altman
X1 = Working Capital/Total Assets
X2 = Retained Earnings/Total Assets
X3 = Earnings Before Interest and Taxes/Total Assets
X4 = Market Value Equity/Book Value of Total Debt
X5 = Sales/Total Assets
Because this original model cannot be applied to unlisted companies in the Stock Exchange, the model was completely re-estimated, substituting the Market Value of Equity with Book Values of Equity in X4 (Altman 2000), resulting the Revised Z-Score Model that is used for our sample.

A Revised Z-Score Model (rza)

This change of the Market Value of Equity determined not only the change of new variable’s parameter, but determined the change of all coefficients, as well as the classification criterion and related cut-off scores.
The results of the revised Z-Score model with a new X4 variable is:
Z2 Altman = 0.717 X1 + 0.847 X2 + 3.107 X3 + 0.420 X4 + 0.998 X5
The description of the variable used is the following:

X1—Working Capital/Total Assets

This ratio is the measure of the net liquid assets of the firm relative to the total capitalization. Working capital is defined as the difference between current assets and current liabilities. Liquidity and size characteristics are explicitly considered in this ratio. Ordinarily, a company experiencing consistent operating losses will have shrinking current assets in relation to total assets.

X2—Retained Earnings/Total Assets

Retained earnings is the account which reports the total amount of reinvested earnings and/or losses of a firm over its entire life. The account is also referred to as earned surplus. Retained earnings may be affected by a substantial reorganization or stock dividend and for this reason, in research studies, some appropriate readjustments should be made to the accounts. In this ratio, the age of the company is considered implicitly. For example, a relatively young company will probably show a low ratio because it had not enough time to build up its cumulative profits. Therefore, it may be argued that a young company is somehow discriminated against in this analysis, and its chance of being classified as bankrupt is relatively higher than another older company. That’s why we have included in our sample only large companies that have a higher chance of remaining on the market. This is precisely the situation manifested in the real world because the incidence of failure is much higher in a company’s earlier years. Those companies with high retained earnings, relative to total assets, have financed their assets through retention of profits and have not utilized as much debt.

X3—Earnings before Interest and Taxes/Total Assets

This ratio is a measure of the true productivity of the company’s assets, independent of any tax or leverage factors. Since a company’s ultimate existence is based on the earning power of its assets, this ratio appears to be particularly appropriate for studies dealing with corporate failure. Furthermore, insolvency in a bankruptcy sense occurs when the total liabilities exceed a fair valuation of the company’s assets with value determined by the earning power of the assets.

X4—Book Value of Equity/Book Value of Total Debt

Equity is measured by the Book Value of Equity divided by Total Debt, debt including both current and long-term. The measure shows how much the firm’s assets can decline in value (measured by book value of equity plus debt) before the liabilities exceed the assets and the company becomes insolvent.

X5—Sales/Total Assets

The capital-turnover ratio is a standard financial ratio illustrating the sales generating ability of the firm’s assets. This ratio is quite important because it is the least significant ratio on an individual basis. Because of its unique relationship to other variables in the model, the Sales/Total Assets ratio ranks second in its contribution to the overall discriminating ability of the model.
The interpretation of the Z2 Altman is:
  • Z2 Altman > 2.9 − Safe zone
  • 1.23 < Z2 Altman < 2.9 − Grey zone
  • Z2 Altman < 1.23 − Distress zone
In order to eliminate industry effects, the next change of the Z-Score model analysed the characteristics and accuracy of the model without variable X5—Sales/Total Assets (Altman 2002). He does this in order to minimize the potential industry effect which is more likely to take place when such an industry-sensitive variable as asset turnover is included. This particular model is also useful within an industry where the type of financing of assets differs greatly among firms and important adjustments, like lease capitalization, are not made (Bărbuţă-Mişu 2017).
In particular, Altman et al. (1998) have applied this enhanced Z Score model to emerging markets corporates, specifically Mexican firms that had issued Eurobonds denominated in US dollars. In the emerging market model, they added a constant term of +3.25 so as to standardize the scores with a score of zero equated to a default rated bond.

3.2.2. Conan and Holder’s Model (zcc)

The Conan and Holder (1979) model was developed to analyse the degradation of the financial situation of small and medium enterprises (SMEs). The appraisals for the proposed score function were based on an initial set of 50 indicators studied by the category: the asset structure, the financial dependence, the treasury, the working fund, the exploitation, the profitability, etc. Then, the formulation and model results are based on the analysis of 31 rates (financial variables), applied on 190 small and medium enterprises acting in various fields: industry, trade, services and transport during 1970–1975. Of the 190 selected companies, 95 companies were bankrupt, and another 95 were healthy businesses whose activities were appropriate waist and bankrupt companies.
The model developed by Conan and Holder is included in the statistical tested methods, and has the advantage of simplifying the calculation, so that it continues to be used today.
The Conan and Holder model is:
Z Conan and Holder = 0.24 X1 + 0.22 X2 + 0.16 X3 − 0.87 X4 − 0.10 X5
where:
Z Conan and Holder = Overall Index Conan and Holder
X1 = Gross Operating Surplus/Total Debts, expresses the profitability by creditors, the profit achieved by using borrowed capital.
X2 = Permanent Capital/Total Liabilities, expresses the solvency of the company on long term, a measure of debt guarantees through permanent capital.
X3 = (Current assets − Stocks)/Total Liabilities, expresses the liquidity of the company, the capacity of paying debts by transforming into cash of receivables, financial short-term investments, cash, and cash equivalents.
X4 = Financial Expenditures/Net Sales, expresses the rate of financial expenses, the share of financial expenses in net sales.
X5 = Personnel Expenditures/Added Value, expresses the rate of personnel costs, i.e., the share of remuneration of the personnel by the added value of the company.
The interpretation of the Z Conan and Holder score function is as follows:
  • Z Conan and Holder < 0.04 − a probability of a bankruptcy risk of >65%;
  • 0.04 < Z Conan and Holder < 0.16 − a probability of bankruptcy between 30–65%;
  • Z Conan and Holder > 0.16 − a probability of bankruptcy of <30%.

3.2.3. Springate’s Model (zs)

This Canadian business insolvency prediction model was developed in 1978 at Simon Fraser University by Gordon L.V. Springate, following procedures developed by Altman in the US data. Springate (1978) used step-wise multiple discriminate analysis to select four out of 19 popular financial ratios that best distinguished between sound business and those that actually failed. This insolvency prediction model achieved an accuracy rate of 92.5% using the 40 companies tested by Springate.
The Springate model takes the following form:
Z Springate = 1.03 X1 + 3.07 X2 + 0.66 X3 + 0.4 X4
Z Springate = Overall Index Springate
X1 = Working Capital/Total Assets measure of the net liquid assets of the firm relative to the total capitalization.
X2 = Earnings Before Interest and Taxes/Total Assets is a measure of the true productivity of the firm’s assets, independent of any tax or leverage factors.
X3 = Earnings before Taxes/Current Liabilities is a measure of the true productivity of the firm’s assets, independent of any leverage factors.
X4 = Sales/Total Assets illustrate the sales generating ability of the firm’s assets. It is one measure of management’s capability in dealing with competitive condition.
The interpretation of Z Springate model is:
  • Z Springate > 0.826, the company is performant;
  • Z Springate <= 0.826, the company is bankrupted.

3.2.4. Taffler’s Model (ztta)

Taffler (1983) proposed a model based on an extensive survey of the vast array of data. The original model was developed to analyse industrial (manufacturing and construction) companies only with separate models developed for retail and service companies. Using computer technology, 80 carefully selected financial ratios were calculated using accounts of all listed industrial companies failing between 1968 and 1976 and 46 randomly selected solvent industrial firms (Agarwal and Taffler 2007).
This information was processed through a series of statistical methods, and the model was built using multivariate discriminant method. The Z-score model was derived by determining the best set of ratios which, when taken together and appropriately weighted, distinguished optimally between the two samples. Leverage, profitability, liquidity, capital adequacy and other parameters were evaluated for model creation. The model is applicable to companies in the form of joint stock companies, whose shares were subject to public offering and traded on various stock exchanges (Belyaeva 2014).
The Z Taffler model is:
Z Taffler = 3.2 + 12.18 X1 + 2.5 X2 − 10.68 X3 + 0.029 X4
where:
Z Taffler = Overall Index Taffler
X1 = Profit before Tax/Current Liabilities is a measure of the true productivity of the firm’s assets, independent of any leverage factors.
X2 = Current Assets/Total Liabilities expresses the payment capacity on short-term of the company, i.e., the ability of current assets to be converted into cash to meet the payment obligations. This ratio estimates the liquidity of the company by showing the company can pay its creditors with its current assets if the company’s assets ever had to be liquidated.
X3 = Current Liabilities/Total Assets shows the share of a company’s assets which are financed through short-term debt. If the ratio is low, most of the company’s assets are financed through equity and long-term debts. If the ratio is high, most of the company’s assets are financed through short-term debt.
X4 = (Quick Assets − Current Liabilities)/Daily Operating Expenses with the denominator proxied by: (Sales − Profit Before Tax − Depreciation)/365
The interpretations of Z Taffler model is as follows:
  • Z Taffler > 0.3 shows that the company has good chances for performance
  • 0.2 < Z Taffler < 0.3 shows the grey zone (undefined area)
  • Z Taffler < 0.2 shows that the company is almost bankrupt.
Thus, in the case of this model, if the computed Z Taffler score is positive, the firm is solvent and is very unlikely indeed to fail within the next year. However, if its Z Taffler score is negative, it lies in the “at risk” region and the firm has a financial profile similar to previously failed businesses. The high probability of financial distress is depending on how much negative is the Z Taffler score (Agarwal and Taffler 2007).

3.2.5. Zmijewski’s Score (zzzmij)

The Zmijewski Score (Zmijewski 1984) is a bankruptcy model used to predict a firm’s bankruptcy in two years. Zmijewski (1984) criticised previous models, considering that other bankruptcy scoring models oversampled distressed firms and favoured situations with more complete data.
Thus, in Zmijewski (1984) study, two methodological issues are examined that are related to the estimation of bankruptcy prediction models. The two biases are choice-based sample biases and sample selection biases. The choice based bias is the result of over-sampling distressed firms. When a matched-pair (one-to-one match) design is for a study to predict bankruptcy, the potential of bankruptcy is overstated. This lead to biased probabilities in the models. The sample selection biases occur when the probability of distress given complete data are significantly different from the probability of distress given incomplete data (Avenhuis 2013).
The ratio used in the Zmijewski (1984) score was determined by probit analysis (probit should be regarded as probability unit) in order to construct the bankruptcy prediction model. Like the logit function, the probit function maps the value between 0 and 1, and, in this case, scores greater than 0.5 represent a higher probability of default. The accuracy rate of the Zmijewski (1984) model for the estimation sample was 99%.
The constructed probit function with the variables and estimated coefficients from the study of Zmijewski (1984) is as follows:
Z Zmijewski = −4.336 − 4.513 X1 + 5.679 X2 + 0.004 X3
where:
Z Zmijewski = Overall Zmijewski Index
X1 = Net Income/Total Assets is a profitability ratio that measures the net income produced by total assets during a period by comparing net income to the average total assets.
X2 = Total Liabilities/Total Assets shows the share of a company’s assets which are financed through debt. If the ratio is less than 0.5, most of the company’s assets are financed through equity. If the ratio is greater than 0.5, most of the company’s assets are financed through debt.
X3 = Current Assets/Current Liabilities expresses the payment capacity on short-term of the company.
While Altman used the ratio Earnings before Interest and Taxes (EBIT)/Total Assets for profitability, where EBIT eliminates the effect of different capital structures and of taxation and make easier the comparing of the firm profitability, Zmijewski (1984) used the ratio: Net Income/Total Assets, thus considering the effects of funding sources used and of the firm taxation.
Zmijewski (1984) classified the companies thus:
(i)
Firms with probabilities greater than or equal to 0.5 were classified as bankrupt or having complete data.
(ii)
Firms with probabilities less than 0.5 were classified as non-bankrupt or having incomplete data.

3.3. Principal Component Analysis

There exist many indicators in financial analysis which allow to assess the risk of bankruptcy of a company (Armeanu et al. 2012; Armeanu and Cioaca 2015; Cultrera et al. 2017; Arroyave 2018; Prusak 2018).
In order to make an appropriate assessment, we need to reduce the number of indicators. A solution is indicated by Armeanu et al. (2012): using Principal Component Analysis (PCA), cluster and discriminant analysis techniques. The authors used these three methods to build a scoring function and afterwards to identify bankrupt companies. Their sample consisted on listed companies on Bucharest Stock Exchange. Heffernan (2005) points that bankruptcy risk predicting models, developed based on discriminant analysis (like Altman and Conan-Holder) can easily mislead. This is due to the fact that they rely on historical data, but also on the fact that the result is binary (either the debtor is solvent or not). However, in the present article we consider the following possible scenarios (Armeanu et al. 2012; Armeanu and Cioaca 2015): delays in monthly repayments, failure to pay them, failure to pay fees or penalty interest, and so on, and that is why we rely on large companies’ data. Discriminant analysis models may not include the state of solvency, insolvency and restructuring at once, and we would like to infer about it using principal component analysis jointly with discriminant analysis. PCA methods are less recognized in the literature to predict bankruptcy risk (Cultrera et al. 2017).
We use PCA based on the five discriminant analysis measures identified previously in Section 3.2. Software Stata is used for studying the effect of performance over risk and bankruptcy scores were obtained by year of analysis and country. Descriptive statistics of this data and Pearson correlation values considering country scores and year scores are presented in tables presented in Section 4.

3.4. Econometric Methodologies

In order to analyse the effects of risk scores over firm performance, we applied a dynamic panel-data estimation model, with GMM estimators to regress earnings before interest and taxes to total assets over risk by year. By doing so in a Generalized Method of Moments (GMM) context, we may construct more efficient estimates of the dynamic panel data model (these models contain one or more lagged dependent variables, allowing for the modelling of a partial adjustment mechanism). In the context of panel data, we usually must deal with unobserved heterogeneity. Static models are (almost) always misspecified, because the within-group error terms are serially correlated, thereby invalidating both point estimates and statistical inference. Conversely, dynamic models tend to be correctly specified, because the dynamics are in the estimated part of the model rather than displaced into the error terms, which invalidates static FE/RE estimation. Dynamic models are much richer in economic content by virtue of being able to distinguish short-run and long-run effects of independent variables on dependent variables.
Additionally, we used Tobit models to infer about the influence of company performance measures over general bankruptcy risk scores. The Tobit model, also called a censored regression model, is designed to estimate linear relationships between variables when there is either left- or right-censoring in the dependent variable. Our dependent variable is censored from both below and above provided we have limited the risk variable to be between −3 and 3, inclusively. Tobit models to predict bankruptcy have also been used by Sigrist and Hirnschall (2019) recently. The assumption of the Tobit model is that there exists a latent variable Y* which follows, conditional on some covariates X a Gaussian distribution: Y | X   ~   N ( F ( X ) , σ 2 ) . The mean F(X) is assumed to depend linearly on the covariates X through F ( X ) = X T β where β is a set of coefficients. This latent variable Y* is observed only if it lies in an interval. Mousavi et al. (2019) used instead of PCA, a DEA model to measure the operational efficiency scores of Japanese companies, in the first step. In the second step, the efficiency score is used as the dependent variable in a Tobit regression to investigate whether corporate governance variables influence the operational efficiency of firms.

4. Results and Discussion

As we presented in the Section 3.1, in this study we used data from European large companies where insolvencies are more present. 
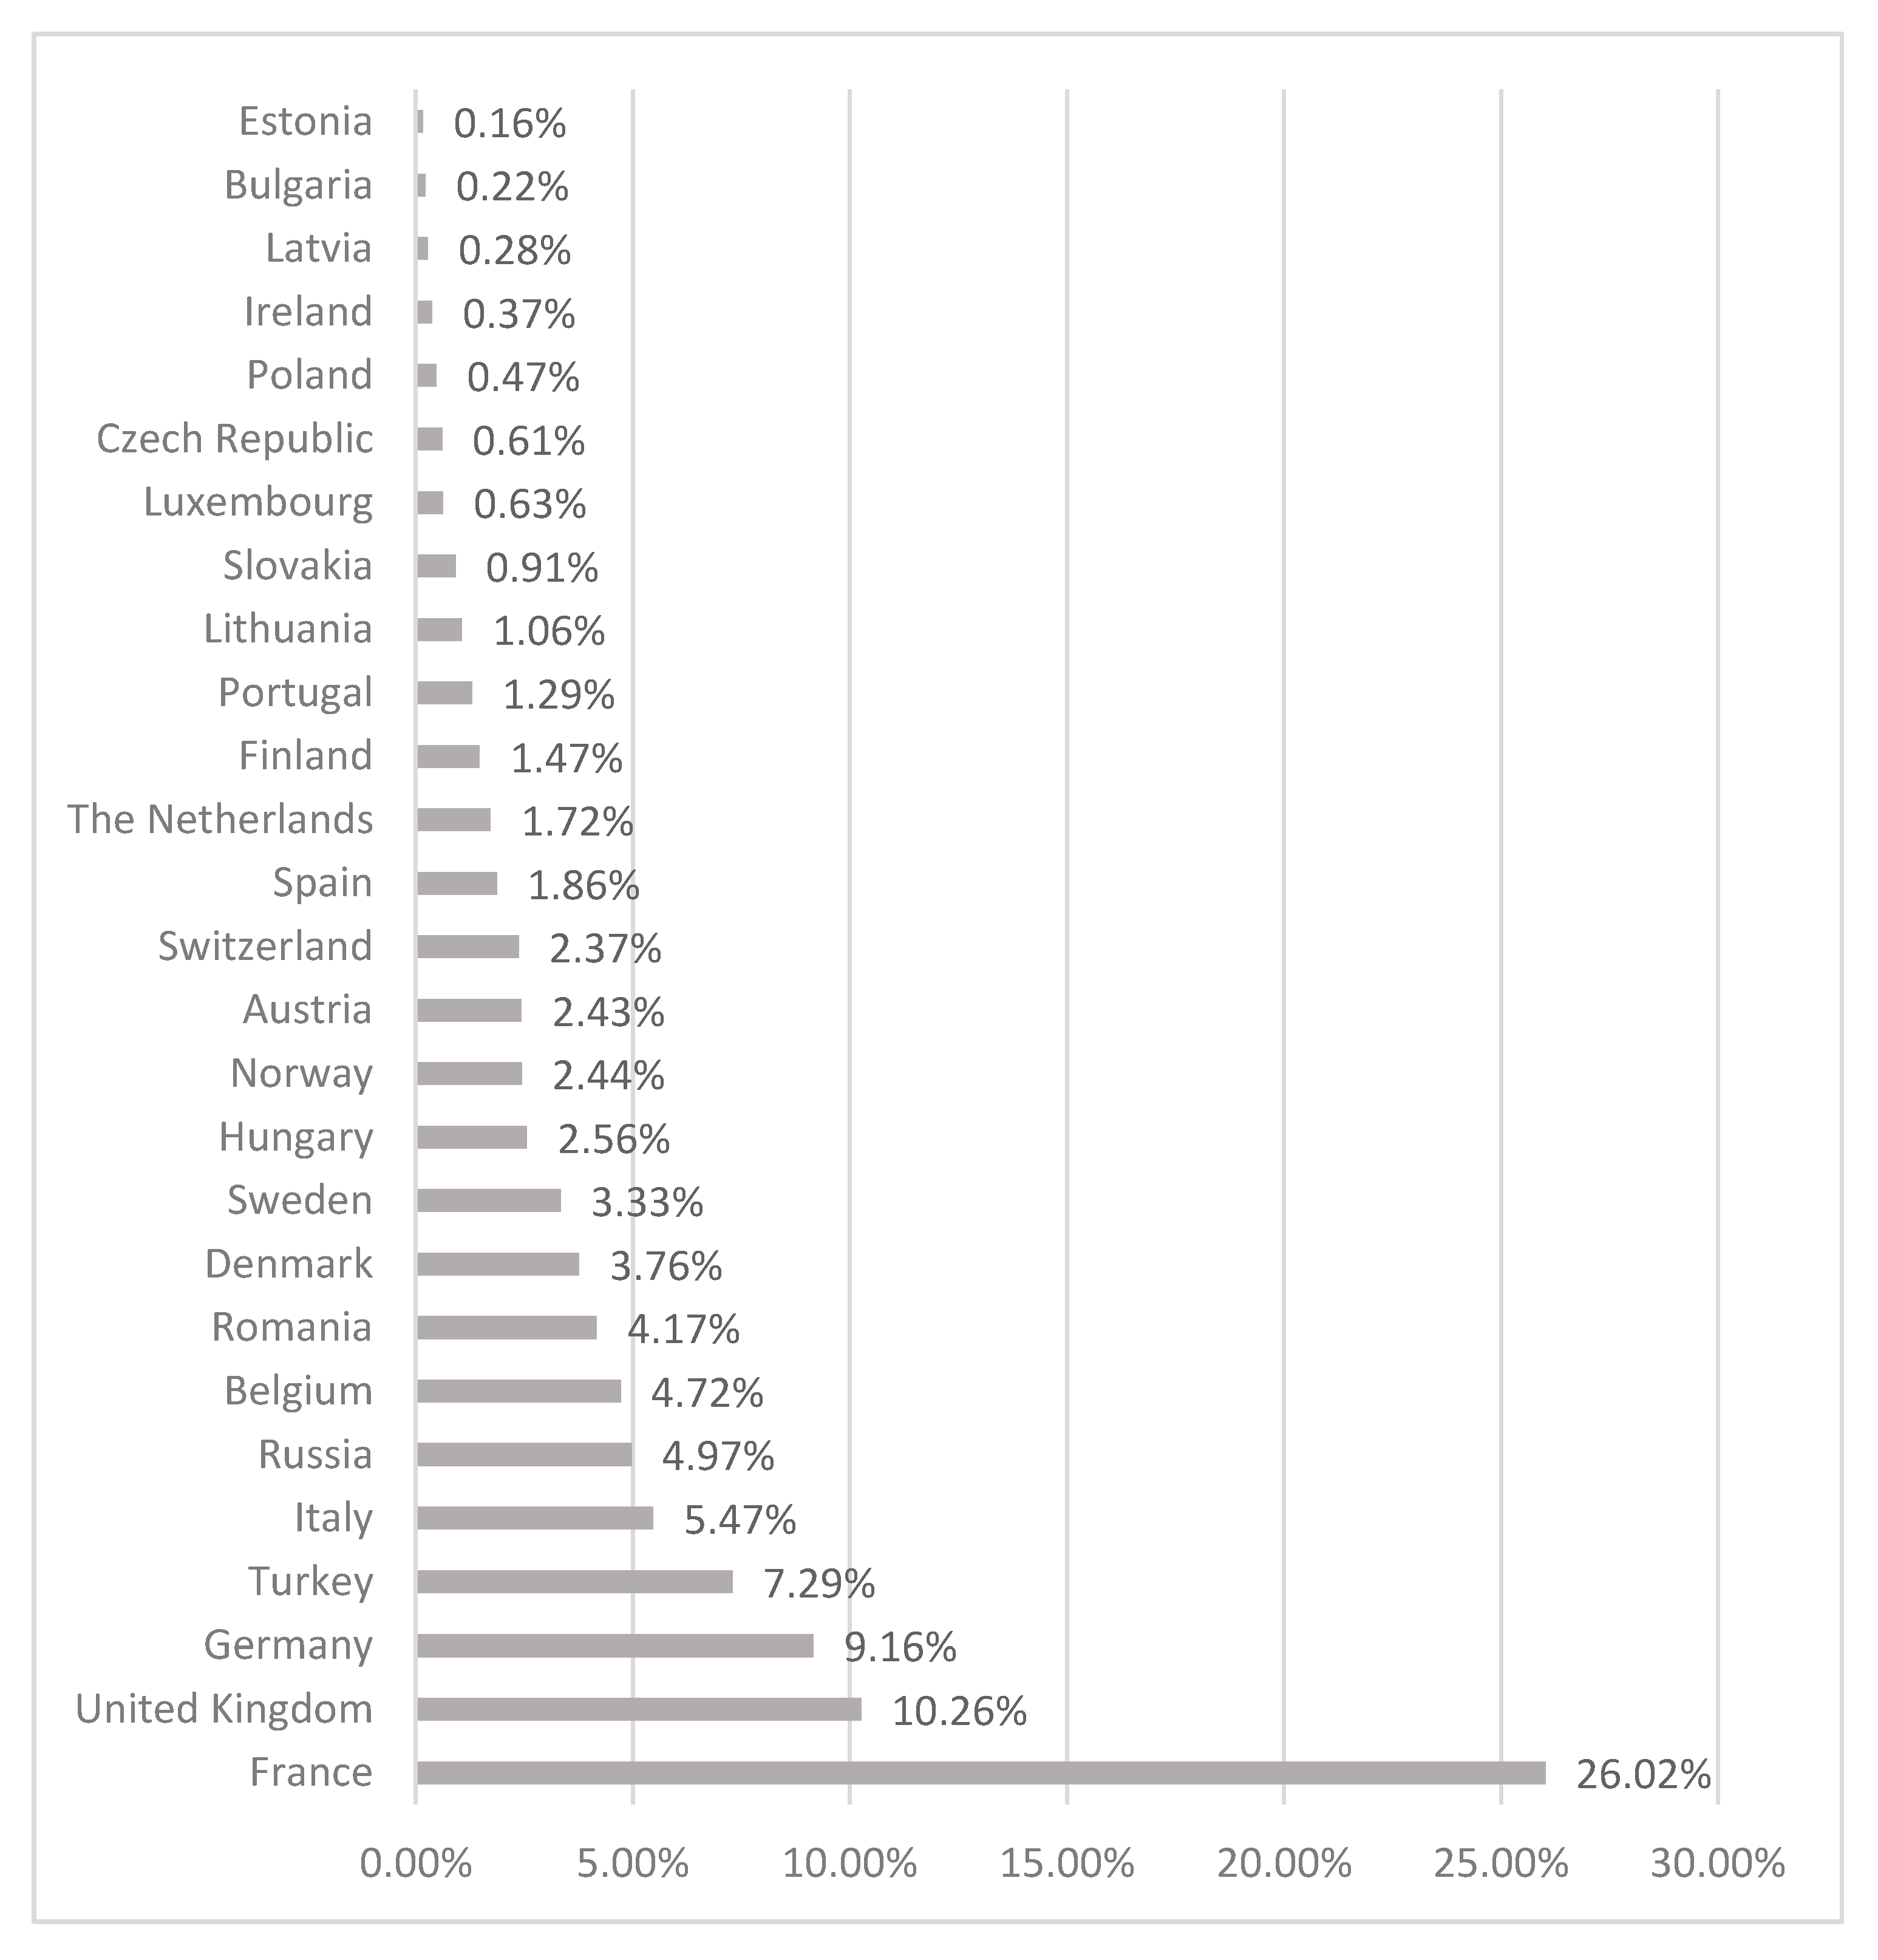
Figure 1 plots the frequency of corporate insolvencies in Europe by country for 2018 (Euler Hermes 2019). We can see that the first place in the frequency of bankruptcies was occupied by France (with 26.02%) corresponding to 54,965 companies bankrupted, followed by United Kingdom with 10.26% frequency corresponding to 21,669 companies bankrupted and 9.16% to Germany with 19,350 companies bankrupted. In our sample we used a great part of these countries. As we are able to observe, among countries with a high number of corporate insolvencies were also Italy, Belgium, Romania, Denmark, Sweden, Hungary, Norway, and Austria. From the countries used in our sample, France, United Kingdom, Germany, Turkey, Italy, Belgium, Romania, Denmark and Sweden were in the top ten of the Frequency of corporate insolvencies in Europe in 2018 (Figure 1).
Table 1 presents the number of companies from EU-28 countries included in the sample. We can observe that a high number of firm-year observations from large companies came from United Kingdom i.e., 28.60% of all observations analysed (also the country with the second number of bankruptcies), followed by Germany with 16.17%, Italy with 11.49%, France with 9.97% and Spain with 7.28%. Related to the number of firm-year observations of large companies by years, we can observe that the highest number of observations was in 2014 (18,513 companies) and 2013 (18,395 companies), respectively 12.02% and 11.94% of the sample analysed.
Table 2 presents the data descriptive statistics for the variables used for calculation of Z score for all five models used. In average, the companies from the sample show a need of exploitation capital of 14% by the total assets, an operational profitability of 6%, a rotation speed of assets 1.48 times per year, a current liquidity by 2.31 showing the capacity to pay debts by converting of assets in cash, the share of financial expenditure of 0.11% by sales, the share of personnel expenses of 69% in value added and a degree of debts of 64% by total assets. In addition, from Table 2 it is visible the disparity of values of mean and standard deviation of the bankruptcy measures. Moreover, the different number of observations considered for both the creation of financial ratios as well as bankruptcy indicators of interest are clearly visible.
Table A1 and Table A2 (at the Appendix A) presents the correlation matrix among the variables used both to produce the bankruptcy risk indicators and the five bankruptcy risk scores. In addition, Table A1 and Table A2 presents the Pearson correlation values and statistical significance. From here it is seen that there are ratios used to produce the bankruptcy indicators which are highly correlated among them, significantly, with negative or positive correlation (i.e., strong positive significant correlation (0.821) between Book Value of Equity/Book Value of Total Debt and Current Assets/Total Liabilities; strong positive significant correlation (0.778) between Book Value of Equity/Book Value of Total Debt and (Current assets − Stocks)/Total Liabilities, almost perfect positive correlation (0.998) between EBIT/Current liabilities and Profit Before Tax/Current Liabilities etc.), but mostly have low to moderate correlation. However, between bankruptcy indicators constructed through discriminant analysis, correlation values are very low, and very close to zero with statistical significance.
Table 3 indicates that after applying PCA, the number of observations decreased as compared to Table 2. In fact, by restricting the sample to all those values obtained for the general risk score greater than 3 or smaller than 3, our sample was reduced to 133,751 firm-year observations. Risk is the score computed through PCA considering all companies, years and countries.
Overall, countries presented higher mean scores as well as negative mean for some countries, and also standard deviation is higher for countries scores. A plot of year bankruptcy risk scores will allow us to see their behaviour along years. Figure 2 presents these data evolution for countries. After the final data treatment, the total number of companies available to analyse by country and year are presented in Table 4.
Correlation values (Table 5) seem to be very strong among Austria and Spain, Croatia, Italy, the Netherlands, Poland and Sweden; strong (higher than 90% and positive; some near perfect linear positive correlation) between Belgium, Czech Republic, Germany, Finland, France, Great Britain, Hungary, Portugal, Romania, and Slovakia; Bulgaria and Ireland; Germany, Finland, France, Great Britain, Hungary, Portugal, Romania, and Slovakia; Spain, Croatia, Italy, the Netherlands, Poland, and Sweden; Finland, France, Great Britain, Hungary, Portugal, Romania, and Slovakia; between France, Great Britain, Hungary, Portugal, Romania and Slovakia; among Great Britain and Hungary, Portugal, Romania, and Slovakia; Croatia, Italy, the Netherlands, Poland, and Sweden; between Hungary, Portugal, Romania, and Slovakia; Italy, Poland, and Sweden; the Netherlands, Poland and Sweden; Between Poland and Sweden; Portugal, Romania, and Slovakia; and finally between Romania and Slovakia. As such, no clear pattern is identified regarding for instant the geographic distance among the countries, but high correlation values maybe due to commercial transactions performed among these countries.
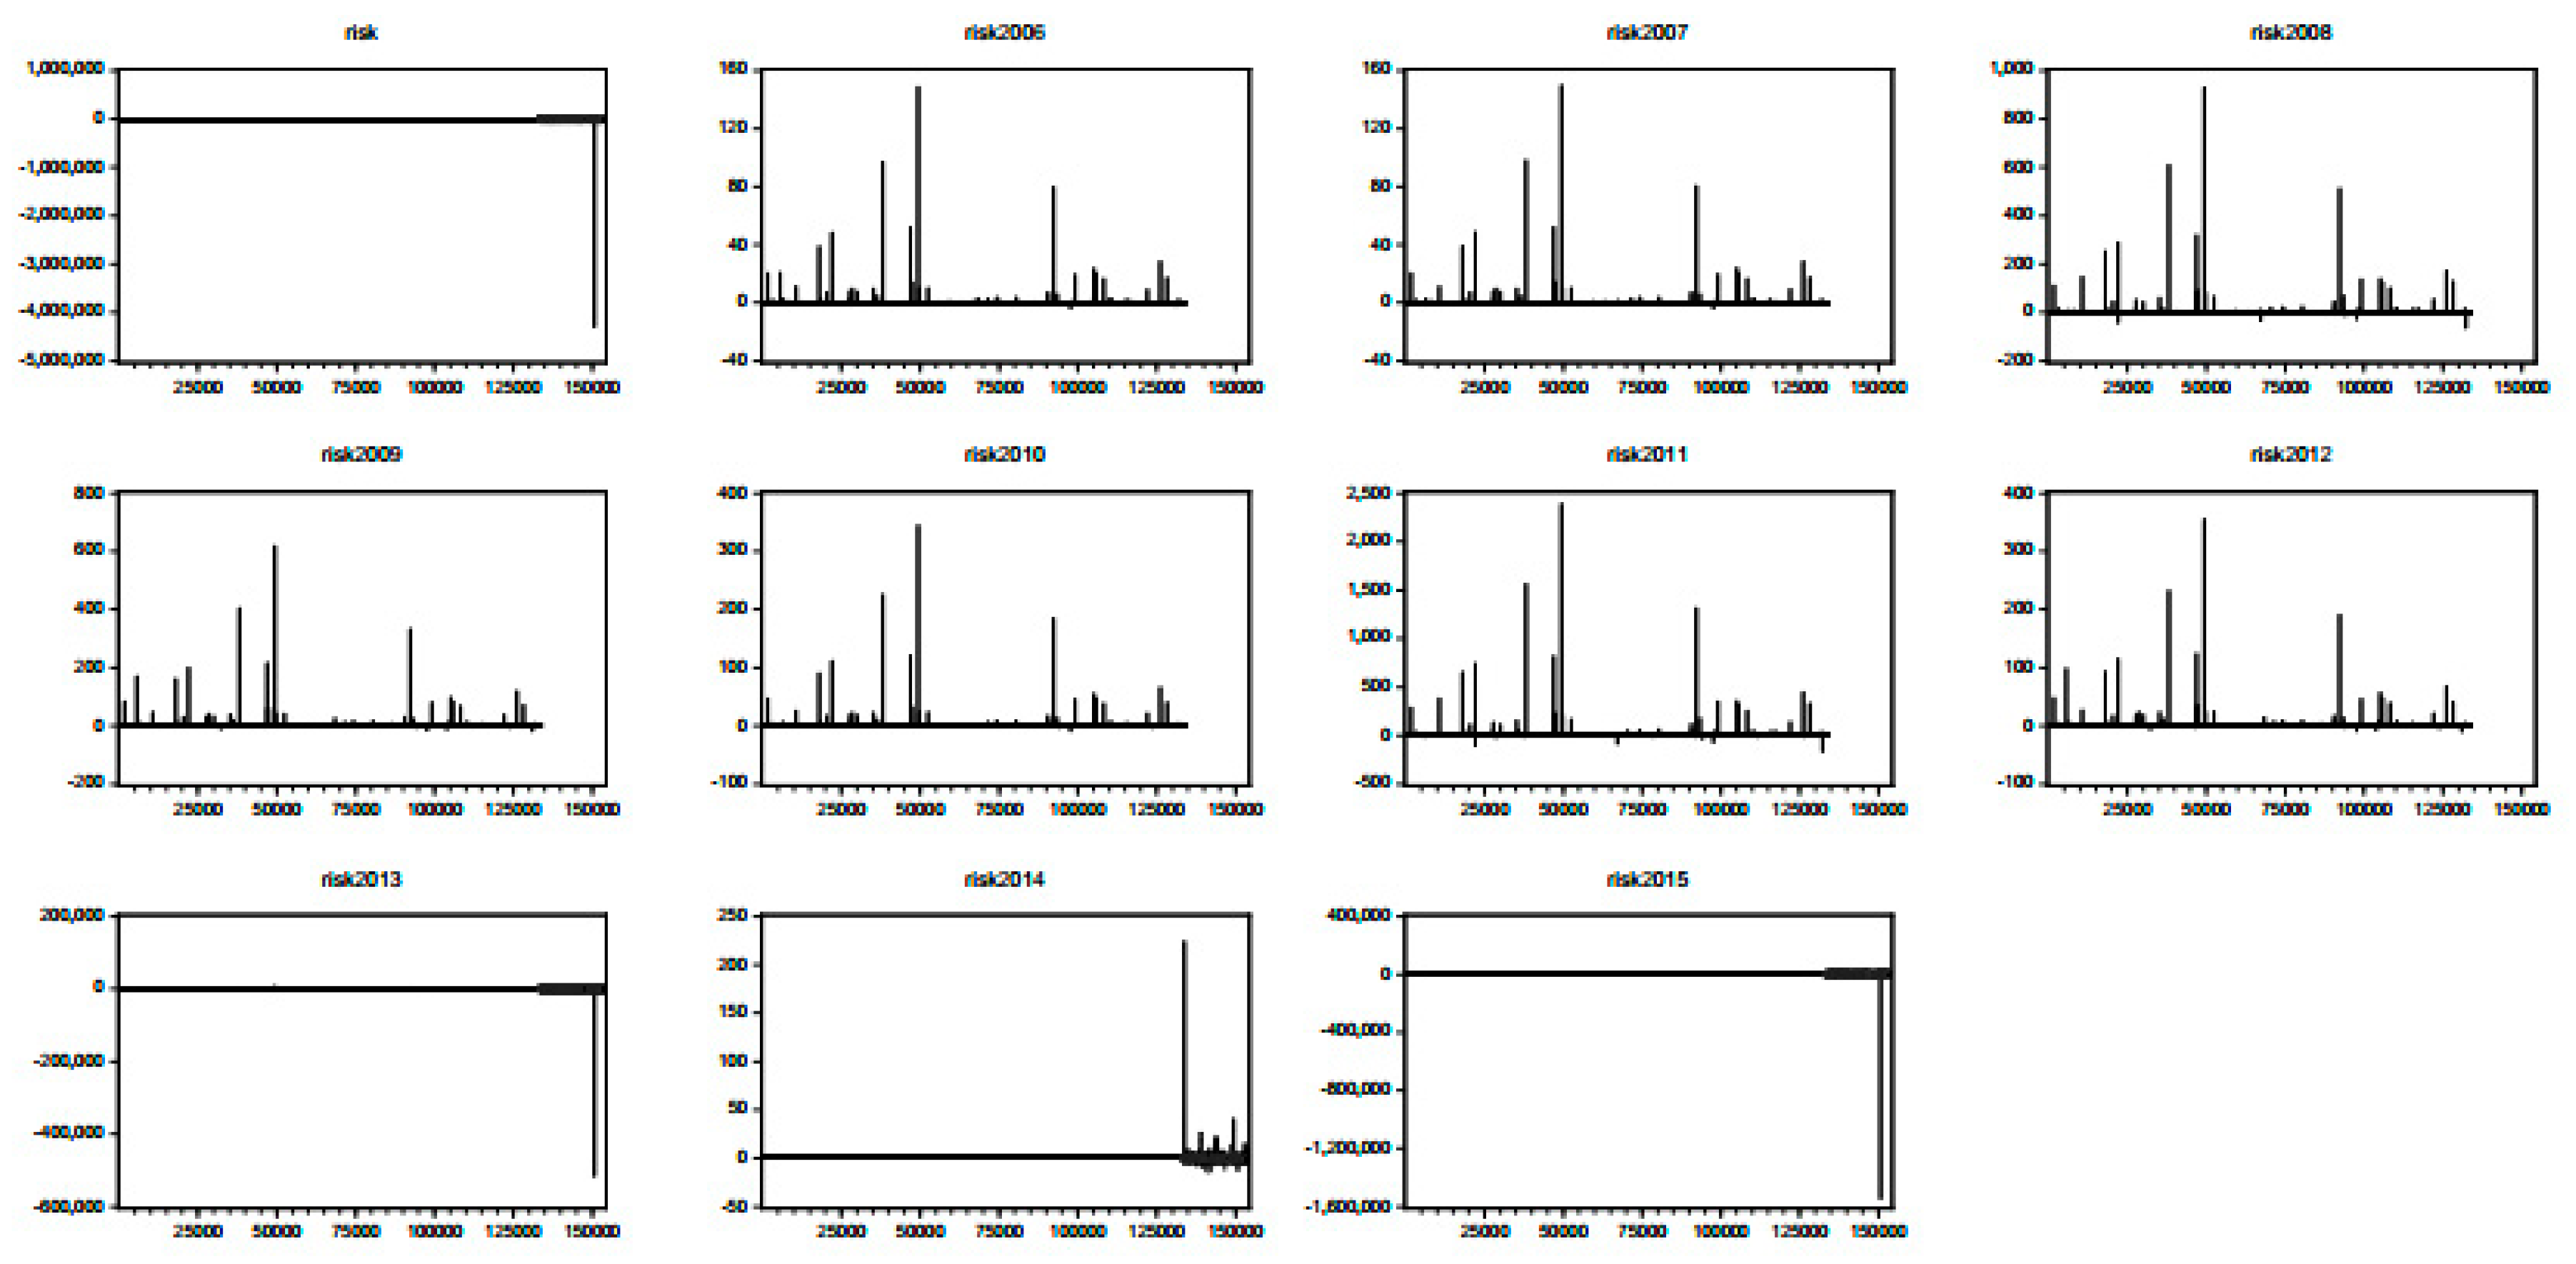
Regarding year, whose correlation values are presented in Table 6, the score Pearson correlation values were very high, near to one and positive. In the next we will be analysing the evolution plots of scores of bankruptcy risk by country and by year. Figure 2 and Figure 3 present these evolutions respectively.
Figure 2 plots the evolution of the score values obtained through PCA from the discriminant indices calculous by country. There are some countries which evidence a very similar behaviour like Belgium, Czech Republic, Finland, France, Great Britain, Hungary, Portugal, Romania, Slovakia and Germany. Another group of similar behaviour in terms of scores is that of Austria, Spain, Italy, Croatia, the Netherlands, Poland and Sweden. The two other similar countries in terms of scores are Ireland and Bulgaria.
Regarding years, the years 2006 until 2012 were very similar years in terms of score behaviour. As such, unstable values are more observed in these years with peaks and downs, which included all countries. In the following we decided to apply first a dynamic panel-data model by regressing the ratio EBIT over Total Assets in the bankruptcy scoring variables by year and a probit estimation considering as dependent variable risk and as independent variables firm performance measures.
Table 7 presents the estimation results of the panel-data model.
The dynamic panel data results indicate that the only score risk variables which have not been omitted due to collinearity issues were the risk measures for years 2014, 2013, 2011 and 2009. The years 2009 until 2011 are characterized by the financial crisis which has spread out through Europe, having a negative influence over firm performance as measured by the ratio of Earnings Before Interest and Taxes and Total Assets, but with significance only for the year 2009 at 5%.
Aleksanyan and Huiban (2016) study confirm also the dramatic increase in bankruptcy risk in the French food industry observed over the period 2010–2012, highlighting that among food industry sub-sectors, the meat industry was primarily responsible for the evolution of bankruptcy risk in the period mentioned.
The years of 2013 and 2014 were years of starting recovery, and we might infer from the results that despite the negative influence of 2013 risk score over performance, in 2014 we already have a positive contribution of bankruptcy risk score over performance, both years with statistical significance at 5%.
Table 8 reports the Tobit estimation results for general risk among countries, while Table 9 presents the same Tobit estimation results but this turn by country. This turn we are testing the influence of performance measures over risk scores since we are analysing the dependent censored variable risk.
Model significance was confirmed at 5% and results seem to indicate that performance measures positively influence risk scores. Thus the higher the performance is the higher will be the risk score and as such bankruptcy risk decreases with performance, a result which was expected. Bankruptcy is one of the most discussed topics in the literature, owing to its importance to the economy of any country. Bankruptcy costs are high and authors have tried to develop bankruptcy prediction models through years. Our scoring methodology through PCA applied to discriminant analysis of bankruptcy risk therefore indicates that performance is the solution to decrease this risk.
Discriminant analysis of bankruptcy risk argues that positive high values of bankruptcy risk positions companies in the safe zone, meaning a low risk of bankruptcy or a probability of bankruptcy lower than 30% (zcc index). Lower values positions firms between the grey zones or in the distress zone (see Section 3.2). Therefore, we may argue that for our sample of firms, these large companies had good chances for performance provided their higher results, thus being non-bankrupt or with lower chances to become so. However, these results depended on the year of analysis provided that Table 7 demonstrates that 2009, 2011 and 2013 were years of negative influence of bankruptcy risk scores over companies’ results.
Company performance variables were all statistically significant and with a positive impact over the bankruptcy risk score in Austria, Bulgaria, Spain, Finland, Great Britain, Croatia, Ireland, Italy, The Netherlands, Portugal, Romania, and Sweden. The ratio sales to total assets had a negative and non-significant impact over the risk score in Belgium, Czech Republic, Hungary and Slovakia. It is positive and non-significant in Poland and France. The only countries where performance (independently of its measure) did not seem to exert an influence over the bankruptcy risk score were Germany and Poland.
Since Germany is on the top ten of the number of corporate insolvencies, this might mean that other corporate variables despite the ones considered here to represent performance in our analysis, might be influencing bankruptcy risk scores under the years in analysis. The Principal Component Analysis here employed to build a bankruptcy risk scored based on discriminant analysis indices was found to be effective for determining the influence of corporate performance over risk. It was useful to understand that different countries evidence different results regarding this influence, as well as different risk scores with respect to years reveal to be different. It could be useful to understand this impact in the future by using other scoring techniques, like data envelopment analysis, or even by detailing years and countries analysis.

5. Conclusions

The purpose of this paper was to improve the knowledge of bankruptcy prediction of companies and to analyse the predictive capacity of factor analysis based over discriminant analysis using five models for assessing bankruptcy risk well-known in the literature: Altman, Conan and Holder, Tafler, Springate and Zmijewski. We used data for non-financial large companies from Europe for the period 2006–2015. In order to analyse the effects of risk scores over firm performance, we applied a dynamic panel-data estimation model, with GMM estimators to regress firm performance indicator over risk by year and we used Tobit models to infer about the influence of company performance measures over general bankruptcy risk scores by country. In summary, results evidence that PCA used to build a bankruptcy risk scored based on discriminant analysis indices is effective for determining the influence of corporate performance over risk.
Results reveal a negative influence of risk scores over firm performance in the financial crisis years of 2009–2011. However, bankruptcy risk scores increase performance (as measured through the ratio Earnings before Interest and Taxes over Total Assets) in the upcoming years of recovery, especially from 2014 onwards. These results were obtained by applying dynamic panel data estimations. Afterwards, using Tobit estimations we analyze the influence of performance measures over risk score (the variable risk was censored between three, negative and positive, inclusively). The higher the performance the higher the risk score, meaning the lower the bankruptcy risk probability. The scoring methodology through PCA applied to discriminant analysis of bankruptcy risk indicators used to obtain the bankruptcy risk scores by year and country highlight that higher performance is the solution to decrease bankruptcy risk.
Therefore, and provided that bankruptcy can be caused by poor management, improper sales forecasting, inexperienced management, rapid technological advances, preference changes, and inability of the firm to follow as a leader in these changes, our sample of large companies in Europe and results obtained lead us to conclude that firms’ strategy is vital in terms of market survival. The literature already points that better corporate governance simultaneously improve firm performance and reduce firm risk, especially during crisis (Wang et al. 2019). Our results seem to highlight the importance of good corporate governance as a key indicator for firm performance and lower bankruptcy risk, with clear differences among European countries. In future works we intend to use other scoring techniques to predict bankruptcy risk like data envelopment analysis in order to be able to understand differences among countries and years, and to test the performance of bankruptcy models using different risk build scores.

Author Contributions

Conceptualization, N.B.-M. and M.M.; methodology, N.B.-M. and M.M.; results and discussions, N.B.-M. and M.M.; formal analysis, N.B.-M.; resources, N.B.-M. and M.M.; data curation, M.M..; writing— N.B.-M. and M.M.; writing—review and editing, N.B.-M. and M.M. All authors have read and agreed to the published version of the manuscript.

Funding

This work was funded by the project “Excellence, performance and competitiveness in the Research, Development and Innovation activities at “Dunarea de Jos” University of Galati”, acronym “EXPERT”, financed by the Romanian Ministry of Research and Innovation in the framework of Programme 1—Development of the national research and development system, Sub-programme 1.2—Institutional Performance—Projects for financing excellence in Research, Development and Innovation, Contract no. 14PFE/17.10.2018.

Acknowledgments

This work was supported by the SOP IEC, under Grant SMIS-CNSR 815-48745, no. 622/2014. This work was in part financially supported by the research unit on Governance, Competitiveness and Public Policy (UID/CPO/04058/2019), funded by national funds through FCT—Fundação para a Ciência e a Tecnologia.

Conflicts of Interest

The authors declare no conflict of interest.

Appendix A

Table A1. Pearson Correlation values.
Variablewctaretaebittabvebvtdstarzaebitcliabilppicurntfspexpenditurazccwcta_1
wcta1
reta−0.256 ***1
ebitta−0.3086 ***0.4387 ***1
bvebvtd0.006 **0.002−0.0021
sta−0.658 ***0.394 ***0.404 ***−0.0041
rza−0.029 ***0.040 ***0.034 ***0.998 ***0.055 ***1
ebitcliabil−0.0000.0010.0000.002−0.0010.0011
ppi0.008 ***0.002−0.0021.000 ***−0.0040.998 ***0.0021
curnt0.008 ***0.001−0.0020.778 ***−0.0030.777 ***−0.0010.778 ***1
fs−0.002−0.003−0.005 *0.019 ***−0.0040.007 ***0.0000.019 ***0.013 ***1
pexpenditura0.002−0.004−0.011 ***−0.0040.003−0.001−0.000−0.004−0.002−0.0021
zcc−0.0000.0010.0000.005 *−0.0010.0011.000 ***0.005 *−0.001−0.000−0.0001
wcta_11.000 ***−0.256 ***−0.309 ***0.006 **−0.658 ***−0.029 ***−0.0000.008 ***0.008 ***−0.0020.002−0.0001
ebitta_1−0.309 ***0.439 ***1.000 ***−0.0020.404 ***0.034 ***0.000−0.002−0.002−0.005 *−0.011 ***0.000−0.309 ***
ebtcl−0.0000.0010.0000.002−0.0010.0010.998 ***0.002−0.0010.000−0.0000.998 ***−0.000
sta_1−0.658 ***0.394 ***0.404 ***−0.0041.000 ***0.055 ***−0.001−0.004−0.003−0.0040.003−0.001−0.658 ***
zs−0.0000.0010.0000.002−0.0010.0010.998 ***0.002−0.0010.000−0.0000.998 ***−0.000
pbtcl−0.0000.0010.0000.002−0.0010.0010.998 ***0.002−0.0010.000−0.0000.998 ***−0.000
cat0.008 ***0.001−0.0020.821 ***−0.0030.819 ***−0.0000.821 ***0.996 ***0.008 ***−0.002−0.0000.008 ***
clt−0.928 ***0.246 ***0.350 ***−0.006 **0.715 ***0.033 ***−0.001−0.009 ***−0.005 **−0.0030.002−0.001−0.928 ***
qaclspbtd0.000−0.002−0.012 ***−0.008 ***0.000−0.005 *0.000−0.009 ***0.0000.0000.0000.000 ***0.000
ztta0.000−0.002−0.012 ***−0.008 ***0.000−0.005 *0.000−0.009 ***0.0000.0000.0000.998 ***0.000
nincomt0.012 ***0.354 ***0.658 ***−0.000−0.030 ***0.010 ***0.001−0.000−0.001−0.011 ***−0.009 ***0.0020.012 ***
tliat−0.741 ***0.341 ***0.495 ***−0.006 **0.824 ***0.042 ***−0.001−0.006 **−0.005 **0.0000.002−0.001−0.741 ***
cac−0.0020.0010.0010.001−0.0000.0000.337 ***0.0010.0000.000−0.0000.337 ***−0.002
zzzmij−0.005 *0.0020.0020.0010.0030.0030.337 ***0.0010.0000.000−0.0000.337 ***−0.005 *
Source. Performed by the authors based on data provided by Amadeus database. Note: *, **, *** represent statistically significant at 10%, 5% and 1% respectively.
Table A2. Pearson Correlation values.
Variableebitta_1ebtclsta_1zspbtclcatcltqaclspbtdzttanincomttliatcaczzzmij
wcta
reta
ebitta
bvebvtd
sta
rza
ebitcliabil
ppi
curnt
fs
pexpenditura
zcc
wcta_1
ebitta_11
ebtcl0.0001
sta_10.404 ***−0.0011
zs0.0001.000 ***−0.0011
pbtcl0.0001.000 ***−0.0011.000 ***1
cat−0.002−0.000−0.003−0.000−0.0001
clt0.350 ***−0.0010.715 ***−0.001−0.001−0.005 *1
qaclspbtd−0.012 ***0.0000.0000.0000.0000.0010.0021
ztta−0.012 ***0.0000.0000.0000.0000.0010.0021.000 ***1
nincomt0.658 ***0.001−0.030 ***0.0010.001−0.0010.012 ***−0.016 ***−0.016 ***1
tliat0.495 ***−0.0010.824 ***−0.001−0.001−0.005 **0.727 ***0.0010.0010.019 ***1
cac0.0010.363 ***−0.0000.363 ***0.363 ***0.0000.0010.000 ***0.000 ***0.001−0.0011
zzzmij0.0020.363 ***0.0030.363 ***0.363 ***0.0000.0040.0000.0000.0010.0031.000 ***1
Source. Performed by the authors based on data provided by Amadeus database. Note: *, **, *** represent statistically significant at 10%, 5% and 1% respectively.

References

  1. Adalessossi, Kokou. 2015. Prediction of Corporate Bankruptcy: Evidence from West African’s SMEs. Journal of Economics, Finance and Accounting 2: 331–52. [Google Scholar] [CrossRef]
  2. Agarwal, Vineet, and Richard J. Taffler. 2007. Twenty-Five Years of the Taffler Z-Score Model: Does It Really Have Predictive Ability? Accounting and Business Research 37: 285–300. [Google Scholar] [CrossRef]
  3. Aleksanyan, Lilia, and Jean-Pierre Huiban. 2016. Economic and Financial Determinants of Firm Bankruptcy: Evidence from the French Food Industry. Review of Agricultural, Food and Environmental Studies 97: 89–108. [Google Scholar] [CrossRef] [Green Version]
  4. Alkhatib, Khalid, and Ahmad Eqab Al Bzour. 2011. Predicting corporate bankruptcy of Jordanian listed companies: Using Altman and Kida Models. International Journal of Business and Management 6: 208–15. [Google Scholar] [CrossRef]
  5. Altman, Edward I. 1968. Financial ratios, discriminant analysis and the prediction of corporate bankruptcy. The Journal of Finance XXIII: 589–609. [Google Scholar]
  6. Altman, Edward I., John Hartzell, and Matthew Peck. 1998. Emerging Markets Corporate Bonds: A Scoring System. In Emerging Market Capital Flows. Part of the The New York University Salomon Center Series on Financial Markets and Institutions Book Series (SALO, Volume 2); Boston: Springer, pp. 391–400. [Google Scholar]
  7. Altman, Edward I. 2000. Predicting Financial Distress of Companies: Revisiting the Z-Score and Zeta ® Models. New York University. Available online: http://pages.stern.nyu.edu/~ealtman/Zscores.pdf (accessed on 10 October 2019).
  8. Altman, Edward I. 2002. Revisiting Credit Scoring Models in a Basel II Environment. In Credit Rating: Methodologies, Rationale, and Default Risk. Edited by Michael K. Ong. London: Risk Books, Available online: https://pdfs.semanticscholar.org/9899/c671599ca41a1310d9b5e0ed5a3953c930f0.pdf (accessed on 10 October 2019).
  9. Altman, Edward, Malgorzata Iwanicz-Drozdowska, Erkki Laitinen, and Arto Suvas. 2017. Financial Distress Prediction in an International Context: A Review and Empirical Analysis of Altman’s Z-Score Model. Journal of International Financial Managament & Accounting 28: 131–71. [Google Scholar]
  10. Armeanu, Stefan Daniel, Georgeta Vintila, Maricica Moscalu, Maria-Oana Filipescu, and Paula Lazar. 2012. Using quantitative data analysis techniques for bankruptcy risk estimation for corporations. Theoretical and Applied Economics XIX: 97–112. [Google Scholar]
  11. Armeanu, Stefan Daniel, and Sorin Iulian Cioaca. 2015. An assessment of the bankruptcy risk on the Romanian capital market. Procedia Social and Behavioral Sciences 182: 535–42. [Google Scholar] [CrossRef] [Green Version]
  12. Arroyave, Jackson. 2018. A comparative analysis of the effectiveness of corporate bankruptcy prediction models based on financial ratios: Evidence from Colombia. Journal of International Studies 11: 273–87. [Google Scholar] [CrossRef] [Green Version]
  13. Ashraf, Sumaira, Elisabete G. S. Félix, and Zélia Serrasqueiro. 2019. Do Traditional Financial Distress Prediction Models Predict the Early Warning Signs of Financial Distress? Journal of Risk and Financial Management 12: 55. [Google Scholar] [CrossRef] [Green Version]
  14. Avenhuis, Jeroen O. 2013. Testing the generalizability of the bankruptcy prediction models of Altman, Ohlson and Zmijewski for Dutch listed and large non-listed firms. Master’s Thesis, The School of Management and Governance, University of Twente, Enschede, The Netherlands, November 13. Available online: https://essay.utwente.nl/64326/1/MSc_Oude%20Avenhuis.pdf (accessed on 25 November 2019).
  15. Aziz, M.A., and H.A. Dar. 2006. Predicting corporate bankruptcy: Where we stand? Corporate Governance 6: 18–33. [Google Scholar] [CrossRef] [Green Version]
  16. Bărbuţă-Mişu, Nicoleta. 2009. Modelling the financial performance of the building sector enterprises—Case of Romania. Romanian Journal of Economic Forecasting 4: 195–212. [Google Scholar]
  17. Bărbuţă-Mişu, Nicoleta. 2017. Assessing the Risk of Bankruptcy. Case Study on a European Manufacturing Company. In Understanding Bankruptcy: Global Issues, Perspectives and Challenges. Chapter 4. Edited by Ignatius Ekanem. Hauppauge: Nova Science Publishers, Inc. [Google Scholar]
  18. Bărbuţă-Mişu, Nicoleta, and Radu Stroe. 2010. The adjustment of the Conan & Holder model to the specificity of Romanian enterprises—A local study for building sector. Economic Computation and Economic Cybernetics Studies and Research 44: 123–40. [Google Scholar]
  19. Bărbuță-Mișu, Nicoleta, and Elena-Silvia Codreanu. 2014. Analysis and Prediction of the Bankruptcy Risk in Romanian Building Sector Companies. Ekonomika 93: 131–46. [Google Scholar] [CrossRef] [Green Version]
  20. Beaver, William H. 1966. Financial Ratios as Predictors of Failure. Journal of Accounting Research 4: 71–111. [Google Scholar] [CrossRef]
  21. Beaver, William H. 1968. Alternative Accounting Measures as Predictors of Failure. The Accounting Review 43: 113–22. [Google Scholar]
  22. Belyaeva, Elena. 2014. On a New Logistic Regression Model for Bankruptcy Prediction in the IT Branch. U.U.D.M. Project Report. p. 35. Available online: https://uu.diva-portal.org/smash/get/diva2:785084/FULLTEXT01.pdf (accessed on 15 October 2019).
  23. Brédart, Xavier. 2014. Bankruptcy prediction model: The case of the United States. International Journal of Economics and Finance 6: 1–7. [Google Scholar] [CrossRef] [Green Version]
  24. Burns, John, and Gudrun Balvinsdottir. 2005. An institutional perspective of accountants’ new roles—The interplay of contradictions and praxis. European Accounting Review 14: 725–57. [Google Scholar] [CrossRef]
  25. Cielen, Anja, Ludo Peeters, and Koen Vanhoof. 2004. Bankruptcy prediction using a data envelopment analysis. European Journal of Operational Research 154: 526–32. [Google Scholar] [CrossRef]
  26. Conan, Joel, and Michael Holder. 1979. Variables explicatives de performances et controle de gestion dans les P.M.I. Universite Paris Dauphine [Explanatory Variables of Performance and Management Control in the SMEs]. Paris: Paris Dauphine University. [Google Scholar]
  27. Cultrera, Loredana, Melanie Croquet, and Jeremy Jospin. 2017. Predicting bankruptcy of Belgian SMEs: A hybrid approach based on factorial analysis. International Business Research 10: 33–41. [Google Scholar] [CrossRef] [Green Version]
  28. Chaitanya, Krishna. 2005. Measuring Financial Distress of IDBI Using Altman Z-Score Model. The IUP Journal of Bank Management 4: 7–17. [Google Scholar]
  29. Chung, Kim-Choy, Shin Shin Tan, and David K. Holdsworth. 2008. Insolvency prediction model using multivariate discriminant analysis and artificial neural network for the finance industry in New Zealand. International Journal of Business and Management 3: 19–29. [Google Scholar]
  30. Dakovic, Rada, Claudia Czado, and Daniel Berg. 2010. Bankruptcy prediction in Norway: A comparison study. Applied Economics Letters 17: 1739–46. [Google Scholar] [CrossRef] [Green Version]
  31. De, Ranabir. 2014. Principal Component Analysis and General Regression Auto Associative Neural Network Hybrid as One-Class Classifier. Kanpur: Indian Institute of Technology, Available online: https://www.idrbt.ac.in/assets/alumni/PT-2014/Ranabir%20De_Principal%20Component%20Analysis%20and%20General.pdf (accessed on 5 January 2020).
  32. Diakomihalis, Mihail. 2012. The accuracy of Altman’s models in predicting hotel bankruptcy. International Journal of Accounting and Financial Reporting 2: 96–113. [Google Scholar] [CrossRef]
  33. Dun & Bradstreet. 2019. Global Bankruptcy Report 2019, Dun & Bradstreet Worldwide Network. Available online: https://www.bisnode.se/globalassets/global-bankruptcy-report-2019.pdf (accessed on 21 December 2019).
  34. Elviani, Sri, Ramadona Simbolon, Zenni Riana, Farida Khairani, Sri Puspa Dewi, and Fauzi Fauzi. 2020. The Accuracy of the Altman, Ohlson, Springate and Zmejewski Models in Bankruptcy Predicting Trade Sector Companies in Indonesia. Budapest International Research and Critics Institute (BIRCI-Journal) 3: 334–47. [Google Scholar] [CrossRef]
  35. European Commission. 2003. Commission Recommendation of 6 May 2003 Concerning the Definition of Micro, Small and Medium-Sized Enterprises. Available online: http://eur-lex.europa.eu/eli/reco/2003/361/oj (accessed on 18 December 2019).
  36. Euler Hermes Economic Research. 2019. The View Economic Research. Available online: https://www.eulerhermes.com/content/dam/onemarketing/euh/eulerhermes_com/erd/publications/pdf/Global-Insolvencies-Jan19.pdf (accessed on 21 December 2019).
  37. Fulmer, John G., Jr., James E. Moon, Thomas A. Gavin, and Michael J. Erwin. 1984. A Bankruptcy Classification Model for Small Firms. Journal of Commercial Bank Lending 66: 25–37. [Google Scholar]
  38. Heffernan, Shelagh. 2005. Modern Banking. Chichester: John Wiley & Sons Ltd. [Google Scholar]
  39. Hillegeist, Stephen A., Elizabeth K. Keating, Donald P. Cram, and Kyle G. Lundstedt. 2004. Assessing the probability of bankruptcy. Review of Accounting Studies 9: 5–34. [Google Scholar] [CrossRef]
  40. Jouzbarkand, Mohammad, Farshad S. Keivani, Mohsen Khodadadi, and Seyed R.S.N. Fahim. 2013. Bankruptcy prediction model by Ohlson and Shirata models in Tehran Stock Exchange. World Applied Sciences Journal 21: 152–56. [Google Scholar]
  41. Karels, Gordon V., and Arun J. Prakash. 1987. Multivariate normality and forecasting for business bankruptcy. Journal of Business Finance & Accounting 14: 573–93. [Google Scholar]
  42. Kim, Myoung-Jong, and Ingoo Han. 2003. The discovery of experts’ decision rules from qualitative bankruptcy data using genetic algorithms. Expert Systems with Applications 25: 637–46. [Google Scholar] [CrossRef]
  43. Koh, Hian Chye, and Sen Suan Tan. 1999. A neural network approach to the prediction of going concern status. Accounting and Business Research 29: 211–16. [Google Scholar] [CrossRef]
  44. Král’, Pavol, Milos Fleischer, Maria Stachová, Gabriela Nedelová, and Lukas Sobíšek. 2016. Corporate financial distress prediction of Slovak companies: Z-score models vs. alternatives. Paper presented at the 9th Applications of Mathematics and Statistics in Economics—AMSE 2016, Banská Štiavnica, Slovakia, August 31–September 4. [Google Scholar]
  45. Li, Hui, and Jie Sun. 2011. Predicting business failure using forward ranking-order case-based reasoning. Expert Systems with Applications 38: 3075–84. [Google Scholar] [CrossRef]
  46. Mousavi, Mohammad Mahdi, Jamal Ouenniche, and Kaoru Tone. 2019. A comparative analysis of two-stage distress prediction models. Expert Systems with Applications 119: 322–41. [Google Scholar] [CrossRef] [Green Version]
  47. Ohlson, James A. 1980. Financial Ratios and the Probabilistic Prediction of Bankruptcy. Journal of Accounting Research 18: 109–31. [Google Scholar] [CrossRef] [Green Version]
  48. Onofrei, Mihaela, and Dan Lupu. 2014. The Modelling of Forecasting the Bankruptcy in Romania. MPRA Paper 95511. Munich: University Library of Munich. [Google Scholar]
  49. Ouenniche, Jamal, and Kaoru Tone. 2017. An out-of-sample evaluation framework for DEA with application in bankruptcy prediction. Annals of Operations Research 254: 235–50. [Google Scholar] [CrossRef] [Green Version]
  50. Paradi, Joseph C., Mette Asmild, and Paul C. Simak. 2004. Using DEA and worst practice DEA in credit risk evaluation. Journal of Productivity Analysis 21: 153–65. [Google Scholar] [CrossRef]
  51. Prusak, Blazej. 2018. Review of research into enterprise bankruptcy prediction in selected Central and Eastern European countries. International Journal of Financial Studies 6: 60. [Google Scholar] [CrossRef] [Green Version]
  52. Ryu, Kisang, and Soocheong Jang. 2004. Performance Measurements through Cash Flow Ratios and Traditional Ratios: A Comparison of Commercial and Casino Hotel Companies. Journal of Hospitality Financial Management 12: 15–25. [Google Scholar] [CrossRef] [Green Version]
  53. Scapens, Robert W. 2006. Understanding Management Accounting Practices: A personal journey. British Accounting Review 38: 1–30. [Google Scholar] [CrossRef]
  54. Shetty, Udaya, T. P. M. Pakkala, and T. Mallikarjunappa. 2012. A modified directional distance formulation of DEA to assess bankruptcy: An application to IT/ITES companies in India. Expert Systems with Applications 39: 1988–97. [Google Scholar] [CrossRef]
  55. Shin, Kyung-Shik, Taik Soo Lee, and Hyun-Jung Kim. 2005. An application of support vector machines in bankruptcy prediction model. Expert Systems with Applications 28: 127–35. [Google Scholar] [CrossRef]
  56. Shirata, Cindy Yoshiko. 1995. Read the Sign of Business Failure. Journal of Risk and Management 23: 117–38. [Google Scholar]
  57. Shumway, Tyler. 2001. Forecasting bankruptcy more accurately: A simple hazard model. Journal of Business 74: 101–24. [Google Scholar] [CrossRef] [Green Version]
  58. Sigrist, Fabio, and Christoph Hirnschall. 2019. Grabit: Gradient tree-boosted Tobit models for default prediction. Journal of Banking & Finance 102: 177–92. [Google Scholar]
  59. Springate, Gordon. 1978. Predicting the possibility of failure in a Canadian firm. Master’s Thesis, Simon Fraser University, Burnaby, BC, Canada. [Google Scholar]
  60. Taffler, Richard J. 1982. Forecasting company failure in the UK using discriminant analysis and financial ratio data. Journal of Royal Statistical Society Series A 145: 342–58. [Google Scholar] [CrossRef]
  61. Taffler, Richard J. 1983. The assessment of company solvency and performance using a statistical model. Accounting and Business Research 15: 295–307. [Google Scholar] [CrossRef]
  62. Taffler, Richard J. 1984. Empirical models for the monitoring of UK corporations. Journal of Banking & Finance 8: 199–227. [Google Scholar]
  63. Tam, Kar Yan. 1991. Neural Network Models and the Prediction of Bank Bankruptcy. Omega 19: 429–45. [Google Scholar] [CrossRef]
  64. Theodossiou, Panayiotis. 1991. Alternative models for assessing the financial condition of business in Greece. Journal of Business Finance & Accounting 18: 697–720. [Google Scholar]
  65. Xu, Ming, and Chu Zhang. 2009. Bankruptcy prediction: The case of Japanese listed companies. Review of Accounting Studies 14: 534–58. [Google Scholar] [CrossRef]
  66. Zavgren, Christine V. 1985. Assessing the vulnerability to failure of American industrial firms: A logistic analysis. Journal of Business Finance & Accounting 12: 19–45. [Google Scholar]
  67. Zhang, Guoqiang, Michael Y. Hu, Eddy B. Patuwo, and Daniel C. Indro. 1999. Artificial neural networks in bankruptcy prediction: General framework and cross-validation analysis. European Journal of Operational Research 116: 16–32. [Google Scholar] [CrossRef] [Green Version]
  68. Zmijewski, Mark E. 1984. Methodological issues relating to the estimation of financial distress prediction models. Journal of Accounting Research 22: 59–82. [Google Scholar] [CrossRef]
  69. Wang, Jo-Yu, Juo-Lien Wang, and Hui-Yu Liao. 2019. Does Corporate Governance Enhance Firm Performance and Reduce Firm Risk? Evidence from Taiwanese Listed Companies. Journal of Economics and Management 15: 61–91. [Google Scholar]
  70. Woods, Margare, and Kevin Dowd. 2008. Financial Risk Management for Management Accountants, Management Accounting Guideline. Toronto: The Society of Management Accountants of Canada (CMA Canada), Durham: The American Institute of Certified Public Accountants, Inc. (AICPA), London: The Chartered Institute of Management Accountants (CIMA), Available online: https://www.cimaglobal.com/Documents/ImportedDocuments/cid_mag_financial_risk_jan09.pdf (accessed on 25 November 2019).
  71. Wu, Yanhui, C. Gaunt, and S. Gray. 2010. A Comparison of Alternative Bankruptcy Prediction Models. Journal of Contemporary Accounting and Economics 6: 34–45. [Google Scholar] [CrossRef]
Figure 1. Frequency of corporate insolvencies in Europe, by country in 2018. Source: Euler Hermes Economic Research. 2019. Insolvency Outlook. Euler Hermes, Allianz, Economic Research, 1–14 January 2019. Own elaboration.
Jrfm 13 00058 g001
Figure 2. Plot of scoring bankruptcy risk by country. Source. Performed by the authors based on data provided by Amadeus database.
Jrfm 13 00058 g002
Figure 3. Plot of scoring bankruptcy risk by year. Source. Performed by the authors based on data provided by Amadeus database.
Jrfm 13 00058 g003
Table 1. Total number of companies within the sample by country and year.
AcronymCountryNumber CompaniesFrequency2006200720082009201020112012201320142015
ATAustria21751.41%15659634037238040142896
BEBelgium59563.87%579535604610618626633636639476
BGBulgaria11190.73%10192110110106119120120121120
CZCzech Republic42702.77%407370393448460482490493461266
DEGermany24,91716.17%210522762603275829083039310631722667283
ESSpain11,2137.28%10969931179119412281261128513041298375
FIFinland23041.50%193208213231229244250254264218
FRFrance15,3569.97%1775159515601413159313951114165420991158
GBGreat Britain (UK)44,06028.60%3558381140784324461249135155539255502667
GRGreece17411.13%167131177188191192194194193114
HRCroatia11900.77%10196116117125126127128128126
HUHungary18491.20%42137212223236230235237173124
IEIreland14820.96%9713614014517117518919819437
ITItaly17,69711.49%1750151918021828185519301947197919741113
NLThe Netherlands58683.81%345471258597500705785817879511
PLPoland16681.08%16316518219818715415717119695
PTPortugal25551.66%222215248255267281288287271221
RORomania21441.39%2346400297303310311322303
SESweden51153.32%475476548570517506512524537450
SKSlovakia13820.90%136130154162159141141123119117
Total154,061 13,54713,47614,58215,46716,59917,19417,41818,39518,5138870
Source. Performed by the authors based on data provided by Amadeus database.
Table 2. Variables, formulas, and descriptive statistics.
FormulaVariableObsMeanStd. Dev.MinMax
Working capital/Total assetswcta153,4590.140.76−198.44113.86
Retained Earnings/Total Assetsreta148,9860.241.29−364.35274.07
EBIT/Total assetsebitta153,4590.060.24−42.1461.11
Book Value of Equity/Book Value of Total Debtbvebvtd153,2782.44176.82−657.2950,409.00
Sales/Total assetssta153,4591.483.990.001322.52
Revised Z Altmanrza148,8213.0275.50−306.7021,172.06
EBIT/Current liabilitiesebitcliabil151,123240.93101,682.60−4,900,820.0038,700,000.00
Permanent capital/Total debtsppi153,2782.77176.83−656.2950,410.00
(Current assets − Stocks)/Total Liabilitiescurnt153,2782.31172.72−38.1545,178.00
Financial expenditures/Salesfs145,5150.118.93−1.112169.55
Personnel Expenditures/Added Valuepexpenditura140,1040.693.81−609.22440.32
Z Connanzcc135,07364.9725,813.04−1,176,196.009,298,852.00
Working capital/Total assetswcta_1153,4590.140.76−198.44113.86
Earnings Before Interest and Taxes/Total Assets ebitta_1153,4590.060.24−42.1461.11
Earnings Before Taxes/Current Liabilitiesebtcl151,096229.24103,167.50−5,151,934.0039,400,000.00
Sales/Total Assets sta_1153,4591.483.990.001322.52
Z Springate Modelzs151,096152.2368,090.55−3,400,276.0026,000,000.00
Profit Before Tax/Current Liabilitiespbtcl151,096229.24103,167.50−5,151,934.0039,400,000.00
Current Assets/Total Liabilitiescat153,2782.89219.41−39.3055,223.00
Current Liabilities/Total Assetsclt153,4590.430.75−113.76199.44
(Quick Assets − Current Liabilities)/(Sales − Profit Before Tax − Depreciation)/365qaclspbtd144,735−792,000,000,000301,000,000,000,000−115,000,000,000,000,00010,200,000
Z Taffler ztta144,730−23,000,000,0008740,000,000,000−3,320,000,000,000,00047,900,0000
Net Income/Total Assets nincomt153,4590.040.26−62.3326.68
Total Liabilities/Total Assets tliat153,4320.641.12−71.28390.32
Current Assets/Current Liabilitiescac151,123−653.97403,912.70−90,700,000.0084,800,000.00
Z Zmijewski zzzmij151,118−3.441615.68−362,744.00339,315.60
Source. Performed by the authors based on data provided by Amadeus database.
Table 3. Descriptive Statistics of scores computed based over Principal Component Analysis (PCA).
VariableObsMeanStd. Dev.VariableObsMeanStd. Dev.
risk133,751−0.003310.004657riskAT133,751−0.239143.094626
risk2015133,7510.0041670.006804riskBE133,7510.43394750.73316
risk2014133,751−0.010110.001642riskBG133,7510.48577614.48578
risk2013133,7510.26443426.89755riskCZ133,7510.55598760.98777
risk2012133,7510.0061041.469264riskDE133,751−0.017410.468755
risk2011133,7510.0856799.797604riskES133,7510.1886943.364935
risk2010133,7510.0015791.400829riskFI133,7511.197073115.5954
risk2009133,7510.0121242.556249riskFR133,751−0.009960.00155
risk2008133,7510.0293943.814389riskGB133,7510.73181971.07321
risk2007133,751−0.005390.608735riskHR133,7510.2261013.129303
risk2006133,751−0.019380.606729riskHU133,7510.15819119.79164
riskIE133,7510.06146710.7725
riskIT133,7510.2974282.719817
riskNL133,751−0.292143.178018
riskPL133,751−0.074913.281825
riskPT133,7513.345667299.3375
riskRO133,7511.151802109.7751
riskSE133,751−0.309313.435378
riskSK133,7510.31760436.03616
Source. Performed by the authors based on data provided by Amadeus database.
Table 4. Number of firms after limiting the risk values by country and year.
Country2006200720082009201020112012201320142015Total
AT10490315347352363396801948
BE5764636006066136206286346354715846
BG95651071041021191201201211201073
CZ4032733884454554804884904592654146
DE20181693250126642840297330423113261327323,730
ES1086760116711721213124112691286128036710,841
FI1551381741861942042072112231701862
FR173812651542138915721381109516332064113214,811
GB321727723702388440784363455347734890234738,579
HR100641161171241241261271281261152
HU36992022122202172222241621151709
IE8993125127149153170166160301262
IT174612211798182518551930194619761973111317,383
NL239199551613172529260619
PL72527685755159618317631
PT2211412452532592702742642572052389
RO1520002973033103113223031998
SE2182052692822442452492612732402486
SK130941491531281391391211171161286
Total12,292959713,22013,61014,74615,17715,27416,16316,1827490133,751
Source. Performed by the authors based on data provided by Amadeus database.
Table 5. Pearson correlation values among scoring PCA bankruptcy risk variables obtained by country.
ScoreriskATriskBEriskBGriskCZriskDEriskESriskFIriskFRriskGBriskHRriskHUriskIEriskITriskNLriskPLriskPTriskROriskSEriskSK
riskAT1
riskBE0.093 ***1
riskBG0.037 ***0.337 ***1
riskCZ0.093 ***0.998 ***0.363 ***1
riskDE0.093 ***0.998 ***0.363 ***1.000 ***1
riskES0.997 ***0.016 ***0.008 ***0.016 ***0.016 ***1
riskFI0.093 ***1.000 ***0.337 ***0.998 ***0.998 ***0.016 ***1
riskFR0.093 ***0.998 ***0.363 ***1.000 ***1.000 ***0.016 ***0.998 ***1
riskGB0.093 ***1.000 ***0.337 ***0.998 ***0.998 ***0.016 ***1.000 ***0.998 ***1
riskHR1.000 ***0.098 ***0.039 ***0.098 ***0.098 ***0.997 ***0.098 ***0.098 ***0.098 ***1
riskHU0.093 ***0.998 ***0.363 ***1.000 ***1.000 ***0.016 ***0.998 ***1.000 ***0.998 ***0.098 ***1
riskIE0.037 ***0.337 ***1.000 ***0.363 ***0.363 ***0.008 ***0.337 ***0.363 ***0.337 ***0.039 ***0.363 ***1
riskIT0.982 ***−0.098 ***−0.032 ***−0.098 ***−0.098 ***0.994 ***−0.098 ***−0.098 ***−0.098 ***0.981 ***−0.098 ***−0.032 ***1
riskNL0.997 ***0.174 ***0.065 ***0.174 ***0.174 ***0.987 ***0.174 ***0.174 ***0.174 ***0.997 ***0.174 ***0.065 ***0.963 ***1
riskPL1.000 ***0.085 ***0.033 ***0.085 ***0.085 ***0.998 ***0.085 ***0.085 ***0.085 ***0.999 ***0.085 ***0.033 ***0.983 ***0.996 ***1
riskPT0.093 ***0.998 ***0.363 ***1.000 ***1.000 ***0.016 ***0.998 ***1.000 ***0.998 ***0.098 ***1.000 ***0.363 ***−0.098 ***0.174 ***0.085 ***1
riskRO0.093 ***0.998 ***0.363 ***1.000 ***1.000 ***0.016 ***0.998 ***1.000 ***0.998 ***0.098 ***1.000 ***0.363 ***−0.098 ***0.174 ***0.085 ***1.000 ***1
riskSE0.999 ***0.071 ***0.029 ***0.071 ***0.071 ***0.999 ***0.071 ***0.071 ***0.071 ***0.999 ***0.071 ***0.029 ***0.986 ***0.995 ***0.999 ***0.071 ***0.071 ***1
riskSK0.093 ***0.998 ***0.363 ***1.000 ***1.000 ***0.016 ***0.998 ***1.000 ***0.998 ***0.098 ***1.000 ***0.363 ***−0.098 ***0.174 ***0.085 ***1.000 ***1.000 ***0.071 ***1
Source. Performed by the authors based on data provided by Amadeus database. Note: *, **, ***, represent statistically significant at 10%, 5% and 1%, respectively.
Table 6. Pearson correlation variables among scoring PCA bankruptcy risk variables obtained by year.
Scoresriskrisk2015risk2014risk2013risk2012risk2011risk2010risk2009risk2008risk2007risk2006
risk1
risk20151.000 ***1
risk20141.000 ***1.000 ***1
risk20131.000 ***1.000 ***1.000 ***1
risk20121.000 ***1.000 ***1.000 ***1.000 ***1
risk20110.998 ***0.998 ***0.998 ***0.998 ***0.998 ***1
risk20101.000 ***1.000 ***1.000 ***1.000 ***1.000 ***0.998 ***1
risk20091.000 ***1.000 ***1.000 ***1.000 ***1.000 ***0.998 ***1.000 ***1
risk20080.998 ***0.998 ***0.998 ***0.998 ***0.998 ***1.000 ***0.998 ***0.998 ***1
risk20071.000 ***1.000 ***1.000 ***1.000 ***1.000 ***0.998 ***1.000 ***1.000 ***0.998 ***1
risk20061.000 ***1.000 ***1.000 ***1.000 ***1.000 ***0.998 ***1.000 ***1.000 ***0.998 ***1.000 ***1
Source. Performed by the authors based on data provided by Amadeus database. Note: *, **, ***, represent statistically significant at 10%, 5% and 1%, respectively.
Table 7. Dynamic panel data results.
Dynamic Panel-Data Estimation
Wald chi2(4) 8.04
Prob > chi2 0.0901
ebittaCoef.zP > |z|
risk20143102802.040.041
risk2013−9.35136−20.045
risk2011−0.03367−0.330.743
risk2009−101.797−2.080.038
GMM-type:L(2/.).wcta
Source. Performed by the authors based on data provided by Amadeus database.
Table 8. Tobit estimation results.
Tobit Regression: Dependent = Risk
Coeftp > tCoeftp > t
ebitta0.00012 **2.050.0410.00019 *1.900.057
sta 0.0000060.960.339
wcta 0.0001 ***3.680.000
const−0.00332−250.910.000−0.00334 ***−213.660.000
LR chi24.19 LR chi218.9
prob chi20.0406 prob chi20.0003
Source. Performed by the authors based on data provided by Amadeus database. Note: *, **, *** statistically significant at 10%, 5% and 1%, respectively. Ebitta = earnings before interest and taxes (ebit)/total assets; sta = sales/total assets; wcta = working capital/total assets.
Table 9. Tobit estimation results by country.
Tobit Regression: Dependent = Risk
AT = AustriaBE = BelgiumBG = Bulgaria
Indep.Coeftp > tCoeftp > tCoeftp > t
ebitta0.00060 ***39.820.0000−0.00017−0.530.5980.00007 ***19.190.0000
sta0.000002 ***8.010.0000−0.00002−0.890.3750.000002 ***4.300.0000
wcta0.000032 ***36.010.00000.00018 *1.830.0670.00004 ***15.750.0000
const−0.00337 ***−6822.460.0000−0.00332 ***−74.970−0.00337 ***−3544.580.0000
LR chi22114.454.50646.96
prob chi20.00000.21260.0000
CZ = Czech RepublicDE = GermanyES = Spain
Indep.Coeftp > tCoeftp > tCoeftp > t
ebitta0.00020 ***26.540.00000.000560.900.37100.00007 ***5.040.0000
sta−0.00000−0.770.4440−0.00006−1.090.27600.000003 *1.930.0530
wcta0.00004 ***12.800.00000.000111.380.16600.00002 ***3.120.0020
const−0.00337 ***−2204.680.0000−0.00310 ***−27.570.0000−0.00337 ***−1570.650.0000
LR chi23370.883.6253.54
prob chi20.00000.30600.0000
FI = FinlandFR = FranceGB = Great Britain (UK)
Indep.Coeftp > tCoeftp > tCoeftp > t
ebitta0.00011 ***19.320.00000.00102 **2.370.01800.00005 ***15.280.0000
sta0.000004 ***8.100.00000.000061.370.17200.000003 ***6.450.0000
wcta0.00003 ***8.970.00000.000051.090.27700.00003 ***15.210.0000
const−0.00338 ***−2800.200.0000−0.00345 ***−39.570.0000−0.00337 ***−4094.650.0000
LR chi2527.879.77787.56
prob chi20.00000.02060.0000
HR = CroatiaHU = HungaryIE = Ireland
Indep.Coeftp > tCoeftp > tCoeftp > t
ebitta0.00006 ***10.420.00000.00014 **2.210.02700.00008 ***26.520.0000
sta0.000004 ***5.640.0000−0.00000−0.070.94500.000003 ***7.280.0000
wcta0.00003 ***13.650.00000.00011 ***4.970.00000.00003 ***27.080.0000
const−0.00337 ***−3219.780.0000−0.00337 ***−293.470.0000−0.00337 ***−5373.660.0000
LR chi2476.7534.351265.69
IT = ItalyNL = The NetherlandsPL = Poland
Indep.Coeftp > tCoeftp > tCoeftp > t
ebitta0.00004 ***5.250.00000.00006 ***14.940.00000.000090.900.3710
sta0.000004 ***4.410.00000.000003 ***9.420.00000.0000121.280.2010
wcta0.00004 ***11.450.00000.00003 ***12.460.00000.000051.260.2100
const−0.00338 ***−2531.810.0000−0.00337 ***−4554.270.0000−0.00339 ***−214.040.0000
LR chi2247.05428.156.47
prob chi20.00000.00000.0909
PT = PortugalRO = RomaniaSE = Sweden
Indep.Coeftp > tCoeftp > tCoeftp > t
ebitta0.00006 ***31.900.00000.00004 ***13.500.00000.00007 ***30.340.0000
sta0.000005 ***20.110.00000.000002 ***5.150.00000.000002 ***5.920.0000
wcta0.00002 ***36.120.00000.00002 ***10.940.00000.00003 ***19.770.0000
const−0.00337 ***−0.00010.0000−0.00337 ***−4030.590.0000−0.00337 ***−4809.040.0000
LR chi22477.79815.741272.57
prob chi20.00000.00000.0000
SK = Slovakia
Indep.Coeftp > t
ebitta0.00010 ***3.400.0010
sta−0.000002−0.530.5970
wcta0.00006 ***4.650.0000
const−0.00336 ***−539.590.0000
LR chi252.95
prob chi20.0000
Source. Performed by the authors based on data provided by Amadeus database. Note: *, **, *** statistically significant at 10%, 5% and 1%, respectively. Ebitta = earnings before interest and taxes (ebit)/total assets; sta = sales/total assets; wcta = working capital/total assets.

