Article

Self-Assessment of Driving Style and the Willingness to Share Personal Information

1
Institute for Risk and Insurance, Zurich University of Applied Sciences, 8401 Winterthur, Switzerland
2
Distribution Management, Allianz Suisse Versicherungs-Gesellschaft AG, 8304 Wallisellen, Switzerland
*
Author to whom correspondence should be addressed.
J. Risk Financial Manag. 2020, 13(3), 53; https://doi.org/10.3390/jrfm13030053
Submission received: 6 January 2020 / Revised: 1 March 2020 / Accepted: 7 March 2020 / Published: 10 March 2020
(This article belongs to the Section Risk)

Abstract

:
The availability of better behavioral information about their customer portfolios holds the promise for different and more accurate pricing models for insurers. Changes in pricing, however, are always fraught with danger for insurers, as they enter long-term commitments with incomplete historical information. On the other hand, sharing personal information is still viewed with skepticism by consumers. Which type of personal information are consumers willing to share with insurers, and for what purpose? How would they like to be rewarded for this openness? For insurers, how will the transition shift their risk portfolios? This paper addresses these questions for auto insurance, particularly how the self-assessment of one’s driving style impacts this dynamic. In a survey of approximately 900 Swiss residents, we found that offering a compensation, especially premium discounts, but also services, significantly improves willingness to share information. Higher trust in insurance increases sharing. Women and younger people are more willing to share information. On the other hand, customers are less willing to disclose, to insurers, information not traditionally associated with insurance. The self-assessment of driving style also plays a significant role. More risk-averse driving styles are correlated with higher sharing. Conversely, riskier driving styles are correlated with lower sharing. This result is significant for insurers, as new data-driven pricing and services models should tend to attract less risky customer portfolios.

1. Introduction

Insurance companies have driven adverse selection in competitors’ portfolios by continuously refining underwriting criteria. Historically, most of these criteria have been static, and only recently have companies been able to incorporate into pricing schemes information directly related to risk. As more precise and more timely information about actual customer behavior becomes available, the industry is poised to introduce true behavioral pricing models which are able to calculate premiums based on actual customer behavior. For example, in automotive insurance, companies will no longer need to rely on risk proxies such as age, gender, number of previous claims, etc., but will directly collect and analyze driving information such as speed, length and time of driving, acceleration, distance to the car in front, g-forces in turns, etc., to determine the appropriate premium.
While it is possible that the introduction of autonomous vehicles (AV) renders this opportunity moot, it is not clear when and how quickly fully autonomous AV will be introduced. Indeed, the launch date for mass production keeps getting pushed back, and several researchers have identified significant technological, infrastructural and legislative issues that will need to be addressed and resolved for AV to leave testing programs for full market introduction. It is therefore likely that human-driven vehicles will dominate the market for several more years to come, and that behavioral pricing will provide significant advantages for automotive insurance. In addition, similar real-time data-driven behavioral models can play a significant role in home and health insurance.
One of the most significant challenges for the insurance industry, however, is obtaining access to this behavioral information. Insurance companies are not natural owners of this information, and they need to collect it through direct agreement from their customers and the appropriate technological infrastructure. Although driving information is collected and available in car management systems, insurance pay-as-you-drive (PAYD) models have traditionally relied on additional hardware or a connection to a customer’s smart phone to access this information, and customers have been open to this arrangement with the promise of discounts for safer driving. Nonetheless, PAYD models have struggled in the industry, and typically face a significant challenge in managing physical devices.
The need for customers to agree to share their personal information poses a significant risk management challenge for insurers. Especially in the transition phase, as new underwriting and pricing models are being developed: what kinds of customers are open to sharing their information, and why? This question is not trivial: if, for example, aggressive or risky drivers are overwhelmingly more open to PAYD models, the risk of the insured portfolio will be heavily skewed and potentially significantly underpriced. In this paper, therefore, we investigate whether a driver’s self-assessment of their driving style impacts their willingness to share behavioral data with insurers. More traditionally, we also look at how gender, age, trust and benefits impact this willingness to understand how significant self-assessment is in relation to these factors.
This research is linked to three significant bodies of literature pertaining to the importance of customer data in insurance, the willingness of customers to share personal information with companies and the ability of drivers to accurately and consistently assess their driving style.

1.1. Customer Data in Insurance

Insurance companies use customer data to classify risks and develop pricing structures. Lack of access to this information leads to inaccurate pricing and it is a strategic challenge for insurers. Rothschild and Stiglitz (1976) developed an approach to avoid information asymmetry due to customer non-disclosure of relevant information. However, not all adverse selection is due to this phenomenon, and more recent research reports inconsistent support for this dynamic (Cohen and Siegelman 2010; Thomas 2017).
Cather (2018) proposes a cream-skimming dynamic to adverse selection, in which insurers using better customer data are able to identify competitors’ overpriced customers and attract them to their portfolio. Insurers use a number of variables to place customers into risk pools and determine pricing. More precise models allow for more accurate premiums, and companies who are not able to match the models of their more innovative competitor will lose low-risk customers (Maurstad et al. 2001). Interestingly, customers may not be aware of the information triggering the improved pricing, nor do they necessarily welcome the higher premium differentiation. However, historically, insurance markets have typically evolved to more precise risk classification models and differentiated pricing.
In the early 1990s, insurers started using consumer credit scores to price policies, with dramatic results: the United States Federal Trade Commission estimated that 59% of customers saw a decrease of up to 30% in their premium, while 41% saw an increase of up to 60% (Federal Trade Commission 2007). A similar revolution may be in progress with usage-based insurance (UBI) where actual driving behavior is linked to risk and informs pricing. This allows a further development of risk classification into individual, behavior-based pricing. UBI, however, also poses significant challenges for insurers: first, it is not clear how exactly the behavior is linked to risk. Secondly, managing a physical device and variable monthly billing are not traditional components of insurance business models. These factors also make UBI models difficult to copy, and can build significant barriers to entry for slow-moving competitors (Cather 2018).
Insurance pricing models based on driving behavior (referred to as pay-as-you-drive, or PAYD) can more closely align premiums with risk exposure and provide incentives for drivers to minimize risks and emissions. Paefgen et al. (2013) find that even a relatively limited set of variables (time of day, day of the week, road time, average velocity and mileage exposure) are good predictors of risks, and show the promise of PAYD models even as they concede their challenge to current actuarial models due to the volume and complexity of the underlying data required. Technological innovation and digitalization in particular, present challenges for insurers. Accessing customer information should allow for improved risk-based pricing. However, it is not clear that customers will be willing to share this information. Genetic information, for example, may be deemed unfair but may be valuable for prevention. In general, however, more information and more precise pricing should provide a strong signal to change risky behavior and decrease moral hazards, and should therefore have a significant impact on insurance (Eling and Lehmann 2017).

1.2. Willingness to Share Personal Information

People are willing to share information in exchange for some benefit subject to the privacy calculus, an assessment that their information will be used fairly and they will not suffer negative consequences. They perceive information requests to be less invasive when (a) the information is collected in the context of an existing relationship; (b) they can control the future use of the information; (c) the information is relevant to the transaction and (d) the information can be used to draw reliable and valid inferences (Stone and Stone 1990). Thus, companies and customers engage in a social contract whereby companies use information to provide better services, and customers exchange their information to benefit from these improved services. As companies become better equipped to collect and analyze customer data, customers are becoming more suspicious about what companies know and what they should know about their needs, wants and behavior. The customers’ willingness to share information (WSI) is linked to trust in the company, which in turn is driven by past experience, as well as by the reputation and perceived dependability of the company (Schoenbachler and Gordon 2002). Explicit and communicated procedural fairness—providing customers with a voice and control over the outcomes—can have a major impact on trust and has been shown to mitigate privacy concerns (Culnan and Armstrong 1999). Privacy concerns diminish WSI on social media, and trust is a significant driver of sharing behavior on social media platforms. However, people are willing to share information with their smaller circle of friends regardless of the trust placed on the platform (Lo and Riemenschneider 2010). Tsai et al. (2011) found that consumers are more likely to purchase from sites with more prominently displayed and stricter privacy conditions, and are willing to accept up to a 4% price premium for improved privacy. This was observed for lower-priced items, and an upper bound in absolute terms may exist for higher-priced items. Acquisti et al. (2013) performed a field experiment among US female shoppers and found that consumers place a much higher valuation on disclosing otherwise protected data than paying to protect their data. In addition, they find that the sequence of presenting options impacts consumer preferences significantly: presenting privacy enhanced options before their less privacy protective alternatives increases the preferences for them.
Online shoppers are more open to sharing information with advertisers than with data brokers and more open to sharing name, location and other demographic information than behavioral, financial or health information. Younger consumers are more likely to share information, as are male respondents (Jai and King 2016). Miesler and Bearth (2016) developed scenarios in health, retail and finance to find that consumers are relatively unwilling to share financial and behavioral data but comparatively more open to sharing demographic information. Explicit articulation of the benefits of sharing information and control over its use increases the respondents’ WSI.
Grouping respondents by privacy concerns in three categories—(a) Fundamentalists, who view privacy as an especially high value; (b) Pragmatists, who weigh the value to them and society of personal information; and (c) Unconcerned, who have little problem with supplying personal information—has a significant impact; WSI. Fundamentalists are significantly less willing to share personal information regardless of other factors, while Unconcerned are significantly more open to doing so. Contrary to previous research which estimated the split at 25/55/20 percent, Jai and King (2016) found the split among online shoppers to be 70/15/15 percent, suggesting a strong need to leverage other methods (e.g., loyalty programs) to obtain personal information from Fundamentalists. Perceived value is also a key driver of WSI in non-online markets and WSI has in turn a strong effect on customer loyalty. However, it has at best a weak effect on share of wallet (Leppäniemi et al. 2017). In addition, WSI decreases as the number of recipients increases, whereas social distance and the amount of information disclosed have no impact. Interestingly, female respondents are less likely to share body information with close recipients and males are less likely to share information if they believe the information will be verified (Schudy and Utikal 2017). One of the most significant challenges remains the privacy paradox—the claim that users are very concerned about the privacy of their personal data and the remarkable lack of activity to protect it. This paradox is pervasive can arise in both rational and irrational decision processes; it is further complicated by the widespread use of mobile devices and there are as yet no concrete proposals to address and correct it (Barth and de Jong 2017).

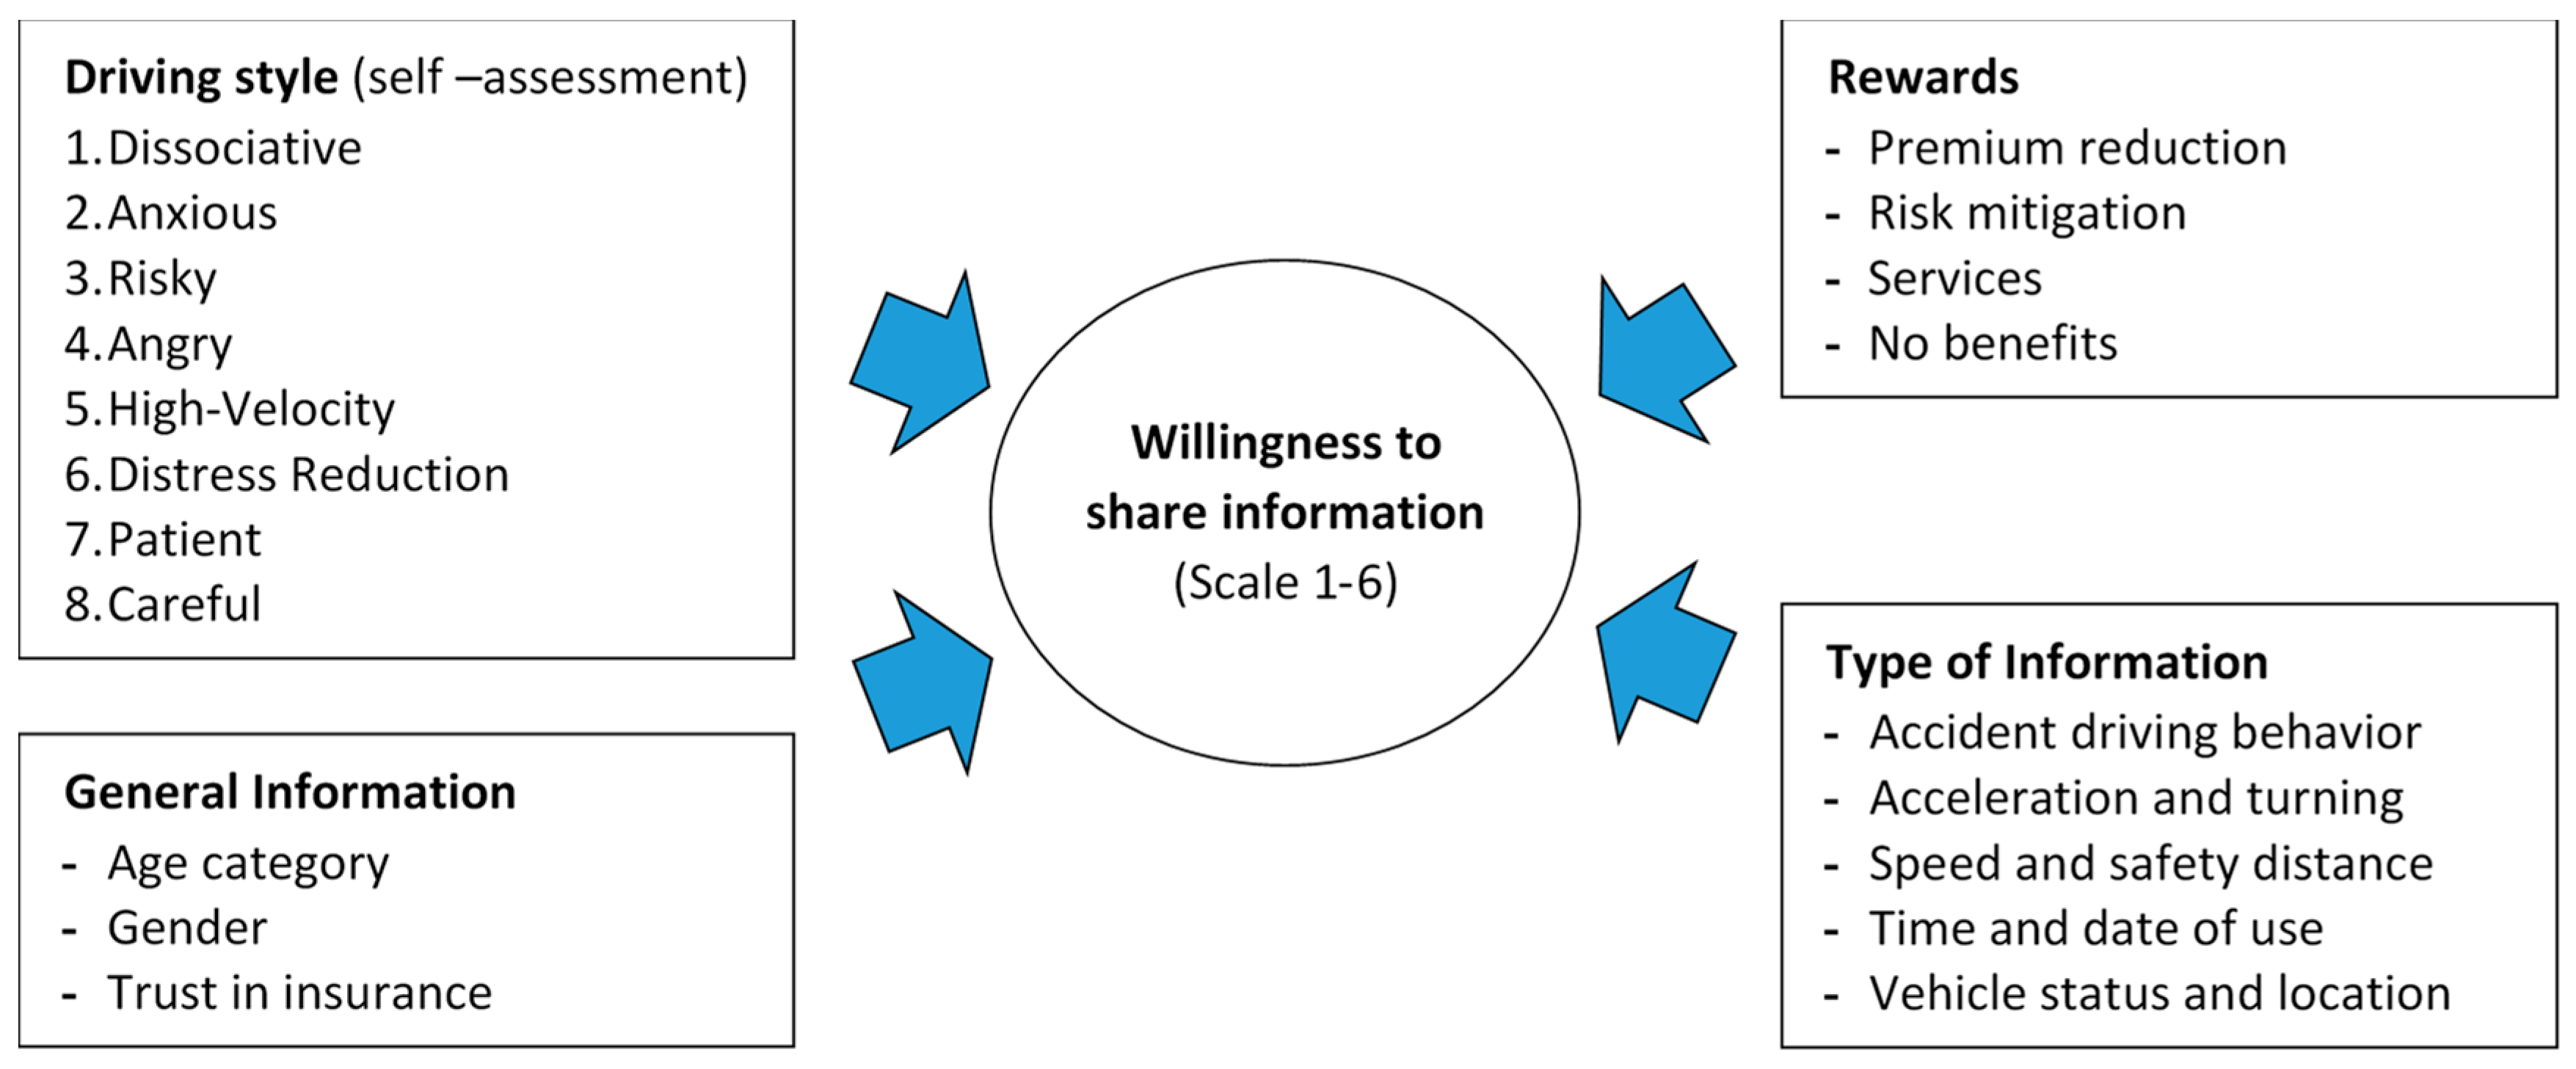
1.3. Self-Assessment of Driving Style

Dunning et al. (1989) found that people predominantly provide self-serving assessments that appear objectively indefensible, and proposes that this is due to the fact that the meaning of most characteristics is ambiguous, thus allowing people to use self-serving trait definitions. Interestingly, he found that people ascribe to themselves more of a given characteristic than their peers, independently of whether it is a positive or a negative characteristic, and that gender does not influence the results. In a subsequent paper, Kruger and Dunning (1999) found that this overly favorable view of one’s abilities correlates with lack of skill in that domain and links it to a lack of metacognitive skills to realize this error of assessment. Paradoxically, improving skills, and thus improving metacognitive competence, helped people realize the limitations in their abilities and lowered their self-assessments. This bias persists across several real-world domains (health, education and the workplace): People are unrealistically optimistic about their own health risks; students seem largely unable to assess how well they have comprehended new material and employees to CEOs display overconfidence in their judgement (Dunning et al. 2004). However, Ross (2006) found that self-assessment can improve student behavior and that its accuracy can be enhanced through training.
Drivers similarly overestimate their capabilities and rate themselves positively on all scales and higher than the average driver. This results holds for U.S., Spanish and West German drivers, albeit with some differences across the countries. Additionally, in general, men assess themselves more positively than women, and older drivers more positively than younger drivers (Sivak et al. 1989). This overestimation is consistent with a “positive-self” bias rather than a “negative-other” bias. Men display this bias in all driving components examined, while women rank themselves as no better than the average in some components. These gender differences were found to be substantially reduced when driving experience was controlled for (McKenna et al. 1991). Groeger and Grande (1996) found that positive self-assessments were primarily influenced by driving experience, gender and neuroticism, but found no evidence to suggest that “unrealistic optimism” influences drivers’ self-assessment. However, Amado et al. (2014) found that drivers evaluate their own performances higher than experts’ appraisals, and that the gap is higher for the more unsafe drivers.
On the other hand, the self-assessment of driving skills is also linked to objective measures of driving ability: French et al. (1993) found that drivers who scored low for thoroughness were at greater risk of traffic accidents, independently of age, gender and other factors. For drivers over 60, hesitancy and faster driving were also associated with higher accident risk. Additionally, West et al. (1993) found a correlation between self-reported and observed driver behavior for several important variables, including speed, calmness and attentiveness. The link was also measurable for overall ratings of driver skill and safety, indicating that certain self-reported aspects of driving behavior can be used as surrogates for observations. Sundström (2008) found that drivers consistently over-estimate their abilities when comparing themselves to an “average driver.” However, this is more a function of the instrument than an overestimation on the part of the drivers polled. The self-assessment instruments, therefore, should frame judging a driver’s own skills by comparing themselves against specific criteria of driver competence, thus avoiding the “average driver” reference problem. These results are further validated across age and gender in a later paper (Sundström 2011).
Reason et al. (1990) developed the Driver Behavior Questionnaire (DBQ) to understand the difference between driving errors and traffic violations and find significant differences between them. Violations can be explained by social and motivational factors and decrease with age. Errors are linked to individual characteristics and ability to process information, and are not impacted by age. In addition, men commit more violations than women, whereas the reverse is true for errors. Parker et al. (1995) confirmed these results and found a link between accidents and self-reported driving violations, but find no such link for self-reported errors. De Winter and Dodou (2010) reported 174 studies using DBQ across several countries. Among others, Greece (Kontogiannis et al. 2002), the United Kingdom, Finland and the Netherlands (Lajunen et al. 2004) and Denmark (Martinussen et al. 2013). Harrison (2009) found that novice drivers commit more violations than more experienced drivers and that gender differences exist also among novice drivers. Özkan et al. (2006) investigated the stability of the DBQ over time and found that young male and middle-aged female drivers report the largest changes in self-reported driving behavior, whereas drivers with high annual mileage at both time points of the study showed the strongest stability.
Taubman-Ben-Ari et al. (2004) developed a reliable and valid self-reporting instrument for driving styles, the Multi-Dimensional Driving Style Inventory (MDSI). Their findings indicate eight internally coherent factors of driving style which also correlate with personality traits, sociodemographic characteristics, involvement in car accidents and commission of driving offences. In particular, three of the eight factors were associated with a cluster of maladaptive traits. De Craen et al. (2011) used MDSI to investigate the differences between experienced and novice drivers, while Özkan and Lajunen (2006) used it to investigate gender differences. Martinussen et al. (2014) linked the DBQ and MDSI instruments and find broad consistency among them, showing that drivers have consistent judgement of their abilities. A subsequent review of the MDSI found some age, gender and ethnic correlations in the results, but no impact from other sociodemographic characteristics, indicating that the eight factors represent relatively stable and universal traits (Taubman-Ben-Ari and Skvirsky 2016). Additionally, risky and hostile styles, as reported by young drivers in the MDSI, correlate with risky behavior measured with in-vehicle data recorders and self-reported reckless driving habits, and risky behavior observed in a driving simulator. Thus, self-reporting is a reliable tool for assessing driver behavior (Taubman-Ben-Ari et al. 2016).

1.4. Insights and Research Focus

Insurance companies have a real strategic need to develop better, data-driven insights in the driving behavior of their customers to accurately price risks and avoid being adversely selected against by more proficient competitors. Customers, on the other hand, may or may not welcome this closer scrutiny and increased transparency. While they may not always take actions consistent with the value they place on the privacy of their data, customers in general expect some reward for sharing information. A trusted relationship and a clear link to the subject matter increases the willingness to share the information.
This research aims at understanding which type of information customers are willing to disclose to motor insurance providers and how different incentives, age, gender and level of trust impact this willingness to share. Further, we use the Multi-Dimensional Driving Style Inventory (MDSI) to investigate how drivers’ self-assessment of driving style impacts their willingness to share information. This insight is of particular interest for insurers as they develop new pricing models and ecosystems: the riskiness of early portfolios is likely to have a significant impact on the attractiveness of these new business model for insurers.

2. Materials and Methods

The research question was addressed using a survey based on the MDSI questionnaire. Participants were queried on their driving style, willingness to share information by type and preference for potential rewards, as shown in Figure 1.
The survey was conducted in April 2019 among students of the Zurich University for Applied Sciences, but participants were also free to send the link to others: 895 respondents completed the survey—373 men and 522 women; 680 had a motor insurance policy; 49% of respondents were 24 years old or younger, as shown in Figure 2.
Because of the uneven age distribution of respondents, the research can paint a profile of the differences between Millennials—adults 18 to 24 years old at the time of the study—and older respondents. Due to the low number of responses in the older age cohorts, we collected them into one group, 25 years old and older. This distinction is of interest to insurance companies, as it tends to match the age threshold between new and existing customers.
Participants were asked to describe their driving style by rating on a scale from 1—not at all, to 6—very much, each item on the MDSI questionnaire to the extent that it fits their feelings, thoughts and behavior while driving. They were then asked to rate their level of trust in their insurance company from 1—not at all, to 6—very much, and their willingness to share different types of information with their insurance company from 1—yes, to 6—never as shown in Table 1. Finally, they were asked to provide information regarding their age and gender.
The complete content of the MDSI questionnaire for driver self-assessment included in the survey is shown in Table 2.
We analyze the data to determine the correlation between different factors and the willingness to share information. First we investigate the statistical significance of each dimension on the willingness to share information using ANOVA with a threshold for type-1 errors α < 0.01. Where needed, we apply a Bonferroni correction for the threshold p-values by dividing the pair-wise threshold p-values by the number of categories compared. Second, we investigate the impact of this correlation; i.e., the amount by which a distinction in each dimension changes the willingness of the respondents to share their information. Impact allows us to understand the relative importance of each dimension, and is necessary to prioritize potential portfolio selection criteria for practical insurance applications.

3. Results

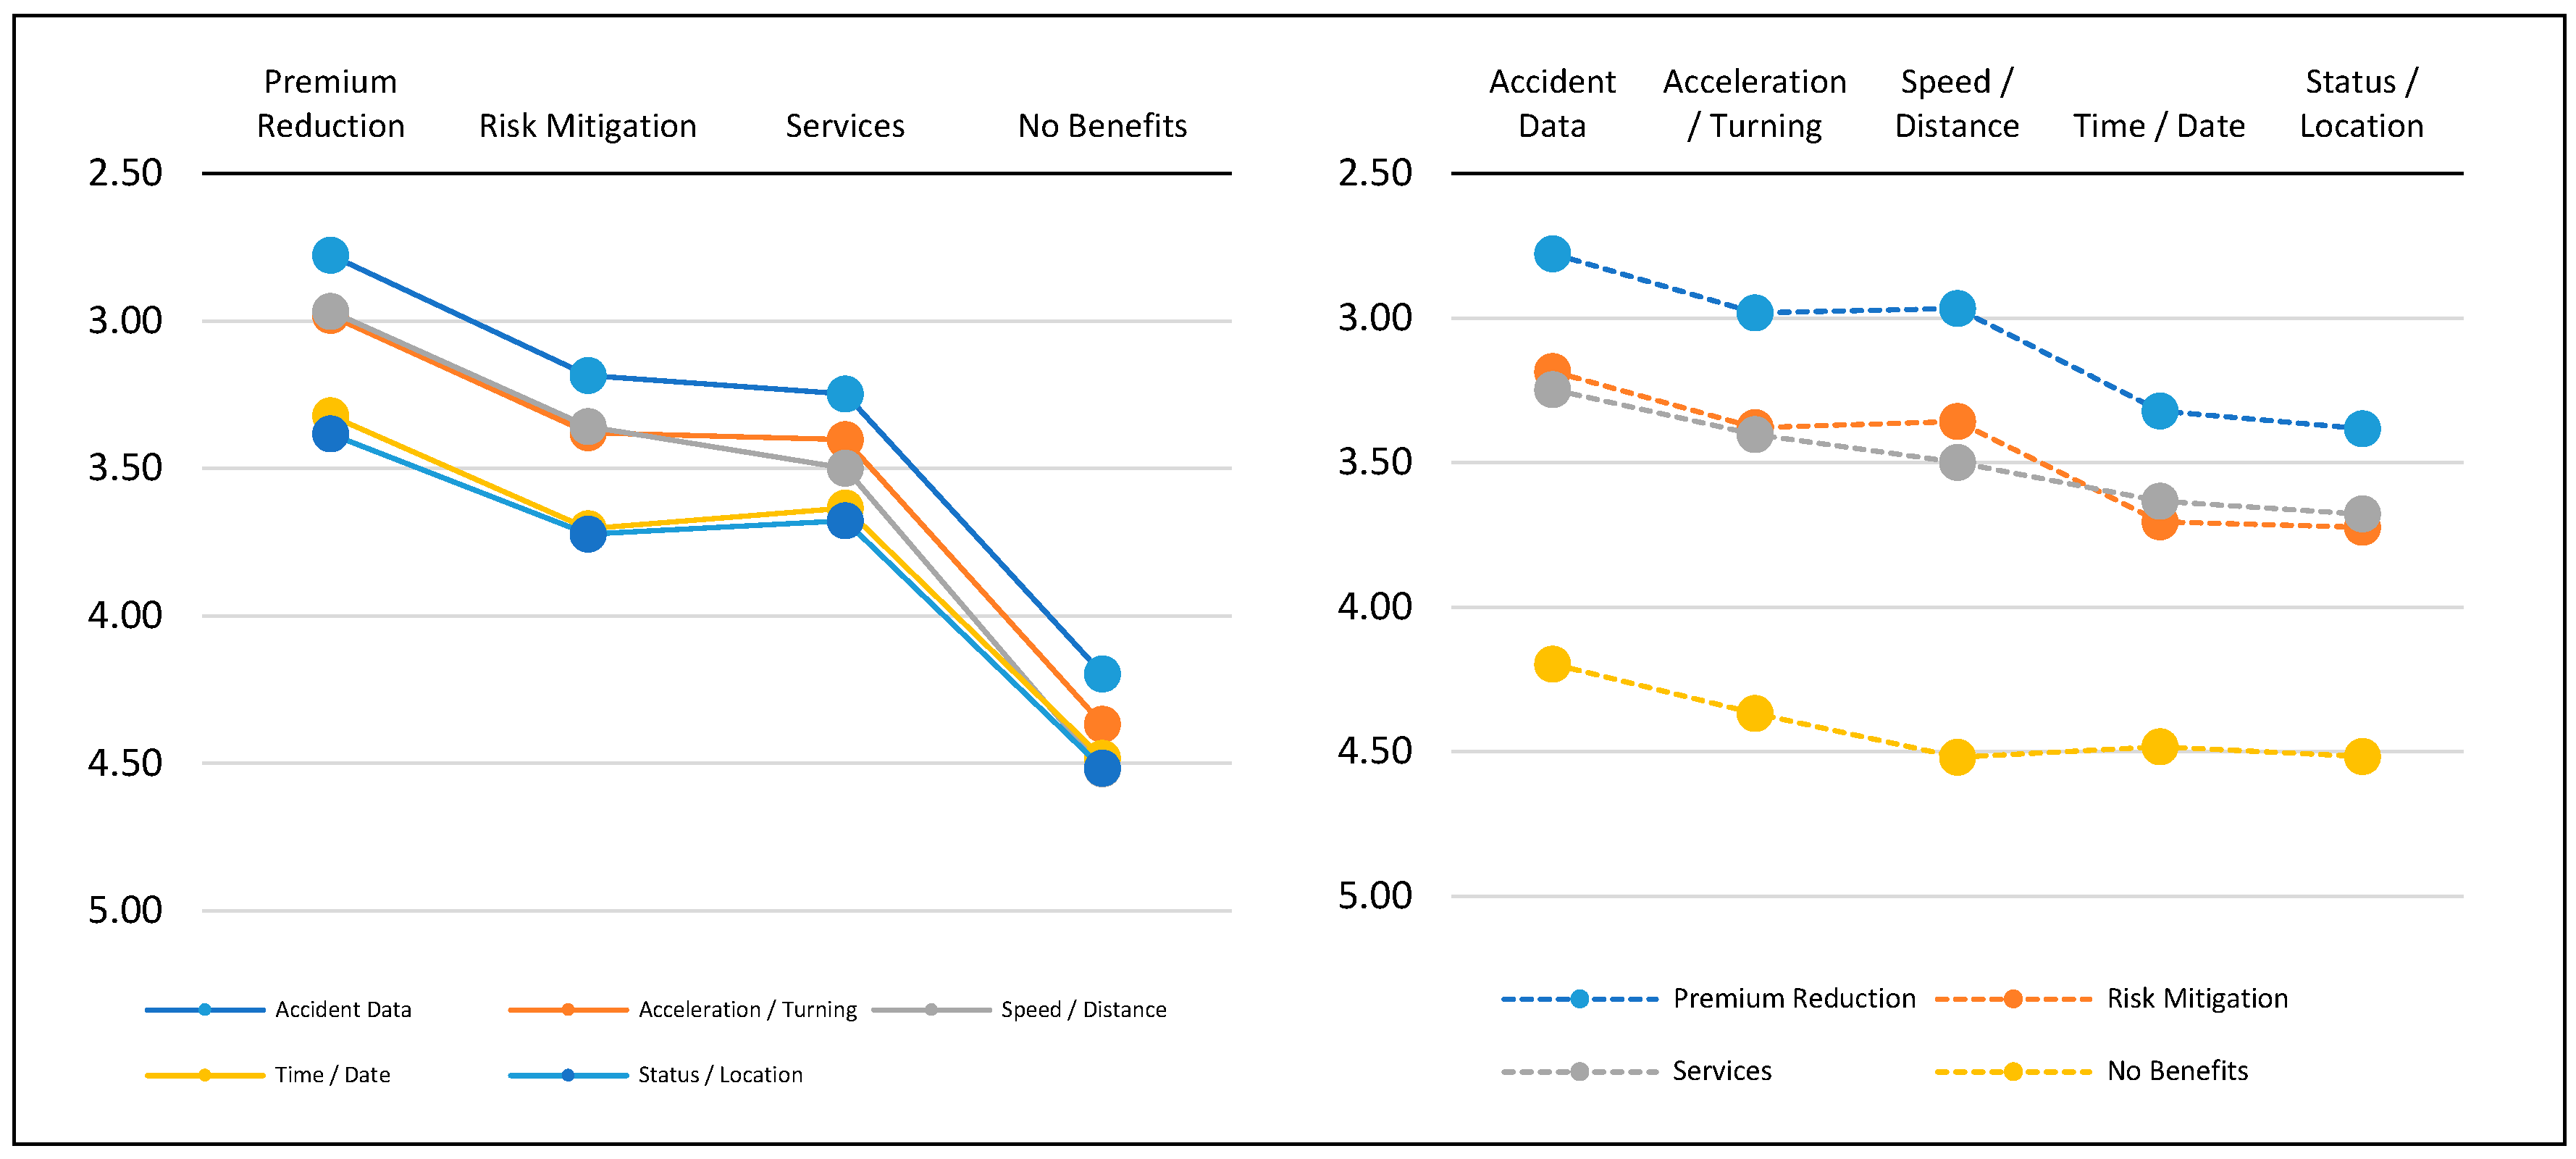
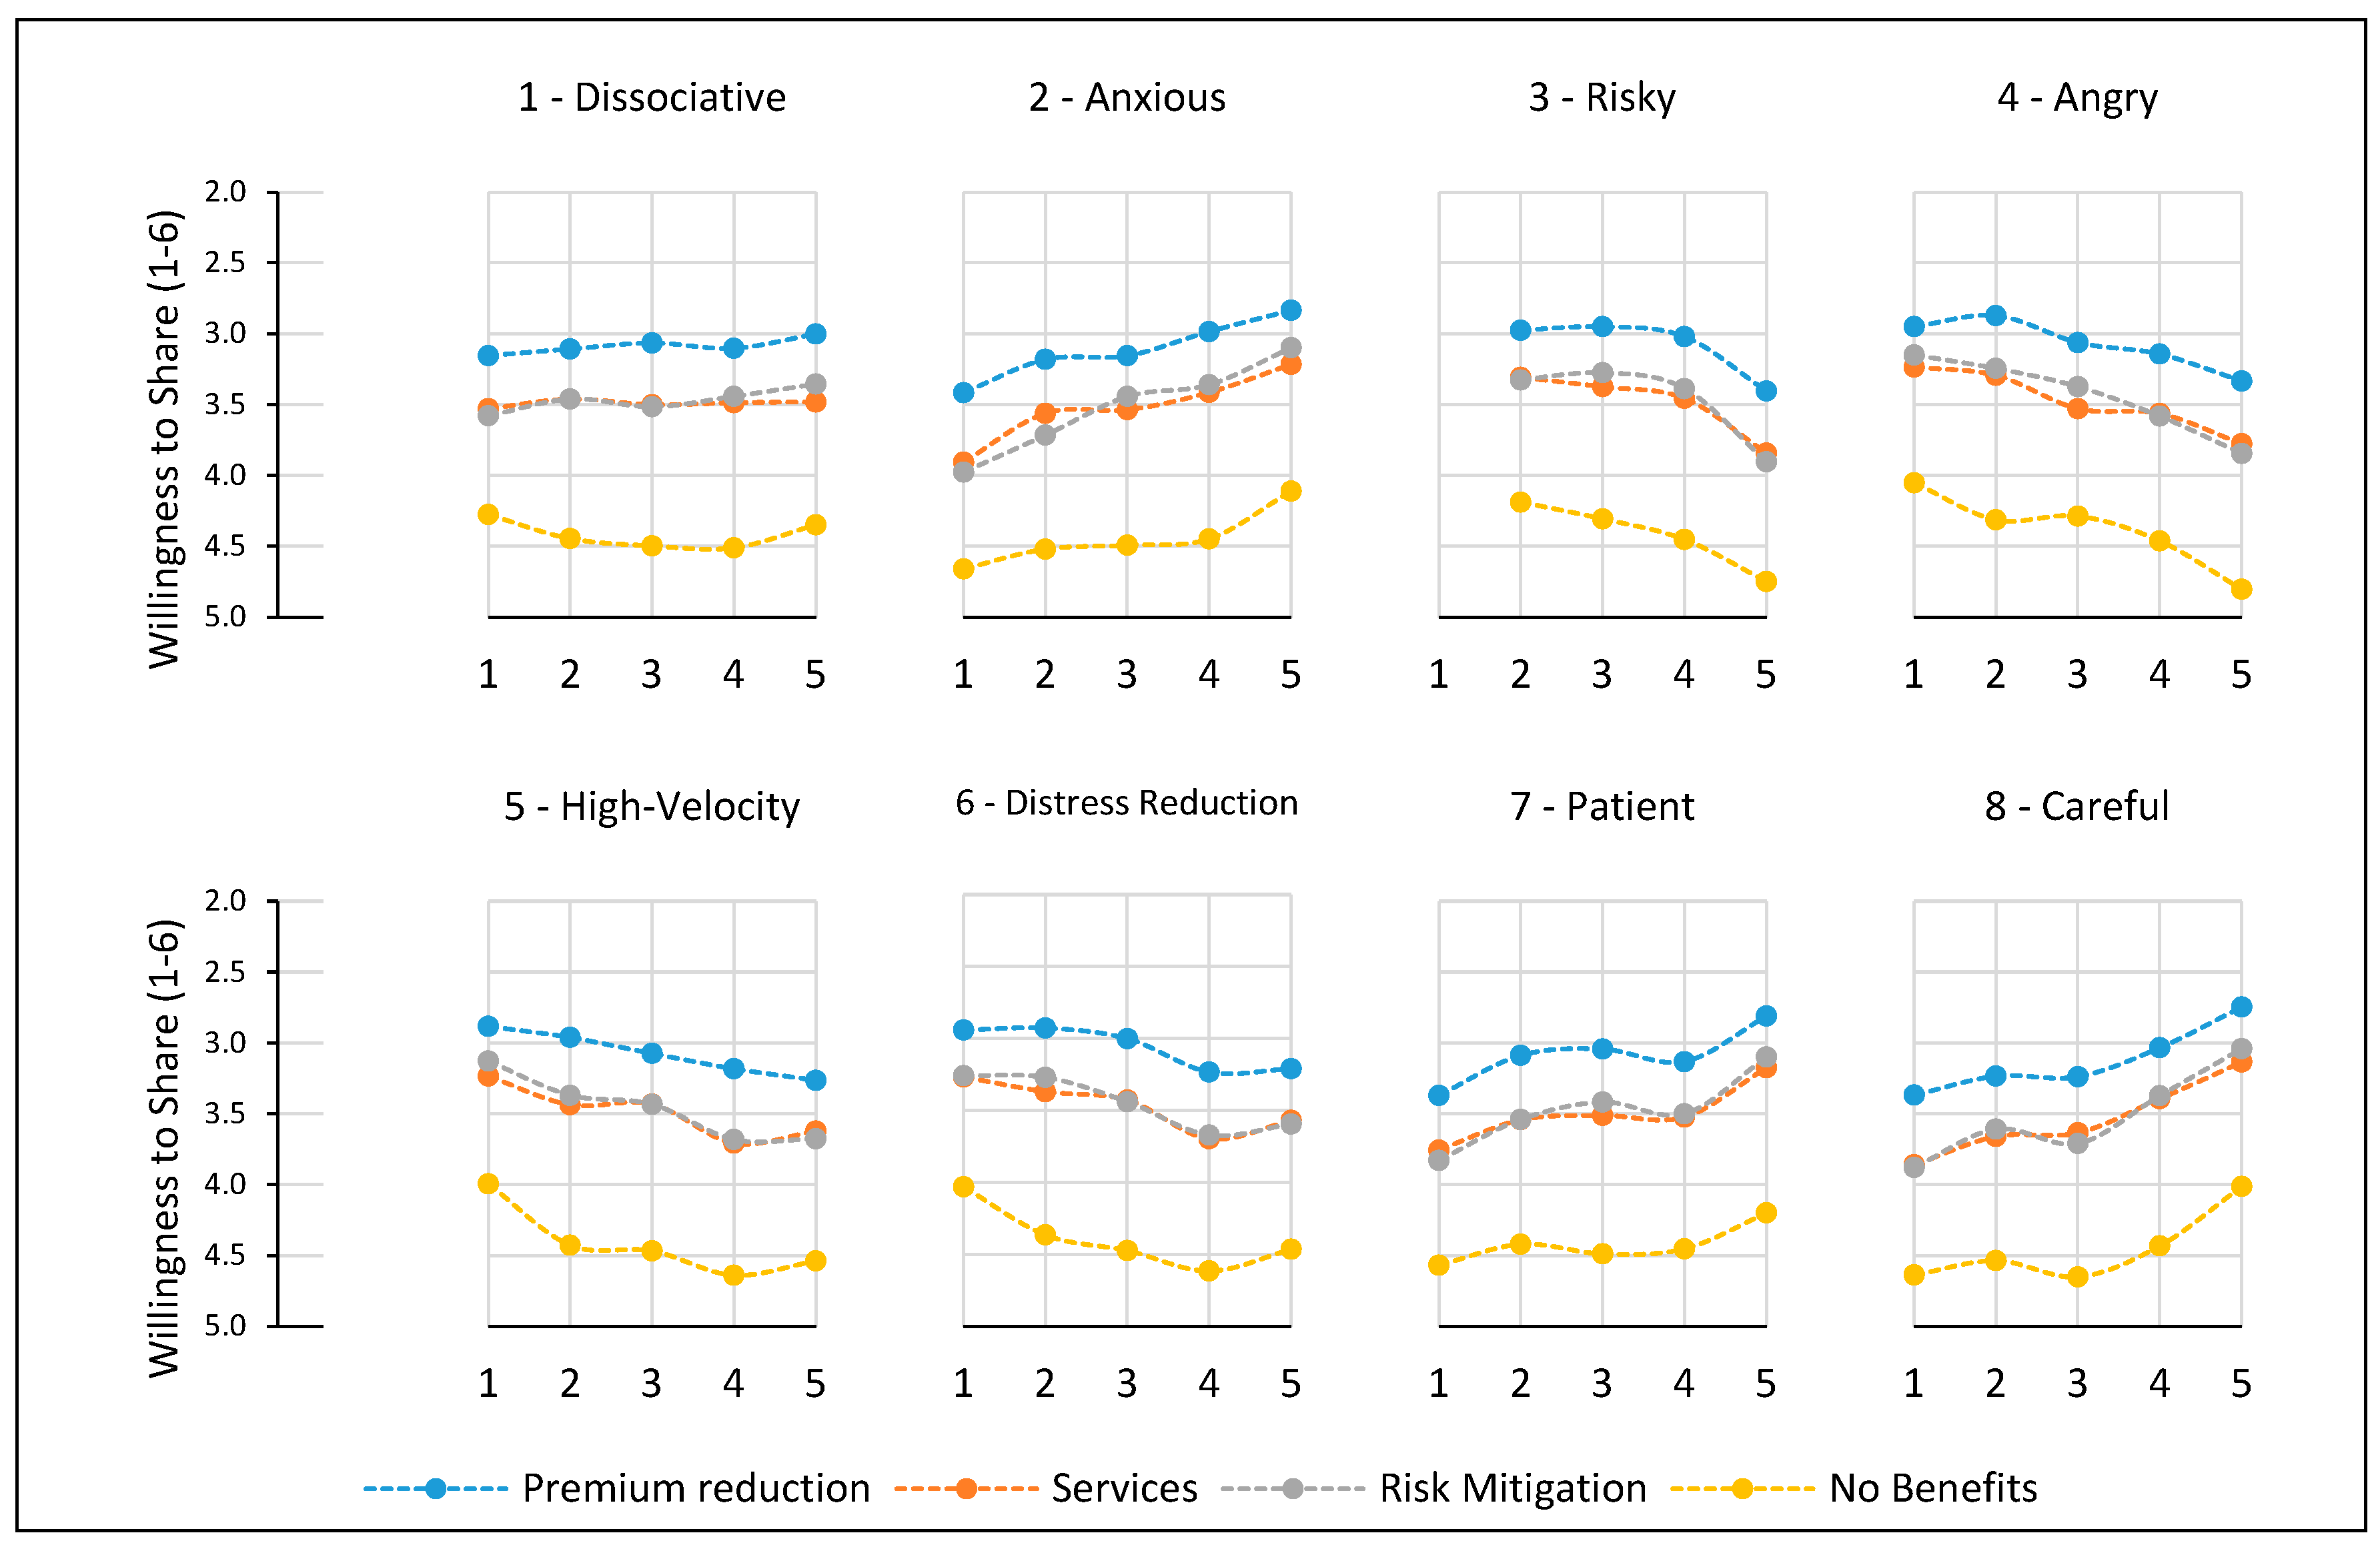
3.1. Overall Willingness to Share

The willingness to share among all respondents has been tabulated by type of information and benefit received in Table 3. The results have been tabulated according to strength of preference and not according to the sequence of questions in the survey. This sequence, from stronger to weaker preference, will be retained throughout the paper.
Several interesting observations can already be made at the aggregate level:
  • The overall value of 3.62 (on a scale of 1–6) shows a somewhat restrained willingness to share information with insurance companies.
  • The type of benefit offered has the highest impact on the willingness to share, with the offer of premium reduction providing an impact of some 1.3 vs. offering no benefits (3.09 for premium reduction vs. 4.42 for no benefits).
  • Risk mitigation and other services also impact the willingness to share significantly, but not as much as a financial incentive. The difference between these two factors is not statistically significant.
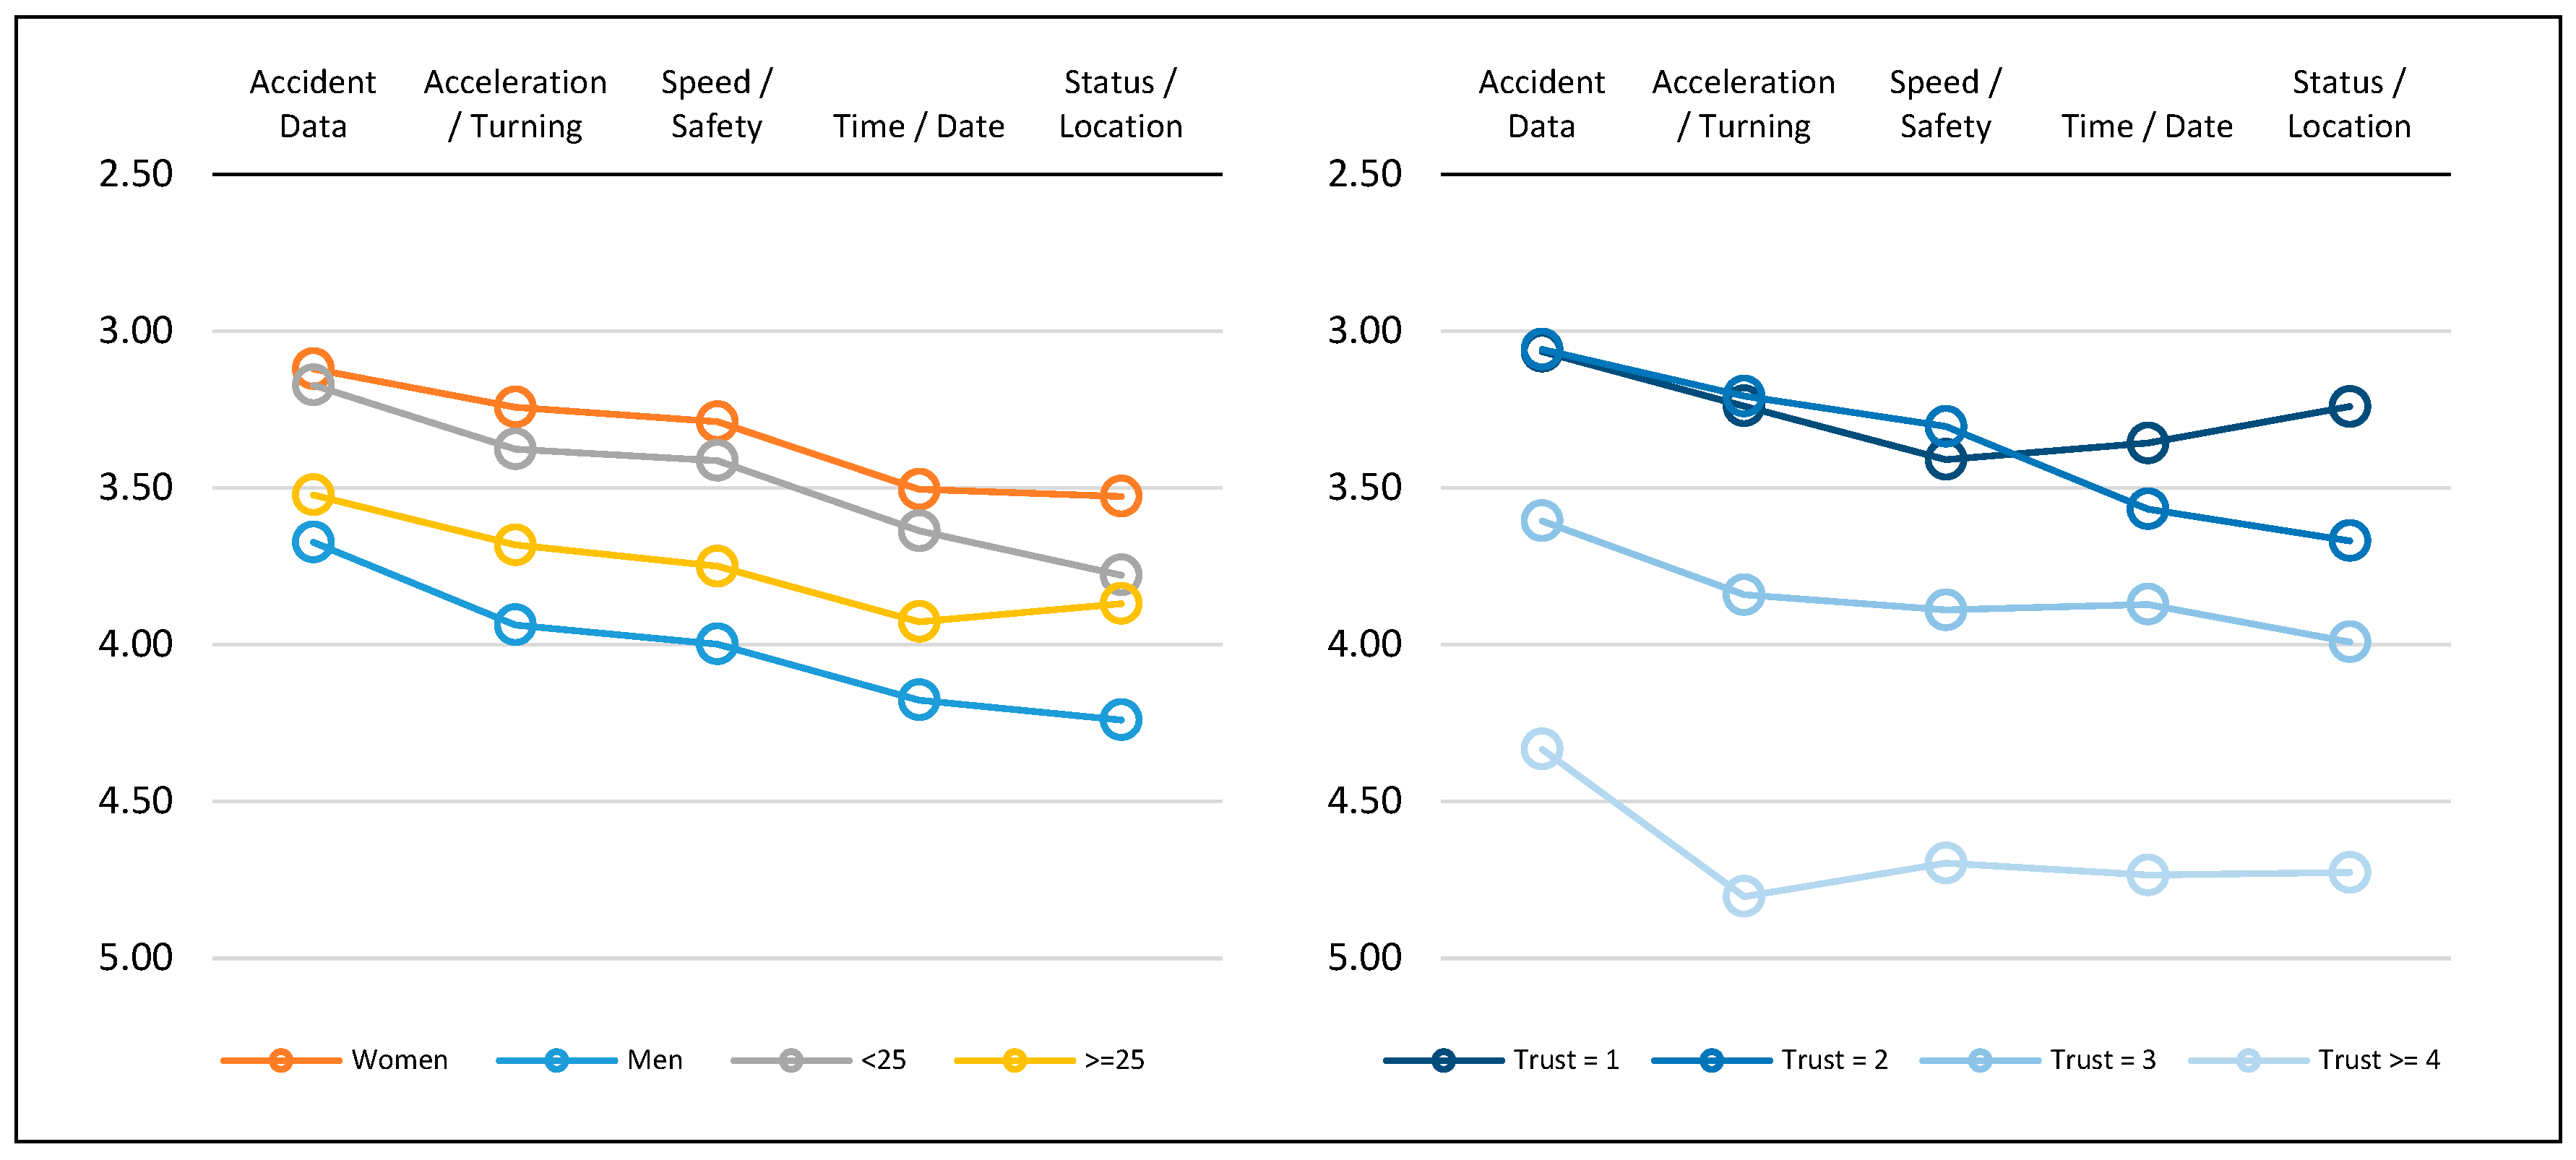
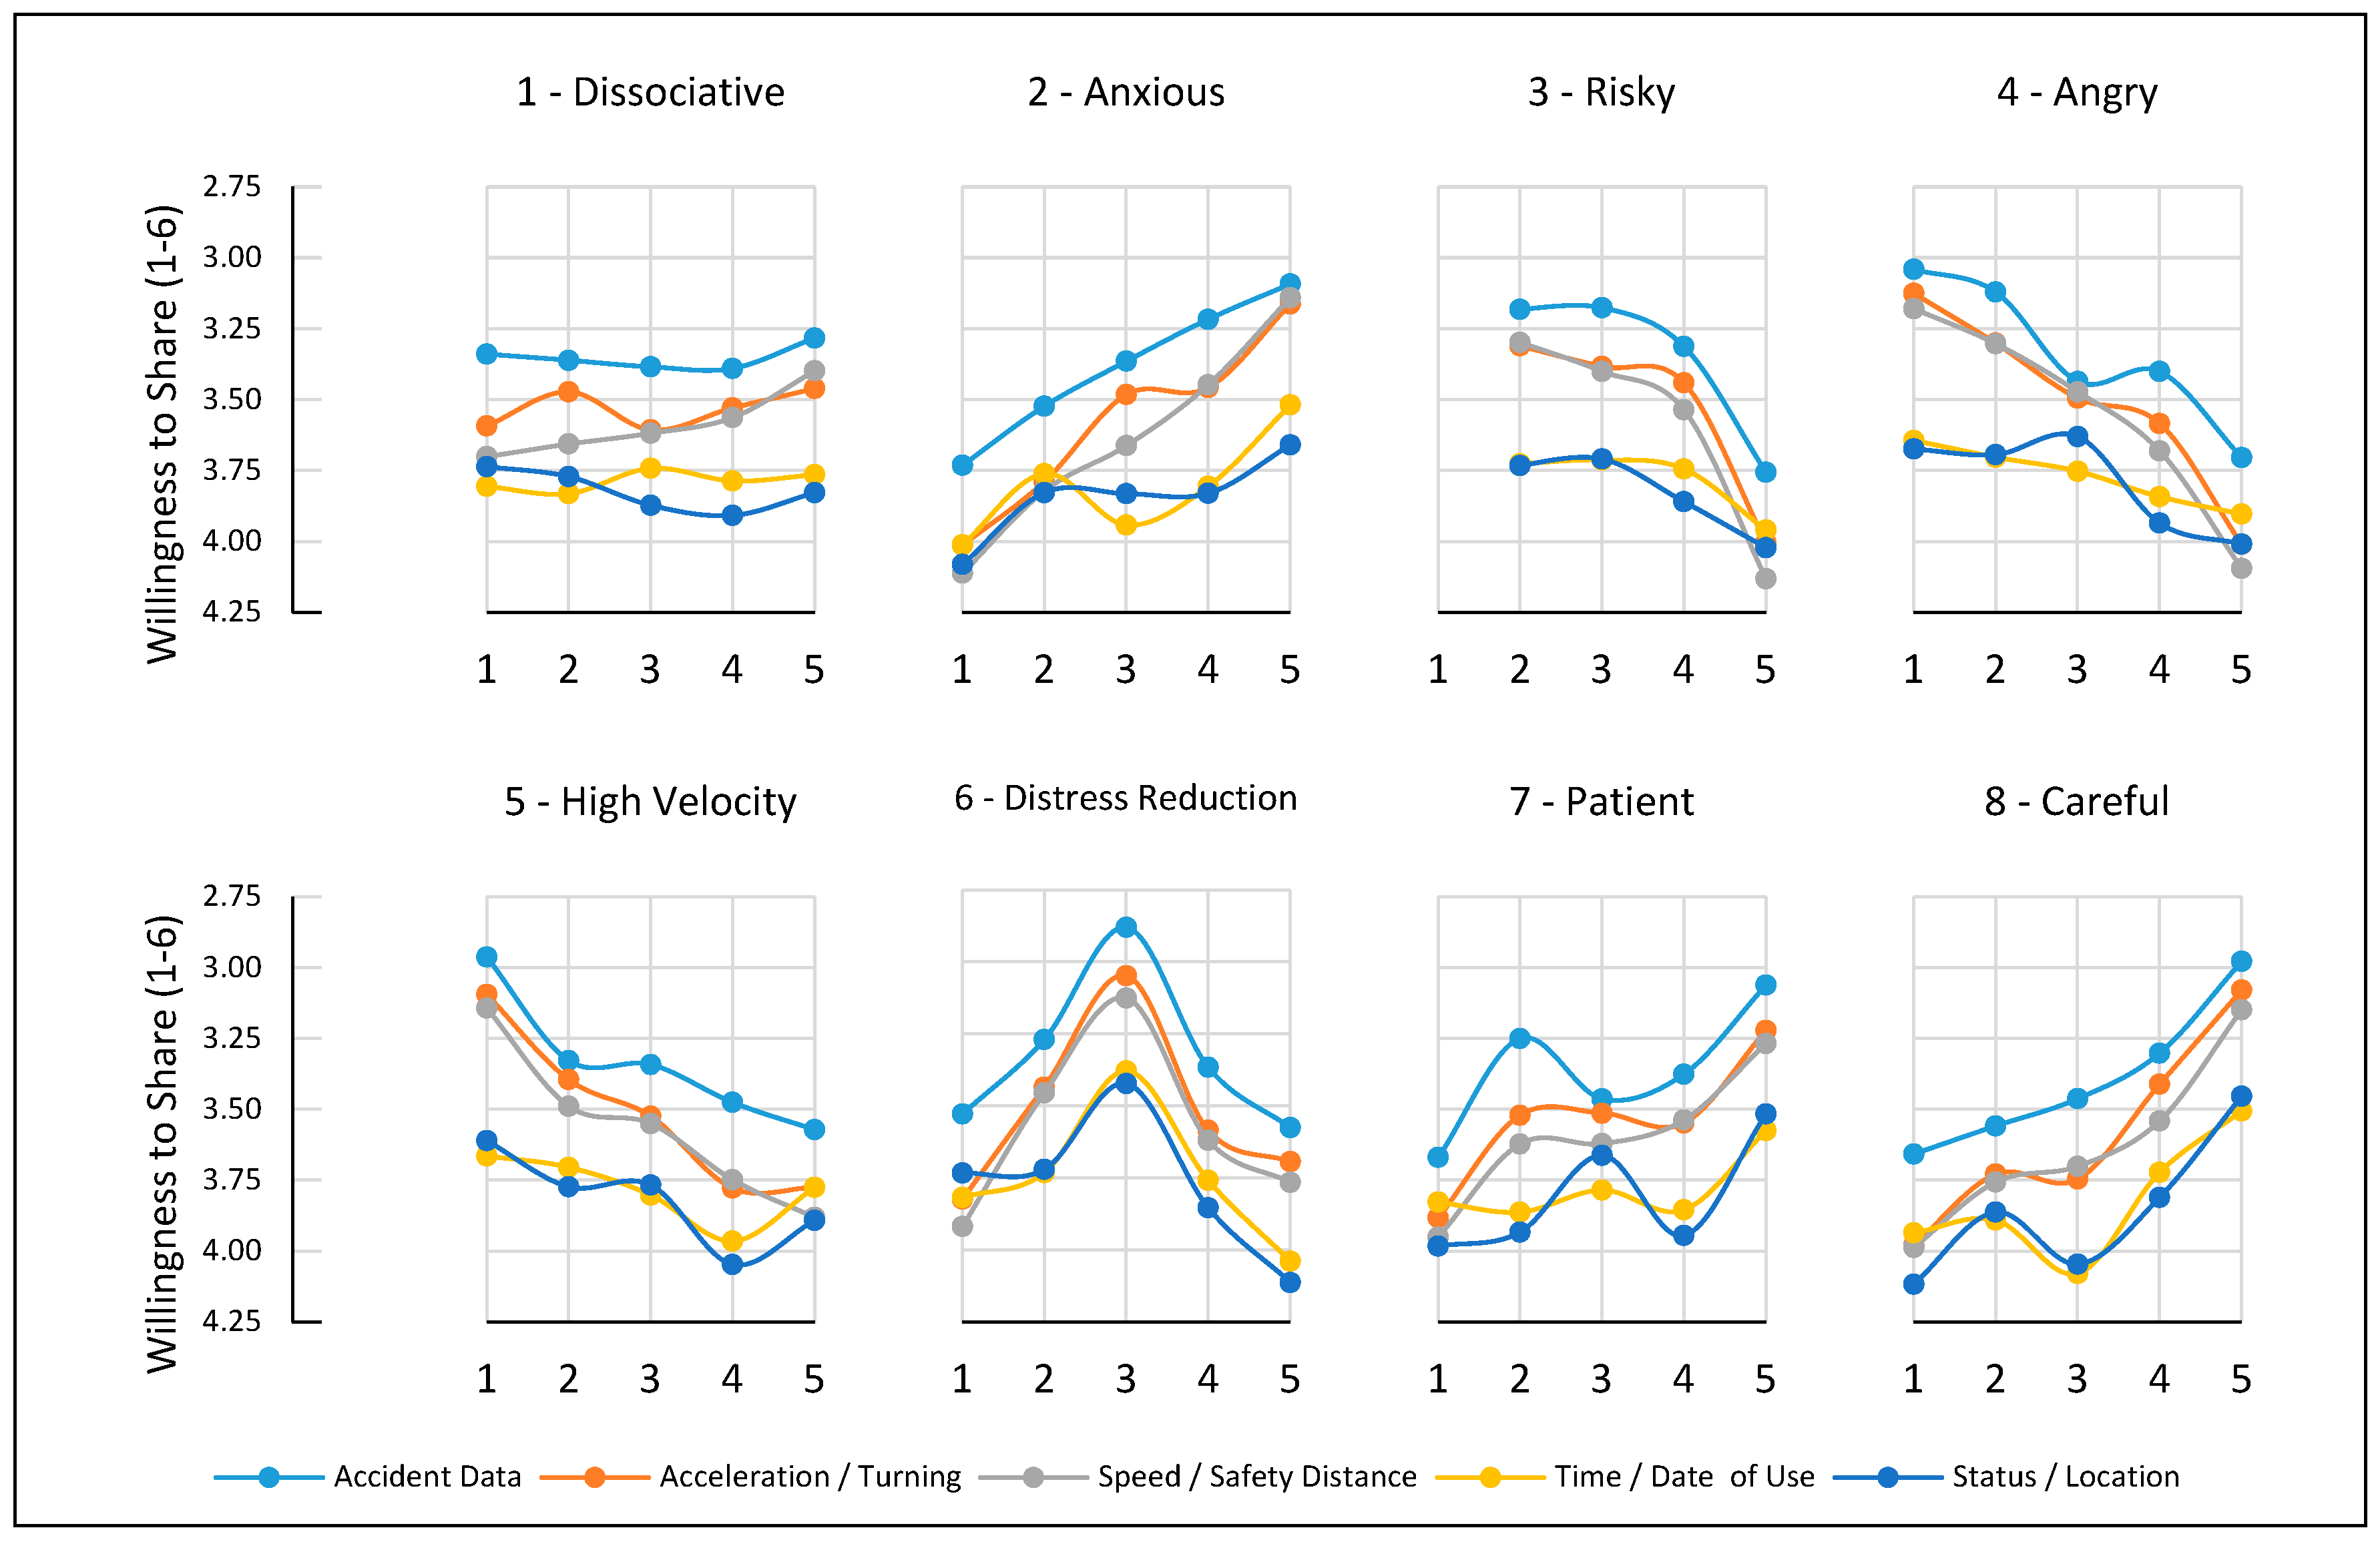
  • The type of information requested also impacts willingness to share significantly. The more the information is relevant for current insurance purposes (e.g., adjusting a claim), the higher the willingness to share it. By contrast, customers are more reluctant to share general personal information, such as vehicle location and usage patterns.
The information has also been displayed in Figure 3, organized by either type of benefit or by type of information.
The insights from the aggregate data hold also when viewed in greater detail: the willingness to share is higher for information that appears more immediately relevant to insurance processes and lower for information closer to surveillance. Offering some kind of benefit significantly increases the willingness to share, with financial compensation proving most effective in driving willingness to share.
The impact of gender, age and trust in insurance on sharing information by type is shown in Figure 4.
Women are more open to sharing information than men, with the difference remaining roughly constant across the different types of information. Younger respondents are more open to sharing information than older respondents, with the difference remaining roughly constant across the type of information, with the exception of a convergence in the willingness to sharing vehicle status and location information. This is due to an atypical increase for respondents over 25.
Higher trust in insurance drives a higher willingness to share information across the board. Low trust prevents sharing of information, except, to some extent, for information useful for claims adjusting. Customers with higher levels of trust are also more open to sharing details about the location, status and usage of their vehicles.
The impacts on customers’ willingness to share information from type of information, type of benefit offered, gender, age and trust in the current insurance company are summarized in Table 4. The differences within each of the dimensions are in most cases statistically significant with least 99% confidence. When multiple comparisons were needed, the p-value for an α threshold of 0.01 was calculated by applying a Bonferroni correction.
We can distinguish three categories for the type of information: accident information (a), driving information (b,c) and general personal information (d,e). As the information becomes less relevant for the current insurance business model, the customers’ willingness to share it with their insurers diminishes. Similarly, we can distinguish three categories for the type of benefit offered: premium reduction (f), other benefits (g,h), and no benefits (i). Further, age, gender and level of trust in insurance all have statistically significant impacts on the willingness to share information.
Of particular interest, as described in Section 2, is the impact of each dimension. The type of information impacts the willingness, but with a somewhat limited range of 0.5—(a) vs. (e). The type of benefit offered, on the other hand, shows a much larger impact of about 1.3—(f) vs. (i). Trust in the insurance company shows an even larger impact of 1.4—(n) vs. (q); gender’ impact is 0.7—(j) vs. (k); and last, age’s impact is 0.3—(l) vs. (m).

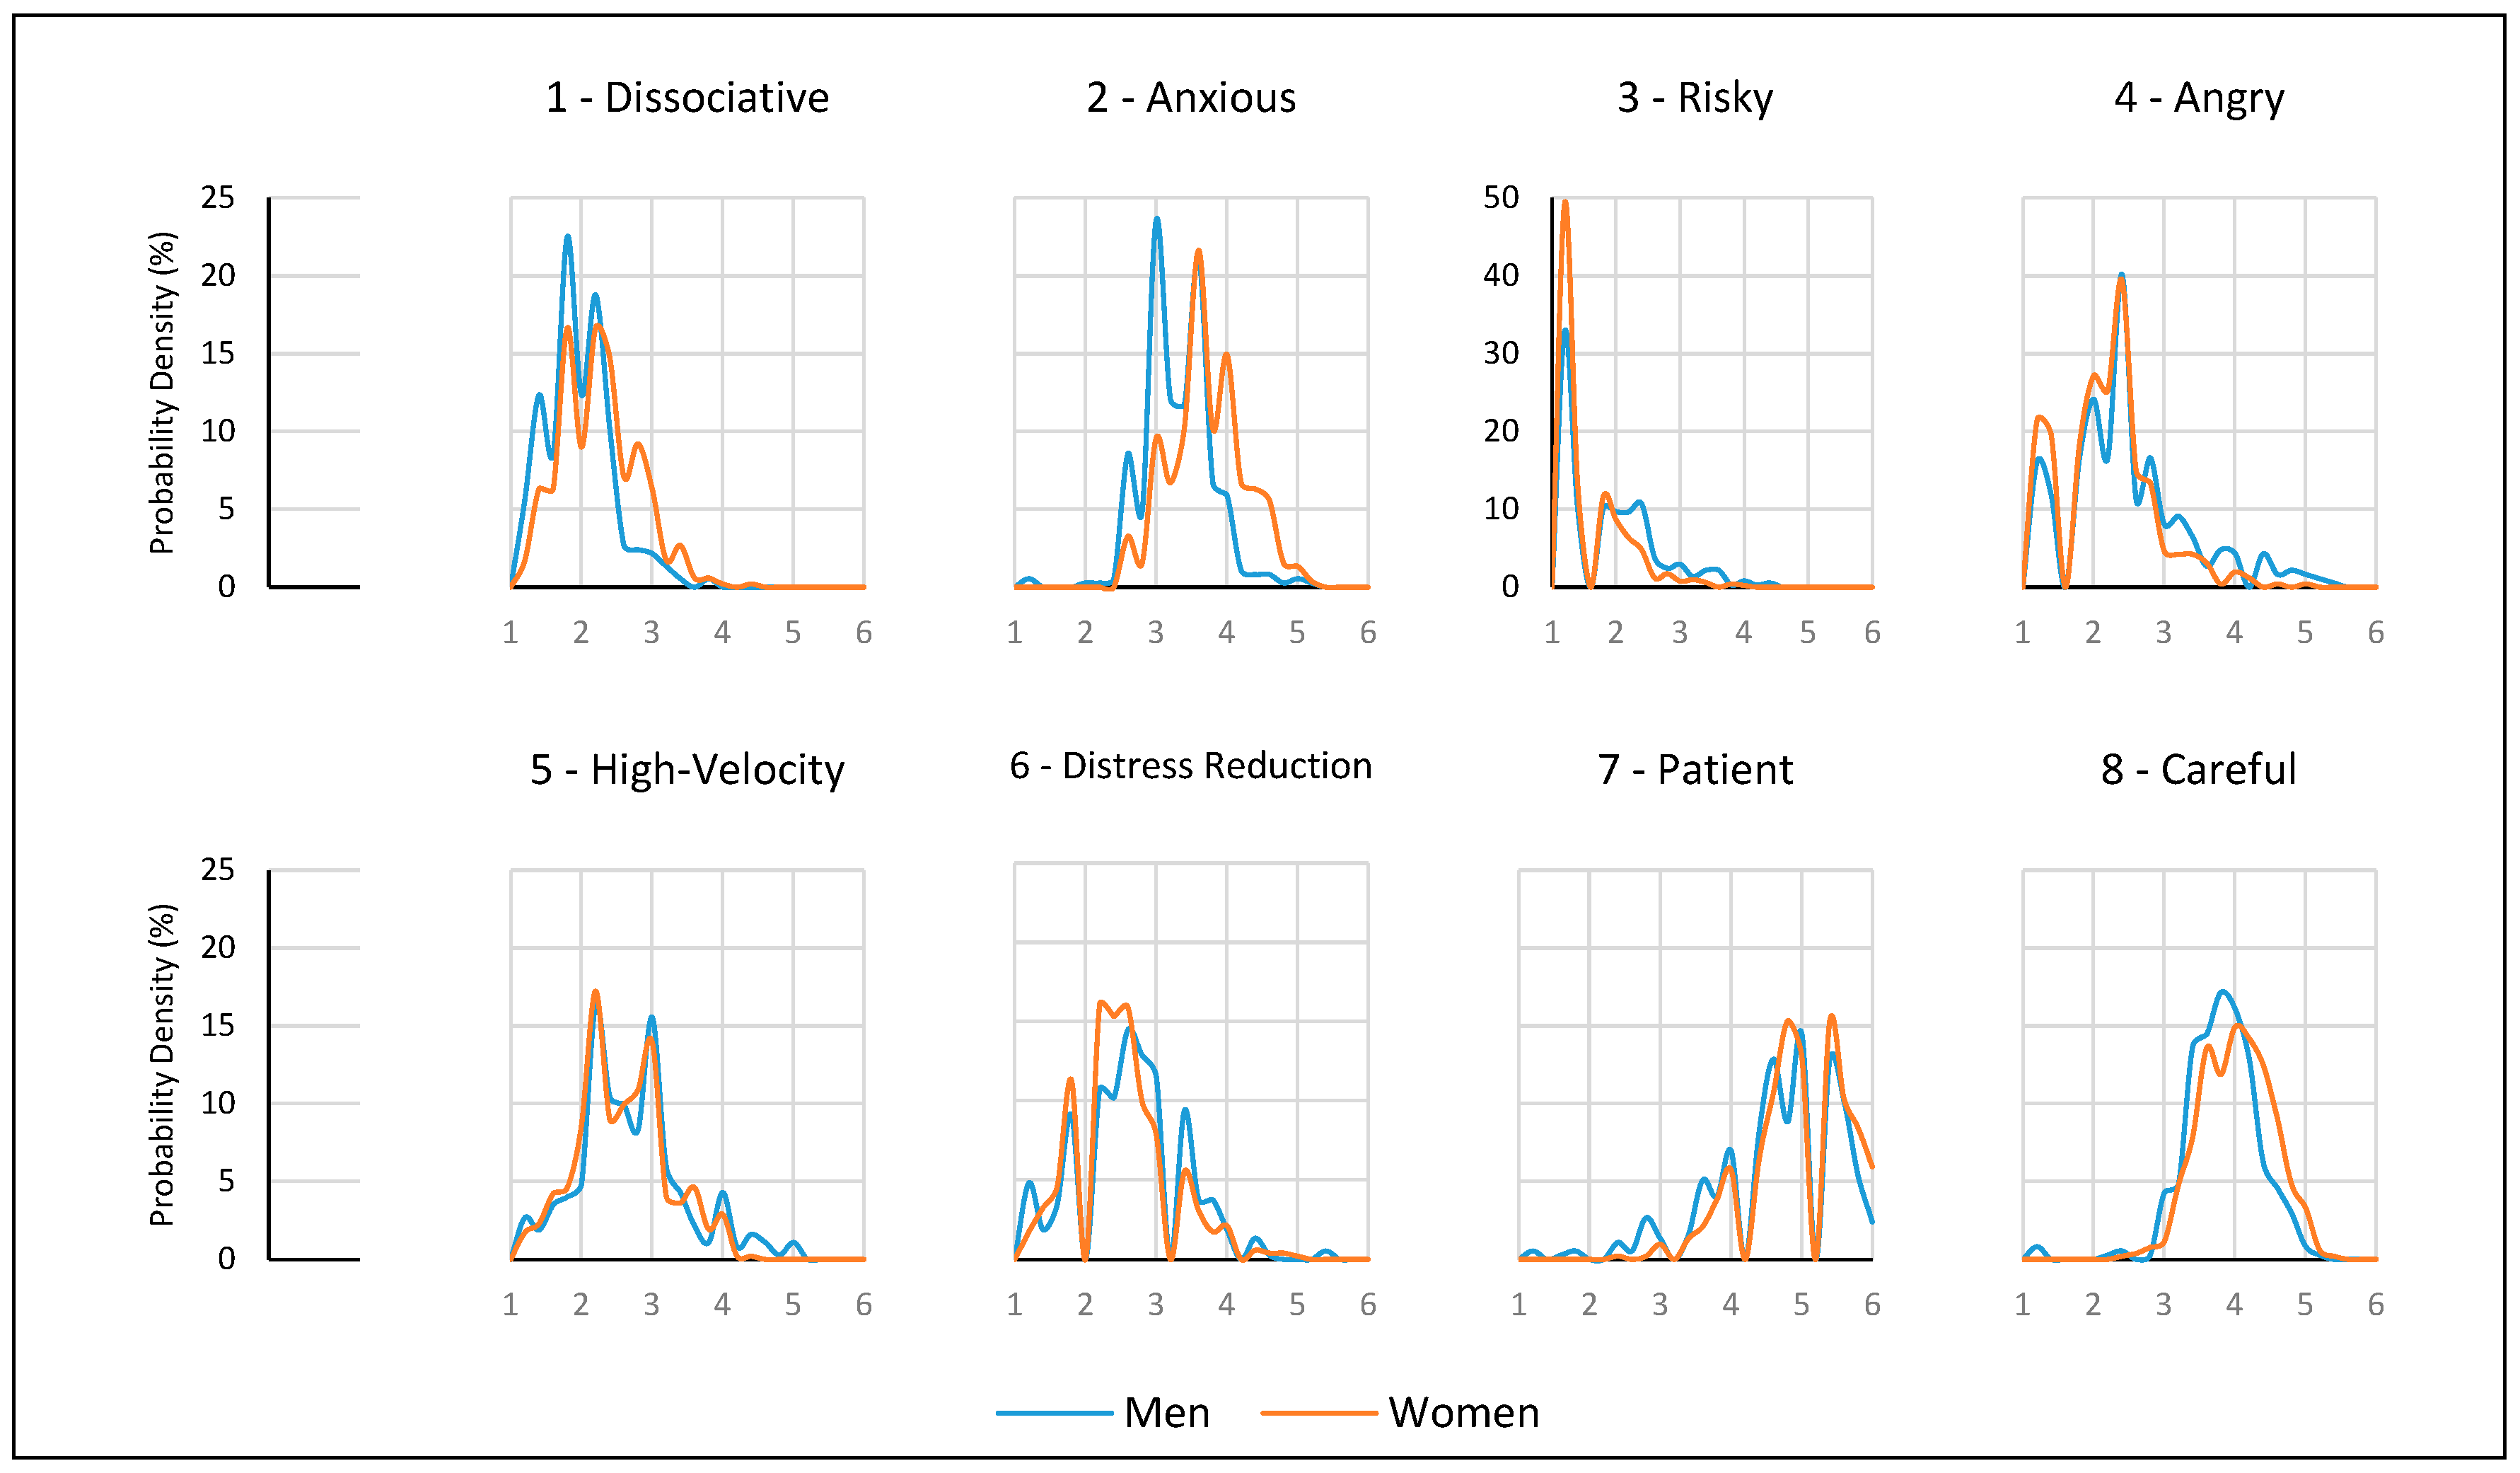
3.2. Self-Assessment of Driving Style

The responses to the self-assessment questions are summarized in Table 5; the means and standard deviations are shown graphically. Most respondents associate their driving style with more risk-averse characteristics, such as patience and carefulness, rather than with riskier behavior.
In addition, some types of driving styles correlate heavily with each other. This is summarized in Table 6. Perhaps unsurprisingly, risky, angry and high-velocity behaviors are linked, as are patient, careful and anxious behaviors. The dissociative behavior is linked to both of these clusters, whereas distress reduction does not seem to be linked to either.
The self-assessment of driving styles shows statistically significant differences by gender, with women more often associated with risk-averse behavior than men, and vice-versa. As shown in Table 7, the differences are statistically significant to a confidence level of 99% or better for all factors. Conversely, the self-assessment is not impacted at all by age in the categories selected for this study.
The distribution of responses for each factor for men and women is shown in Figure 5.

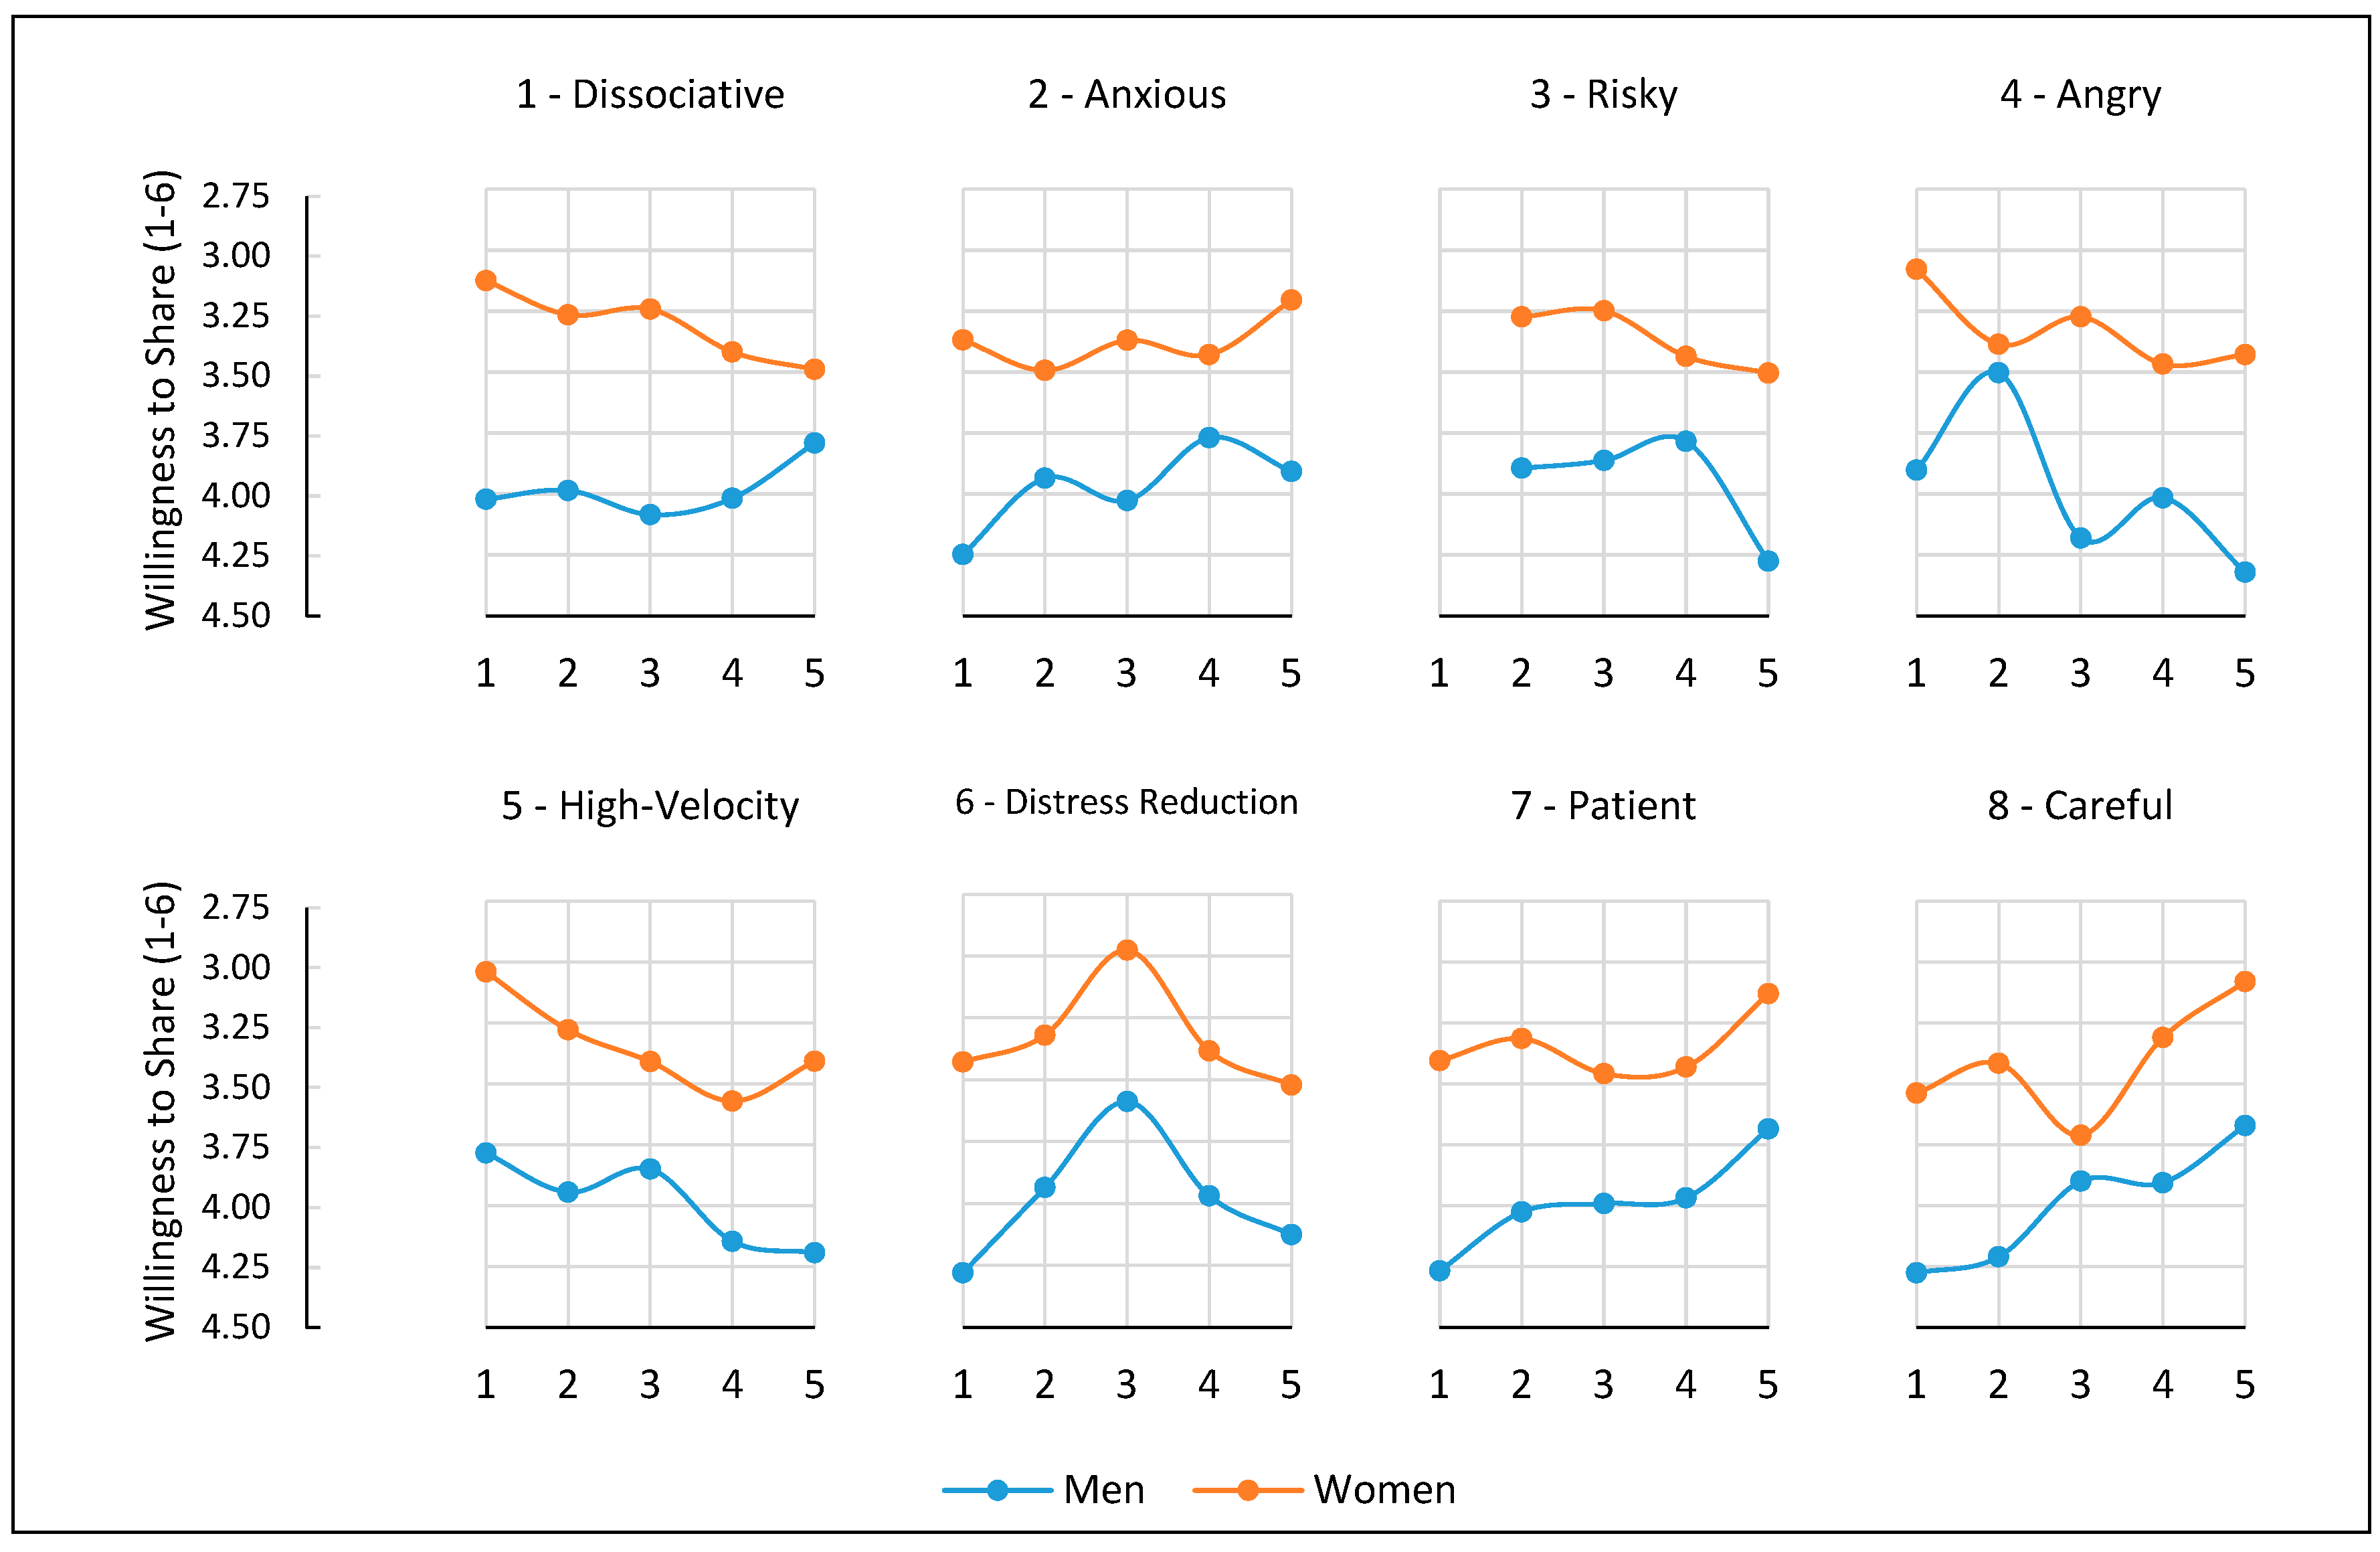
3.3. Impact of Self-Assessment on Willingness to Share

The self-assessment of driving styles correlates somewhat weakly with the willingness to share information, as shown in Table 8. In general, more risk-averse driving styles are positively correlated with willingness to share, while riskier driving styles are negatively correlated.
In order to investigate the impacts of these correlations defined in Section 2, we define quintiles for each factor in the self-assessment, as shown in Table 9. The decision for quintiles is based on the need to achieve enough granularity to detect trends while identifying customer groups of reasonable size for acquisition efforts and portfolio analysis. In some cases the quintile boundary lies within a relatively large block of answers. In this case, we have kept the entire block within the higher quintile, rather than splitting it. The logic for this choice is that an insurance company using this information will not be able to differentiate in the treatment of similar answers. On one occasion (Factor 3—Risky), the boundary for the second quintile falls within the minimum answers. Thus, all these values have been included in quintile 2.
The impact of the self-assessment quintiles on willingness to share information is summarized in Table 10; the significance of these differences is summarized in Table 11.
To understand the impact of self-assessment in more detail, the willingness to share by type of information is shown in Figure 6. The same information, but for types of benefits, is displayed in Figure 7. The behavior within each style is consistent with the overall results, with willingness to share being highest for information directly prior to or following an accident, followed by information about driving behavior; last is information about location. Most factors also show a noticeable trend along the quintiles, with more risk-averse behaviors (Anxious, Patient and Careful) showing a trend of increasing willingness to share, and riskier behaviors (Risky, Angry and High-Velocity) showing a negative trend. Distress Reduction is unique with a clear mid-range maximum, which makes the significance of the differences calculated in Table 11 less useful for risk selection. Differences for Dissociative are not statistically significant. Sharing information on vehicle status and location, along with time and date of vehicle use, is generally not favored, and differences by quintile are typically not statistically significant.
As discussed in Section 3.2 above, there are statistically significant differences in the distribution for men and women across the eight different driving styles. We have also seen from Section 3.1 that gender has an impact on the willingness to share. Therefore, it is possible that the impact due to driving style is due in part or completely to gender differences. This would severely curtail the usefulness of the self-assessment as a risk management tool: why ask for additional, complicated information if a simple gender distinction provides all or most of the predictive power?
We show the impact of gender on WSI across the driving styles quintiles in Figure 8.
The results are largely consistent with those shown in Figure 4 and Figure 6. The exception seems to be the impact of Dissociative, where the impact for men and women occurs in opposite directions.
The results for these gender differences are summarized in Table 12. The impact of gender is significant and consistent across the quintiles of driving styles. However, quintile still has a noticeable impact across several styles, especially those more clearly linked to risk-averse or riskier behavior.

4. Conclusions

The willingness of customers to share automotive information with their insurance company and the relevant impact dimensions analyzed in this study have been summarized in Table 13.
The largest impact on customers’ willingness to share is impacted by the level of trust they have in the company (a); when the range is restricted to potential customers with at least neutral trust, the impact is reduced but it is still noticeable (b). The second largest impact is that of the type of benefit offered. Measured against no benefit, a premium reduction drives the highest improvement to the willingness to share (f). However, more than two thirds of this benefit can be accrued by offering a service in kind (h). Gender has a somewhat surprisingly large impact (c), and more than twice that of age (d). In particular, women are more open to sharing information, which seems to be in contradiction to other studies (e.g., Jai and King 2016; Miesler and Bearth 2016). The impact of the type of information to be shared (e) lies between the impacts of incentives and gender, with information more traditionally linked to claims adjusting being easier to obtain than surveillance-type information.
The self-assessment of driving style provides additional insights into willingness to share information. Given the correlation among the different styles shown in Table 6, the impacts will not be additive. However, even a single driving style, such as Careful (p) or Patient (o) provides an additional impact comparable to that of range-adjusted trust or type of information. In practice, by targeting drivers with high scores for these two factors, we should expect to obtain complete information at the same rate by which we should obtain only claims information.
The implications of these results are significant for insurance companies. As they try to develop more real-time data-driven business models, they will need to rely on their customers’ willingness to share as much information as possible. This research shows that trusting customers who self-assess as more risk-averse drivers are more likely to be active data-sharers. That is: loyal and safer customers are more likely to participate in new data-driven business models than the general population. This should in turn enable the creation of stable and attractive customer portfolios. In addition, services powered by the information collected can be used to drive higher participation rates instead of offers of financial incentives.
A necessary next step of this research will be to test the applicability across different geographies and lines of business, to investigate the effects of specific services and to link the self-assessment to loss history in existing insurance portfolios. In addition, the research should be further developed to capture a representative sample of Swiss customers and provide better granularity across age cohorts.

Author Contributions

All activities related to this article were conducted jointly and equitably by both authors, with the following exceptions: C.P. developed the analytical methodology; S.E. collected the data. All authors have read and agreed to the published version of the manuscript.

Funding

This research received no external funding.

Conflicts of Interest

The authors declare no conflict of interest.

References

  1. Acquisti, Alessandro, Leslie K. John, and George Loewenstein. 2013. What is Privacy Worth? The Journal of Legal Studies 42: 249–74. [Google Scholar] [CrossRef] [Green Version]
  2. Amado, Sonia, Elvan Arikan, Gülin Kaça, Mehmet Koyuncu, and B. Nilay Turkan. 2014. How Accurately Do Drivers Evaluate Their Own Driving Behavior? An on-Road Observational Study. Accident Analysis and Prevention 63: 65–73. [Google Scholar] [CrossRef] [PubMed]
  3. Barth, Susanne, and Menno D. T. de Jong. 2017. The Privacy Paradox—Investigating Discrepancies Between Expressed Privacy Concerns and Actual Online Behavior—A Systematic Literature Review. Telematics and Informatics 34: 1038–58. [Google Scholar] [CrossRef]
  4. Cather, David A. 2018. Cream Skimming: Innovations in Insurance Risk Classification and Adverse Selection. Risk Management and Insurance Review 21: 335–66. [Google Scholar] [CrossRef]
  5. Cohen, Alma, and Peter Siegelman. 2010. Testing for Adverse Selection in Insurance Markets. Journal of Risk and Insurance 77: 39–84. [Google Scholar] [CrossRef]
  6. Culnan, Mary J., and Pamela K. Armstrong. 1999. Information Privacy Concerns, Procedural Fairness, and Impersonal Trust: An Empirical Investigation. Organization Science 10: 104–15. [Google Scholar] [CrossRef]
  7. De Craen, Saskia, Divera A. M. Twisk, Marjan P. Hagenzieker, Henk Elffers, and Karel A. Brookhuis. 2011. Do Young Novice Drivers Overestimate Their Drivng Skills More Than Experienced Drivers? Different Methods Lead to Different Conclusions. Accident Analysis and Prevention 43: 1660–65. [Google Scholar] [CrossRef]
  8. De Winter, J. C. F., and Dimitra Dodou. 2010. The Driver Behavior Questionnaire as a Predictor of Accidents: A Meta-Analysis. Journal of Safety Research 41: 463–70. [Google Scholar] [CrossRef]
  9. Dunning, David, Judith A. Meyerowitz, and Amy D. Holzberg. 1989. Ambiguity and Self-Evaluation: The Role of Idiosyncratic Trait Definitions in Self-Serving Assessent of Ability. Journal of Personality and Social Psychology 57: 1082–90. [Google Scholar] [CrossRef]
  10. Dunning, David, Chip Heath, and Jerry M. Suls. 2004. Flawed Self-Assessment. Implications for Health, Education and the Workplace. Psychological Science in the Public Interest 5: 69–106. [Google Scholar] [CrossRef] [Green Version]
  11. Eling, Martin, and Martin Lehmann. 2017. The Impact of Digitalization on the Insurance Value Chain and the Insurability of Risk. The Geneva Papers 43: 359–96. [Google Scholar] [CrossRef]
  12. Federal Trade Commission. 2007. Credit-Based Insurance Scores: Impacts on Consumers of Automobile Insurance. Available online: https://www.ftc.gov/sites/default/files/documents/reports/credit-based-insurance-scores-impacts-consumers-automobile-insurance-report-congress-federal-trade/p044804facta_report_credit-based_insurance_scores.pdf (accessed on 28 December 2019).
  13. French, D. J., R. J. West, J. Elander, and J. M. Widing. 1993. Decision-Making Style, Driving Style, and Self-Reported Involvement in Road Traffic Accidents. Ergonomics 36: 627–44. [Google Scholar] [CrossRef] [PubMed]
  14. Groeger, John A., and Gunn E. Grande. 1996. Self-Preserving Assessment of Skill? British Journal of Psychology 87: 61–79. [Google Scholar] [CrossRef]
  15. Harrison, Warren. 2009. Reliability of the Driver Behaviors Questionnaire in a Sample of Novice Drivers. Paper presented at Australian Road Safety Research, Policing and Education Conference, Sydney, NSW, Australia, November 10–13. [Google Scholar]
  16. Jai, Tun-Min, and Nancy J. King. 2016. Privacy Versus Reward: Do Loyalty Programs Increase Consumers’ Willingness to Share Personal Information with Third-Party Advertisers and Data Brokers? Journal of Retailing and Consumer Services 28: 296–303. [Google Scholar] [CrossRef]
  17. Kontogiannis, Tom, Zoe Kossiavelou, and Nicolas Marmaras. 2002. Self-Reports of Aberrant Behaviour on the Road: Errors and Violations in a Sample of Greek Drivers. Accident Analysis and Prevention 34: 381–99. [Google Scholar] [CrossRef]
  18. Kruger, Justin, and David Dunning. 1999. Unskilled and Unaware of It: How Difficulties in Recognizing One’s Own Incompetence Lead to Inflated Self-Assessments. Journal of Personality and Social Psychology 77: 1121–34. [Google Scholar] [CrossRef]
  19. Lajunen, Timo, Dianne Parker, and Heikki Summala. 2004. The Manchester Driver Behaviour Questionnaire: A Cross-Cultural Study. Accident Analysis and Prevention 36: 231–38. [Google Scholar] [CrossRef]
  20. Leppäniemi, Matti, Heikki Karjaluoto, and Hannu Saarijärvi. 2017. Customer Perceived Value, Satisfaction, and Loyalty: The Role of Willingness to Share Information. The International Review of Retail, Distribution and Consumer Research 27: 164–88. [Google Scholar] [CrossRef]
  21. Lo, Janice, and Cindy Riemenschneider. 2010. An Examination of Privacy Concerns and Trust Entities in Determining Willingness to Disclose Personal Information on a Social Networking Site. Paper presented at the 16th Americas Conference on Information Systems, Lima, Peru, August 12–15. [Google Scholar]
  22. Martinussen, Laila M., Liisa Hakamies-Blomqvist, Mette Møller, Türker Özkan, and Timo Lajunen. 2013. Age, Gender, Mileage and the DBQ: The Validity of the Driver Behavior Questionnaire in Different Driver Groups. Accident Analysis & Prevention 52: 228–36. [Google Scholar] [CrossRef] [Green Version]
  23. Martinussen, Laila M., Mette Møller, and Carlo G. Prato. 2014. Assessing the Relationship between the Driver Behavior Questionnaire and the Driver Skill Inventory: Revealing Sub-groups of Drivers. Transportation Research Part F: Traffic Psychology and Behaviour 26: 82–91. [Google Scholar] [CrossRef] [Green Version]
  24. Maurstad, Hugo, Johan Riddergard, and Coenraad Vrolijk. 2001. Insuring Profits. McKinsey Quarterly, 12–15. [Google Scholar]
  25. McKenna, Frank P., Robert A. Stanier, and Clive Lewis. 1991. Factors Underlying Illusory Self-Assessment of Driving Skill in Males and Females. Accident Analysis and Prevention 23: 45–52. [Google Scholar] [CrossRef]
  26. Miesler, Linda, and Angela Bearth. 2016. “Willingness to share” im Kontext Big Data: Wie entscheiden Kunden, ob Sie ihre persönlichen Daten mit Unternehmen teilen? In Dialogmarketing Perspektiven 2015/2016. München: Springer Fachmedien, pp. 49–66. [Google Scholar] [CrossRef]
  27. Özkan, Türker, Timo Lajunen, and Heikki Summala. 2006. Driver Behaviour Questionnaire: A Follow-Up Study. Accident Analysis and Prevention 38: 386–95. [Google Scholar] [CrossRef] [PubMed]
  28. Özkan, Türker, and Timo Lajunen. 2006. What Causes the Differences in Driving Between Young Men and Women? The Effects of Gender Roles and Sex on Young Drivers’ Driving Behaviour and Self-Assessment of Skills. Transportation Research Part F 9: 269–77. [Google Scholar] [CrossRef]
  29. Paefgen, Johannes, Thorsten Staake, and Frédéric Thiesse. 2013. Evaluation and Aggregation of Pay-As-You-Drive Insurance Rate Factors: A Classification Analysis Approach. Decision Support Systems 56: 192–201. [Google Scholar] [CrossRef]
  30. Parker, Dianne, James T. Reason, Antony R. Manstead, and Stephen G. Stradling. 1995. Driving Errors, Driving Violations and Accident Involvement. Ergonomics 38: 1036–48. [Google Scholar] [CrossRef]
  31. Reason, James, Antony Manstead, Stephen Stradling, James Baxter, and Karen Campbell. 1990. Errors and Violations on the Roads: A real Distinction? Ergonomics 33: 1315–32. [Google Scholar] [CrossRef]
  32. Ross, John. A. 2006. The Reliability, Validity and Utility of Self-Assessment. Practical Assessment Research and Evaluation 11: 10. [Google Scholar]
  33. Rothschild, Michael, and Joseph Stiglitz. 1976. Equilibrium in Competitive Insurance Markets: An Essay on the Economics of Imperfect Information. Quarterly Journal of Economics 90: 629–49. [Google Scholar] [CrossRef] [Green Version]
  34. Schoenbachler, Denise D., and Geoffrey L. Gordon. 2002. Trust and Customer Willingness to Provide Information in Database-Driven Relationship Marketing. Journal of Interactive Marketing 16. [Google Scholar] [CrossRef]
  35. Schudy, Simeon, and Verena Utikal. 2017. You Must Not Know About Me—On the Willingness to Share Personal Data. Journal of Economic Behavior and Organization 141: 1–13. [Google Scholar] [CrossRef] [Green Version]
  36. Sivak, Michael, José Soler, and Ulrich Tränkle. 1989. Cross-Cultural Differences in Driver Self-Assessment. Accident Analysis and Prevention 21: 371–75. [Google Scholar] [CrossRef] [Green Version]
  37. Stone, Eugene F., and Dianna L. Stone. 1990. Privacy in Organizations: Theoretical Issues, Research Findings, and Protection Mechanisms. Research in Personnel an Human Resources Management 8: 349–411. [Google Scholar]
  38. Sundström, Anna. 2008. Self-Assessment of Driving Skill—A Review from a Measurement Perspective. Transportation Research Part F 11: 1–9. [Google Scholar] [CrossRef]
  39. Sundström, Anna. 2011. The Validity of Self-Reported Driver Competence: Relations between Measures of Perceived Driver Competence and Actual Driving Skill. Transportation Research Part F 14: 155–63. [Google Scholar] [CrossRef]
  40. Taubman-Ben-Ari, Orit, Mario Mikulincer, and Omri Gillath. 2004. The Multidimensional Driving Style Inventory—Scale Construct and Validation. Accident Analysis and Prevention 36: 323–32. [Google Scholar] [CrossRef]
  41. Taubman-Ben-Ari, Orit, and Vera Skvirsky. 2016. The Multidimensional Driving Style Inventory a Decade Later: Reviewof the Literature and Re-evaluation of the Scale. Accident Analysis and Prevention 93: 179–88. [Google Scholar] [CrossRef]
  42. Taubman-Ben-Ari, Orit, Ahinoam Eherenfreund-Hager, and Carlo G. Prato. 2016. The Value of Self-Report Measures as Indicators of driving Behaviors among Young Drivers. Transportation Research Part F 39: 33–42. [Google Scholar] [CrossRef]
  43. Thomas, R. Guy. 2017. Loss Coverage: Why Insurance Works Better with Some Adverse Selection. Cambridge: Cambridge University Press. [Google Scholar]
  44. Tsai, Janice Y., Serge Egelman, Lorrie Cranor, and Alessandro Acquisti. 2011. The Effect of Online Privacy Information on the Purchasing Behavior: An Experimental Study. Information Systems Research 22: 254–68. [Google Scholar] [CrossRef] [Green Version]
  45. West, Robert, Davina French, Richard Kemp, and James Elander. 1993. Direct Observation of Driving, Self Reports of Driver Behaviour, and Accident Involvement. Ergonomics 36: 557–67. [Google Scholar] [CrossRef]
Figure 1. Questionnaire structure.
Jrfm 13 00053 g001
Figure 2. Respondents by age group and gender.
Jrfm 13 00053 g002
Figure 3. Willingness to share by type of benefit and type of information.
Jrfm 13 00053 g003
Figure 4. Willingness to share by gender/age group and by level of trust in insurance.
Jrfm 13 00053 g004
Figure 5. Distribution of self-assessment of driving style by factor and gender (notice the different scaling for Factor 3—Risky).
Jrfm 13 00053 g005
Figure 6. Impact of self-assessment quintile (1–5) on willingness to share information by type of information.
Jrfm 13 00053 g006
Figure 7. Impact of self-assessment quintile (1–5) on willingness to share information by benefit offered.
Jrfm 13 00053 g007
Figure 8. Impact on willingness to share information of driving style quintile (1–5) by gender.
Jrfm 13 00053 g008
Table 1. Strength of preference for sharing information with insurance company.
Answer123456
Willingness to share informationYesYes, conditionalRather yesRather noUnlikelyNever
Table 2. Self-assessment questions* and mapping to driving style factors from Taubman-Ben-Ari et al. (2004). (*) The number in [] indicates the order in which the question is asked.
Driving StyleQuestions
1—Dissociative
Tendency to be easily distracted during driving, to commit driving errors due to this distraction, and to display cognitive gaps and dissociations during driving.
[30] misjudge the speed of an oncoming vehicle when passing
[34] intend to switch on the windscreen wipers, but switch on the lights instead
[27] forget that my lights are on full beam until flashed by another motorist
[39] nearly hit something due to misjudging my gap in a parking lot
[36] plan my route badly, so that I hit traffic that I could have avoided
[35] attempt to drive away from traffic lights in third gear (or on the neutral mode in automatic cars)
[15] lost in thoughts or distracted, I fail to notice someone at the pedestrian crossings
[11] I daydream to pass the time while driving
2—Anxious
Tendency to feel distress during driving, to display signs of anxiety due to the driving situation, and to express doubts and lack of confidence about his or her driving skills.
[31] feel nervous while driving
[33] feel distressed while driving
[10] driving makes me feel frustrated
[25] it worries me when driving in bad weather
[7] on a clear freeway, I usually drive at or a little below the speed limit
[4] feel I have control over driving
[40] feel comfortable while driving
3—Risky
A person’s seeking for stimulation, sensation, and risk during driving and his or her tendency to take risky driving decisions and to engage in risky driving.
[44] enjoy the excitement of dangerous driving
[6] enjoy the sensation of driving on the limit
[22] like to take risks while driving
[24] like the thrill of flirting with death or disaster
[20] fix my hair/ makeup while driving
4—Angry
Tendency to be hostile towards other drivers as well as behave aggressively and feel intense anger while driving.
[12] swear at other drivers
[3] blow my horn or “flash” the car in front as a way of expressing frustrations
[28] when someone does something on the road that annoys me, I flash them with the high beam
[43] honk my horn at others
[19] when someone tries to skirt in front of me on the road, I drive in an assertive way in order to prevent it
5—High-Velocity
Tendency to drive fast, to display signs of time pressure while driving, and to be oriented towards high velocity driving.
[16] in a traffic jam, I think about ways to get through the traffic faster
[9] when in a traffic jam and the lane next to me starts to move, I try to move into that lane as soon as possible
[17] when a traffic light turns green and the car in front of me doesn’t get going immediately, I try to urge the driver to move on
[2] purposely tailgate other drivers
[32] get impatient during rush hours
[5] drive through traffic lights that have just turned red
6—Distress Reduction
Tendency to engage in relaxing activities during driving aimed at reducing distress while driving.
[37] use muscle relaxation techniques while driving
[8] while driving, I try to relax myself
[1] do relaxing activities while driving
[26] meditate while driving
7—Patient
Tendency to be polite towards other drivers, to feel no time pressure during driving, and to display patience while driving.
[18] at an intersection where I have to give right-of-way to oncoming traffic, I wait patiently for cross-traffic to pass
[23] base my behavior on the motto “better safe than sorry”
[13] when a traffic light turns green and the car in front of me doesn’t get going, I just wait for a while until it moves
[38] plan long journeys in advance
8—Careful
Tendency to be careful during driving, to effectively plan his or her driving trajectory, and to adopt a problem-solving attitude towards driving-related problems and obstacles.
[42] tend to drive cautiously
[14] drive cautiously
[41] always ready to react to unexpected maneuvers by other drivers
[21] distracted or preoccupied, and suddenly realize the vehicle ahead has slowed down, and have to slam on the breaks to avoid a collision
[29] get a thrill out of breaking the law
Table 3. Willingness to share information by type of information and benefit offered (lower number = higher willingness).
Premium ReductionRisk MitigationServicesNo BenefitsMean
Driving Behavior Before and After an Accident2.783.183.254.203.35
Acceleration, Turning and Braking2.983.383.404.373.53
Speed and Safety Distance2.973.363.504.523.59
Time and Date of Vehicle Use3.323.703.634.483.79
Vehicle Status and Location3.383.723.684.523.82
Mean3.093.473.494.423.62
Table 4. Willingness to share information by dimension (*** denotes α < 0.001).
DimensionNMeanStd. Dev.Significant (α < 0.01)
Type of Information Yes (p < 0.0002 ***)
Three groups:
(a)/(b) (c)/(d) (e)
(a)Driving Behavior Before and After an Accident 3.351.74
(b)Acceleration, Turning and Braking 3.531.77
(c)Speed and Safety Distance 3.591.75
(d)Time and Date of Vehicle Use 3.791.95
(e)Vehicle Status and Location 3.821.81
Type of Benefit Yes (p < 0.00025 ***)
Three groups:
(f)/(g) (h)/(i)
(f)Premium Reduction 3.091.77
(g)Risk Mitigation 3.471.74
(h)Services 3.491.74
(i)No Benefit 4.421.64
Gender Yes (p < 0.0001 ***)
(j)Men3734.001.32
(k)Women5223.341.30
Age Yes (p = 0.0023 ***)
(l)<25 years old4393.481.27
(m)25+ years old4563.751.40
Trust in Insurance Yes (p < 0.00025 ***)
Among all four levels of trust
(n)11423.261.39
(o)23353.361.24
(p)31703.841.26
(q)4-6334.671.28
Table 5. Self-assessment of driving style (the factors have been ranked by value in the graphics).
FactorMeanStd. Dev. Jrfm 13 00053 i001
1—Dissociative2.020.54
2—Anxious3.460.55
3—Risky1.610.66
4—Angry2.220.79
5—High-Velocity2.530.70
6—Distress Reduction2.460.72
7—Patient4.760.79
8—Careful3.930.53
Table 6. Correlation (R) among driving styles. The background indicates the level of correlation between the variables: blue is positive, ochre is negative. Color saturation indicates the magnitude of the correlation.
DissociativeAnxiousRiskyAngryHigh-VelocityDistress ReductionPatientCareful
1—Dissociative-
2—Anxious0.369-
3—Risky0.042−0.287-
4—Angry0.057−0.1960.541-
5—High-Velocity0.175−0.0610.4700.626-
6—Distress Reduction0.150−0.0220.1580.0660.081-
7—Patient−0.0100.328−0.378−0.470−0.4210.038-
8—Careful0.1080.388−0.188−0.190−0.0620.0490.371-
Table 7. Mean values of driving styles by gender and age (*** indicates α < 0.001; ** indicates α < 0.01; * indicates α < 0.1).
Driving StyleMeanMaleFemaleSignificant
(α < 0.01)
<25 y.o.25+ y.o.Significant
(α < 0.01)
895373522439456
1—Dissociative2.021.852.14Yes (p < 0.001 ***)2.061.97No (p = 0.048 *)
2—Anxious3.463.223.63Yes (p < 0.001 ***)3.503.42No (p = 0.032 *)
3—Risky1.611.801.47Yes (p < 0.001 ***)1.601.61No (p = 0.94)
4—Angry2.222.392.09Yes (p < 0.001 ***)2.192.24No (p = 0.29)
5—High-Velocity2.532.602.47Yes (p = 0.009 **)2.472.58No (p = 0.032 *)
6—Distress Reduction2.462.542.40Yes (p = 0.006 **)2.402.52No (p = 0.018 *)
7—Patient4.764.604.88Yes (p < 0.001 ***)4.804.71No (p = 0.13)
8—Careful3.933.824.02Yes (p < 0.001 ***)3.963.91No (p = 0.20)
Table 8. Correlation (R) between self-assessment of driving style and willingness to share information. The background indicates the level of correlation between the variables: blue is positive, ochre is negative. Color saturation indicates the magnitude of the correlation.
Driving StyleDriving Behavior before and after an AccidentAcceleration, Turning and BrakingSpeed and Safety DistanceTime and Date of Vehicle UseVehicle Status and Location
1—Dissociative0.0440.0580.1060.0300.000
2—Anxious0.1510.1820.2190.0860.075
3—Risky−0.203−0.214−0.256−0.070−0.090
4—Angry−0.183−0.213−0.237−0.057−0.087
5—High-Velocity−0.166−0.191−0.199−0.043−0.084
6—Distress Reduction−0.033−0.011−0.019−0.066−0.091
7—Patient0.1620.1760.1930.0730.110
8—Careful0.1870.2230.2060.1150.148
Table 9. Quintile definition by factor. N in bold is the number of data points in each category.
Driving StyleRangeQuintile 1Quintile 2Quintile 3Quintile 4Quintile 5
fromNfromNfromNfromNfromN
1—Dissociative1.000–4.375min1740.1621711.8751862.1251792.500185
2—Anxious1.000–5.143min1353.0001643.2861973.5711713.857228
3—Risky1.000–4.400--min2361.2002531.6001802.000226
4—Angry1.000–5.400min1591.6001952.000972.2002382.800206
5—High-Velocity1.000–5.000min1752.0001512.3331752.6661603.000234
6—Distress Reduction1.000–5.250min881.7502172.2501182.5002373.000235
7—Patient1.000–6.000min1674.2501694.7501135.0002505.500196
8—Careful1.000–5.400min1713.6001253.8001264.0002604.400213
Table 10. Willingness to share by type of information and driving style quintiles (1).
Driving StyleDriving Behavior before and after an AccidentAcceleration, Turning and BrakingSpeed and Safety DistanceTime and Date of Vehicle UseVehicle Status and Location
Q1Q5Q1Q5Q1Q5Q1Q5Q1Q5
1—Dissociative3.343.283.593.463.703.403.813.763.733.83
2—Anxious3.733.094.013.164.113.144.013.524.083.66
3—Risky3.183.763.314.003.304.133.733.963.734.02
4—Angry3.043.703.134.013.184.103.643.903.674.01
5—High-Velocity2.963.573.103.783.143.883.663.783.613.89
6—Distress Reduction3.533.583.823.693.923.763.824.043.734.11
7—Patient3.673.063.883.223.953.273.833.573.983.52
8—Careful3.662.983.983.083.973.153.943.514.173.45
Table 11. Willingness to share by type of information and driving style quintiles (2) (*** indicates α < 0.001; ** indicates α < 0.01; * indicates α < 0.1).
Driving StyleDriving Behavior Before and After an AccidentAcceleration, Turning and BrakingSpeed and Safety DistanceTime and Date of Vehicle UseVehicle Status and Location
Significant
(α < 0.01)
Significant
(α < 0.01)
Significant
(α < 0.01)
Significant
(α < 0.01)
Significant
(α < 0.01)
1—DissociativeNo (p = 0.96)No (p = 0.85)No (p = 0.32)No (p = 0.99)No (p = 0.85)
2—AnxiousYes (p = 0.0005 **)Yes (p < 0.0002 ***)Yes (p < 0.0002 ***)No (p = 0.03)No (p = 0.21)
3—RiskyYes (p < 0.0002 ***)Yes (p < 0.0002 ***)Yes (p < 0.0002 ***)No (p = 0.47)No (p = 0.24)
4—AngryYes (p < 0.0002 ***)Yes (p < 0.0002 ***)Yes (p < 0.0002 ***)No (p = 0.78)No (p = 0.09)
5—High-VelocityYes (p = 0.0008 **)Yes (p < 0.0002 ***)Yes (p < 0.0002 ***)No (p = 0.51)No (p = 0.14)
6—Distress ReductionYes (p < 0.0005 **)Yes (p < 0.0007 **)Yes (p = 0.0002 **)No (p = 0.009 *)No (p = 0.0027 *)
7—PatientYes (p = 0.0018 **)Yes (p = 0.0017 **)Yes (p = 0.0004 **)No (p = 0.38)No (p = 0.016 *)
8—CarefulYes (p < 0.0002 ***)Yes (p < 0.0002 ***)Yes (p < 0.0002 ***)No (p = 0.012 *)Yes (p = 0.0006 **)
Table 12. Impact by driving style (Q1 vs. Q5) and gender.
Driving StyleAllMenWomen
Q1Q5ImpactQ1Q5ImpactQ1Q5Impact
1—Dissociative3.633.550.094.023.790.233.123.49−0.36
2—Anxious3.993.310.674.253.910.343.373.200.16
3—Risky3.453.97−0.533.894.28−0.383.273.50−0.23
4—Angry3.353.94−0.593.904.32−0.423.083.43−0.35
5—High-Velocity3.313.77−0.473.784.19−0.413.043.41−0.37
6—Distress Reduction3.803.83−0.044.284.230.153.433.52−0.09
7—Patient3.883.32−0.564.273.690.583.403.130.27
8—Careful3.943.230.704.283.670.613.543.080.46
Table 13. Summary of the impacts on willingness to share personal information. Figures in grey are not statistically significant.
DimensionImpactImpact net of GenderComments
(a)Trust (full range)1.40-Customers are more willing to share information if they trust their insurance company
(b)Trust (1 to 3)0.58-A range excluding the customers distrusting of the company may be more appropriate when targeting own or potential customers
(c)Gender0.67-Women more open to sharing information than men
(d)Age0.28-Younger people (<25 y.o.) more willing to share information than older people
(e)Type of Information0.47-Customers are more willing to share accident-relevant information than vehicle location and usage
Benefit
(f)Premium reduction vs. no benefit1.33-Premium reduction has a larger impact than services of risk mitigation
(g)Premium reduction vs. Services0.40-Premium reduction has a larger impact than services of risk mitigation
(h)Services vs. no benefit0.94-Offering benefits significantly impacts the willingness to share information
Self-Assessment
(i)1—Dissociative0.090.07Not statistically significant at α < 0.01
(j)2—Anxious0.670.25
(k)3—Risky0.520.31
(l)4—Angry0.590.38
(m)5—High-Velocity0.460.39
(n)6—Distress Reduction0.040.03Not statistically significant at α < 0.01. Impact improves to 0.64/0.50 (net of gender) if measured mid-range vs. extremes
(o)7—Patient0.560.43
(p)8—Careful0.700.53

