Article

Corporate Green Bond Issuances: An International Evidence

1
Institut de Recherche en Gestion, Université Paris-Est, IRG (EA 2354), UPEC, UPEM, F-94000 Créteil, France
2
Finance, Economics and Law Department, South Champagne Business School, 10000 Troyes, France
*
Author to whom correspondence should be addressed.
J. Risk Financial Manag. 2020, 13(2), 25; https://doi.org/10.3390/jrfm13020025
Submission received: 3 January 2020 / Revised: 23 January 2020 / Accepted: 28 January 2020 / Published: 4 February 2020
(This article belongs to the Special Issue Green and Sustainable Finance)

Abstract

:
Using an international sample of corporate Green bond issuances over the recent period, this paper highlights the potential consequences of the issuance of a Green bond on the issuer’s financial performance. Starting with a first sample of 2079 Green bond issuances of 190 unique issuers from 2009 to 2018, we investigate only corporate green bond issuances. Our final sample contains 475 green bonds issued by 145 unique firms. We find that the market reacts negatively to the announcement of green bond issuances. In particular, results show that the stock market reacts on the day of the green bond announcement date and the day after, and that the cumulative abnormal return is between −0.5% and −0.2%, depending on the asset pricing model (CAPM, the 3-factor Fama and French models, and the 4-factor Carhart models). This effect is mainly noticeable at the first Green Bond issuance and in developed markets. Our results provide evidence that the investors react in the same manner for Green bonds as for conventional or convertible bonds. This evidence suggests that green debt offerings convey unfavorable information about the issuing firms.

1. Introduction

In a globalized world where competition between companies is becoming more and more intense over time, a company taking the risk of reducing its profits in order to limit its environmental footprint would be, at least over the short and medium terms, an economic non-sense. On the other side, a consumer will also try to maximize its utility for the lowest price, leaving environmental considerations out of his decision process unless financial capacities allow him to do so. However, although money remains the first factor ruling the decision in an economic agent’s behavior, environmental considerations are increasingly being considered.
Indeed, some companies have started find interesting ways to limit their environmental impact while remaining competitive. This trend is particularly noticeable in sectors where the environmental footprint is important. For example, we observe a large number of public utilities, providing electricity to the population, that massively invest to reduce their carbon footprint by diversifying their energy mix from a carbon intensive one to a mix increasingly based on renewable energies. The recent decrease in the cost of renewable energy-based power generation assets and the uncertainty of coal, oil, and gas prices and availability of these resources makes this investment for energy transition a viable path for a more secure business strategy and, eventually, a profitable decision from a long-term perspective. This phenomenon can also be seen in sectors like transportation, real estate, or even oil and gas. In a world where polluting activities, and especially fossil fuel-based ones, will become more and more unstable, investing in its own ecologic transition may be profitable for both the business and the environment.
However, such an evolution requires capital expenditures that can be quite difficult to finance for the important amounts involved. According to the International Energy Agency and the International Renewable Energy Agency1, around 3.5 trillion US dollars would be required in energy sector investments each year until 2050 to make this energy transition possible. Consequently, financing needs from companies are so sizeable that bank loans only might not be sufficient to realize such a transition. Therefore, while having this purpose, many companies progressively see financial markets as an interesting source of financing.
Finance, as its name suggests, is a field of the economy that matches money supply (investors) and demand (entities or projects invested) through dedicated market places, aiming at financing economic project realization. Beyond simply serving economic development all over the world, the scope of its repercussion should not be neglected. Investor behaviors, selecting specific companies to allocate their funds, directly or indirectly contribute to the development of a business that can be either beneficial or detrimental to the environment. Actually, depending on the decisions made by these capital flows, the supply side of financial markets either can be the most efficient driver for sustainable development or, blinded by financial returns, a tool for an economic growth as fast as it is doomed to failure.
The emergence of such norms and standards and the increasing investor concerns related to social and environmental issues forced companies, and particularly the ones listed on stock markets, to be more and more transparent on how their directly or indirectly activity affects the environment and the society. This evolution of transparency and the availability of documentation and data on these aspects were accompanied by an increasing integration of extra-financial assessments and the rise of the first elaborated techniques of socially responsible investments. Fatemi and Fooladi (2013) suggest a shift in paradigm from the current approach of shareholder wealth maximization to a sustainable value creation framework, within which all social and environmental costs and benefits are to be explicitly accounted for.
Focusing on an environmental perspective, the orientation of investments to sustainable activities has also been possible thanks to the creation of a new debt instrument helping issuers to finance their path to ecological transition: Green bonds. A Green bond is a debt instrument issued by a company (financial or non-financial) or a public entity (city, region, government, development bank, etc.) on the financial markets to solely finance projects or assets that positively contribute to the environment. Their difference with conventional bonds lies in the commitments made by the issuer on the use of the proceeds, which has to have positive externalities for the environment.
The first Green Bond was issued by the World Bank under the “climate-aligned bond” appellation, in 2007. At this stage of the market, the Climate Bond Initiative (CBI), an international organization working to mobilize the capital market for climate change solutions, was the only entity recognized as able to certify a bond as “climate-aligned”. The number of such issuances, mainly from supranational entities, development bank, and agencies, were very low in number and in amount for about eight years, until the publication of the first version of the Green Bond Principles in 2014 by the International Capital Market Association.
The Green Bond Principles (GBP) helped standardize the definition of a “Green” asset or project that can be financed thanks to a Green Bond issuance. The GBP also defined how the issuer must communicate on: its process to select and evaluate green projects and assets; how it manages the Green Bond proceeds during the lifetime of the bond; and on the periodic allocation of proceeds and the associated environmental impact(s). Since the settlement of such standard, Green Bonds have been more and more commonly recognized as a serious and an interesting financing tool to finance environmental-friendly purposes. This is particularly due to firms’ increasing attention to environmental considerations following the stark facts of accelerating climate change. Accordingly, it is important to dig deeper into the understanding of the green bond financing and to contribute to the green bond literature, which so far has been underdeveloped. Therefore, our objective in this study is to investigate whether and how the market reacts to green bond issuances. More specifically, we aim to examine how green bond issuances are appreciated by market participants and whether they influence issuers’ financial performance. Understanding the market reaction to green bonds would help investors, issuers, and regulators better understand additional several aspects of green financing. Moreover, our study would have important implications for market participants in making relevant decisions when investing in green bonds.
Our study is based on two competing views. The first view suggests that the market reacts positively to the announcement of a Green bond issuance. The idea behind this view is that the announcement of a Green bond issuance might reflect a positive evolution of the issuer’s business model in the long term, in line with the new regulators’ environmental policies (e.g., carbon taxes), with a lower exposure to environmental risks and more attractiveness for the growing green and sustainable investor community, all suggesting more stable and profitable activities in the long run. The second view, however, suggests the opposite. Indeed, the announcement of the use of such an unknown financial tool, especially to finance a business transition seen, by investors, as a sustainability-focused activity, might be interpreted as causing uncertainty as to whether this potential new business model would remain as profitable as the previous ones. Such consideration might, therefore, make profitability projections be revised downwards, broadly leading to negative market reactions.
To investigate these two competing hypotheses, we consider a large sample of corporate green bonds to study the potential consequences of the issuance of a Green bond on the issuer’s financial performance. Our findings provide evidence that the financial market reacts negatively to the announcement of green bond issuances. We particularly show that the stock market reacts the day of the green bond announcement date and the day after, and that the cumulative abnormal return is between −0.5% and −0.2%, depending on the asset pricing model (CAPM, the 3-factor Fama, and the French the 4-factor Carhart models). Second, we find that this negative market reaction is more pronounced in developed countries (compared to emerging countries), for the first Green bond issuances (compared to the subsequent ones), and that the market does not react more to financial issuers or corporate (non-financial) issuers.
This article contributes to the existing literature on several aspects. First of all, it appears to be the only one using a dataset based on the compilation of all the publicly available Green bond databases as well as other databases in private access, thanks to the contribution of Amundi Asset Management, which list all the outstanding Green Bonds issued worldwide from all issuers. It also provides added value to the existing literature, notably the comparable study realized by Flammer (2018) in that the analysis proposes a distinction between issuers from developed markets versus emerging markets, but also financial versus non-financial issuers. Our findings, which come against Flammer (2018) help open the debate on the market reactions to Green bond issuances. Overall, this article provides new elements of a response to this issue by analyzing the Green bond issuances impact through an innovative approach using new models with a novel set of data.
The paper proceeds as follows: Section 2 provides a literature review. Section 3 introduces the data sets used and the methodology applied. Section 4 summarizes the results of the empirical tests, and Section 6 presents the main conclusions.

2. Literature Review

As a new financial instrument serving a novel approach of sustainable financing, Green bond issuances spark diversified reactions in the investors’ community. To better understand the very specific kind of investor reactions due to Green bond issuances, we go deeper into the existing literature dealing with traditional (non-Green) bond issuances and the resulting stock market reactions.

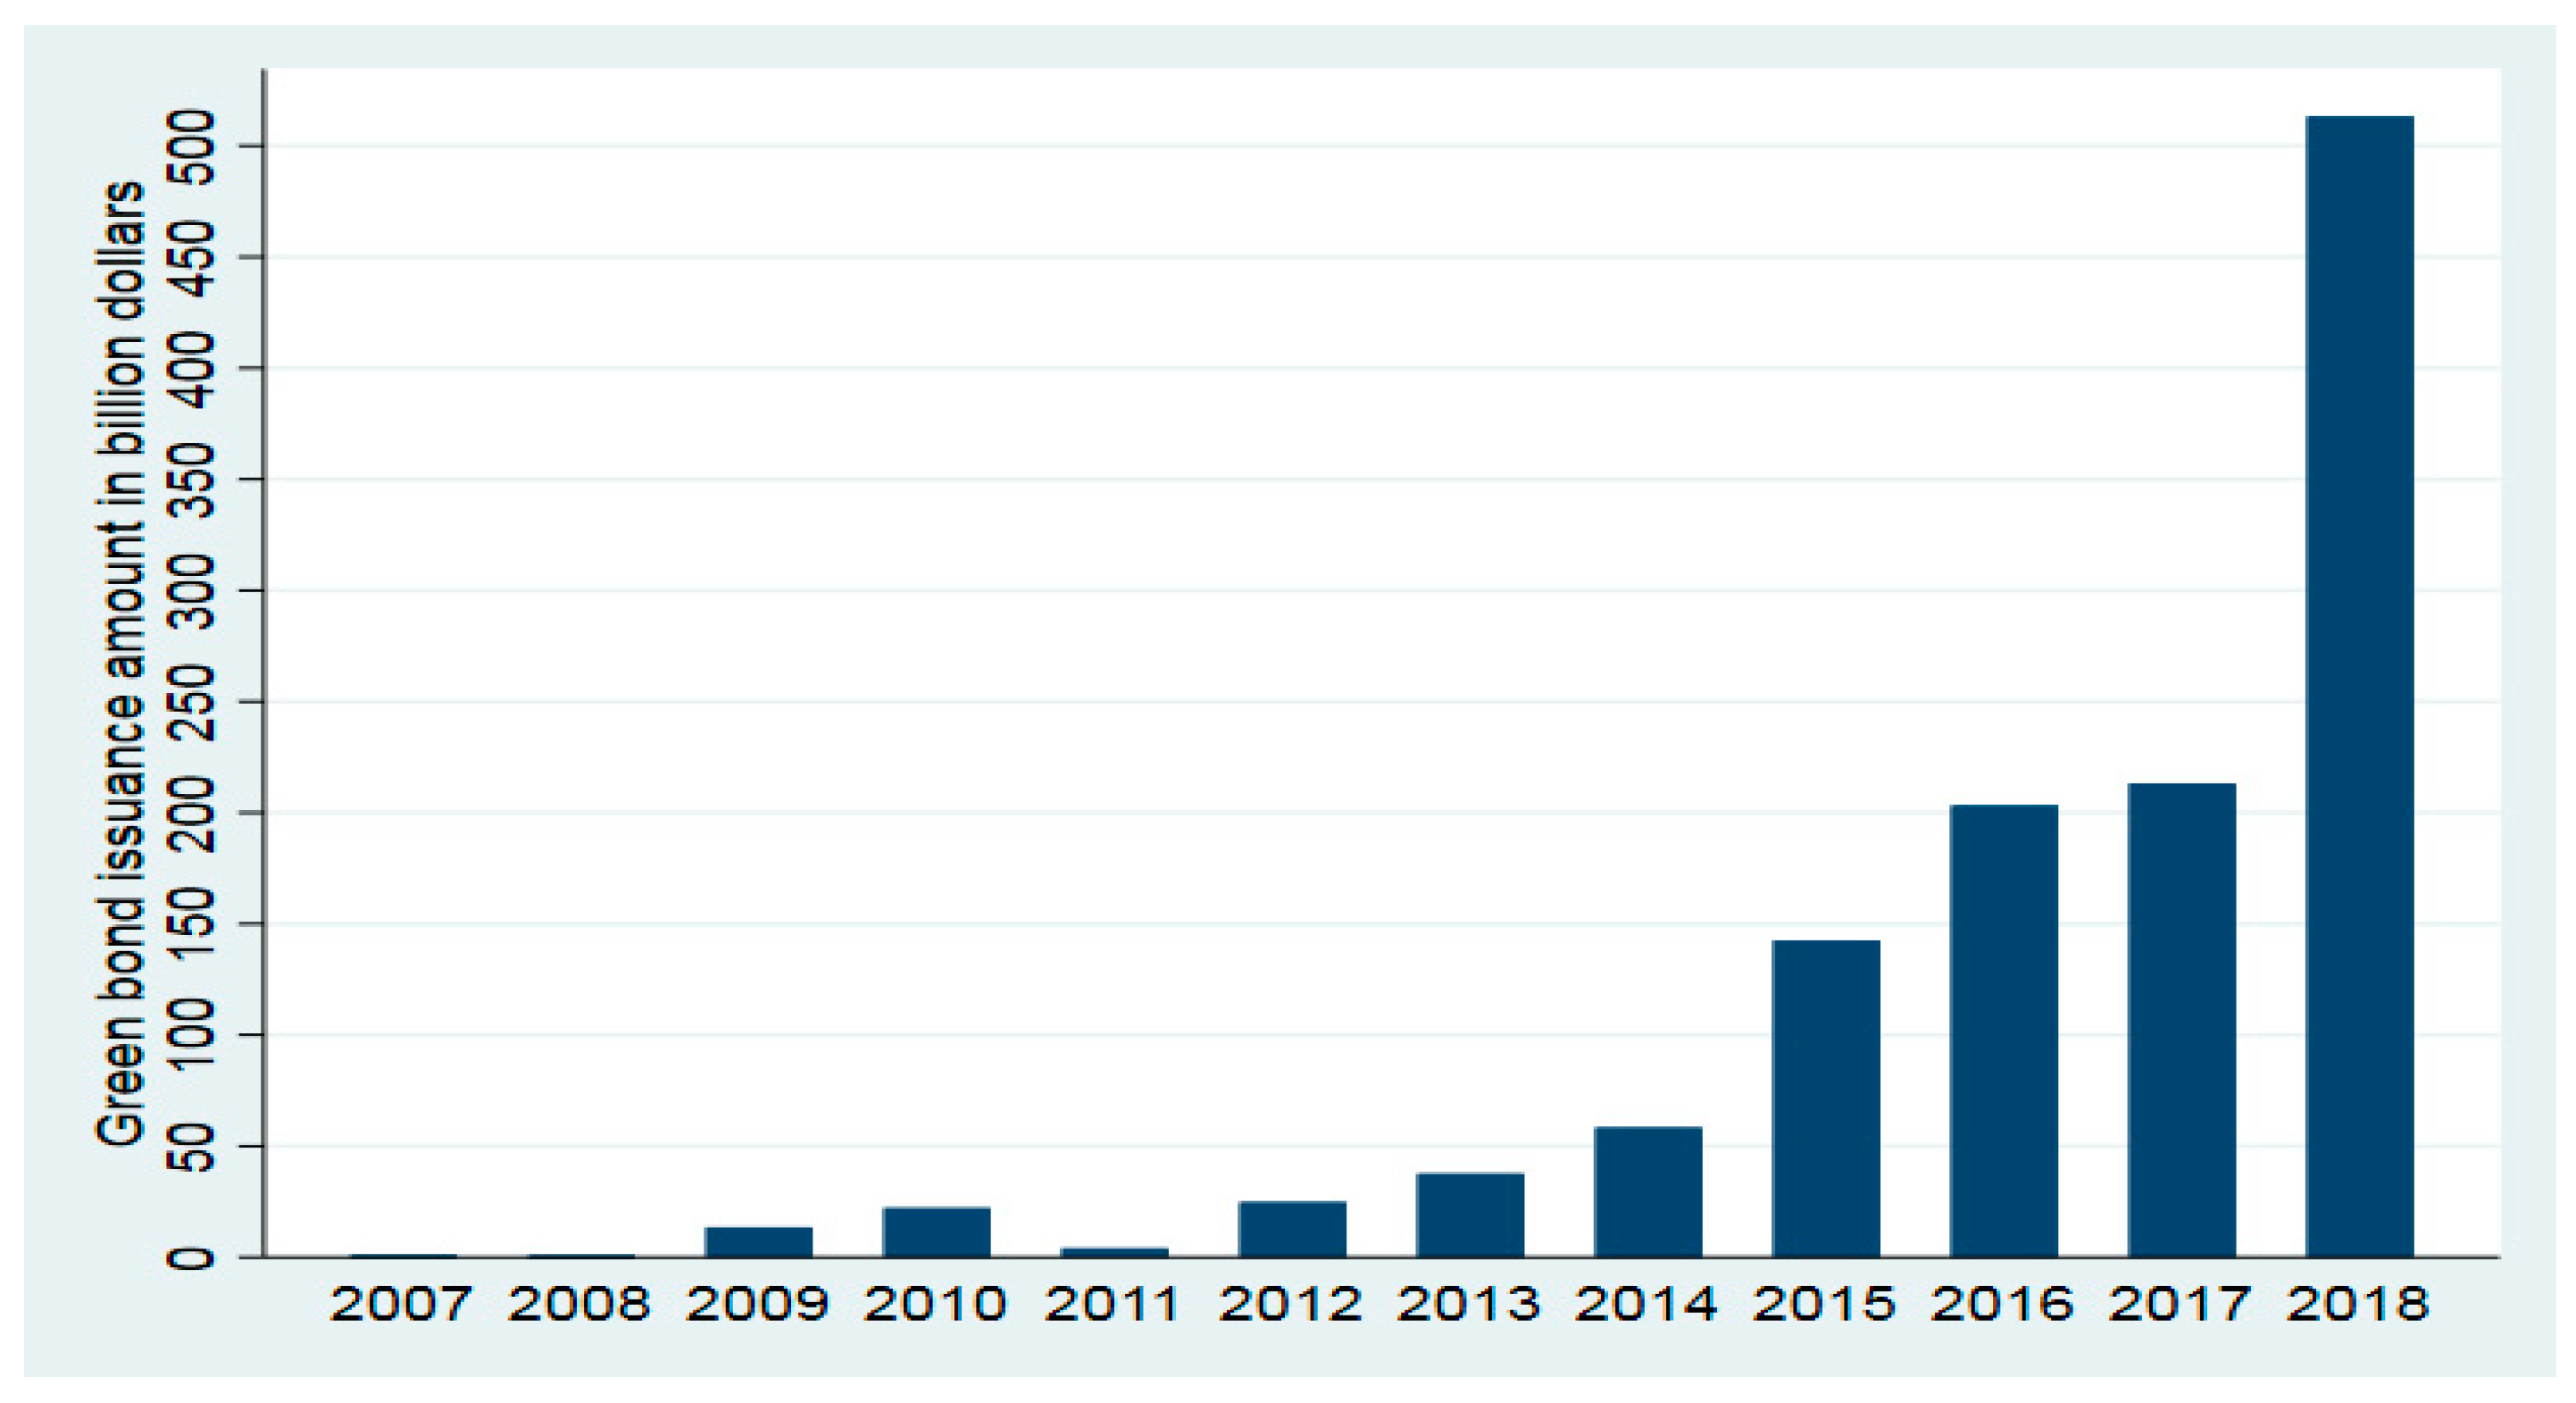
2.1. Issuances Effect on Bond Market

Financial markets have the singularity to be particularly reactive to information announcement of any nature: economic, political, etc. For many years, academic research focused on the equity market’s reactions following the disclosure of information, trying to understand the impact of such announcements and anticipate the underlying stock price evolutions. More recently, with the innovation on the bond market (convertible bonds, exchangeable bonds, etc.), many empirical studies, despite being inconclusive, have measured and explained the market reaction of these announcements. On the US market, the literature documents significant negative abnormal returns on average after the announcement of a new public offering of convertible debt. Dann and Mikkelson (1984) consider a sample of 132 public announcements of convertible debt issues made by 124 different firms over the 1970 to 1979 period and demonstrate that common stockholders earn significant negative abnormal returns at the initial announcement of a convertible debt offering.
De Roon and Veld (1995) investigate the announcement effects of convertible bond loans and warrant-bond loans offerings on the Dutch market. Using a sample of 47 announcements of convertible bond loans and 19 announcements of warrant-bond loans from January 1976 to December 1994, all listed on the Amsterdam Stock Exchange, the authors find that on average, stock prices present a positive but insignificant abnormal return for the announcement of a convertible bond loan and a significant positive abnormal return for the announcement of a warrant-bond loan. According to the authors, these results—unlike the US market—might be explained by the fact that Dutch corporations usually compile these information disclosures with other positive news related to the firm. Ammann et al. (2004) consider Swiss and German listed companies. Their results show that convertible bond and exchangeable bond announcements are associated with significantly negative abnormal returns. Moreover, the size of the equity part of an issue have a considerable influence on the announcement effect for convertible bonds but not for exchangeable bonds.
Based on the assessment of the potential effect of convertible bond announcements, Hemmingson and Ydenius (2017) consider a sample of Nordic European countries’ companies from 1992 to 2016. The authors find a negative and significant bond announcement effect. Their study shows that firm leverage is positively affecting the stock price reaction and that the relative issue size of the company is negatively affecting the price, which provides interesting evidence that the financial characteristics of a company can affect the nature of the announcement effects.
Focusing on 100 Malaysian companies’ bond issuances from 2000 to 2007, Sze and Hiau (2013) find positive cumulative average abnormal returns resulting from bond issuances, suggesting that the market interprets a debt issuance as a favorable new factor for a company. The cross-sectional regression analysis presents a non-significant relation of all the studies’ firm-level characteristics (profitability, growth opportunities, asset tangibility, size, and managerial ownership) with the cumulative abnormal returns. These findings suggest that the effect of the announcements of bond issuance has no correlation with company characteristics.

2.2. Green Bond Market

In the history of financial markets, the Green Bond is still a very new instrument and its efficiency for helping to tackle climate change has been subject to debates into the financial actors’ community. Since the beginning of this market, most of the research on Green Bonds has been led by private financial institutions.
The academic literature on Green Bonds is even more recent; almost all of the published articles and working papers have been published during the past two years, due to the growing availability of data and the increasing exchanges between professional and academic worlds on this new instrument. Kila (2019) gives a detailed definition and description of Green Bonds and explains how they could be a useful tool for financing climate change expenses. The lack of universally acceptable standards for defining “Green” and for measuring the application of green bonds and the potential for self-regulation of issuers are some challenges affecting the effectiveness of green bonds today. Using a combination of case studies, analysis of existing literature, and semi-structured in-depth interviews with 24 experts, Dupont et al. (2015) question the effectiveness of using Green Bonds for financing land conservation projects. The authors particularly find that projects linked to water and storm water management may be investment “sweet spots” for green bonds and land conservation.
In the existing literature, the financial interest for stakeholders that could potentially rise from Green Bonds is an important issue. Zerbib (2019) investigates the existence of a negative premium which is specific to green bond issuances. His findings show that lower yields can be observed for Green Bonds, comparatively to equivalent conventional bonds, especially for Investment Grade credit-rated, USD- and EUR-denominated, and sized-bonds over USD 100 Million. These findings highlight the potential financial implications of Green Bonds for both investors and issuers. Based on a US sample including 2083 green muni bonds issued between 2010 and 2016 and 19 corporate green bonds issued between 2014 and 2016, Baker et al. (2018) observe that these bonds have been issued at a similar premium to conventional bonds.
The notion of “greenium” has also been treated by Agliardi and Agliardi (2019), who questioned the financial interest of a Green Bond as a funding tool. The authors conclude that this green premium, that would make Green bonds a cheaper than conventional bonds, might be even more present and important for Green bond issuances with a high underlying asset volatility, high parameters that govern the green underlying technology, and low corporate tax rates. Other parameters that would affect a Green bond pricing have been proposed by Hachenberg and Schierech (2018) thanks to a comparison of daily spreads between green-labeled and non-green-labeled bonds of a same issuer; AA and BBB credit rated issuers might benefit from cheaper rates for Green Bonds than for conventional ones. This advantage is also generally observed for corporate and financial issuers, unlike government entities that might suffer from wider spreads for green-labeled bonds. The authors also analyzed the potential impact of other bond characteristics and provide evidence that the currency, the maturity, and the issue size would not affect spreads between green and non-green bonds. Finally, unlike the previous studies mentioned above, Larcker and Watts (2019), based on the same methodology as Hachenberg and Schierech (2018), defend the position that there is no such observable Green premium and that, generally, investors are definitely not willing to trade-off financial benefits for positive environmental and social externalities.
Not assessing the Green Bond financial characteristics at the time of the issuance but during the bond’s lifetime, Karpf and Mandel (2017) propose a detailed decomposition of the spread between Green and non-Green bonds in the US muni bond market. The authors conclude that the market penalizes green bonds to a higher degree than conventional non-Green Bonds when yield term structure evolution is compared. Karpf and Mandel (2018) observe that this positive and statistically significant spread between conventional bonds and green bonds can be explained by differences in the fundamental characteristics of the bonds: issuers of green bonds are in general more creditworthy and have more robust economic fundamentals.
Still focusing on the US muni bond market, Partridge and Medda (2018) create bond indices specific to the green-labeled and climate-aligned municipal bond market, primarily to test the competitiveness of the green sector of the muni bond market against the overall US muni bond market. Their results, through the period 2014–2017, reflect that green and climate-aligned muni indices present compound annual growth rates of 4.5%, compared with 3% for the S&P Investment Grade Municipal index, showing the outperformance of such green and climate-aligned financing tools.
Wulandari et al. (2018) focus their work on the Green Bond issuer side by assessing the relation between liquidity risk and yield spread evolution. The findings show that both the “LOT” liquidity and the bid-ask indicators are positively related to the yield spread. Eventually, the probability of success of environmentally-friendly projects could be increased by limiting the liquidity risk through the reduction of the source of adverse selection costs, such as transparency of green projects’ financial performance, consequently lowering the yield spread and the final funding cost for the issuer.
Potential benefits for Green Bond issuers have also been analyzed by Tang and Zhang (2018). The authors found that issuers’ stock prices increased significantly around the announcement of green bond issuance for firms in 28 countries during 2007–2017. The study also reveals that stock market reactions are stronger for first-time issuers than for repeated issuers, and also stronger for corporate issuers than for financial institutions. However, the authors also state that a Green Bond issuance cannot be considered to be a cheaper financing tool (compared to conventional bond) in the sense that they are not issued at lower yields than regular corporate bonds from the same issuers.
Katori (2018) investigates whether the nature of the green certification may have an influence on the financial characteristics of the bonds. Three schemes of green certifications exist on the market: the ICMA’s Green Bond Principles, the Climate Bond Certification from the Climate Bond Initiative, and the Green Bond Rating from Moody’s. The most significant result highlighted in this paper is that the value of the bond potentially increases due to the Climate Bond Standard’s certification. This study is interesting in that issuing entities would be likely to select an issuing scheme depending on whether they want to increase the value of their bonds or only reduce the concern of investors about risks. Rose (2018) summarizes the creation of climate bonds and other forms of green investment and reviews the information intermediary role played by organizations like the Climate Bond Initiative. This article also describes the current legal and governance system that regulates this role and discusses enhancements to this regulation that will help ensure that climate bonds, and the intermediaries that certify them, fulfill their intended purposes.
Combining both economic and ethical aspects, Revelli and Paranque (2017) question the ability of Green Bonds to constitute an ethical action with a measurable impact, creating ethical and sustainable value beyond economic and financial value. In this study, the authors highlight the importance of the use of proceeds, with traceability and measurability in time determined by investors, to make the Green Bonds have a real ethical value.
Also considering both financial and environmental aspects but through a more empirical and quantitative approach, Flammer (2018) establishes a series of empirical facts pertaining to corporate green bonds and documents their increasing prevalence in the corporate landscape. Moreover, the author examines how the stock market responds to the issuance of corporate green bonds and studies the implications for firm-level outcomes. Her findings show that corporate green bonds are used by companies to invest their proceeds in projects that effectively improve the company’s environmental footprint and ultimately contribute to long-term value creation. Another interesting finding suggests that companies are able to attract an investor clientele that values the long term and the environment.
Next to the financial performance analysis, which represents the largest part of the literature on Green Bonds, another side explores other dimensions inherent to Green Bonds. Glavas and Bancel (2018) suggest understanding what are the main drivers of a Green Bond issuance; by analyzing a set of green bond and matched non-green bond issuers in 27 countries for the 2013 to 2017 period. Their findings suggest that, first, firms issuing green bonds partly suffer from agency issues, given the consistency of the significant negative coefficient of cash dividend payout. Second, they highlight the predominance of the state ownership in the decision to issue green bonds, which confirms the state-driven stakeholder motive.
Nevertheless, States, more and more present as issuers, do not play a decisive role as regulators in the Green Bond market. The governance of the Green Bond market is decentralized and has been naturally carried out by a constellation of private entities to determine market adoptions. The recent study of Park (2018) explains how private governance is often faster to implement standards and more responsive to the needs of market participants, but how it may suffer from a lack of legitimacy, accountability, and consistency and be susceptible to greenwashing. In that context, the author proposes hybridity to explore when and how collaboration between private standards and public regulation may be desirable in the green bond market.
In addition to associations, agencies, or organizations (such as the International Capital Market Association or the Climate Bond Initiative) that set up a framework and standards on the Green Bond market, another essential role is played by other private entities which provide second opinion on Green Bond issuances. Mostly conducted by ESG research companies (e.g., Sustainalytics, Vigeo-Eiris, ISS-Oekom) or environmental assessment experts (e.g., CICERO), such a role consists of helping investors to invest in such bonds by providing them with analyses of both the issuer and the framework of the issuance, and consequently assessing the credibility of the Green Bond. When some entities run in-depth qualitative analysis of Green Bonds, some others also determine quantitative ratings to classify such bonds from the greener to the “browner”, helping sustainable investors pick such bonds based on their level of “greenness”. However, the heterogeneity and opacity of underlying assessment methodologies limits the potential help provided by these entities. Reed et al. (2017) propose a framework that demonstrates how to achieve a sufficiently rigorous rating while keeping the cost of the rating process affordable. This proposition is one of the first tools to help guide investors’ internal assessments of green bonds and better understand the strengths and gaps between emerging commercial ratings.
Overall, the literature so far has not provided a conclusive evidence on the potential consequences of green bond issues. Indeed, the underlying interpretations, both from a financial and extra-financial perspective, show the absence of a consensus on the effects of Green bond issuances by the academic sphere.
Expanding on the aforementioned literature on bond and green bond markets, our objective is to help bring new elements to this issue by studying the market reactions to the issuance of corporate green bonds using different asset pricing models and different event windows.
This article contributes to the existing literature in several ways. First of all, it appears to be the only one using a dataset based on the compilation of both all the most recent and publicly available Green bond databases and private databases, thanks to the contribution of Amundi Asset Management, which initially lists all the outstanding Green Bonds issued worldwide by all issuers. It also provides added value to the existing literature, notably the comparable study realized by Flammer (2018) in that the analysis proposes a distinction between issuers from developed market versus emerging market, but also financial versus non-financial issuers. Our findings, which disagree with those of Flammer (2018) help to open the debate on market participant reactions to Green bond issuances.

3. Data and Variables

During the first stages of the development of the Green Bond market and still today, most of the market participants have built their own Green Bonds databases. For example, institutional investors that present a strong appetite for Green Bonds have their own green bond datasets. Similarly, large commercial banks participating in green bond issuances, as underwriters, usually have their own listings of Green Bonds due to their decisive positions in the primary bond market. These entities are considered to be pioneers of Green Bond data collection and exploitation.
Over the past several years, new entities that also work on such data collection have emerged. As of March 2019, we count five official Green Bond data providers, which differ from one another based on aspects such as accessibility, coverage, and the type of information provided. For more details on the different Green bond data providers, please refer to the Appendix A.

3.1. Green Bond Data

As described above, we can see that there is no centralized Green Bond database and that the existing data sources differ from one to another in several ways. Accordingly, one major challenge in our study is to obtain the most exhaustive list of Green Bonds issued worldwide since the inception of the market, in order to represent the market status in the most exact way. Below are the different steps we followed to reach this objective.

Data Aggregation

First, we centralized all the available databases on the market to compare their differences in terms of time coverage, the nature of the bonds included, and the nature of financial and extra-financial indicators.
It is important to mention that, for some marginal cases, the number of Green Bond issuances from the same issuing entity differs from one database to another. In these cases, we first checked that the biggest list of Green Bonds issued by the entity contains, at least, all the issuances that are present in the other database(s). After verification, we then kept the largest sample of Green Bond issuances from a unique issuer.
We also noticed that, depending on the scope considered by the different data providers mentioned above, sustainability bonds (bonds for which the proceeds are used for both environmental and social-related purposes) were also sometimes included in the green bond list, notably for Bloomberg and Dealogic2. Consequently, the first sample size was about 3154 bond issuances.
We then retrieved the financial characteristics associated with each of these 3154 green bond issues (more details about the selected financial characteristics of the issuances can be found below, in the Issuance characteristics selection). We restrict our sample to green bond issues with non-missing financial characteristics.
We also removed all the green asset-backed securities and mortgage-backed securities because we estimated that such securities are not considered as green bonds because they involve securitizing loans related to low carbon assets. Overall, these sample selection restrictions resulted in a sample of 2079 Green bond issuances, with a range of fully available financial data.3

3.2. Firm-Level Data

Security data. We collected stock price information from the Center for Research in Security Prices (CRSP) for U.S. firms. We also used the security daily database of Compustat Global to obtain daily stock prices for non-U.S. firms. In doing so, we required each firm included in our sample to have (1) price data until at least one day after the event date, (2) available returns during the estimation window so that the estimated returns can be calculated, (3) available returns during the event window so that the cumulative abnormal returns (CAR) can be calculated. In addition to the firm-level stock price information, we also collected market index prices for each country from the FactSet database. We used the S&P500 index for the U.S., and the country’s leading market index for all other countries.
Accounting data. We supplemented our database with financial and accounting information on green bond issuers that are included in our sample. We particularly used the Compustat North America and Compustat Global to construct the following variables: (1) Size, the natural logarithm of total assets; (2) Leverage, the ratio of debt in current liabilities plus total long-term debt to total assets; (3) ROA, the ratio of operating income before depreciation to total assets; (4) Tobin Q, the sum of market value of equity plus book value of debt divided by total assets; (5) MTB, the ratio of book value of total assets minus the book value of equity plus the market value of equity to the book value of total assets; (6) Tangibility, the ratio of net property, plant, and equipment to total assets; (7) Loss, a dummy variable that takes the value of one if the firm’s ROA is negative; (8) Age, the difference (in years) between the current year and the IPO year of the company.

3.3. Descriptive Statistics

The green bond market has grown significantly since its inception in mid-2007. Indeed, more and more companies have entered the market after the European Investment Bank issued the first green bond that amounted about 674 million dollars. Figure 1 displays the evolution of the green bond market over time. We plot the total amount of issued green bonds over the past few years based on our green bonds sample described above. In this graph, we show that the green bond market has grown slightly until 6 years after its beginning in 2007. However, in 2013, the green bond market has seen phenomenal growth in terms of both value and number of issuances.4 From 2014 the market started expanding at a rapid pace, reaching a total amount of about 513 billion dollars in 2018, mostly due to the arrival of commercial banks and corporates as a consequence of the release of the Green Bond Principles from the ICMA.
In Panel A of Table 1, we further outline the distribution of our 2079 sample green bonds across countries. Column (1) shows that the green bond market has become largely driven by China, which issued a total number of 677 green bonds over our sample period. This has even exceeded the number of green bonds issued by supranational organizations, which used to be considered as the most frequent issuers until 2013, when the market started growing rapidly. An additional important characteristic of the green bond market is that it is dominated by the European countries and the United States, as well as Asian countries in recent years, especially since 2015. This was the year of the release of the Green Bond Endorsed Project Catalogue, a newly recognized local market standard for issuing Green Bonds.
In Column (2) of Table 1, we restrict the cross-country description to our main green bonds sample that is included in our study, i.e., green bonds issued by financial and non-financial corporations that are publicly listed. To obtain this sample, we applied the following data selection process. We started from the initial 2079 green bonds described in Section 3.1. Among those green bonds, we dropped those that are issued by governmental institutions and selected those issued by publicly-listed financial and non-financial firms.5 We then matched the resulting sample of green bond issuers with firm-level data (both security and accounting data) described in Section 3.2. This selection process yielded a final sample of 475 green bonds issued by 145 unique issuers. This sample is quite comparable to those obtained in previous studies (e.g., 241 green bonds in Tang and Zhang (2018) and 368 green bonds in Flammer (2018)). In Column (2) of Table 1, we show that the cross-country distribution of our final sample is quite similar to that of the original green bonds sample. In particular, the bulk of our final sample is also concentrated in the hands of U.S., European, and Asian countries.
In Panel B, we provide summary statistics on the green bond amounts by industry. We note that both the original sample and the public issuers’ sample are roughly similarly distributed across industries. For example, we notice that, in both samples, corporate green bonds are commonly issued in the financial sector. More importantly, we observe that green bonds issues are more prevalent in the transportation industry, where environmental issues are extremely relevant.
In Table 2, we provide summary statistics at the bond-level (Panel A) and at the issuer-level (Panel B). In Panel A, we distinguish the whole sample and the sample of green bonds issued by publicly-listed firms included in our study. Both samples exhibit similar characteristics, particularly in terms of coupon rate, bond maturity, and issued amount. Panel B displays descriptive statistics on the characteristics of green bond issuers. For example, we notice that green bond issuers are large in size, exhibit an average leverage ratio of about 35%, and an average proportion of tangible assets of about 30% in total assets. These statistics are largely in line with those reported in previous literature e.g., (Tang and Zhang 2018).

4. Model and Results

4.1. Event Study Methodology

In this section, we examine the capital market reaction, i.e., the stock price effects, to the announcement of corporate green bond issuances by implementing an event study methodology. Based on all the databases that we used to collect green bonds data, we also obtain information, from Bloomberg terminals, on the date on which the company announces that it will issue a green bond, i.e., the announcement date, which we consider as our event date. Indeed, this date is likely to convey more new information to the financial market, and is thus more relevant to our event study analysis than the issuance date.
In studying the shareholder wealth effects of the green bond announcement events, we focused on daily cumulative abnormal returns (CARs). CAR is equal to the sum of the daily abnormal returns, which are defined as the difference between the realized returns and the expected returns. We therefore started by estimating the expected returns using the CAPM model. Specifically, we estimated the market model parameters, αi and βi, for each firm-event date pair using estimation windows of 250 trading days ending 50 days before the considered event date to ensure that the predictive factors are not affected by event-related information. We estimated the following regression:
Rit = αi+ βi × Rmt + εit
where Rit is the daily (t) return of firm i, Rmt is the country-specific market return,6 and εit is the residual term.
We then used the estimated market model parameters to predict the expected stock returns (Ȓi) for each day t belonging to the event window as follows:
Ȓit = α̑i + β̑i × Ȓmt.
Next, we calculated the daily abnormal return by subtracting the estimated return from the realized returns for each day t around the event window as follows:
ARit = Rit − Ȓit.
In a last step, we calculated the daily CARs as the sum of abnormal returns over the event window.

4.2. Event Study Results

Table 3 displays the event study results for different event windows. We particularly focused on the two-day [0, 1] CARs around the announcement date (day 0). We further considered additional time intervals before and after our two-day event window as way to investigate whether there is any event-related pricing information that could influence stock prices prior to or after the occurrence of the event. We particularly considered the following time intervals: [0, 1], [−1, 1], [−3, 3], [−5, 5], and [−20, 20].
Results presented in Table 3 indicate that, across different event windows, we found negative CARs suggesting that the market reacts negatively to the announcement of green bond issuances. We show that only the average CARs around the two-day event window [0, 1] and the three-day event window [−1, 1] are negative and statistically significant at the 5% level. This particular result indicates that the stock market reacts negatively after the green bond announcement date, and that the CAR is approximately −0.2%. This effect means that the green bond issuing firms achieve an abnormal return that is 0.2 percentage points lower than the expected return. Using the non-parametric sign test, we also show that the percentage of stocks with negative CARs are higher than those experiencing positive CARs, which is consistent with our main finding. Across the remaining event windows, the stock market reaction is insignificant.

5. Additional Analysis and Robustness Tests

In additional analyses, we also investigated how the documented stock market reaction varies according to several characteristics of the green bond issues. We particularly focused on the cumulative abnormal return (CARs) estimated over the two-day event window from day 0 to day 1 around the announcement of green bond issuances. In Panel A of Table 4, we distinguished between first-time issues from subsequent issues. Not surprisingly, we found that the CARs of the first issues are more than twice larger than those of the subsequent issues, indicating that investors would pay more attention to the first time a company announces its green bond issue that later times.
In Panel B, we also differentiated green bonds issued in developed markets from green bonds issued in emerging markets. Interestingly, the results show that developed markets react more negatively to the green bond issues than emerging markets.
In Panel C, we split our sample into two groups according to the business sector of the green bond issuers: (1) green bonds issued by financial corporations and (2) green bonds issued by non-financial corporations. We show that, although financial green bonds issuers experience significantly lower CARs that do non-financial corporations, the magnitude of the difference is still very small. This result indicates that the market pays almost the same degree of attention to financial institutions that issue green bonds to finance their borrowers’ green projects as it does to non-financial corporations that use the green bonds’ funds to directly finance their green projects.
We also tested the robustness of these results to the use of alternative models to estimate the abnormal returns, namely the Fama and French 3-factor model (Fama and French 1993) and the Carhart 4-factor model which adds the momentum factor to the Fama and French model (Carhart 1997). We found that the results remain qualitatively the same, with more negative CARs for first-time green bond issues, more negative CARs for green bonds issued in developed markets, and almost no difference between green bonds issued by financial or non-financial corporations.
Overall, the evidence in this section suggests consistent results that green bond issues do not create value for issuing firms around the announcement date. This result contributes to the existing literature on the effects of conventional (non-green) bond issuances.
To dig deeper into the understanding of the negative reaction to green bond issues, we examined the variation of the cumulative abnormal returns (CARs) in the cross-section. For this aim, we run an additional test to identify the different firm-level characteristics that influence the CARs. We particularly estimate an OLS regression model where the dependent variable is the cumulative abnormal returns (CARs) obtained through Equation (3). The independent variables are a series of firm-level characteristics. We estimated the following model:
CARit = β0 + β1 × ROAit + β2 × LEVERAGEit + β3 × MARKET_VALUEit + β4 × MTBit + β5 × TANGIBILITYit + β6 × SALES_GROWTHit + Year_FE + Industry_FE + Firm_FE + Country_FE + εit,
where subscripts i and t represent issuing firm i and year issue t. The independent variables are a series of firm-level characteristics defined in Section 2.2. We also controlled for year, industry, firm, and country-specific effects to account for the leftover variation that is due to year, industry, firm, and country-specific factors.
Table 5 reports the results of this additional test. We found that the CARs depend mainly on LEVERAGE, MTB, and GROWTH. More specifically, we observed that CARs increase with the increase in LEVERAGE, which reflects better access to debt markets and hence less financial constraints. This particular result suggests that firms facing lower financial constraints react more positively to the issuance of green bonds than firms with more severe financial constraints. Additionally, we showed that CARs are positively related to firm growth opportunities as measured by MTB and SALES_GROWTH, suggesting that green bond issuance triggers a more pronounced market reaction for firms with higher growth prospects than firms with lower growth prospects.
Overall, these results suggest that the documented negative reaction to green bond issuance is mitigated for issuers with less binding financial constraints and issuers with more growth opportunities.

6. Conclusions and Future Research

The purpose of this study is to determine whether the issuance of a Green Bond is considered as good news for the market participants by generating abnormal returns around the announcement date. Using the event study methodology with different asset pricing models and different event windows, the results above show that the market reacts negatively to the announcement of a new corporate Green Bond issuance. The evidence presented in this paper documents empirical regularities in the stock price responses to corporate green financing decisions, as shown for non-green financing decisions. Even though no satisfactory explanation of the results is provided, we demonstrate the importance of green bonds as a new issue in corporate finance theory. Further investigation of the green bond-financing source is a challenging subject for future research.
A possible interpretation of our results would be that the announcement of a new Green Bond issuance, which is tantamount to the announcement of an upcoming evolution of operational and capital expenditures to make them more sustainable, might be interpreted by investors as providing uncertainty regarding whether this potential new business model would remain as profitable as it has been so far. Such a consideration might, therefore, make profitability projections be revised downwards, broadly leading to negative market reactions. This interpretation might be relevant, regarding the results presented here, to the extent that investors would rationally not review their expectations twice at the second issuance of a Green Bond, already being aware of the new strategic orientation of the issuer, and would not necessarily discriminate financial and non-financial issuers since sustainable and environmentally-friendly business strategies involve the same evolution of companies’ risk exposure and profitability expectations. The fact that the Green Bond is still a very new and unknown instrument, and that its efficiency to help tackle climate change remains subject to debates into the financial actors’ community might confirm this interpretation. For example, investors might integrate, when valuing a company, the risk of Greenwashing and its potential consequences on the stock market.
In additional analysis, we show that developed markets react more negatively to Green bond issuances than emerging markets. This particular result might indicate that developed market issuers are likely to face higher legal constraints on transparency than emerging market ones. An issuer using the Green bonds proceeds for greenwashing would then be easily identified by investors, conveying a higher reputational risk, which would make investors adapt their investment strategy consequently and “punishing” such practices by divesting, resulting in a negative market reaction. Our cross-sectional analysis also shows that the market reaction is even more pronounced at the first Green bond issuance than for the subsequent ones, which might be explained by the fact that investors have already value the issuer as a consequence of the first Green bond issuance, and do not reconsider this valuation for the next ones, being already aware of the new issuer’s policy and business model. This explanation seems to be aligned with the main interpretation on the global negative market reaction explained above. Finally, we observe that the market does not particularly reacts more for financial issuers than for corporate issuers. Knowing that corporate issuers finance directly green assets and projects with the Green bond proceeds, compared to financial issuers that use these proceeds to finance corporates through loans, it seems that investors anticipate the same risk due to the final exposure of the same typology of assets invested, no matter whether it is a direct or indirect financing.
Focusing on Green investors, this article particularly brings interesting managerial contributions for portfolio managers investing in Green bonds, either from an equity or a credit investing perspective, in the sense that it could allow them to anticipate market movements, review their evolution expectations, and consequently adapt their portfolio management strategies. These findings can also be of managerial interest for Green bonds issuers by bringing awareness about the potential negative effects of such a financial operation, thereby properly and transparently disclosing information related to the use and the management of the Green bond proceeds to investors and helping to tackle potential misunderstandings linked to the business’ sustainable development.
To go further on this topic, future research might try to better understand such market reactions by analyzing market participants behaviors more deeply, especially investors, their specific interpretations of Green bond issuances, how it affects their vision, and the resulting actions in portfolio management. On the issuer side, an interesting future field of research would be analysis of the role of the issuer’s information disclosure quality and transparency on the market.

Author Contributions

This article has been realized thanks to the contribution of S.L.J., as a research leader, orienting the approach to solve the problematic and supervising the whole organization and construction of the working paper; S.S., for her expertise on quantitative models, tools and data analysis; and M.L. for his professional experience on Green bonds market and scientific literature knowledge on this topic. All authors have read and agreed to the published version of the manuscript.

Funding

This research received no external funding.

Acknowledgments

We gratefully acknowledge the helpful comments and suggestions from both academic and professional contributors that helped designed, nourished and refined this study. We thank the participants of 2019 Vietnam Symposium in Banking and Finance. All errors are our own responsibility.

Conflicts of Interest

The authors declare no conflict of interest.

Appendix A. Definitions and Sources of Variables

Appendix A.1. Overview of the Different Green Bond Data Sources

Bloomberg: As of today, Bloomberg can be considered as the first financial software tools provider in the world, massively used by almost of the market participants in financial markets, and also the most used tool to collect information on Green Bonds. In 2014, it develops its own listing of Green Bonds into its Bloomberg Terminal. Bloomberg labels bonds with “Green” use of proceeds when the issuer self-label its bond issuance as “Green” or officially commits to provide dedicated statements about the climate-aligned use of proceeds, in line with the categories mentioned in the ICMA’s Green Bond Principles.
Bloomberg’s Green Bond data coverage starts from the first Green Bond issuance in 2007. As of March 2019, the base counted 1125 bonds earmarked as “Green”. The data base offers an interesting level of transparency by providing both financial bond documentation and status on the disclosed/follow-up allocation and environmental impact reporting.
Dealogic: Like Bloomberg, Dealogic is a financial markets platform that provides content and analysis via a service to financial firms. It launched a platform dedicated to Green Bonds in 2015. This data provider service covers 489 Green Bond issuances from 2007 and differs in the sense that Dealogic makes its own Green project categories to classify the different types of use of proceeds, depending on the nature of the underlying assets/projects financed through the Green Bond issuances. In a more marginal way, Dealogic also covers Social and Sustainability Bonds through this service.
Environmental Finance: Environmental-Finance.com, created in 1999, provides sustainable finance-related news and analysis services. The company recently started publishing qualitative information related to Green Bonds through detailed articles and in 2016, providing a Green Bond database. Like Bloomberg, Environmental Finance lists all bonds that are self-labeled as “Green” by the issuer, but differs in that in considers other standards than the ICMA’s Green Bond Principles: The Climate Bonds Initiative (CBI)’s the Climate Bonds Certification, the People’s Bank of China’s Green Financial Bond Directive and the Green Bond-Endorsed Project Catalogue and also all the other self-labeled Green Bonds not aligned with any specific market standard. Such broad inclusions allow data users make their own opinion on what is considered as Green and what is not, depending on the standard considered. Environmental Finance’s data base is particularly interesting in that it includes a detailed description of the use of proceeds and makes accessible all the related documentation of the Green Bond issuance: investor presentations, Green Bond frameworks, second opinion reports, and periodic allocation and environmental impact reporting. As of September 2018, the base was composed of 859 Green Bonds, also starting in 2007 with the first Green Bond issuance by the World Bank.
Climate Bond Initiative: The database from the Climate Bond Initiative (CBI) is probably the most common used source of data related to Green Bonds. A dedicated market team lists all bonds aligned with the ICMA’s Green Bond Principles but also all the bonds aligned with their own taxonomy, which provides a view on what is considered as an “eligible use of proceeds” for green bonds. According to these eligibility criteria, the Climate Bond Initiative has, in parallel of this data service, a role of certifier recognized worldwide by the Green Bond market practitioners. The Green Bond database has been accessible since 2013 through an internet browser and contains 2025 Green Bonds as of January 2018, also starting in 2007 with the first Green Bond issuance by the world bank.
Trucost: Recently acquired by Standard and Poor’s Global in 2016, Trucost’s core activity is the assessment of companies’ risks related to climate change, natural resource risk exposures and environmental, social, and governance (ESG) factors. It provides, through a dedicated tool accessible on internet, a large panel of environmental-related indicators linked to companies’ activities and exposures and, more recently, a Green Bond database covering 178 Green bond issuances.
Despite this relatively small coverage, Trucost’s approach is interesting in that it proposes, beyond usual financial and ESG-related information, both the carbon footprint of the issuers on several scopes, the classification of the use of proceeds by asset/project categories and from a geographical localization’s perspective but also several environmental impact quantitative indicators to assess, Green Bond by Green Bond, the concrete impact of such use of proceeds.
Shenzhen Securities Information: Shenzhen Securities Information Company (SSIC), fully owned by the Shenzhen Stock Exchange (SSE), is a Chinese provider of financial market indices and financial information services.
Elaborated through the collaboration between the Shenzhen Securities Information (SSI), the International Institute of Green Finance (IIGF) and the Central University of Finance and Economics (CUFE), the Chinese CUFE-CNI High Grade Green Bond Total Return Index is designed to reflect the performance of a list of Green Bonds issued by Chinese entities only, whose proceeds are only used to fund environmentally friendly projects according to the definition of the Green Bond Support Project Catalogue. If the proceeds are not used to finance an asset or project in line with the catalogue, it can be considered as Green if, and only if, the proceeds are used for business-as-usual purposes and if, at least, 90% of the revenue of the issuer are coming from the an environmentally-friendly activity.
This index is constituted by bonds RMB-denominated, considered as “Green” by the IIGF and issued and settled in either exchange or inter-bank bond market. Other integration selection rules are publicly accessible on http://www.cnindex.com.cn/docs/gz_CNB00013_e.pdf. As of February 2019, the index lists 1210 Green Bonds issued in the Chinese Green Bond market.
Amundi: As one of the main investors in Green Bond worldwide, Amundi’s ESG research department progressively built its own Green Bond data base in order to centralize both financial and ESG-related information on Green Bonds. The purpose of such development is linked to the will to better understand the evolution of Green Bond issuer’s practices overtime and report consequently at client’s portfolios level.
Incrementally nourished with new issuances worldwide, Amundi’s Green Bond database contains a panel of financial, ESG-related and carbon-related data assessing, as of March 2019, more than 350 Green Bond issuances. For confidentiality reasons, the names of the underlying data provider(s) and the nature of the related agreements cannot be publicly disclosed.
Following are both the financial and extra-financial characteristics we chose to select in order to define and bring precision about the nature of the different Green Bond issuances.
-
Announcement date: date on which the bond issue was officially announced by the issuer in the financial market platforms (e.g., Bloomberg),
-
Issuance date: date on which the bond has been issued on the primary bond market,
-
Maturity type: nature of the maturity of the bond determined by the issuer,
-
Maturity date: date on which the principal of the bond becomes due and is repaid to the bondholder,
-
Amount issued: amount of money raised by the issuer in the primary market through the bond issuance,
-
Amount issued (USD equivalent): amount of money raised by the entity in the primary market through the bond issuance, expressed in USD with the exchange rate at the time of the issuance,
-
Coupon: annual coupon payments paid by the issuer relative to the bond’s face or par value,
-
Currency: currency used by the issuer to raise funds on the primary market.

Appendix A.2. Financial Characteristics

-
Issuer name: name of the entity that issued the Green Bond,
-
Issuer type: nature of the issuer (it can be either a non-financial corporate, a financial institution or a SSA (Sovereign, Supranational and Agencies),
-
Sector and sub-sector: sector and sub-sector (if relevant) to which the issuer belongs, according to Bloomberg’s categorization,
-
Credit rating: rating that a rating agency assigns to a borrower after assessing its ability to repay the principal and interest on any or all of its debts,
-
Issuer’s country: country to which the issuer belongs, identified with its Alpha-2 code, a two-letters country code defined by the International Organization for Standardization (ISO).

Appendix A.3. Extra-Financials Characteristics

Issuer’s Green Bond documentation:
  • o Green Bond Framework: public document, released at the time of the issuance by the issuer, disclosing what are the expected use of proceeds, process for project selection and evaluation, management of proceeds and way of reporting. The framework also contains other relevant information related to the issuance or the issuer, such as the review from a second party opinion and/or a third-party verification, the sustainability objectives and practices of the issuer, some examples of potential projects to be financed, etc. This document is mandatory in respect of the ICMA’s Green Bond Principles.
  • o Second Opinion Report: public document, released at the time of the issuance by the issuer itself or the entity that realized the second opinion, that certify the compliance of the issuer’s framework with the ICMA’s Green Bond Principles. Such document is usually realized through a collaborative work between the issuer and an entity specialized on ESG and/or environmental analysis. This document is mandatory in respect of the ICMA’s Green Bond Principles.
  • o Investor Presentation: public or private document, released by the issuer before the time of the issuance and (usually) to potential investors, presenting both financial and extra-financial relevant information associated with the entity’s activity and the upcoming bond issuance. This document is encouraged to be disclosed in respect of the ICMA’s Green Bond Principles but is not mandatory.
  • o Green Bond Reporting: public document, released periodically (usually annually at the Green Bond issuance birthday) by the issuer, to report to investors on the allocation and on the environmental impact of the use of proceeds. This document is mandatory in respect of the ICMA’s Green Bond Principles.
  • o Environmental Impact Calculation Methodology: public or private document, usually incorporated into the Green Bond reporting, released by the issuer into which it explains how the environmental impact of the use of proceeds has been calculated. This document is encouraged but not mandatory in respect of the ICMA’s Green Bond Principles.
Green Bond market standards: The very meaning of a “green” asset has, for years, been subject to debates and interpretations, splitting opinions and consequently avoiding the settlement of a market standard for a green definition. As of today, we acknowledge two internationally-recognized market standards to consider a bond as green: the Green Bond Principles disclosed by the International Capital Market Association (ICMA) and the Climate Bond Standard disclosed by the Climate Bond Initiative. Other marginal guidelines exist all over the world. We count around six other regional green standards, mainly in Asia (e.g., the China Green Bond Guidelines, the Hong Kong Green Bond Guidelines, the ASEAN Green Bond Standards or the Japan Green Bond Guidelines), Africa (the Nigeria Green Bond Guidelines) or in Latin America with the Mexican Green Bond Principles. Like most of the global investors and issuers of Green Bonds, we will only consider the first two ones, the ICMA’s Green Bond Principles and the CBI’s Climate Bond Standard as the references on the market today.

References

  1. Agliardi, Elettra, and Rossella Agliardi. 2019. Financing environmentally-sustainable projects with green bonds. Environment and Development Economics 24: 608–23. [Google Scholar] [CrossRef] [Green Version]
  2. Ammann, Manuel, Martin Fehr, and Ralf Seiz. 2004. New Evidence on the Announcement Effect of Convertible and Exchangeable Bonds. Academic Journal of Multinational Financial Management 16: 43–63. [Google Scholar] [CrossRef] [Green Version]
  3. Baker, Malcolm, Daniel Bergstresser, George Serafeim, and Jeffrey Wurgler. 2018. Financing the Response to Climate Change: The Pricing and Ownership of U.S Green Bonds. Rochester: SSRN. [Google Scholar]
  4. Carhart, Mark. 1997. On Persistence in Mutual Fund Performance. Journal of Finance 52: 57–82. [Google Scholar] [CrossRef]
  5. Dann, Larry Y., and Wayne H. Mikkelson. 1984. Convertible Debt Issuance, Capital Structure Change and Financing-Related Information: Some New Evidence. Journal of Financial Economics 13: 157–86. [Google Scholar] [CrossRef]
  6. de Roon, Frans, and Chris Veld. 1995. Announcement Effects of Convertible Bond Loans and Warrant-Bond Loans: An Empirical Analysis for the Dutch Market. Journal of Banking and Finance 22: 1485–506. [Google Scholar] [CrossRef]
  7. Dupont, Carolyn, James Levitt, and Linda Bilmes. 2015. Green Bonds and Land Conservation: The Evolution of a New Financing Tool. Rochester: SSRN. [Google Scholar]
  8. Fama, Eugene Francis, and Kenneth French. 1993. Common risk factors in the returns on stocks and bonds. Journal of Financial Economics 33: 3–56. [Google Scholar] [CrossRef]
  9. Fatemi, Ali, and Iraj Fooladi. 2013. Sustainable finance: A new paradigm. Global Finance Journal 24: 101–13. [Google Scholar] [CrossRef]
  10. Flammer, Carolyn. 2018. Corporate Green Bonds. Rochester: SSRN. [Google Scholar]
  11. Glavas, Dejean, and Franck Bancel. 2018. Are Agency Problems a Determinant of Green Bond Issuance? Munich: Munich Personal RePEc Archive. [Google Scholar]
  12. Hachenberg, Britta, and Dirk Schierech. 2018. Are Green Bonds Priced Differently from Conventional bonds? Journal of Asset Management 19: 371–83. [Google Scholar] [CrossRef]
  13. Hemmingson, Carl, and Robert Ydenius. 2017. The Convertible Bond Announcement Effect: An Event Study on the Nordic Markets. Rochester: SSRN. [Google Scholar]
  14. Karpf, Andreas, and Antoine Mandel. 2017. Does It Pay to Be Green? Rochester: SSRN. [Google Scholar]
  15. Karpf, Andreas, and Antoine Mandel. 2018. The changing value of the “green” label on the US municipal bond market. Nature Climate Change 8: 161–65. [Google Scholar] [CrossRef]
  16. Katori, Tsuyoshi. 2018. The Financial Potential of Green Bonds: Comparing the Three Issuing Schemes. Rochester: SSRN. [Google Scholar]
  17. Kila, Kikelomo. 2019. Green Bonds and the Role of the Financial Sector in Tackling Global Climate Change. Rochester: SSRN. [Google Scholar]
  18. Larcker, David, and Edward Watts. 2019. Where’s the Greenium? Working Paper. Stanford: Stanford University. [Google Scholar]
  19. Park, Stephen. 2018. Investors as regulators: Green Bonds and the governance challenges of the sustainable finance revolution. Standford Journal of International Law 54: 1. [Google Scholar]
  20. Partridge, Candace, and Francesca Romana Medda. 2018. The Creation and Benchmarking of a Green Municipal Bond Index. Rochester: SSRN. [Google Scholar]
  21. Reed, Patrick, Roca Cort, and Logan Yonavjak. 2017. Data-Driven Green Bond Ratings: A Market Catalyst. Journal of Investing. Forthcoming. [Google Scholar]
  22. Revelli, Christophe, and Bernard Paranque. 2017. Ethico-Economic Analysis of Impact Finance: The Case of Green Bonds. Rochester: SSRN. [Google Scholar]
  23. Rose, Paul. 2018. Certifying the ‘Climate’ in Climate Bonds. Rochester: SSRN. [Google Scholar]
  24. Sze, Chin Kim, and Abdullah Nur Adiana Hiau. 2013. Announcements Effect of Corporate Bond Issuance and Its Determinants. Warsaw: Contemporary Economics. [Google Scholar]
  25. Tang, Dragon Yongjun, and Yupu Zhang. 2018. Do Shareholders Benefit from Green Bonds? Rochester: SSRN. [Google Scholar]
  26. Wulandari, Febi, Dorothea Schaefer, Andreas Stephan, and Chen Sun. 2018. Liquidity Risk and Yield Spreads of Green Bonds. DIW Berlin Discussion Paper No. 1728. Kiel: ZWB Leibniz-Informationszentrum Wirtschaft, Leibniz Information Centre for Economics. [Google Scholar]
  27. Zerbib, Olivier David. 2019. The Effect of Pro-Environmental Preferences on Bond Prices: Evidence from green Bonds. Journal of Banking and Finance 98: 39–60. [Google Scholar] [CrossRef]
1
2
We identified 20 sustainable bonds into the final sample and removed them to keep only pure Green Bonds.
3
Our sample of green bonds is quite large since, as mentioned above, we took advantage of access to a more comprehensive number of databases relative to the commonly-used ones to trace green bond issues. For example, the obtained merged dataset of Tang and Zhang (2018) includes 1510 green bonds relative to 2079 in our study.
4
The great surge in the green bond market is due to both the release of the ICMA’s Green Bond Principles, which helped define a strong market standard used by issuers and investors, and the entry of financial and non-financial corporations. Such corporations accounted for about 80% of the total number of issued green bonds in 2017 as opposed to less than 20% in 2010. These statistics are based on our total sample of green bonds.
5
To identify publicly-listed issuers, we first selected those that are listed in a stock exchange. For the remaining issuers, we checked whether their parent company is publicly-listed.
6
If the stock is listed in the same country where the green bond has been issued, we considered the leading stock market index of the issuance country. Otherwise, we considered the leading stock market index of the country in which the stock is listed.
7
The decrease in the number of events from 476 to 475 is due to the fact that, for one green bond issuer, the security data are not available until 1 day after the event date.
Figure 1. Corporate green bonds over time. This figure plots the total issuance amount (in $B) of corporate green bonds on an annual basis, using our sample of corporate green bonds during 2007–2018.
Jrfm 13 00025 g001
Table 1. Green bond samples.
Panel A. Green Bonds by Country
CountryFull Sample# of Bonds Issued by Public Issuers
SNAT348N.A.
China677173
France191119
Japan4629
United States16427
Sweden19726
India3413
Spain2310
Australia208
Brazil138
Taiwan138
Norway317
Canada314
Hong Kong134
Italy134
The Netherlands374
New Zealand54
Austria53
Germany503
United Kingdom173
Korea163
Mexico113
South Africa43
Belgium42
Denmark72
United Arab Emirates11
Switzerland71
Finland111
Greece11
Turkey11
Others370
Total2079475
Panel B. Green Bonds by Industry
IndustryAmount for the Full Sample ($B)Amount for the Public Issuers’ Sample ($B)
Government686.119
Municipal62.2863
Multi-National373.3085
Sovereign79.2216
Regional (state/province)171.3026
Financial236.82389.161
Banks210.477
Investment Companies1.72179.707
REITS6.5724.283
Insurance1.1171.117
Private Equity0.798
Diversified Financial Services5.2651.043
Industrial225.710182.673
Environmental Control3.4060.531
Packaging and Containers0.0370.037
Machinery-Diversified0.200
Electronics0.3000.300
Electrical Components and Equipment1.0260.337
Transportation193.809180.152
Miscellaneous Manufacturing0.2480.030
Engineering and Construction26.5351.136
Metal Fabricate/Hardware0.1490.149
Utilities99.541
Water3.827
Electric95.023
Gas0.691
Energy17.9446.895
Energy-Alternate Sources12.9473.465
Oil and Gas0.7420.089
Coal4.2553.341
Consumer, Non-cyclical8.5501.124
Agriculture0.119
Healthcare-Services0.689
Commercial Services6.409
Food1.1711.124
Cosmetics/Personal Care0.161
Basic Materials5.7772.972
Iron/Steel0.2420.104
Forest Products and Paper5.5362.868
Consumer, Cyclical4.3483.017
Home Furnishings0.107
Airlines0.0890.089
Textiles0.0970.097
Home Builders0.9800.980
Retail0.0890.089
Distribution/Wholesale0.0450.045
Auto Manufacturers2.9391.716
Technology2.5892.589
Computers2.5892.589
Communications2.182
Telecommunications2.182
Diversified0.373
Holding companies divers0.373
Notes: This table shows the description of the green bond sample. In Panel A, we provide statistics on the distribution of the green bonds across countries. In Panel B, we provide statistics on the amount of green bond issues across industries.
Table 2. Summary Statistics.
Panel A. Bond Characteristics
MeanMedianSTDMinMaxN
All green bonds
Coupon (percent)3.3073.4222.145−0.07015.52062
Maturity (year)6.87854.6381602039
Amount (million$)61914934600.01142,0002079
Public issuers’ green bonds
Coupon (percent)3.6243.8552.266015.5466
Maturity (year)6.25953.478130467
Amount (million)6581798850.0954470475
Panel B. Firm Characteristics
Variables NamesMeanMedianSTDMinMaxN
Size12.29812.3992.5616.41119.556138
Leverage0.3470.3310.1970.0180.839131
ROA0.0560.0540.041−0.1470.215134
TobinQ1.1511.0100.7560.62213.287137
MTB1.5831.0542.8850.04237.395137
Tangibility0.2970.1440.3300.00041.075115
Loss0.00700.08601134
Age23.1641718.21416967
Notes: This table presents summary statistics for green bonds and green bond issuers. In panel A, we provide summary statistics separately for all corporate green bonds and green bonds issued by public issuers. In panel B, we provide summary statistics for public green bonds issuers in the year of their first green bonds issue.
Table 3. Stock market reaction to green bond issuance announcement.
Panel A. CAPM Model
Event TimeCART-StatisticT-SignNb. of Events
[−20, 20]−0.019867 **−2.31450−2.416476
[−5, 5]−0.005821007−1.57239−2.052476
[−3, 3]−0.00361935−1.29487−1.596476
[−1, 1]−0.003317903 **−2.24850−1.596476
[0, 1]−0.005497024 **−2.26048−2.7814757
Panel B. Fama and French 3-Factor Model
Event TimeCART-StatisticT-SignNb. of Events
[−20, 20]−0.011333−1.50595−1.505476
[−5, 5]−0.002768966−0.78462−1.049476
[−3, 3]−0.002740928−0.99945−0.866476
[−1, 1]−0.002193704−1.44537−1.687476
[0, 1]−0.001956103−1.58730−2.234475
Panel C. Carhart 4-Factor Model
Event TimeCART-StatisticT-SignNb. of Events
[−20, 20]−0.015206−1.83223−1.687476
[−5, 5]−0.00424799−1.13864−0.593476
[−3, 3]−0.003435731−1.17983−0.228476
[−1, 1]−0.003305522−1.81886−0.501476
[0, 1]−0.002663986 *−1.87312−1.687475
Notes: This table reports the average cumulative abnormal return over different event windows around the announcement of green bond issuances. In panel A, CARs are calculated using the CAPM model. In panel B, CARs are calculated using the Fama and French 3-factor model. In panel C, CARs are calculated using the Carhart 4-factor model. **, and * indicate statistical significance at the 5%, and 10% levels, respectively.
Table 4. Heterogeneity in stock market responses.
Panel A. First-Time vs. Subsequent Issues
First-Time IssuesSubsequent Issues
CART-statisticT-signCART-statisticT-sign
CAPM_CAR−0.0040104 **−2.10324−1.897−0.001692872−1.18377−2.027
Observations145330
FF3_CAR−0.00409096 *−2.01943454−1.732−0.00101805−0.66391258−1.479
Observations145330
Carhart_CAR−0.0066863 **−2.22176705−1.237−0.00089659−0.57614642−1.151
Observations145330
Panel B. Developed vs. Emerging Markets
Developed MarketsEmerging Markets
CART-StatisticT-SignCART-StatisticT-Sign
CAPM_CAR−0.003737 ***−2.87087−2.560−0.00002293−0.01041771−1.147
Observations304171
FF3_CAR−0.0030181 **−2.23464787−1.763−0.00006799−0.0278764−1.300
Observations304171
Carhart_CAR−0.0039601 **−2.28320298−2.219−0.000359677−0.1458124740.229
Observations304171
Panel C. Corporate vs. Financials
FinancialsCorporate
CART-StatisticT-SignCART-StatisticT-Sign
CAPM_CAR−0.0033980 **−2.07315−1.651−0.00246644−1.18979287−2.232
Observations248227
FF3_CAR−0.0018248−1.57094675−1.524−0.0020994−0.93391138−1.576
Observations248227
Carhart_CAR−0.001817879−1.54027974−1.397−0.003588366−1.336693404−0.919
Observations248227
Notes: This table reports the average cumulative abnormal return (CARs) estimated over the two-day event window from day 0 to day 1 around the announcement of green bond issuances for different subsamples. In Panel A, we distinguish between first-time green bond issues and subsequent issues. In Panel B, we distinguish between first-time green bond issues in developed markets and those in emerging markets. In Panel C, we distinguish between first-time green bond issues by financial and non-financial corporations. CAR is calculated using the CAPM model, the Fama and French 3-factor model, and the Carhart model. ***, **, and * indicate statistical significance at the 1%, 5%, and 10% levels, respectively.
Table 5. Cross-sectional variation of CARs.
VariablesCAR
ROA0.182
(0.29)
LEVERAGE0.142 *
(1.86)
MARKET_VALUE0.000
(0.22)
MTB0.006 ***
(3.36)
SALES_GROWTH0.040 **
(2.13)
TANGIBLE−0.003
(0.15)
Intercept−0.023
(1.22)
Year fixed effectsYes
Industry fixed effectsYes
Firm fixed effectsYes
Country fixed effectsYes
Observations411
Adjusted R20.08
Notes: This table provides the results of the OLS regressions of CARs estimated over the [0, 1] event window on firm characteristics. All reported t-values in parentheses are based on robust standard errors adjusted for heteroskedasticity and clustered at the firm level. *, **, and *** refer to significance at the 10%, 5%, and 1% levels, respectively.

