Article

The Effects of Environmental Regulation on the Singapore Stock Market

1
School of Business and Management, RMIT University, 702 Nguyen Van Linh Blvd, District 7, Ho Chi Minh City 700000, Vietnam
2
Faculty of Finance and Banking, Ton Duc Thang University, Ho Chi Minh City 700000, Vietnam
3
Faculty of Business, University of Wollongong, Dubai 00000, UAE
4
School of Economics, Finance and Property, Bentley Campus, Curtin University, Bentley 6102, Western Australia, Australia
5
School of Economics, Finance and Marketing, RMIT University, Melbourne 3000, Victoria, Australia
*
Author to whom correspondence should be addressed.
J. Risk Financial Manag. 2019, 12(4), 175; https://doi.org/10.3390/jrfm12040175
Submission received: 28 October 2019 / Revised: 14 November 2019 / Accepted: 21 November 2019 / Published: 24 November 2019
(This article belongs to the Special Issue Green and Sustainable Finance)

Abstract

:
This study examines the impact of environmental regulation on the Singapore stock market using the event study methodology. Several asset pricing models are used to estimate sectoral abnormal returns. Additionally, we estimate the change in systematic risk after the introduction of the carbon tax and related regulation. We conduct various robustness tests, including the Corrado non-parametric ranking test, the Chesney non-parametric conditional distribution approach, a representation of market integration, and Fama–French five-factor model. We find evidence showing that the environmental regulations tend to achieve their desired effects in Singapore in which several big polluters (including industrial metals and mining, forestry and papers, and electrical equipment and services) were negatively affected by the announcements of environmental regulations and carbon tax. In addition, our results indicate that the electricity sector, one of the biggest polluters, was negatively affected by the announcement of environmental regulations and carbon tax. We also find that environmental regulations seem to boost the performance of environmentally-friendly sectors whereby we find the alternative energy industry (focusing on new renewable energy technologies) experienced a sizeable positive reaction following the announcements of these regulations.

1. Introduction

It is widely believed that climate change and global warming are caused mainly by modern human activities, leading to catastrophic phenomena such as extreme weather events, rising sea levels, ocean acidification, and extreme precipitation (Wang et al. 2017). As a result, environmental regulation, both at the national and international levels, has become a vital instrument to fight the challenges posed by greenhouse gas emissions. However, the economic and financial effects of environmental regulation constitute a controversial issue.
The current literature documents two differing views on the impact of environmental regulation on firms. One view is that compliance with environmental regulation may produce unfavourable outcomes for firms. Based on this view, (Walley and Whitehead 1994) argue that trade-offs between environmental protection and economic performance cannot be avoided. In addition, (Bragdon and Marlin 1972) point out that the cost of pollution incurred by firms is a significant burden that leads to a higher level of operating costs, with a negative effect on corporate profitability. Therefore, the cost of compliance with environmental regulation can lead to deterioration in manufacturing output, employment, and corporate financial indicators.
In contrast, prior studies in favour of environmental regulation find evidence for favourable outcomes associated with the adoption of high environmental standards and compliance with environmental regulation, including management benefits, enhanced productivity, and improved employee morale (McGuire et al. 1988). The adoption of environmentally-friendly practices improves firms’ overall performance (Sharfman and Fernando 2008; Ameer and Othman 2012; Nandy and Lodh 2012; Walker et al. 2014; Gupta 2018). Furthermore, (Allen 1992 and Schmidheiny 1992) find that strong environmental performance tends to lower production costs (through eliminating waste).
According to the efficient market hypothesis (EMH), stock prices change as new information is released, including news of environmental regulation. When environmental regulation is introduced, firms with poor environmental records or polluted firms may face negative market reaction as reflected in stock prices and returns. In contrast, investors realise that an environmentally-friendly firm, which is expected to benefit from the environmental regulation, is likely to experience a positive effect.
Several studies (Ramiah et al. 2013, 2015a, 2015b; Pham et al. 2019a) focus on the relationship between environmental performance and corporate performance (via profitability, corporate market value, return and risk); the empirical findings of these studies are inconclusive as they find the effects of environmental regulations vary in different countries. In general, these studies point out that the main purpose of environmental regulations is to reduce carbon emission and they hypothesise that: (1) polluting sectors are negatively affected by the environmental regulations; (2) environmental regulations are positively affected by these regulations; and (3) polluting sectors are not affected (or even exhibit positive abnormal returns) by the regulations due to passing regulatory costs on to the consumers. We utilise these hypotheses in our study and examine how the stock market reacts to the announcements of environmental regulations and the carbon tax in Singapore.
According to the Singapore’s emission profile published by the International Energy Agency, Singapore is considered as one of the biggest offenders in terms of carbon emissions per capita. The introduction of environmental regulation by the Singapore government shows its concern for protecting the natural ecosystem in response to global warming and climate change. More importantly, the experiences of the first mover in Southeast Asia may play a pivotal role in encouraging and benchmarking the followers for similar regulatory commitment. In Asia, China is one of the most active countries in battling climate change and has its own emission trading scheme (ETS). However, the ETS has a different mechanism to that of a carbon tax1 and hence, the carbon tax policy in Singapore is considered as the first successfully implemented carbon tax policy in Asia (See Pham et al. 2019a for further explanation in emission trading scheme). In addition, previous studies (Ramiah et al. 2013, 2015a, 2015b; Pham et al. 2019a, 2019b) fail to document the true effects of carbon tax since carbon tax either fails to implement or does not exist in the countries of their studies. Therefore, the success of Singapore carbon tax motivates us to examine the effect of carbon tax regulation on the Singapore stock market. We apply the event study technique to explore the reaction of the Singapore stock market to various announcements of environmental regulations, such as the Kyoto Protocol (2006), national climate change strategy (2012), Sustainable Singapore Blueprint (2015), and the Paris Climate Agreement (2016), that leads to the implementation of the carbon tax regulation at the end. Moreover, since each sector may have a different level of exposure to carbon emission and the environmental regulations may pose different threats to each sector, we expect the sectors will experience changes in systematic risk following the announcements of environmental regulations and we capture these changes by employing various short-term and long-term risk models.
The remainder of the paper is structured as follows. Section 2 presents a literature review on the impacts of environmental regulations on risk and return. Section 3 describes the methodology used in this study. Section 4 discusses the empirical findings and Section 5 concludes the paper.

2. Literature Review

According to the Intergovernmental Panel on Climate Change Special Report on Global Warming (2018), climate change and global warming pose a fundamental threat to biodiversity, the oceans (through acidification), weather phenomena, and the global economy. Businesses are no exception to these threats as they are likely to encounter uncertainty and change in demand, as well as higher levels of risk and operational costs arising from more extreme weather. Thus, all enterprises need to assess and act on the uncertainty of climate change, transform businesses, and uncover opportunities to avoid going bankrupt. Linnenluecke et al. (2016) stated that “this research field engages with climate change as one of the most pressing concerns facing humanity, and brings together financial and natural science research” and suggested that “it offers a rich avenue for future research on how financial decision-making relates to the need to act on environmental concerns”.
Several studies have been conducted on carbon finance to address the efficiency of associated financial instruments on environmental protection. Different environmental policies are considered as helpful tools that can be used to reduce carbon dioxide emissions at the lowest cost (Abolhosseini and Heshmati 2014) and attract a higher level of venture capital related to renewable energy sources (Criscuolo and Menon 2015). Moreover, financial institutions and financial innovations have an important and bigger role to play in the transition to lower-carbon energy (Hall et al. 2017; Pathania and Bose 2014). Linnenluecke et al. (2015a) examined several studies on climate change which they linked to accounting and finance literature and found that accounting and finance can support organisational climate change adaptation. In addition, Linnenluecke et al. (2015b) studied the divestment campaign and argued that divestment by itself is not enough to mitigate the effects of climate change.
There are two sides to the debate about the influence of environmental regulation. According to Stewart (1993), firms operating in countries where regulations are not stringent or not enforced do not incur much compliance costs. Thus, the author believes that environmental regulation has a negative effect on international competitiveness. Moreover, stringent regulatory enforcement not only leads to higher costs but also pushes firms’ capital resources away from other potential projects to invest in green technologies—as a result, future productivity growth may diminish. The negative impact of environmental regulation on productivity may arise because firms are forced to comply with “non-productive” activities such as waste treatment, disposal management, and auditing activities (Lanoie et al. 2008; Christainsen and Haveman 1981; Gray and Shadbegian 1993).
On the other hand, studies have been conducted on the effect of environmental regulation on risk and return in stock markets. Dowell et al. (2000) and Halkos and Sepetis (2007) argued that firms with improved environmental management systems may experience a reduction in perceived risk and boost their market values. They suggest firms that comply with environmental regulation are likely to produce improved stock market performance and note that no evidence is available to support the proposition that firms pursuing lower local environmental standards may save production costs. They also note that firms moving downwards from existing higher environmental standards are likely to violate corporate routines, which would cost them more when making a new investment. Another positive effect of compliance with environmental standards is an enhanced public image, which boosts employee morale and corporate reputation. Last, but not least, they argue that firms can reduce their operating costs and eliminate pollution by changing production processes and applying modern “eco-efficiency” technologies with high resource productivity. In an Australian market-based study, Ramiah et al. (2013) found that abnormal returns are linked to environmental announcements. They show that environmentally-friendly firms tend to experience positive abnormal returns while polluting firms experience unfavourable results when the objective of environmental regulation is to punish polluters.
Hamilton (1995), White (1996), and Klassen and McLaughlin (1996) used the event study methodology to examine the reaction of firms to announcements of toxic emissions. These studies showed that firms with stronger environmental management practices experience significant positive returns, which is not the case for firms with a lower level of environmental compliance. Interestingly, some studies find that environmental regulation has failed to meet its aim. For example, Nieto et al. (2018) showed that the ineffectiveness of the Paris Agreement’s objective can be explained by socio-economic and biophysical constraints. Moreover, Veith et al. (2009) and Ramiah et al. (2013) found that the biggest polluters in the Australian market are not influenced by green policies, which can be attributed to the ability of polluters to pass the cost of environmental regulation to consumers. Ramiah et al. (2015a, 2015b) examined the effects of environmental regulations in China and the US and their results showed that the environmental policies may not achieve the desired objectives. Pham et al. (2019a) also found mixed results whereby several polluters experienced negative abnormal returns whereas other polluters produced positive abnormal returns in France. Thus, they expressed scepticism about the effectiveness of environmental regulation and suggested that regulators may need to take this observation into consideration when formulating regulatory measures. Since Singapore has been delaying the introduction of a carbon tax over the years (i.e., that could be considered as an act of refining the policy), the empirical evidence from the Singapore stock market is expected to provide a significant contribution to the literature.
Several studies have examined the impact of environmental regulation on short-term and long-term systematic risk in different sectors. Whenever an announcement is made, systematic risk is predicted to rise for polluting sectors. In contrast, green sectors are expected to experience a decrease (increase) in systematic risk when eco-friendly legislation is adopted (rejected). A study of Feldman et al. (1997) of about 300 US firms provided evidence indicating that companies adopting a more environmentally-friendly posture may experience favourable attainment of perceived riskiness to investors, cost of equity capital, and market value. Moreover, Ramiah et al. (2013) showed a diamond risk structure resulting from the uncertainty associated with environmental regulation. The introduction of stringent environmental policies produces an upward (downward) trend in the systematic risk of polluting (environmentally-friendly) enterprises. However, the delayed announcements lead to a higher degree of uncertainty, creating unusual risk-shifting behaviour. On the other hand, Pham et al. (2019a) found that different environmental policies could lead to different outcomes in systematic risk in which the authors show a certain set of regulations can lead to a diamond risk structure while another set of regulations can lead to a three-distinct-outcomes risk structure. Since the empirical evidence in the literature is not in unison, it is important to investigate how the shape of the risk structure will change following the announcements of environmental regulations and the carbon tax.

3. Methodology

3.1. Measurement of Abnormal Returns

We adopted and modified the event study methodology of Brown and Warner (1985) to examine the effects of Singapore’s environmental regulatory announcements on the stock market. This methodology is considered as the best methodology to apply in this study since it can examine how the stock markets react following every single event such as environmental regulation or carbon tax announcements. In addition, the methodology has been widely applied in various studies in the field of environmental finance (Ramiah et al. 2013; Pham et al. 2019a, 2019b). When an announcement is considered as favourable (unfavourable) news to a particular sector, we expect the sectors to generate positive (negative) abnormal returns. No abnormal returns should be observed when the news is considered insignificant. The three possibilities are represented as follows:
s D A R i t N > 0 ,
s D A R i t N < 0 ,
s D A R i t N = 0 ,
where
D A R i t = l n ( P I i t P I i t 1 ) β i t 0 + β i t 1 ( r m k t r f t ) .
S D A R i t N is the daily abnormal return of sector s, D A R i t is the daily abnormal return of firm i at time t, N is the number of firms within a sector, P I i t is the price index of firm i at time t, β i t 0 and β i t 1 are the intercept and the slope of the CAPM model, respectively, r m k t is the Singapore market index and r f is the risk-free rate. While estimating abnormal returns, we remove the firms associated with each announcement from the underlying sector to control for any possible effects these firms might have on that sector. The standard t-statistic is used to check if a reaction is statistically significant for each announcement.
As the market might experience a delayed reaction, continue to react or anticipate a carbon tax announcement (in other words, EMH simply fails), we estimate cumulative abnormal returns of 5 days after the event date and 5 days before the event date to capture these reactions. Cumulative abnormal returns are estimated as follows:
C A R ( d ) s t = n = 1 d D A R s t + n ,
where C A R ( d ) s t is the cumulative abnormal return of d days (d = 5 days after the event date) of sector s at time t and C A R ( d ) s t is the cumulative abnormal return of d′ days (d′ = 5 days before the event date) of sector s at time t. The t-statistic is used to check if the results are statistically significant.

3.2. Robustness Checks

As stock markets grow, the asset pricing model, which only controls for the market risk premium, becomes inadequate. As a result, more advanced models have been developed to control for various risk factors such as size (SMB), value (HML), profitability (RMW) and investment (CMA) Fama and French (1993, 2015). Therefore, we apply the Fama–French five-factor model to re-estimate expected returns and abnormal returns to check if the findings are consistent as more risk factors are included in the asset pricing model. The modified model is specified as follows:
D A R i t = l n ( P I i t P I i t 1 ) β i t 0 + β i t 1 ( r m k t r f t ) + β i t 2 ( S M B ) + β i t 3 ( H M L ) + β i t 4 ( R M W ) + β i t 5 ( C M A ) + ε i t ,
where β i t 0 is the intercept of the Fama–French five-factor model, β i t 1 , β i t 2 , β i t 3 , β i t 4 and β i t 5 are coefficients of market risk premium, size, value, profitability and investment factors, respectively, and ε i t is the error term.
According to Ramiah et al. (2015a, 2015b), abnormal returns are high around event dates and relatively low otherwise, which leads to the possibility of distorting the distribution of abnormal returns due to high kurtosis, positive skewness, and non-normality. For this reason, we use the non-parametric ranking test proposed by Corrado (1989) and the non-parametric conditional distribution introduced by Chesney et al. (2011) to validate the results.
To implement the Corrado (1989) non-parametric ranking test, abnormal returns are converted into ranks over a period of 260 days where the rank of each firm i at time t, K i t , is calculated as:
K i t = r a n k ( l n ( P I i t P I i t 1 ) β i t 0 + β i t 1 ( r m k t r f t ) ) .
Since the ranks are closer to each other (from 1 to 260) in comparison to the actual values, they are more likely to be normally distributed. The 260 days consist of 244 days prior to and 15 days after the event dates. We then compare the rank of each sector with the expected average rank, K ¯ i , at time t which is calculated as:
K ¯ i t = 0.5 + 260   days 2 = 130.5 .
The non-parametric rank t-statistic is calculated as follows:
t C o r r a d o = 1 N i = 1 N ( K i t 130.5 ) s t d e v ( K ¯ i t ) ,
where s t d e v ( K ¯ i t ) is calculated as:
s t d e v ( K ¯ i t ) = 1 T t = 1 260 1 N 2 ( K i t 130.5 ) 2 ,
where K ¯ i t is the average rank.
The results of the non-parametric ranking test are valid from a statistical point of view, since it deals with non-normality, particularly when it is applied to skewed and/or leptokurtic distributions (Ataullah et al. 2011). In addition, we conduct a non-parametric conditional distribution test to address the non-normality of returns. We use the kernel regression technique, which does not assume any underlying distribution, and check the conditional cumulative probability of the return. If the conditional cumulative probability has a value of less than 0.05, we conclude that the event has an extreme effect on the market.
Since the Singapore stock market is highly integrated with other international stock markets, we control for asynchronicity, market integration, and spillover effects from those markets by incorporating three market risk premia representing Asia ( r ˜ m k t A s i a r ˜ f t A s i a ), Europe ( r ˜ m k t E u r o p e r ˜ f t E u r o p e ), and the U.S. ( r ˜ m k t U S r ˜ f t U S ) into the CAPM. Subsequently, abnormal returns are re-estimated to check for the impact of stock market integration and spillover effects. For this purpose, the following equation is used:
D A R i t = l n ( P I i t P I i t 1 ) [ β i t 0 + β i t 1 ( r m k t r f t ) ] + β i t 2 ( r ˜ m k t A s i a r ˜ f t A s i a ) + β i t 3 ( r ˜ m k t E u r o p e r ˜ f t E u r o p e ) + β i t 4 ( r ˜ m k t U S r ˜ f t U S ) + ε i t ,
where β i t 2 , β i t 3 and β i t 4 are the coefficients on the market risk premia for Asia, Europe, and the U.S., respectively, and ε i t is the error term. The standard t-statistic is used to determine if the re-estimated abnormal returns are statistically significant.

3.3. Estimating Changes in Systematic Risk

The introduction of stringent policies represents a risk factor for polluters. Likewise, lax environmental policies can be viewed as uncertainty for environmentally-friendly businesses. The environment in which firms conduct business changes significantly with the adoption of environmental regulation whose effects on systematic risk are unknown. To test for changes in systematic risk, asset pricing models are modified to incorporate interaction variables. The first model captures the average change in risk resulting from the introduction of regulation. Following Ramiah et al. (2013), an aggregate dummy variable (AD) is used to represent the events, which assumes a value of one on the event date and zero otherwise. An interaction variable is obtained by multiplying AD by the market risk premium, which gives:
r ˜ I t r ˜ f t = β I 0 + β I 1 [ r ˜ m t r ˜ f t ] + β I 2 [ r ˜ m t r ˜ f t ] A D t + β I 3 A D t + ε ˜ i t ,
where r ˜ I t is industry i’s return at time t, r ˜ f t is the risk-free rate at time t, r ˜ m t is market return at time t, AD is a dummy variable, which assumes a value of one on the event date and zero otherwise, ε ˜ i t is the error term, β I 0 is the intercept term such that E( β I 0 ) = 0, β I 1 is the average short-term systematic risk of the industry, β I 2 is a measure of systematic risk for each industry, and β I 3 is a measure of the change in the intercept of Equation (13). By estimating Equation (13), the aggregate effect of the events on the stock market can be calculated.
The effects of opposite outcomes from different events may cancel out each other, which is a problem that can be dealt with by introducing an individual dummy variable (ID) for each announcement, taking a value of one on the event date and zero otherwise. By doing that, it becomes possible to identify the exact contribution of each event. Short-term changes in systematic risk following the announcement of environmental regulation can be captured by the coefficients on interaction variables, which are obtained by multiplying each dummy variable by the market risk premium. In this case, we have:
r ˜ I t r ˜ f t = β I 0 + β I 1 [ r ˜ m t r ˜ f t ] + g = 1 N β I , n 2 [ r ˜ m t r ˜ f t ] I D g t + ε ˜ i t ,
where g = 1 , 2 , , N represents event number. To study the long-term effects on systematic risk, Equations (13) and (14) are re-estimated by making the aggregate dummy variable (AD) assume the value of zero prior to the event and one afterwards. The individual dummy variables (ID) assume a value of zero prior to the event and one afterwards.
Since the empirical results are obtained by using the event study methodology, it may be worthwhile saying something about recent developments in this field. The most recent development is the method suggested by Borochin and Golec (2016) to measure the full value effect of an event for firms with traded options, given the argument that event studies typically provide a measure of only a fraction of the full effect because no adjustment is made for the market anticipation of that event. This method represents a generalisation of earlier work (Subramanian 2004; Barraclough et al. 2013; Borochin 2014) to disentangle the value effects caused by the announcement merger (the expected synergy value and the signals about the stand-alone values of the target firm and bidding firm). In this respect, unique information is extracted from option prices and used to identify the synergy and stand-alone values, along with the ex-ante probability that the merger will materialise.
The proposition that good estimates of event probabilities could be useful can be traced back to Brennan (1990), who suggested that stock price changes due to partly anticipated events must be adjusted to obtain a proper measure of the full value effect of an event. It has been suggested that firm-specific attributes can be used to estimate the ex-ante event probability (Malatesta and Thompson 1985; Acharya 1993; Chaplinsky and Hansen 1993; Prabhala 1997; Song and Walkling 2000; Cai et al. 2011; Bhagat et al. 2005). The potential problem with this approach is that data on relevant firm-specific attributes may be scarce.
Borochin and Golec (2016) showed that the observed price change on the event announcement date can be used to measure the full effect of an event on a company’s per-share value. Instead, they present a model whereby a firm’s stock and option prices are used to identify the unknown parameters that can be used to determine the full effect. They also discuss some potential complications that could impact the identification strategy and offer a way to assess the reasonableness of the estimated effects. Notwithstanding the merits of this approach, its implementation in this study is problematical, at least because it is applicable only to firms with traded options. Since our study is conducted on a comparative basis, even partial effects will do.

4. Data and Results

4.1. Data and an Overview

The daily data series used to conduct the empirical work were downloaded from Datastream over the period from 2004 to 2018. The variables include individual stock prices, the Singapore stock market index (as a proxy for the market), and the 10-year bond yield (as a proxy for the risk-free rate). The Datastream classification standards are applied to construct industry portfolios that include 37 sectors. Table 1 lists 10 important announcements on environmental regulations and the carbon tax collected from various institutional websites: the European Union, the Singapore Ministry of Foreign Affairs, and the Singapore Ministry of the Environment and Water Resources.
Table 2 provides information about the effect of the environmental regulations on the Singapore stock market as reflected in abnormal returns. In general, more than half of the sectors were significantly influenced by announcements. The results show that only three sectors, which accounted for 8% of 37 sectors, experienced both positive and negative reactions to the announcements. While the percentage of sectors exhibiting positive abnormal returns (AR) was 27%, 24% of total sectors exhibited negative ARs.

4.2. Sectors Reacting Negatively

Table 2 reports statistically significant abnormal returns and their t-statistics on the first day of trading following the announcements on environmental regulations and the carbon tax. Nine sectors were affected negatively: beverages; chemicals; electrical equipment and services; forestry and papers; industrial engineering; industrial metals and mining; leisure goods; media; and travel and leisure. The carbon tax is seen as a core policy to reduce CO2 emissions by imposing a fee on the burning of carbon-based fuels. Thus, the carbon tax (or environmental regulation in general) discourages environmentally-unfriendly businesses by raising production costs, leading to negative abnormal returns.
The environmental regulations in Singapore seem to be effective because all big polluters experienced negative abnormal returns when the underlying announcements were made. For example, the industrial metals and mining sector, the chemicals sector, the forestry and papers sector, and electrical equipment and services sector attained abnormal returns of −4.14% with a t-statistic of −2.64, −5.20% with a t-statistic of −2.32, −4.92% with a t-statistic of −2.02, and −2.49% with a t-statistic of −2.34, respectively. Following the ratification of Doha Amendment, which is the Protocol’s second commitment, on 24 September 2014 (announcement 4), leisure goods and travel and leisure sectors had negative reactions of −4.44% (with a t-statistic of −2.11) and −1.53% (with a t-statistic of −2.12). Obviously, the unfavourable results are interpreted to imply that the sectors focusing on recreation and tourism-related products produce emissions, solid waste, and littering. Consistent with Ramiah et al. (2013) and Pham et al. (2019a), we did not find evidence of a negative reaction from the electricity sector, which is one of the biggest polluters, on the announcement days. We postulate that the sector either successfully passes on the cost to consumers or experiences a delayed or anticipated reaction.
Surprisingly, however, industrial engineering with new technology and more sustainable operations still produced a negative AR of −2.34% with a t-statistic of −2.20 upon the implementation of the Kyoto Protocol, and AR of −1.36% with a t-statistic of −2.15 when Prime Minister Lee Hsien Loong unveiled the Sustainable Singapore Blueprint. A plausible explanation for the unfavourable result is that a shift to a greener country will cause an increase in energy prices and undesirable impact on return, particularly with a large proportion of energy investment (Garnaut 2008).

4.3. Sectors Reacting Positively

We document significantly positive responses in 10 sectors including aerospace and defense; food producers; food and drug retailers; gas, water and multiutilities; mining; mobile telecommunication; pharmaceuticals and biotechnology; real estate investment and services; real estate investment trust; and technology hardware and equipment services. Following event 1 on (12 April 2006) and event 2 (11 July 2006) when Singapore ratified the Kyoto Protocol, the aerospace and defense sector welcomed this news with positive abnormal returns of 3.27% with a t-statistic of 2.46 and AR of 3.72% with a t-statistic of 2.78. These results may be a failure of the Kyoto Protocol to target big polluters because of the ability of this industry to pass on the extra cost to consumers (Ramiah et al. 2013).
Interestingly, seven out of these ten sectors experienced favourable results following the release of the news that all facilities producing 25,000 tonnes or more of greenhouse gas emissions in a year will have to pay the carbon tax, which Finance Minister Heng Swee Keat announced on 19 February 2018 (announcement 9). In addition, pharmaceuticals and biotechnology reacted positively with an abnormal return of 19.16% when the National Climate Change Strategy was announced (announcement 3). Technology, hardware and equipment services also experienced a positive abnormal return of 2.05% on 24 September 2014 (announcement 4). These findings are, however, contradictory to those of Pham et al. (2019a), in which the authors show that the two sectors were negatively affected by the environmental regulations. A plausible explanation for this contradiction is the difference in terms of production processes used by French firms and Singaporean firms. Because the environmental regulation and especially the carbon tax are designed to punish big polluters and encourage firms to utilise cleaner or renewable energy, these sectors are likely to have found opportunities to apply green technological techniques in their production (hence they reacted positively).

4.4. Mixed and No Reactions

The results indicate that several sectors exhibit mixed reactions, such as the general retailers sector, the healthcare equipment and services sector, and the household goods and home construction sector. It is clear that the household goods and home construction sector is a good example of a sector that reacts differently to different announcements of environmental regulation. It reacted positively with an abnormal return of 3.70% (with a t-statistic of 2.27) to event 8 and negatively with an abnormal return of −2.39% (with a t-statistic of −2.01) to event 9.
The results also show that 17 sectors did not experience any reaction on the first day of trading following announcements of the carbon tax. It is worthwhile to note that the construction and materials sector, the electricity sector, and the oil and gas sector were not affected by the announcements. It appears that the policy is ineffective because of the ability of these sectors to pass the cost on to consumers. However, an argument against is that consumers may consider replacing the need for alternative energy due to the rise in product prices and enthusiasm for a green living environment. Thus, this environmental policy is still meaningful for the purpose of slowing global warming and climate change.

4.5. The Pattern of CARs

According to the efficient market hypothesis (EMH), the stock market reacts immediately to any new information. If this is true, then abnormal returns can be observed on the first day of information message arrival but not in the following days. However, the principles of behavioural finance tell us that market participants with conservatism bias (representativeness bias) may experience under-reaction or over-reaction to new information.
Table 3 and Table 4 show market anticipation and delayed reaction five days before or five days after the announcements (as measured by the cumulative abnormal return, CAR(−5) and CAR5 respectively). Overall, 22 sectors in Table 3 accounted for over 50% of total sectors that experienced positive CAR(−5), while the numbers of sectors exhibiting negative and mixed results are 2 and 1, respectively. In Table 4, conservatism-biased traders have a tendency to react slowly to new information, leading to the phenomenon of a delayed reaction. We can see that sectors with positive CAR5 held an impressive 30% of the total sectors of the Singapore stock market, whereas four and three sectors experienced negative CAR5 and mixed outcomes, respectively.
Information on environmental regulations and carbon tax legislation may be leaked or the market may anticipate the news before it is released officially. This section differentiates our study from previous studies in the literature whereby we examine the possible market anticipation of environmental regulations. The alternative energy sector, for instance, recorded the highest positive cumulative abnormal return of 126.09% (with a t-statistic of 2.77) five days before the carbon pricing bill was passed in Parliament on 20 March 2018. This result indicates that green sectors applying nature-friendly technology may produce positive abnormal returns as their rewards. In support of the market anticipation hypothesis, we find that eight sectors (including automobiles and parts; electrical equipment and services; forestry and papers; general retailers; industrial engineering; personal goods; fixed line telecommunication; and travel and leisure) experienced positive CARs five days before announcement 8 on 20 February 2017. For example, the automobiles and parts sector and the electrical equipment and services sector experienced positive CAR(−5)s of 6.44% (with a t-statistic of 2.42) and 5.96% (with a t-statistic of 2.30), respectively. A possible explanation of these favourable outcomes is that these sectors follow the trend to produce eco-friendly recycled and bio-based parts.
Due to conservatism bias, it is important to capture the late reaction of sectors to the same information by calculating the cumulative abnormal returns 5 days after the event date. The sector of food and drug retailers is a good example when market participants hold the same reaction on the first day and five days after news arrival. We find that abnormal return is 1.17% with a t-statistic of 2.07 in Table 2, while the cumulative abnormal return is 2.73% with a t-statistic of 2.12 in Table 4, following announcement 9. In addition, the electricity sector did not react in terms of abnormal returns, but this sector experienced a negative cumulative abnormal return of −17.26% with a t-statistic of −2.95 five days after Singapore ratified the Doha Amendment (announcement 4) and this result is consistent with the findings of Pham et al. (2019a) wherein the negative delayed reaction of electricity sector is evident in France. Five days later (on 19 February 2018), following the announcement of Finance Minister Heng Swee Keat regarding the amount of money to be charged for greenhouse gas emissions, the industrial metals and mining sector and the personal goods and home construction sector exhibited negative CAR5s of −6.88% (with a t-statistic of −2.26) and −8.36% (with a t-statistic of −2.87), respectively. Thus, the results show that environmental regulation has been successful in targeting some of the biggest polluters.

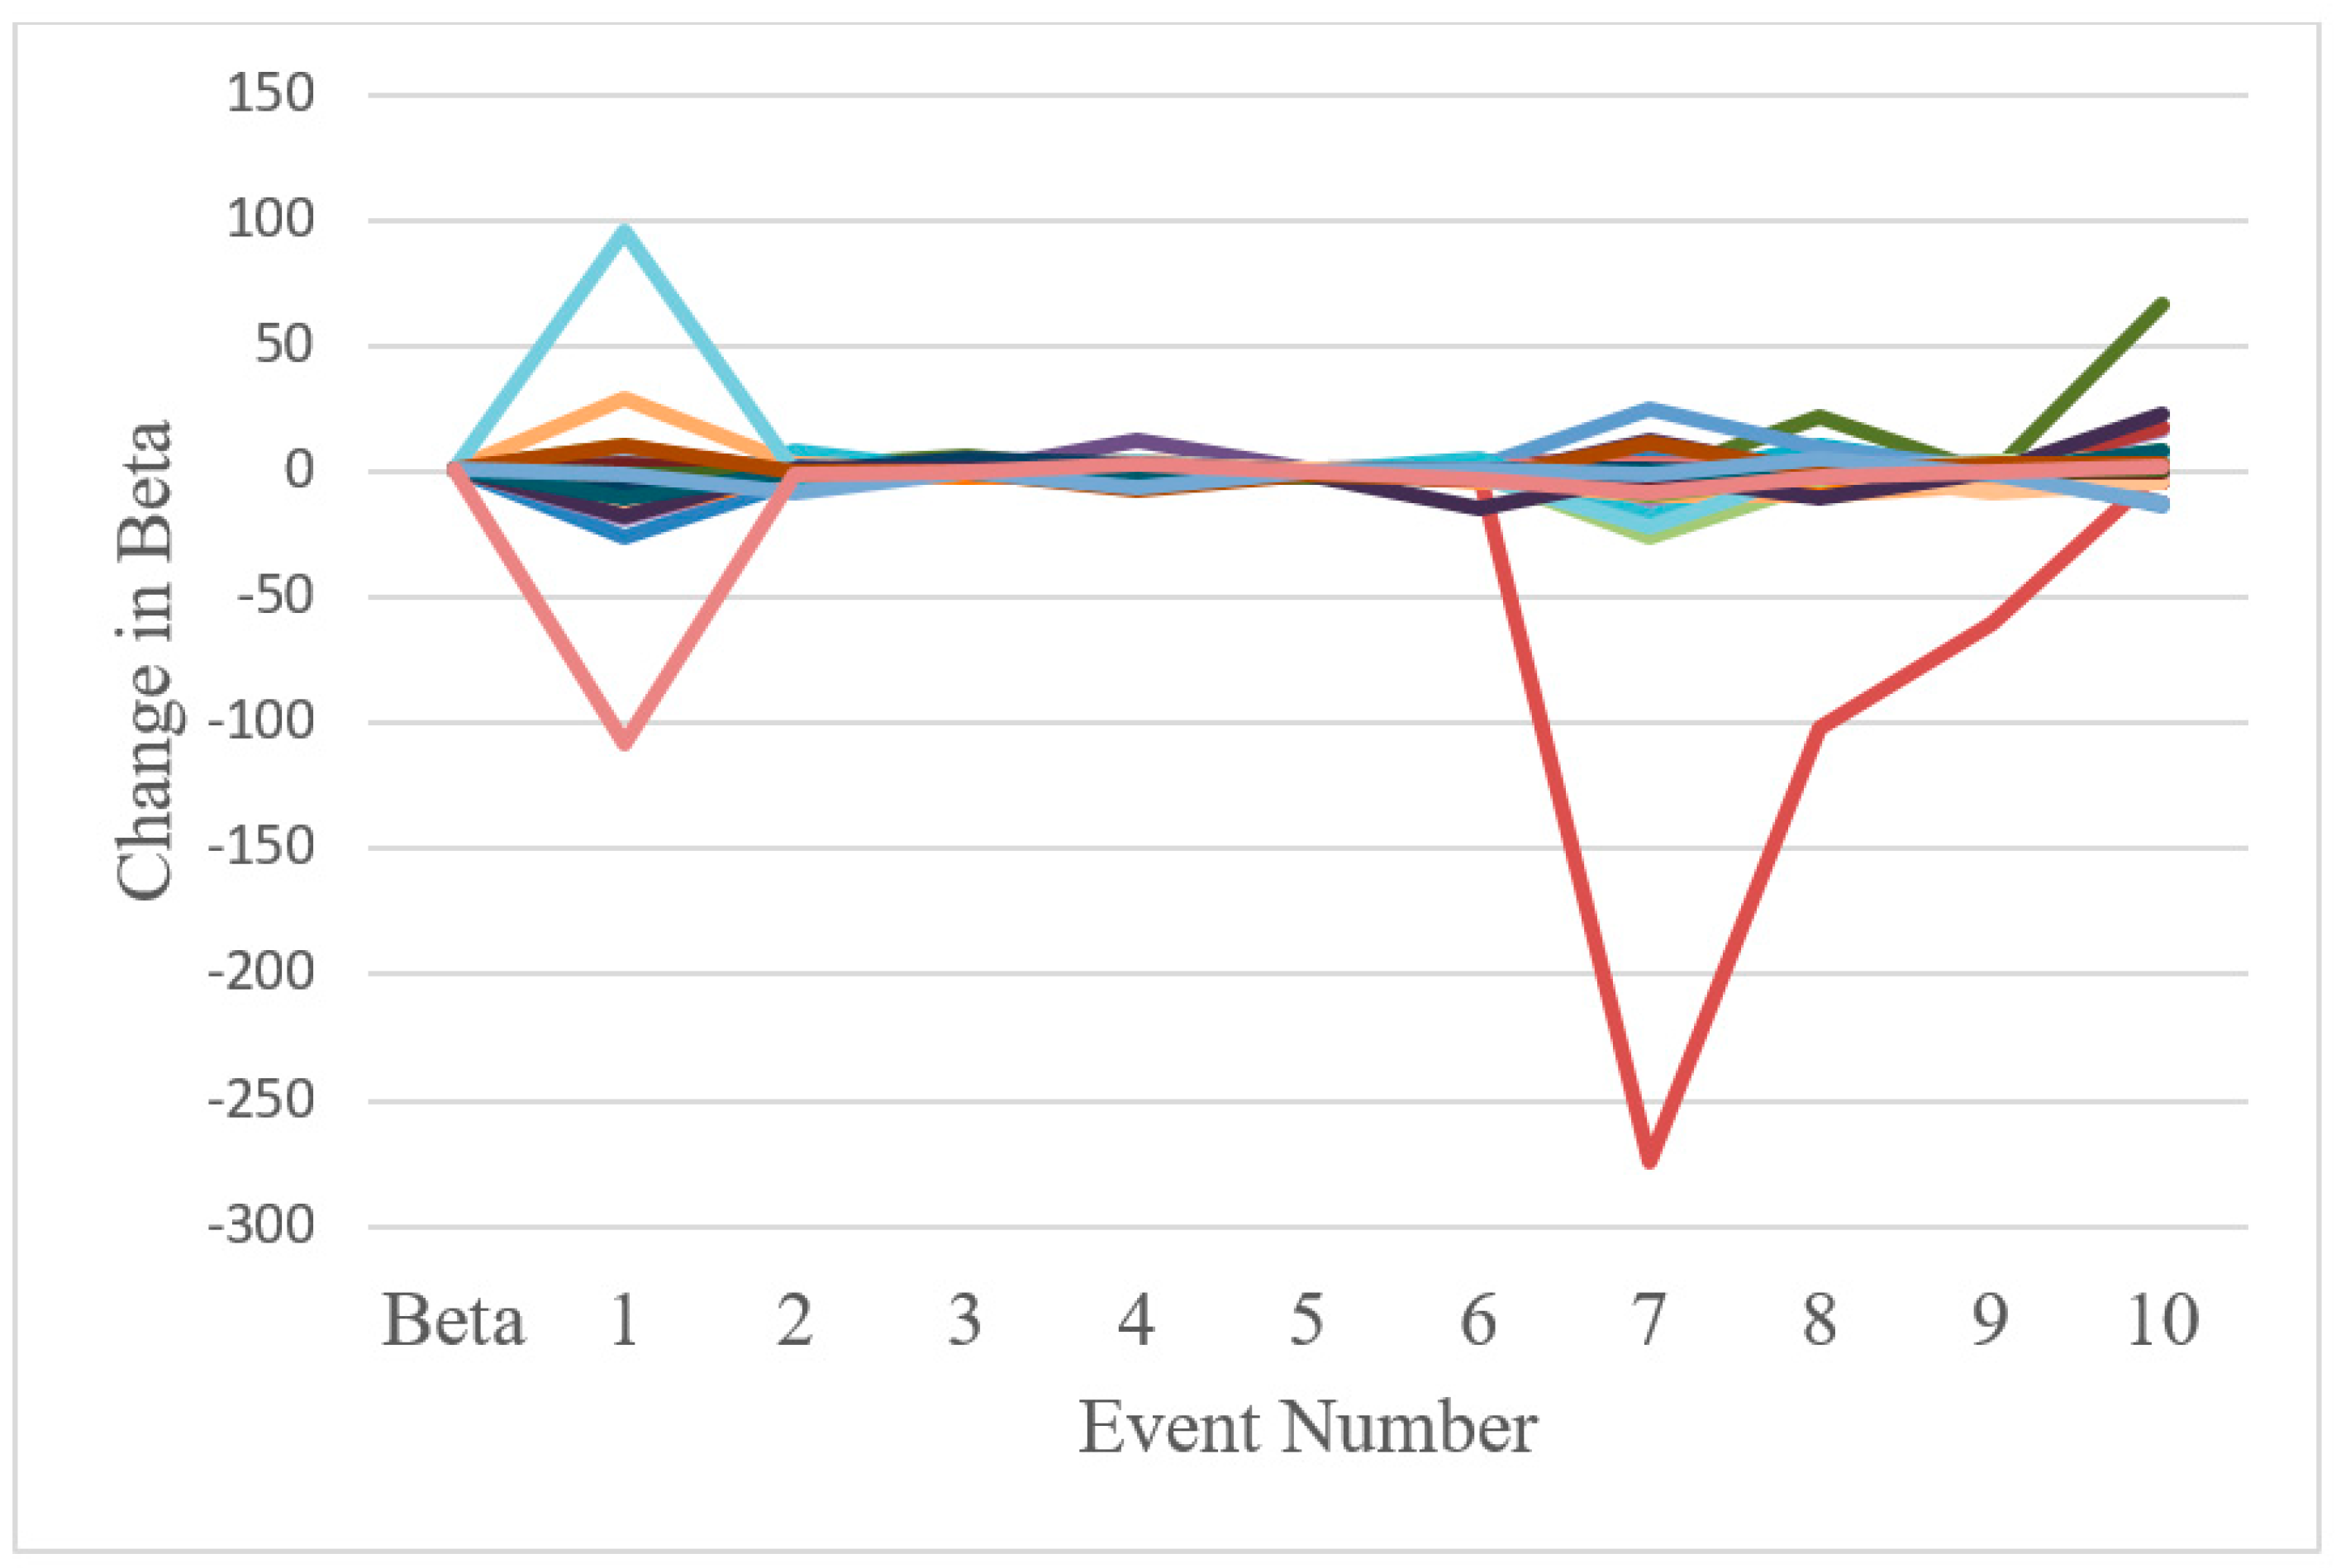
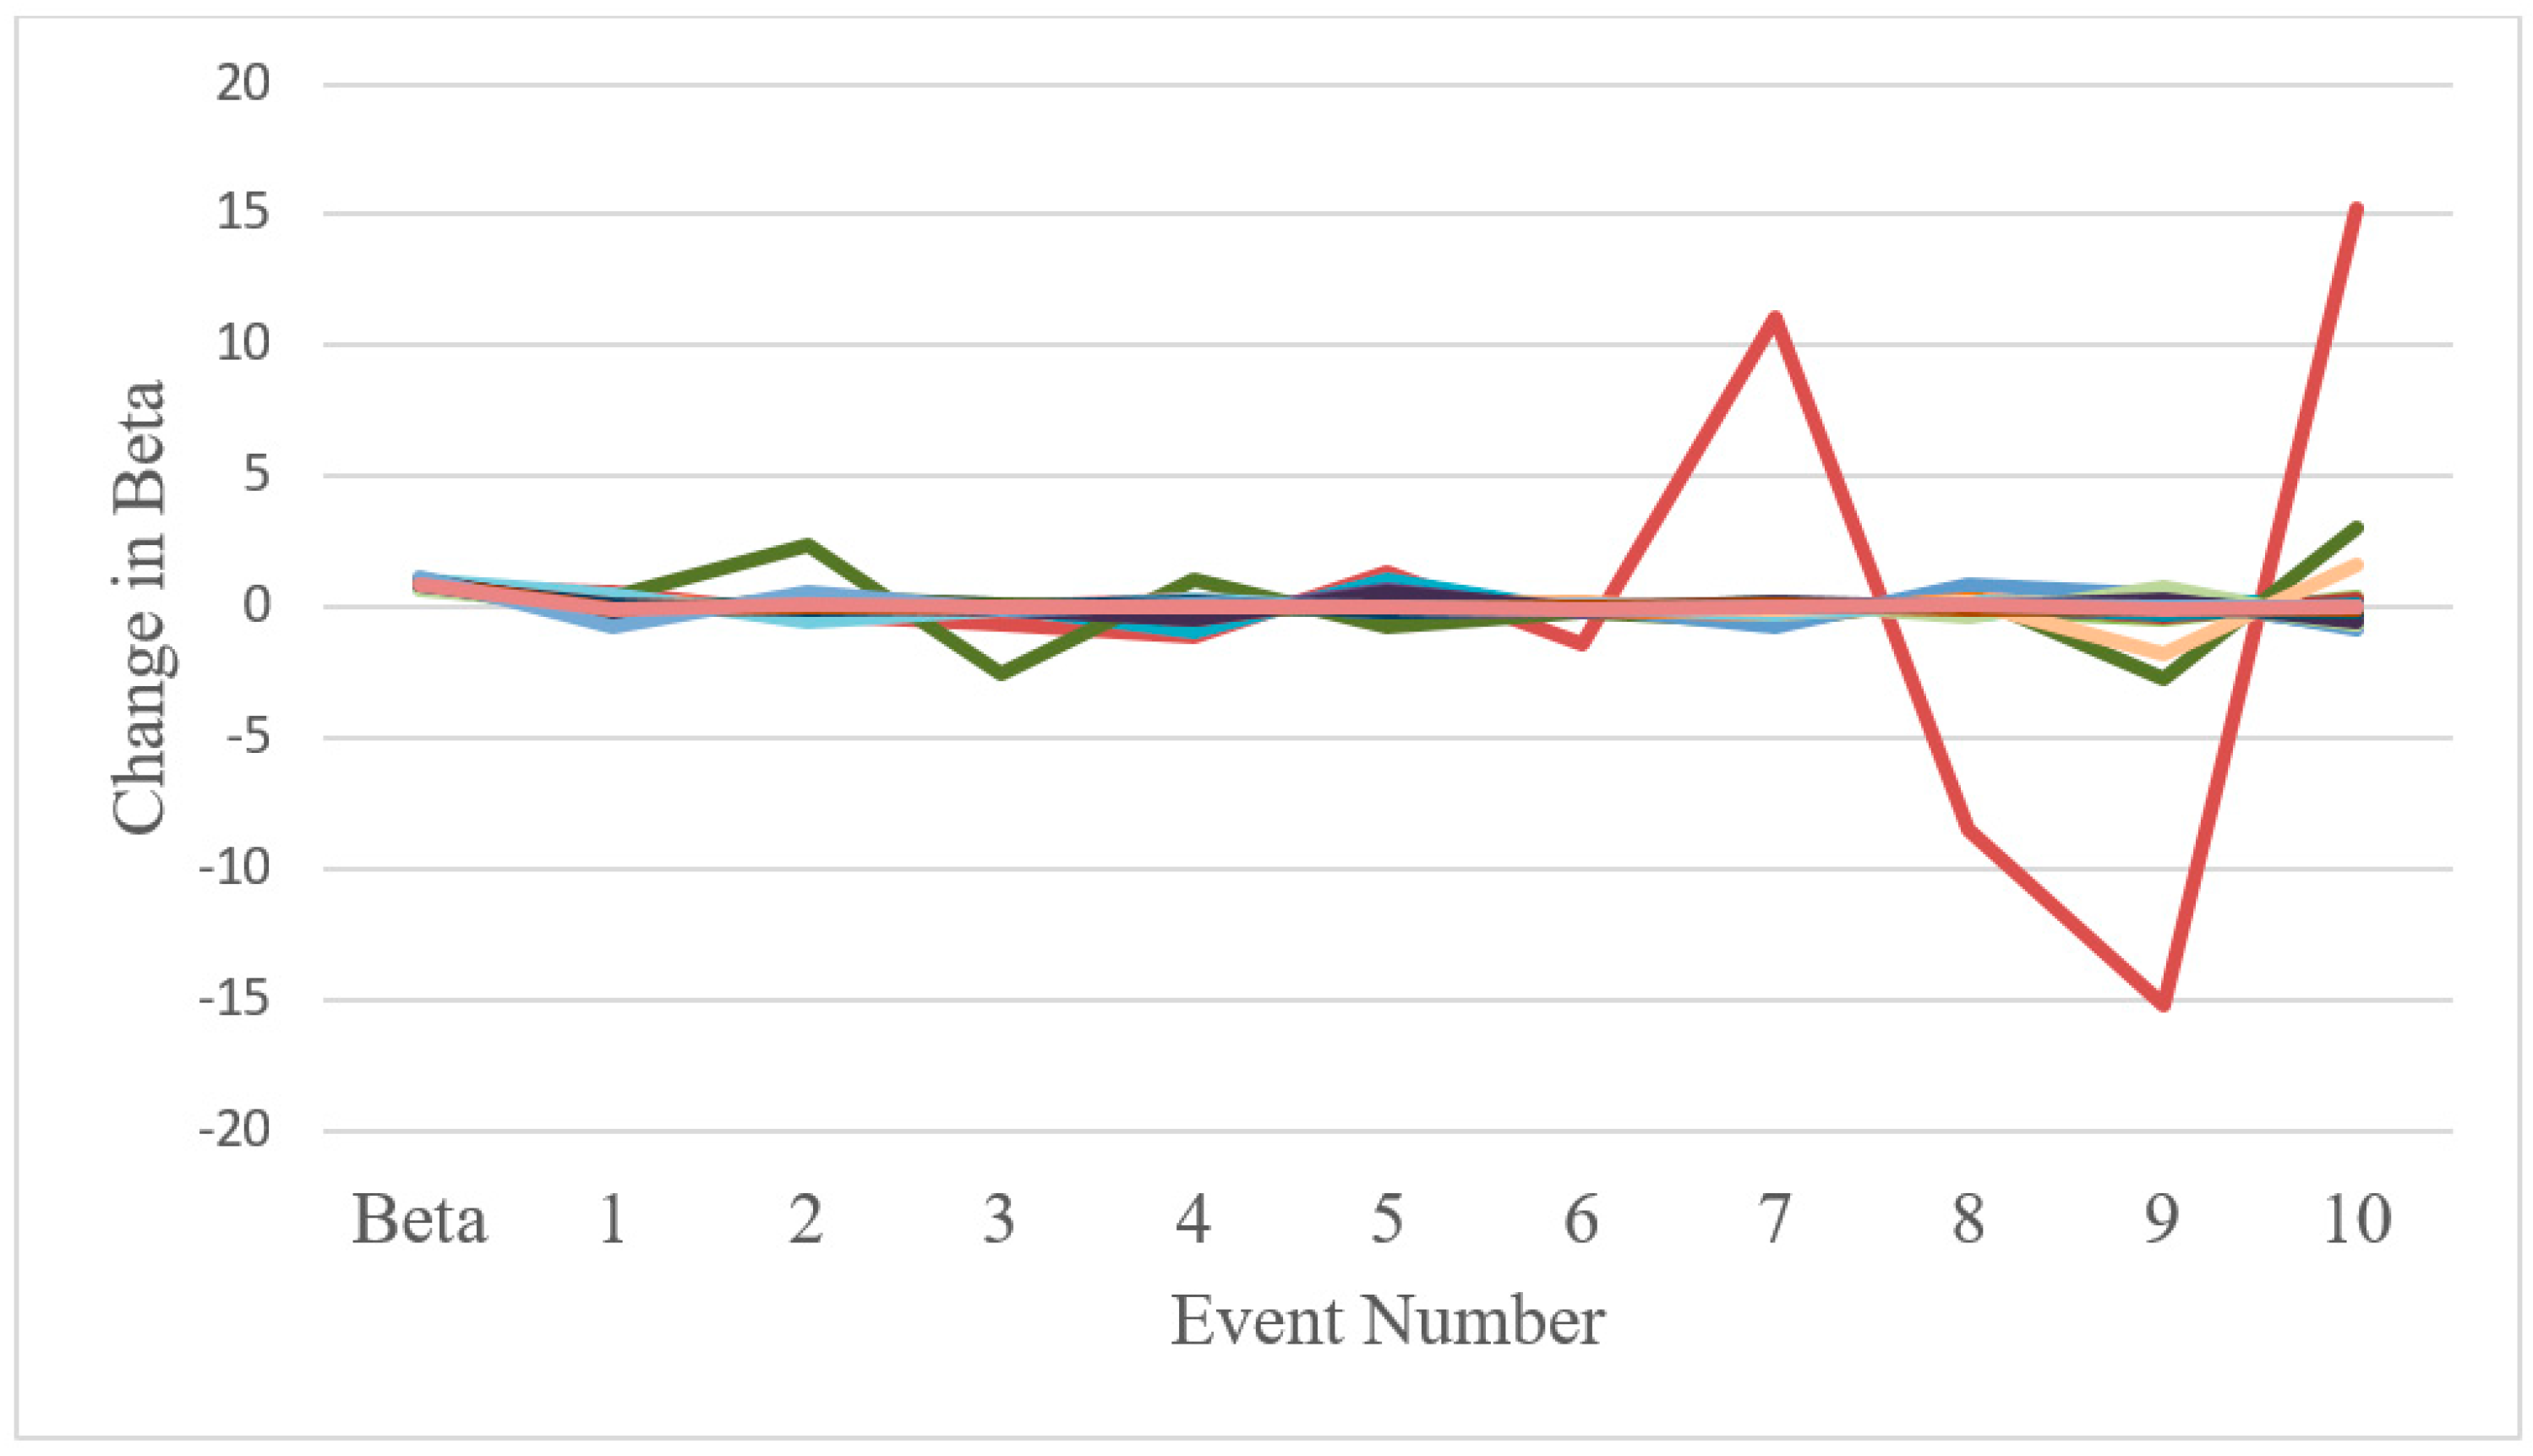
4.6. The Diamond Risk Structure

Another issue that requires an investigation is the effects of environmental regulation on risk. To address this issue, we study the effects of environmental regulation on the short-term and long-term systematic risk of 37 sectors. Equations (5) and (6) are estimated to capture changes in short-term systematic risk. These two equations are adjusted to obtain the long-term version that is used to capture changes in long-term systematic risk. We hypothesise that the risk of polluters rises (falls) with stringent (lax) environmental regulation and vice versa for the risk of environmentally-friendly businesses.
Table 5 presents the aggregate change in systematic risk following the announcements of environmental policies. The results show that only the media sector and the pharmaceuticals and biotechnology sector were affected by the announcements. The media sector experienced an overall decline in systematic risk (−2.2 with a t-statistic of −2.77) whereas pharmaceuticals and biotechnology had an overall increase in systematic risk (2.94 with a t-statistic of 25.7). Most sectors did not experience an aggregate change in systematic risk since the outcomes of each event may cancel each other. Therefore, Equation (6) is used to examine short-term changes in systematic risk following each individual event.
We find that Singapore’s ratification of major international environmental deals, including the Kyoto Protocol (event 1) and the Paris Agreement (event 7), led to a diamond risk phenomenon (Figure 1). The result is consistent with that of Pham et al. (2019a, 2019b) wherein the authors found similar evidence in France and Germany. In addition, our results show that the environmental regulation tends to have a negative effect as many sectors experienced an increase in short-term systematic risk when the carbon pricing bill was passed by Parliament on 20 March 2018 (event 10). Another interesting finding is that the alternative energy sector seems to be well-supported in Singapore as it experienced a significant decline in short-term systematic risk following the ratification of the Paris Agreement (event 6) and carbon tax announcements (events 8, 9, and 10). However, the effect on the alternative energy sector proved to be short-lived as we find evidence indicating that environmental regulation results in a relatively normal state of long-term systematic risk as the net outcome (Figure 2). The results also indicate that several sectors experienced an increase in both short-term and long-term systematic risk when the carbon pricing bill was passed in event 10 (Figure 1 and Figure 2).

5. Conclusions

The introduction of the carbon tax in Singapore is intended to combat climate change and global warming. This piece of environmental regulation is based on the use of carbon pricing to reduce carbon emissions by making firms more resource-efficient and engaging in sustainable activities. It is also intended to create more opportunities for the growth and development of green and environmentally-friendly sectors. Moreover, the Singapore government aims at enhancing awareness of environmental protection by encouraging consumers to use less electricity and shift to more energy-efficient products.
Overall, our results confirm the effects of environmental regulations on both polluting and environmentally-friendly sectors and indicate that the carbon tax is accomplishing its desired effects in Singapore. We also find evidence showing that several big polluters (including the industrial metals and mining sector, the forestry and papers sector, and the electrical equipment and services sector) attained negative abnormal returns around the announcement of the carbon tax. Although the electricity industry had no reaction on the first day of any event, we observe an unfavourable result five days following the news, which means environmental regulations show a certain degree of impact on polluting sectors and achieve their objectives. Moreover, the alternative energy industry (focusing on new renewable energy technologies) experienced a sizeable positive cumulative abnormal return five days before the arrival of the news that the carbon pricing bill was passed by Parliament as well as a significant decline in short-term systematic risk in certain events. Originally, the carbon tax was expected to come into force in 2019 as announced in 2017. However, the Singaporean government seemed to acknowledge the failure of the carbon tax from Australia and hence they postponed it to 2020, which could be considered as an act of policy refinement. As a result, the Singapore carbon tax seems to achieve its targets by affecting the polluting sectors negatively and environmentally-friendly sectors positively. These results provide a significant implication for policymakers of the countries planning to introduce a carbon tax. Unlike an emission trading scheme where the price of emission is determined by market forces, the policymakers need to carefully consider the price level of the carbon tax so that it would not be overwhelming to polluting firms that might eventually drive them out of business. From the investor perspective, they could take advantage of upcoming environmental regulations in the countries that have similar settings to those of Singapore by investing in environmentally-friendly businesses, as these businesses tend to exhibit positive abnormal returns when the environmental regulations or carbon tax are introduced. The results of this study are, however, limited to the Singapore stock market and hence, more studies should be conducted to fully understand the effects of carbon tax on the stock markets and examine if the findings are conclusive.

Author Contributions

H.P. contributed to every aspect of the article including conceptualisation, data analysis, writing and polishing. V.N. mostly dealt with data analysis. P.M. helped with the literature review and writing the empirical results. V.R. and I.M. improved the introduction, literature review, shaped up and improved the paper.

Funding

This research received no external funding.

Conflicts of Interest

The authors declare no conflicts of interest.

References

  1. Abolhosseini, Shahrouz, and Almas Heshmati. 2014. The main support mechanisms to finance renewable energy development. Renewable and Sustainable Energy Reviews 40: 876–85. [Google Scholar] [CrossRef]
  2. Acharya, Sankarshan. 1993. Value of latent information: Alternative event study methods. Journal of Finance 48: 363–85. [Google Scholar] [CrossRef]
  3. Allen, Frank E. 1992. Reducing Toxic Waste Produces Quick Results. The Wall Street Journal 11: B1. [Google Scholar]
  4. Ameer, Rashid, and Radiah Othman. 2012. Sustainability practices and corporate financial performance: A study based on the top global corporations. Journal of Business Ethics 108: 61–79. [Google Scholar] [CrossRef]
  5. Ataullah, Ali, Xiaojing Song, and Mark Tippett. 2011. A modified Corrado test for assessing abnormal security returns. The European Journal of Finance 17: 589–601. [Google Scholar] [CrossRef]
  6. Barraclough, Kathryn, David T. Robinson, Tom Smith, and Robert E. Whaley. 2013. Using option prices to infer overpayments and synergies in MandA transactions. Review of Financial Studies 26: 695–722. [Google Scholar] [CrossRef]
  7. Bhagat, Sanjai, Ming Dong, David Hirshleifer, and Robert Noah. 2005. Do tender offers create value? New methods and evidence. Journal of Financial Economics 76: 3–60. [Google Scholar] [CrossRef]
  8. Borochin, Paul. 2014. When does a merger create value? Using option prices to elicit market beliefs. Financial Management 43: 445–66. [Google Scholar] [CrossRef]
  9. Borochin, Paul, and Joseph Golec. 2016. Using options to measure the full value-effect of an event: application to Obamacare. Journal of Financial Economics 120: 169–93. [Google Scholar] [CrossRef]
  10. Bragdon, Joseph H., and John A. T. Marlin. 1972. Is pollution profitable? Risk Management 19: 9–18. [Google Scholar]
  11. Brennan, Michael J. 1990. Latent assets. Journal of Finance 45: 709–30. [Google Scholar] [CrossRef]
  12. Brown, Stephen J., and Jerold B. Warner. 1985. Using daily stock returns: the case of event studies. Journal of Financial Economics 14: 3–31. [Google Scholar] [CrossRef]
  13. Cai, Jie, Moon H. Song, and Ralph A. Walkling. 2011. Anticipation, acquisitions, and bidder returns: industry shocks and the transfer of information across rivals. Review of Financial Studies 24: 2242–85. [Google Scholar] [CrossRef]
  14. Chaplinsky, Susan, and Robert S. Hansen. 1993. Partial anticipation, the flow of information and the economic impact of corporate debt sales. Review of Financial Studies 6: 709–32. [Google Scholar] [CrossRef]
  15. Chesney, Marc, Ganna Reshetar, and Mustafa Karaman. 2011. The impact of terrorism on financial markets: An empirical study. Journal of Banking and Finance 35: 253–67. [Google Scholar] [CrossRef]
  16. Criscuolo, Chiara, and Carlo Menon. 2015. Environmental policies and risk finance in the green sector: Cross-country evidence. Energy Policy 83: 38–56. [Google Scholar] [CrossRef]
  17. Christainsen, Gregory B., and Robert H. Haveman. 1981. The contribution of environmental regulations to the slowdown in productivity growth. Journal of Environmental Economics and Management 8: 381–90. [Google Scholar] [CrossRef]
  18. Corrado, Charles J. 1989. A non-parametric test for abnormal security price performance in event studies. Journal of Financial Economics 23: 385–95. [Google Scholar] [CrossRef]
  19. Dowell, Glen, Stuart Hart, and Bernard Yeung. 2000. Do corporate global environmental standards create or destroy market value. Management Science 46: 1059–74. [Google Scholar] [CrossRef]
  20. Fama, Eugene, and Kenneth French. 1993. Common risk factors in the returns on stocks and bonds. Journal of Financial Economics 33: 3–56. [Google Scholar] [CrossRef]
  21. Fama, Eugene, and Kenneth French. 2015. A five-factor asset pricing model. Journal of Financial Economics 116: 1–22. [Google Scholar] [CrossRef]
  22. Feldman, Stanley J., Peter A. Soyka, and Paul G. Ameer. 1997. Does improving a firm’s environmental management system and environmental performance result in a higher stock price? The Journal of Investing Winter 6: 87–97. [Google Scholar] [CrossRef]
  23. Garnaut, Ross. 2018. The Garnaut Climate Change Review. Cambridge: Cambridge University Press. [Google Scholar]
  24. Gray, Wayne, and Ron Shadbegian. 1993. Environmental Regulation and Manufacturing Productivity at the Plant Level. NBER Working Papers, No 4321. Cambridge, MA, USA: NBER. [Google Scholar]
  25. Gupta, Kartick. 2018. Environmental sustainability and implied cost of equity: International evidence. Journal of Business Ethics 147: 343–65. [Google Scholar] [CrossRef]
  26. Halkos, George, and Anastasios Sepetis. 2007. Can capital markets respond to environmental policy of firms? Evidence from Greece. Ecological Economics 63: 578–87. [Google Scholar] [CrossRef]
  27. Hamilton, James T. 1995. Pollution as news: media and stock market reactions to the toxics release inventory data. Journal of Environmental Economics and Management 28: 98–113. [Google Scholar] [CrossRef]
  28. Klassen, Robert D., and Curtis P. McLaughlin. 1996. The impact of environmental management on firm performance. Management Science 42: 1199–214. [Google Scholar] [CrossRef]
  29. Lanoie, Paul, Michel Patry, and Richard Lajeunesse. 2008. Environmental regulation and productivity: Testing the porter hypothesis. Journal of Productivity Analysis 30: 121–28. [Google Scholar] [CrossRef]
  30. Linnenluecke, Martina K., Jacqueline Birt, and Andrew Griffiths. 2015a. The role of accounting in supporting adaptation to climate change. Accounting and Finance 55: 607–25. [Google Scholar] [CrossRef]
  31. Linnenluecke, Martina K., Cristyn Meath, Saphira Rekker, Baljit K. Sidhu, and Tom Smith. 2015b. Divestment from fossil fuel companies: Confluence between policy and strategic viewpoints. Australian Journal of Management 40: 478–87. [Google Scholar] [CrossRef]
  32. Linnenluecke, Martina K., Xiaoyan Chen, Xin Ling, Tom Smith, and Yushu Zhu. 2016. Emerging trends in Asia-Pacific finance research: A review of recent influential publications and a research agenda. Pacific-Basin Finance Journal 36: 66–76. [Google Scholar] [CrossRef]
  33. Malatesta, Paul H., and Rex Thompson. 1985. Partially anticipated events: a model of stock price reactions with an application to corporate acquisitions. Journal of Financial Economics 14: 237–50. [Google Scholar] [CrossRef]
  34. McGuire, Jean B., Alison Sundgren, and Thomas Schneeweis. 1988. Corporate social responsibility and firm financial performance. Academy of Management Journal 31: 854–72. [Google Scholar]
  35. Nandy, Monomita, and Suman Lodh. 2012. Do banks value the eco-friendliness of firms in their corporate lending decision? Some empirical evidence. International Review of Financial Analysis 25: 83–93. [Google Scholar] [CrossRef]
  36. Nieto, Jaime, Óscar Carpintero, and Luis J. Miguel. 2018. Less than 2 °C? An Economic-Environmental Evaluation of the Paris Agreement. Ecological Economics 146: 69–84. [Google Scholar] [CrossRef]
  37. Pathania, Rohit, and Arnab Bose. 2014. An Analysis of the Role of Finance in Energy Transitions. Journal of Sustainable Finance & Investment 4: 266–71. [Google Scholar]
  38. Pham, Huy N. A., Vikash Ramiah, and Imad Moosa. 2019a. The effects of environmental regulation on the stock market: The French experience. Accounting and Finance. [Google Scholar] [CrossRef]
  39. Pham, Huy, Van Nguyen, Vikash Ramiah, Kashif Saleem, and Nisreen Moosa. 2019b. The effects of the Paris climate agreement on stock markets: evidence from the German stock market. Applied Economics 51: 6068–75. [Google Scholar] [CrossRef]
  40. Prabhala, Nagpurnanand R. 1997. Conditional methods in event studies and an equilibrium justification for standard event-study procedures. Review of Financial Studies 10: 1–38. [Google Scholar] [CrossRef]
  41. Ramiah, Vikash, Belinda Martin, and Imad Moosa. 2013. How does the stock market react to the announcement of green policies? Journal of Banking and Finance 37: 1747–58. [Google Scholar] [CrossRef]
  42. Ramiah, Vikash, Jacopo Pichelli, and Imad Moosa. 2015a. The effects of environmental regulation on corporate performance: a Chinese perspective. Review of Pacific Basin Financial Markets and Policies 18: 1550026. [Google Scholar] [CrossRef]
  43. Ramiah, Vikash, Jacopo Pichelli, and Imad Moosa. 2015b. Environmental regulation, the Obama effect and the stock market: some empirical results. Applied Economics 47: 725–38. [Google Scholar] [CrossRef]
  44. Schmidheiny, Stephan. 1992. Changing Course: A Global Business Perspective on Development and the Environment. Cambridge: MIT Press. [Google Scholar]
  45. Sharfman, Mark P., and Chitru S. Fernando. 2008. Environmental risk management and the cost of capital. Strategic Management Journal 29: 569–92. [Google Scholar] [CrossRef]
  46. Song, Moon H., and Ralph A. Walkling. 2000. Abnormal returns to rivals of acquisition targets: A test of the “acquisition probability hypothesis”. Journal of Financial Economics 55: 143–47. [Google Scholar] [CrossRef]
  47. Hall, Stephen, Timothy J. Foxon, and Ronan Bolton. 2017. Investing in low-carbon transitions: energy finance as an adaptive market. Climate Policy 17: 280–98. [Google Scholar] [CrossRef]
  48. Stewart, Richard B. 1993. Environmental Regulation and International Competitiveness. The Yale Law Journal 102: 2039–106. [Google Scholar] [CrossRef]
  49. Subramanian, Ajay. 2004. Option pricing on stocks in mergers and acquisitions. Journal of Finance 59: 795–831. [Google Scholar] [CrossRef]
  50. Veith, Stefan, Jörg R. Werner, and Jochen Zimmermann. 2009. Capital market response to emission rights returns: evidence from the European power sector. Energy Economics 31: 605–13. [Google Scholar] [CrossRef]
  51. Walker, Kent, Na Ni, and Weidong Huo. 2014. Is the red dragon green? An examination of the antecedents and consequences of environmentally proactivity in China. Journal of Business Ethics 125: 27–43. [Google Scholar] [CrossRef] [Green Version]
  52. Walley, Noah, and Bradley Whitehead. 1994. It’s Not Easy Being Green. Harvard Business Review 72: 46–52. [Google Scholar]
  53. Wang, Guojian, Wenju Cai, Bolan Gan, Lixin Wu, Agus Santoso, Xiaopei Lin, Zhaohui Chen, and Michael J. McPhaden. 2017. Continued increase of extreme El Niño frequency long after 1.5 °C warming stabilization. Nature Climate Change 7: 568–72. [Google Scholar] [CrossRef]
  54. White, Mark A. 1996. Corporate Environmental Responsibility and Shareholder Value. Virginia: McIntire School of Commerce, University of Virginia, Unpublished Paper. [Google Scholar]
Figure 1. Short-term changes in systematic risk.
Jrfm 12 00175 g001
Figure 2. Long-term changes in systematic risk.
Jrfm 12 00175 g002
Table 1. Announcements on environmental regulation.
DateEventDescription
12 April 20061Singapore ratified the Kyoto Protocol
11 July 20062Date of entry into force of Singapore into the Kyoto Protocol
12 July 20123The National Climate Change Secretariat released the National Climate Change Strategy (NCCS-2012), outlining Singapore’s plans to address climate change through a whole-of-nation approach
24 September 20144Singapore ratified the Doha Amendment to the Kyoto Protocol, an international climate change agreement that formalises the nation’s commitments from 2013 to 2020
8 November 20145Prime Minister Lee Hsien Loong unveiled the Sustainable Singapore Blueprint (SSB) 2015
22 April 20166Singapore signed the Paris Agreement
21 September 20167Singapore ratified the Paris Agreement
20 February 20178Singapore government announced a new carbon tax which will come into force by 2019
19 February 20189All facilities producing 25,000 tonnes or more of greenhouse gas emissions in a year will have to pay a carbon tax from 2020, Finance Minister Heng Swee Keat announced
20 March 201810The carbon pricing bill, which sets out a framework for implementing the carbon tax, including the measurement, reporting and verification requirements, was passed in Parliament
Table 2. Sectoral reactions following the announcements of environmental regulation.
Robustness Tests
CAPMCorradoChesneyMarket IntegrationFama–French 5 Factor
SectorDateAR (%)t-StattCorradoCPt-StatAR (%)t-StatAR (%)t-Stat
Positive Reactions
Aerospace and Defense12 April 20063.272.462.330.131.260.000.00−0.21−0.16
11 July 20063.722.78−0.480.470.09−0.01−0.01−0.02−0.01
Food Producers19 February 20181.752.542.820.101.48−0.43−0.74−0.05−0.08
Food and Drug Retailers19 February 20181.172.071.920.042.150.110.210.150.26
Gas, Water and Multiutilities19 February 20182.452.812.770.300.550.130.160.660.79
Mining19 February 20183.922.252.060.320.490.280.170.770.44
Mobile Telecommunication19 February 20181.742.602.190.370.34−0.74−1.18−1.04−1.66
Pharmaceuticals and Biotechnology12 July 201219.166.380.310.500.000.130.050.060.02
Real Estate Investment and Services19 February 20181.311.972.570.111.430.691.220.801.32
Real Estate Investment Trust19 February 20180.822.491.770.061.92−0.38−1.57−0.29−1.17
Technology Hardware and Equipment Services24 September 20142.052.140.730.022.69−1.29−1.27−1.31−1.32
Negative Reactions
Beverages12 July 2012−2.12−1.98−2.400.470.09−0.45−0.42−0.57−0.53
Chemicals12 April 2006−5.20−2.32−1.480.042.280.040.02−0.22−0.11
Electrical Equipment and Services10 November 2014−2.49−2.34−0.820.081.671.331.431.141.18
22 April 2016−2.74−2.110.030.013.221.020.820.910.75
Forestry and Papers20 February 2017−4.92−2.02−1.840.141.23−2.76−1.28−2.73−1.25
Industrial Engineering11 July 2006−2.34−2.20−1.200.141.19−0.41−0.40−0.13−0.14
10 November 2014−1.36−2.15−1.300.500.000.781.250.560.89
Industrial Metals and Mining12 July 2012−4.14−2.64−0.500.330.48−0.65−0.43−0.75−0.50
Leisure Goods24 September 2014−4.44−2.11−1.740.500.01−2.91−1.35−3.32−1.52
Media12 July 2012−12.98−4.83−1.360.500.00−1.08−0.45−1.26−0.51
Travel and Leisure24 September 2014−1.53−2.12−0.440.151.161.492.241.341.98
Mixed Reactions
General Retailers21 September 20162.602.200.960.081.61−0.73−0.65−0.75−0.69
20 March 2018−2.62−2.59−1.190.450.13−0.33−0.330.330.31
Healthcare Equipment and Services22 April 2016−3.82−2.350.620.430.18−0.01−0.01−0.32−0.20
21 September 20163.742.900.810.081.692.101.401.991.33
Household Goods and Home Construction20 February 20173.702.271.220.013.181.611.041.681.07
19 February 2018−2.39−2.010.240.101.500.530.400.300.22
Table 3. Market anticipation following the announcements of environmental regulation.
Robustness Tests
CAPMChesneyMarket IntegrationFama−French 5 Factor
SectorDateCAR(−5)t-StatCPt-StatCAR(−5) (%)t-StatCAR(−5) (%)t-Stat
Positive Reactions
Alternative Energy20 March 2018126.092.770.470.08−0.09−0.08−0.04−0.04
Automobiles and Parts20 February 20176.442.420.500.010.091.330.091.33
19 February 20184.312.020.032.360.030.530.030.45
Banks19 February 20183.882.020.022.750.092.780.072.01
Beverages22 April 201620.462.930.032.390.211.480.191.36
Electrical Equipment and Services20 February 20175.962.300.360.370.070.930.060.76
Forestry and Papers22 April 20167.342.180.022.850.050.660.050.67
20 February 201717.283.620.081.650.070.680.070.70
General Industrials11 July 20066.632.070.151.180.020.250.030.39
General Retailers20 February 20174.021.990.013.810.030.520.020.35
Healthcare Equipment and Services12 July 20129.512.670.022.770.060.970.111.64
Industrial Engineering20 February 20173.912.470.171.060.081.910.071.67
Industrial Metals and Mining12 April 20064.792.010.061.820.081.240.050.81
21 September 20164.922.130.111.380.060.950.060.97
Leisure Goods21 September 201610.762.380.300.560.060.430.070.46
Life Insurance24 September 20143.672.060.450.130.030.940.041.19
19 February 20184.282.050.410.230.040.930.040.93
Media22 April 20169.062.040.081.610.030.170.010.05
19 February 20187.282.130.042.290.101.150.080.90
Mining12 April 200613.712.450.013.210.191.200.110.73
Nonlife Insurance12 July 20125.502.120.022.72−0.01−0.230.010.11
Oil and Gas Producers11 July 200620.742.420.121.340.120.670.120.65
Personal Goods10 November 20147.172.310.013.90−0.06−0.64−0.08−0.93
20 February 201712.783.670.470.080.121.570.141.73
Real Estate Investment and Services21 September 20164.053.350.131.290.041.440.051.51
Software 10 November 20149.632.920.013.98−0.03−0.37−0.03−0.35
Fixed Line Telecommunication20 February 201714.935.490.300.550.131.910.132.01
19 February 201811.943.650.032.560.232.900.222.83
Travel and Leisure24 September 20144.583.100.007.440.030.910.031.07
20 February 20175.652.970.022.610.071.080.061.00
Negative Reactions
Mobile Telecommunications19 February 2018−3.55−2.730.490.01−0.03−1.09−0.04−1.56
Real Estate Investment Trust12 April 2006−7.18−3.560.190.97−0.01−0.290.00−0.08
Mixed Reactions
Aerospace and Defense24 September 2014−6.50−2.100.470.07−0.05−0.60−0.05−0.67
20 March 20187.782.010.022.760.100.950.090.87
Table 4. Delayed Reaction following the Announcement of Environmental Regulation
Robustness Tests
CAPMChesneyMarket IntegrationFama−French 5 Factor
SectorDateCAR5t-StatCPt-StatCAR5 (%)t-StatCAR5 (%)t-Stat
Positive Reactions
Alternative Energy12 April 200643.102.570.022.630.240.530.350.79
Chemicals12 April 200616.783.840.032.360.161.680.141.49
Construction and Materials12 April 20067.182.460.270.640.142.120.111.73
Electrical Equipment and Services12 April 20066.072.510.280.630.030.630.030.54
Financial Services12 April 20064.851.970.141.240.030.470.030.44
Food Producers12 April 20065.632.240.101.440.071.050.030.57
Food and Drug Retailers19 February 20182.732.120.061.940.041.650.041.40
Healthcare Equipment and Services12 April 20067.952.060.032.470.141.230.151.39
Industrial Engineering12 April 20066.062.790.320.500.061.340.051.30
Life Insurance12 July 20127.302.830.061.910.071.740.102.34
Media12 April 20068.062.650.430.190.101.160.081.00
12 July 20128.192.140.500.00−0.06−0.56−0.04−0.35
Oil and Gas Producers12 April 200623.753.010.121.310.263.130.172.18
Technological Hardware and Equipment21 September 20167.332.930.013.090.070.950.081.10
Negative Reactions
Mobile Telecommunications11 July 2006−5.10−2.850.022.84−0.05−1.40−0.05−1.25
Nonlife Insurance12 July 2012−6.05−2.370.004.29−0.01−0.230.010.11
Personal Goods and Home Construction19 February 2018−8.36−2.870.121.30−0.07−0.89−0.09−1.17
Software 10 November 2014−6.78−2.050.061.870.020.220.020.21
22 April 2016−14.16−2.290.400.26−0.06−0.36−0.09−0.50
Mixed Reactions
Industrial Metals and Mining12 April 20068.163.440.022.740.081.240.050.81
19 February 2018−6.88−2.260.071.80−0.05−0.74−0.06−0.83
Electricity12 April 200619.922.750.022.700.221.430.241.65
24 September 2014−17.26−2.950.240.77−0.18−1.06−0.19−1.12
Fixed Line Telecommunications11 July 2006−20.93−3.560.071.73−0.22−1.98−0.22−2.04
19 February 201811.843.650.022.590.232.900.222.83
Table 5. Aggregate change in systematic risk.
SectorInterceptt-StatBetat-StatChange in Betat-Stat
Aerospace and Defense0−1.290.8457.280.260.74
Alternative Energy0−0.430.6811−0.160.00
Automobiles and Parts0−1.590.8979.63−0.25−0.22
Banks0−3.920.88195.880.050.09
Beverages00.430.9349.37−0.27−0.25
Chemicals0−0.380.8779.120.270.29
Construction and Materials0−0.240.8249.390.180.16
Electrical Equipment and Services0−1.710.8597.68−0.1−0.09
Electricity00.04−0.55−33.415.040.68
Financial Services0−0.210.7862.570.220.21
Food and Drugs Retailers0−0.010.8141.770.090.05
Food Producers0−3.290.96127.650.00−0.01
Forestry and Papers0−1.440.960.39−0.23−0.14
Gas, Water and Multiutilities0−1.710.98125.04−0.02−0.04
General Industrials00.270.96105.160.230.12
General Retailers0−2.790.94122.29−0.15−0.12
Healthcare Equipment and Services0−1.160.9597.7−0.16−0.30
Household Goods and Home Construction0−2.620.9380.15−0.22−0.26
Industrial Engineering0−4.440.95160.08−0.07−0.20
Industrial Metals and Mining0−2.550.9494.28−0.78−0.69
Industrial Transportation0−3.780.96118.960.110.13
Leisure Goods0−2.780.9560−0.24−0.07
Life Insurance0−0.40.93128.09−0.16−1.43
Media0−3.770.9563.18−2.2−2.77
Mining0−3.10.9663.99−0.07−0.02
Mobile Telecommunication0−0.010.98165.98−0.27−1.54
Nonlife Insurance00.980.8771.360.100.07
Oil Equipment0−2.480.97129.17−0.06−0.07
Oil and Gas Producers0−6.981.1109.81−0.19−0.08
Personal Goods0−3.220.9585.550.000.00
Pharmaceuticals and Biotechnology0−1.330.963.62.9425.7
Real Estate Investment Services0−2.470.98205.83−0.19−0.41
Real Estate Investment Trust00.840.98212.35−0.03−0.12
Software 0−3.970.9868.480.440.28
Support Services0−1.170.9142.040.210.07
Technology Hardware and Equipment0−3.920.9599.120.120.16
Fixed Line Telecommunications0−1.60.9466.930.220.21
Travel and Leisure0−1.440.94129.93−0.01−0.02
Unclassified0−3.110.9877.91−0.14−0.09

