1. Introduction
Throughout the world, central governments are seeking better property tax systems than the systems that currently fund local authorities’ activities. Moreover, many countries have been advised to increase and improve their property tax systems. It has been characterized as the “tax everyone loves to hate” (
Rosengard 2013).
Slack and Bird (
2014) indicate that governments have to deal with four aspects of property tax policy: setting the tax base, assessing properties, setting property tax rates, and administering the property tax system.
There are two common assessment methodologies used for valuing property: area-based assessments and value-based assessments.
Generally, property tax belongs to the field of studies related to property spheres (
Lis 2012). Property tax in Israel is called the Arnona tax (Arnona or the general property tax) and is imposed on the holder of a property according to the local authority’s rates at the beginning of the year following the central government’s directives published in the local council decree (
Darin 1999). In Israel, there are 261 municipalities, which include cities, local councils, and regional councils. This paper aims to identify the weaknesses of Israeli property tax from 1997 to 2017, as well as indicate how to improve the property tax system.
The local authority sets tax rates to decree once a year. However, the authority is subject to minimum and maximum limits, and the annual local rate increases according to the central government’s rates. The authority sends the tax assessment to the actual holder of a given property (residential, commercial, agricultural land, and occupied land). The tax calculation is done by multiplying the property area rate, while taking into account three main criteria: the type of property, its area (in square meters), and the area in which the property is located.
A property tax assessment contains the following seven elements: the property’s identity, the area of the property, the use made of the property, the classification of the property, premises, and exemptions, and the amount of tax levied (
Rostowicz 2001). These elements determine the tax burden in Israel. Property tax is due every two months, though it can be paid once a year. Interest payments are subject to interest and linkage differences according to
Section 4 of the Local Authorities Law (Interest and Linkage Differences on Compulsory Payments), 1980. The four cities in the sample adopted different measurement methods. Moreover, the appraiser’s reliance on four different methods causes a lack of uniformity in measuring the authorities’ properties, which can impact revenue and the quality of municipality services.
The lack of uniformity in measuring properties created inequalities in the property tax burden, forcing people to relocate to other cities where the property tax is lower (
Dalevska et al. 2019). Therefore, setting a uniform method of measurement and a uniform property tax rate for residential properties in the different cities creates appropriate equality (
Pospecu 2019).
There are four methods for measuring property areas described in the local property tax levy orders published each year in Israel. The four methods are as follows:
Net Area: the area of an apartment, including the area under the inner and outer walls, not including balconies. In the case of walls shared with another apartment, each apartment extends halfway (utilized in Haifa);
Gross Area: the entire apartment area, together with the apartment’s proportion in the stairwell. The relative area determines the stairwell’s closed area compared to all the apartments in the building (utilized in Beersheva);
Net–Net method: the area of an apartment (floor), including covered balconies, but it does not include the area outside the exterior walls, such as open balconies and areas lower than the minimum ceiling height (utilized in Tel Aviv); and
Gross–Gross Method: the gross size in addition to all possible extras, such as parking, warehouses, the relative part of an apartment on the roof and in the stairwell, and more (utilized in Jerusalem).
There is also a clear distinction between residential property tax and tax for non-residential properties (e.g., commercial properties). In many parts of Israel, residential property tax is significantly higher than non-residential property tax. In light of the gradual decline in central government assistance budgets (balancing grants), the authorities have been forced to develop a business center to increase property tax revenue rather than invest in developing residents’ neighborhoods.
Most countries of the world utilize property tax for municipal expenses. The justification for using property taxation as a kind of wealth can serve to “signal” a burden of public finance liability (
Hale 1985). A new form of capital requires more sophistication from the taxing authorities in terms of tracing, assessing, and taxing (
Youngman and Malme 2004).
Creating municipal taxes starts from the government, working through the local authority to the taxpayer who bears the tax burden. The relationship between all parties is complex. The government tries to reduce annual aid to the local authorities. The local authorities ask for more independence and freedom to make decisions regarding policy management and tax collection. Hence, the main theoretical problem is to create a tax system that can balance both local and national interests related to the market and the economy (
Christensen et al. 2016). The relationship between the municipality and residents is complicated. From the municipality’s perspective, there is a permanent and systematic desire to deepen the collection process by changing the classifications of assets or properties’ valuations. The residents wish to pay as little tax as possible, which they express during elections.
Although the municipal tax is perceived as a “hated” tax and is not popular among taxpayers, economists still regard it as an appropriate income source for the authorities (
Bird and Slack 2006). Municipal tax is highly influential, both fiscally and non-fiscally. There are generally two commonly methods of calculating property tax: area-based and value-based. The first approach calculates property tax by area and is prevalent in countries where the real estate market is not sufficiently developed, such as certain countries belonging to the former Soviet bloc, countries such as Romania, Hungary, Poland, Israel, and even certain countries in Africa and Asia (
Głuszak 2015). The second approach is based on value-based estimation, which is more common in developed countries, such as the UK, France, Germany, Canada, the USA, Japan, Finland, and Denmark. It calculates the property tax using the property’s value, which includes land and buildings. Every one to five years, a tax appraiser values the property and sets an appropriate rate on the owner using the municipality (
Chambers et al. 2009). Each approach has advantages and disadvantages. This paper mainly focuses on understanding the property tax on area-based residential properties, especially in the property’s assessment context. This understanding can help analyze the municipal tax’s effect on the residential market, an asset that concerns all property residents. Hence, understanding the relationship between housing markets and the urban economy through the property tax system is crucial to creating a better economic system.
Several researchers believe that property tax empowers local governments to stay in local governments (
Connolly and Bell 2009). It is essential to prevent heavy transfer dependency, imposing hard budget constraints, and ensuring adequate resource handling to provide public services the local governments are mandated to provide. Hence, there is a strong connection between revenue and expenditure, verifying transparency, and enabling taxpayers to force governments to deliver public services commensurate with tax payments. Thus, according to the main guidelines of fiscal federalism, local services, by and large, should be paid for by the beneficiaries, who are the residents (
Connolly and Bell 2010).
The two approaches of calculating property tax according to the area and the property’s value are subject to structural distortions stemming from evaluating the property. These distortions exist in almost all countries and create inequality and inefficiency in the tax burden. These countries produce “adjustments” to balance inequality and improve efficiency. These criteria are of great social and economic importance. There is enormous research that analyzes property tax computation according to the area and its value from various aspects. There is no uniformity among researchers regarding the question of which method is the best.
The municipalities’ reliance on property tax has both strengths and weaknesses. As argued by
Mieszkowski and Zodrow (
1989) and more recently by
Zodrow (
2001) in their comprehensive surveys of the property tax literature, property tax seems likely to have a somewhat progressive impact on the distribution of income, and it may also have relatively small distortive effects. However, it is also clear who must pay property tax, making property tax a more stable revenue (
Oates 2001). The activity and innovations of the municipalities and their development are essential components of each city’s economy (
Kwilinski et al. 2019).
Indeed, property tax has often been portrayed as an unpopular, hard-to-administer, and inelastic tax. However, this last feature, in particular, has proven to be an essential advantage in the recent recession. The authorities need the property tax rather than elastic sources of revenue such as income, sales, and excise taxes, which have, so far, in any event, helped the authorities to prevent some of the more severe problems experienced by individual governments in the current economic situation.
Given its administration’s institutional realities, it may take several assessment cycles (e.g., years) before changes in a property’s market values are accurately reflected in assessed values and, ultimately, in property tax collections. Moreover, property tax is regarded as a fair tax for local governments because it is immovable. It is unable to change location in response to the tax, and it is visible. Even the owner of a vacant property pays property tax. It is interesting to indicate that property tax has often been regarded as the “most hated” tax (
Brunori 2003). It is essential to note that property taxes have not been withheld at source, and they finance evident services such as roads, policing, and garbage collection. Visibility makes governments accountable for this type of tax, but it makes property tax a challenge to sell politically and even more difficult to increase or reform relative to other taxes. Its unpopularity stems from its potential volatility and unpredictability as a result of being based on market value (
Sheffrin 2010).
The contribution of this paper is to increase awareness about the need for a re-examination of the two assessments of measuring assets. For many years, these assessments have not been technologically renewed, even though it is known that they suffer from severe problems and lead to loss of revenue for the local government.
3. Results
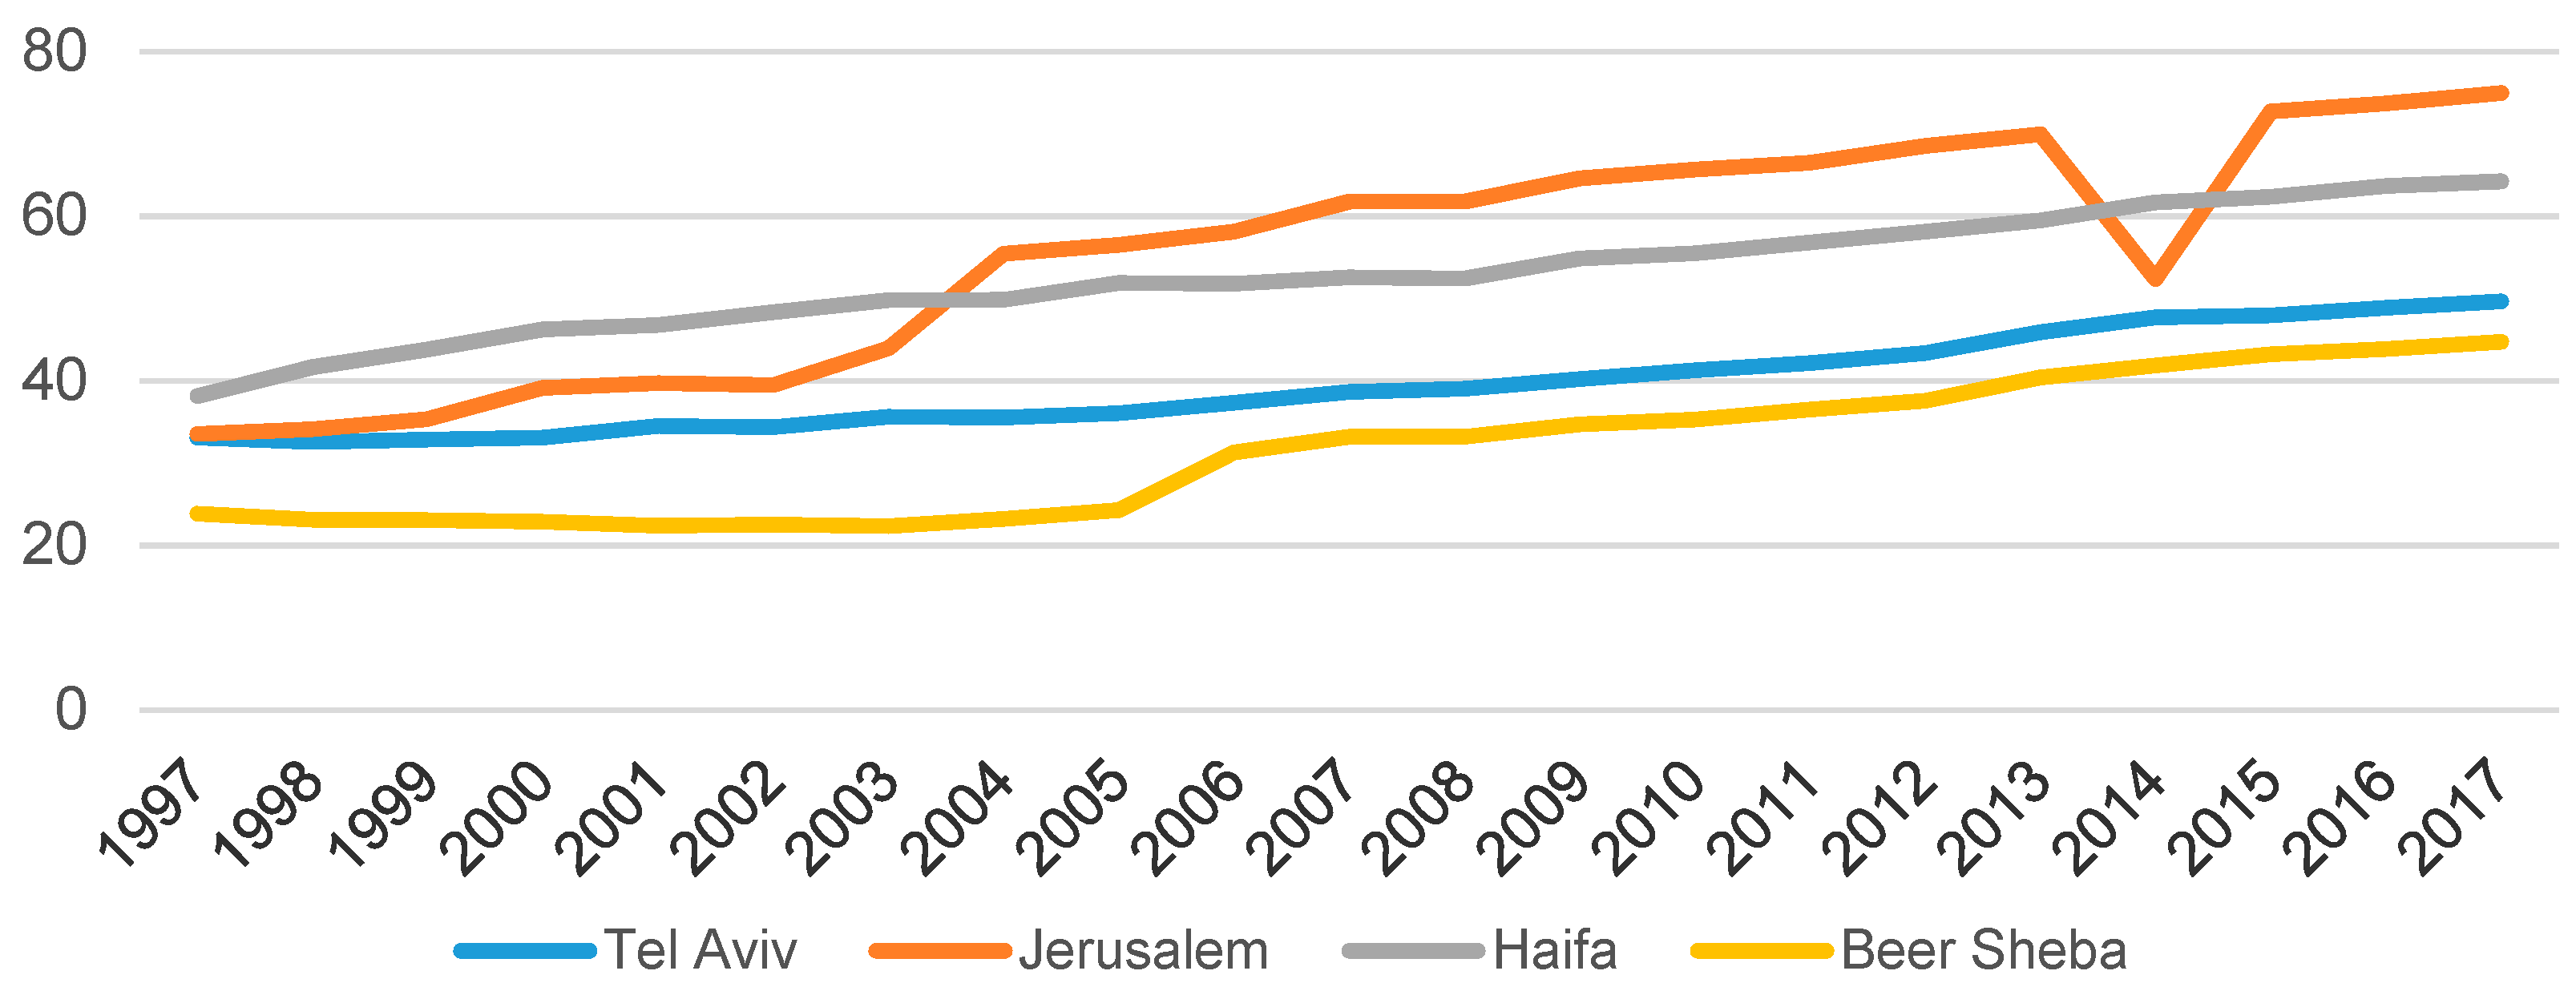
For the empirical analysis, several statistical tests were conducted on each city separately; these were then compared between cities (
Figure 1). The results of these statistical tests showed significant differences between the four cities. For example, as presented in the descriptive statistics, the NIS tax rate per square meter of housing in Jerusalem was 54.69 NIS, higher than the 39.53 NIS rate in Tel Aviv. This result does not fit because Tel Aviv was ranked in Socioeconomic Cluster 8, while Jerusalem was in Socioeconomic Cluster 2. An explanation for this finding is that Tel Aviv invested more in developing business centers where the municipal tax revenue was significantly higher than the residential income. On the other hand, business centers consume fewer services provided by the authority. In Israel, the property tax burden on businesses is significantly higher than on residents, even though they require more services such as schools, kindergartens, parks, and clubs.
Interestingly, the average rate of property tax per square meter in residential housing in Tel Aviv over the 20-year period was NIS 39.5 per square meter, while the average property tax rate in Jerusalem was NIS 55.6 per square meter. This gap does not reflect the fact that Tel Aviv was in Socioeconomic Cluster 8, while Jerusalem was in Socioeconomic Cluster 2, though it does show that Tel Aviv based most of its revenue from property tax on business rather than housing. The average property tax rate in Haifa over the 20-year period was 52.9 NIS per square meter and the city was ranked in Socioeconomic Cluster 7, whereas the average property tax rate in Beersheba was NIS 31.6 per square meter and the city was in Socioeconomic Cluster 5 (
Table 6).
Table 6 shows the significant differences between residential property tax rates per square meter between the cities, which are not in accordance with the clusters in which the cities are ranked. For example, in 2017, Tel Aviv was in cluster 8, but the property tax rate (49.7 NIS) was less than Jerusalem’s, which is was in cluster 2 (75 NIS). These differences in the property tax rate and the fact that each city adopted different measurement methods create significant differences between cities. These differences have an impact on residents’ decisions, as well as property tax revenues.
3.1. The Case of Tel Aviv
Tel Aviv is the second-largest city in Israel and is the economic and technological center of the country. It is ranked 25th in the Index of Global Business Centers. Tel Aviv has the fourth-largest economy in the Middle East, a population of 451,500, and is spread over a land area of 52,000 dunams (52 km2; 20 sq mi). Tel Aviv is Israel’s most important business center (data from the Central Bureau of Statistics in Israel).
While the tax rate rose by 50% over the 20-year period (
Table 6), this is a relatively moderate increase. This increase may be due to the Tel Aviv municipality’s policy to invest less in residential real estate and more in real estate development for businesses, where municipal property tax revenues are higher and require fewer municipal services. The property tax rate for residences in Tel Aviv was lower than in the other cities, because in Tel Aviv, there are more business centers and the revenues from them are significantly higher than in the other cities in the sample. The average municipal tax rate was NIS 39.53 per square meter of residential area. Although Tel Aviv was ranked 8 out of 10 in the socioeconomic section, this low municipal tax rate does not reflect its status as an important city in Israel. Moreover, this fact demonstrates the inequality in the property tax rate among the four sample cities.
In Tel Aviv, property tax revenues only doubled over the 20-year period, while in the other cities in the sample, they increased three and four times. Therefore, the question is whether the Tel Aviv municipality provided high-quality residential municipal services. According to the data presented in this paper, it appears that the Tel Aviv municipality was losing a great deal of revenue, and the method of measuring residential properties was at least partly to blame.
The technological method proposed in this paper is intended to increase and optimize the measuring of assets and, consequently, increase property tax revenues. Thus, Tel Aviv will be able to provide higher quality municipal service.
3.2. The Case of Jerusalem
Jerusalem is the largest city in Israel. It is also the capital city of Israel and the most populated city. The population of Jerusalem is 919,400 residents, including Jews (60.8%), Muslims (36.2%), Christians (1.8%), and unclassified residents (1.2%) (based on Central Bureau of Statistics in Israel (CBS) data).
The average property tax rate rose by 123% over the two decades. Jerusalem was ranked in Level 2 out of 10 on the socioeconomic scale. Although Jerusalem’s status was low, the average property tax rate was NIS 54.69 per square meter of housing. Such a high rate is reflected in a 240% increase in income over the two decades. However, unlike the other cities in the sample, Jerusalem experienced significant declines in 2014, most likely related to the war in Gaza and the associated political insecurity. In 2015, property tax revenue began to grow again, as shown in
Figure 1.
3.3. The Case of Haifa
Haifa is the third-largest city in Israel with a population of 283,600. The main seaport is located on Israel’s Mediterranean coastline in the Bay of Haifa, covering 63.7 square kilometers (24.6 sq. mi). Haifa consists of 103,000 households. Moreover, 25% of Haifa’s population is made up of immigrants from the former Soviet Union. Arabs constitute 10% of Haifa’s population; Haifa has commonly promoted a co-existence model between the Arabs and Jews. Haifa was ranked 7 out of 10 on the socioeconomic scale (based on data from the Central Bureau of Statistics in Israel (CBS)).
The property tax rate increased by an average of 68.2% over the two decades in this study. The average property tax rate was NIS 54.69 per square meter of housing. The high property tax rate is reflected in an average increase in revenues of 125% over the two decades. Although the property tax rate was relatively high and similar to that of Jerusalem, the volume of residential revenue did not increase dramatically, and it appears that there was a decrease in revenues as a result of asset measurement.
3.4. The Case of Beersheba
Beersheba is one of the fastest-growing cities in Israel. It has a population of about 209,000 and is the largest hub in southern Israel. Beersheba is the second-largest city (after Jerusalem), with a total area of 117,500 dunams. The Council for Planning and Construction approved a plan to increase the metropolitan population area to 1 million by 2030. Beersheba has a population of 20,000 Arabs, which represents about 10% of the population, and is ranked fifth in the socioeconomic scale (based on data from the Central Bureau of Statistics in Israel (CBS)).
Over the 20-year period, the property tax rate increased by 87%. Compared to the other three cities, Beersheba had the lowest property tax rate, averaging NIS 31.61 per square meter of residential property. The central government helped Beersheba with financial grants by absorbing many immigrants from the Soviet Union and new immigrants from Ethiopia.
3.5. Property Tax Revenue in the Four Cities
The property tax revenue was obtained by multiplying the residential property area’s tax rate, but the problem in Israel is that there is no uniform method for measuring property area. There are four measurement methods for the four cities, as
Table 5 and
Figure 2 illustrate, and thus there was a significant difference in revenue among the cities over the 20-year period. However, in each city, it can be seen that total revenues over the period were moderate. Of course, low property tax revenues result in a decrease in municipal services. In the author’s opinion, a dramatic reduction in property tax revenue compared to the growing expenses created the municipalities’ crisis, which began in 1995 in Israel.
4. Discussion and Conclusions
As can be seen from analyzing the results obtained in this paper, there is no uniform cost per square meter for residential property tax rates in Israel (property tax revenues divided by total residential square meters), which creates severe problems that need to be addressed by the government. The lack of uniformity of these measurement methods creates tax distortions.
Figure 2, in combination with
Table 5, shows the differences in the average income received from property tax over the 20-year period. The reason for this, in the author’s opinion, is the lack of uniformity in the measurement of residential properties.
Property tax has a significant influence on local government revenues and is unique since it is a tax levied on residential properties, combining taxation on property and consumption simultaneously. On the one hand, a residential property is a means of creating residential services, and on the other hand, it is a capital gain.
This paper offers one uniform method for all Israeli cities in which properties are measured using a drone equipped with a sophisticated camera with a GPS navigation system. The data obtained from the drone are then transferred online to computers with detailed geographic maps of all residential properties installed in the city’s jurisdiction. Thereafter, computer software that can combine the photos and the property’s size calculates the tax. The main component in this technology is a photo of the property taken from above, which allows us to check if there is any additional construction, without the need for an appraiser, thus saving time and money. This technological advancement could help eliminate the four standard measurement methods in Israel, leaving one uniform method. The exact data obtained from the drone and the determination of a uniform residential property tax rate can help to make the property tax system more objective. Furthermore, revenue will increase, time will be saved, and the high monetary costs associated with employing a real estate appraiser, who conducts property management using outdated methods and tools that are subjectively dependent on the individual, will be avoided. This technological method’s ease of operation allows high-frequency measurements to be taken, creating an up-to-date and advanced database. Another essential advantage of this method is early detection in cases of building abnormalities. One distinctive feature of the proposed technological method is that residents will not be bothered by appraisers entering their homes. The technological method suggested by the author may generate an increase in municipal tax revenue to the authorities. Furthermore, residents will be secure in the fact that their properties are being assessed by advanced technological means and are not subject to human error.
There are complex problems associated with estimation distortions in almost all countries. The appraiser has a crucial role in the two measurement methods. In the value-based method, he estimates the property’s value (
De Cesare and Ruddock 1998). In the area-based method, he measures the floor space of the property.
This study extends the understanding and knowledge of the standard methods of measuring property tax, which is calculated as the area multiplied by the tax rate. According to the technology suggested in this paper, a uniform assessment needs to be applied all over Israel to ensure a fair and equitable property tax system.
Future studies should continue analyzing the assessment methods of commercial properties in Israel to achieve uniformity of estimates, avoid property tax distortion, and create equality and efficiency in the property tax burden. There is a need to evaluate distributional impacts. At this stage, this is not possible because of a lack of data.
The statistical analysis of the results was performed on data collected on new residential dwellings rather than second-hand apartments or investment properties, which is a limitation of the paper. In this study, four of the largest and most important cities in Israel were examined. However, the analysis can be expanded to more cities. The lengthy data collection process limited this. The lack of historical data is another limitation to the study. It is essential to stress that in this paper, only residential property tax is examined and not property tax on commercial (business) properties.


