1. Introduction
Spillover and connectedness between various financial assets are essential for risk management and forecasting aspects of financial markets. In the past few decades, the literature has extensively concentrated on developing methods to measure the aggregate connectedness between financial assets. However, analyzing only aggregate connectedness between assets is not adequate since different shocks to one asset may have different effects at different frequencies. On the one hand, some of the shocks may only affect the short-term; on the other hand, others may affect investor expectations and have more permanent, long-term effects. Furthermore, the effects of shocks may also be different on returns and volatilities. Therefore, investors must examine the effects of shocks on return/volatility structures and at different frequencies since they may affect investors’ diversification decisions.
One of the most newly introduced instruments in finance is bitcoin. Since it was first introduced by
Nakamoto (
2008), it has been one of the assets that have captured investor attention and also been debated on. Since it is quite newly introduced, the linkages between bitcoin and other financial assets have been an important topic for researchers. Researchers such as
Brière et al. (
2015),
Dyhrberg (
2016a,
2016b),
Baur et al. (
2018),
Bouri et al. (
2018a),
Guesmi et al. (
2019),
Klein et al. (
2018),
Selmi et al. (
2018),
Symitsi and Chalvatzis (
2019), and
Al Mamun et al. (
2020) focused on the linkages between bitcoin and various financial assets to examine whether bitcoin can provide any diversification benefits.
The literature mainly concentrates on analyzing volatility connectedness. However, this may be misleading in terms of investors since the return and volatility frequency connectedness dynamics may be different, and both may provide valuable information for investors. This paper aims to investigate the total and frequency connectedness between bitcoin, gold, and crude oil on both the return and volatility levels. Although there exist some studies in the literature that investigate the spillovers among some financial assets, including these three assets, there is no study yet that concentrates solely on the connectedness of these three assets, both on return and volatility levels and also at different frequencies. Therefore, this paper’s methodology is built on both the total connectedness introduced by
Diebold and Yilmaz (
2009,
2012) and on the methodology by
Baruník and Křehlík (
2018) that decomposes the connectedness to different frequencies. The connectedness or spillover methodologies in the literature generally concentrate on total connectedness and do not provide information about the connectedness in different frequencies. The main advantage of the
Baruník and Křehlík (
2018) methodology is that we can compute the connectedness in different frequencies, such as short-, medium- and long-term. Since different frequencies are important for investor decisions, working with this methodology gives investors the flexibility to update their portfolios based on different connectedness degrees at different frequencies. Moreover, the choice of gold and crude oil as the other main assets in the analysis depends upon some specific reasons. The choice of gold for comparison is mostly based upon bitcoin being referred to as digital or new gold by researchers such as
Dyhrberg (
2016b). The choice of crude oil as the second asset for the comparison is based on crude oil and bitcoin having a common ground in mining, and bitcoin also being referred to as a commodity (
Bouri et al. 2017,
2018b). Furthermore, as
Gronwald (
2019) indicated, bitcoin shares some common characteristics with gold and crude oil, such as the fixed total number and the certainty of the number of bitcoins in circulation.
As also mentioned above, this paper aims to examine the connectedness among bitcoin, gold, and crude oil at different frequencies between January 2017 and December 2019. This period is vital since it contains substantial price fluctuations for bitcoin. Although it is similar to
Zeng et al. (
2019), it is also different in the sense that the volatilities are simulated from the stochastic volatility model; in addition, the analysis does not include the dollar and concentrates on a different, more restricted period. The difference in the results in terms of volatility spillovers signifies the difference between our studies. The rest of the paper is organized as follows: the literature is reviewed in
Section 2,
Section 3 introduces the data used, followed by methodology in
Section 4.
Section 5 represents empirical results for both the volatility and return series, and finally,
Section 6 concludes.
2. Literature Review
Various researchers have analyzed the connectedness between bitcoin and gold; however, there is no consensus among researchers in terms of the resemblance’s strength.
Dyhrberg (
2016b) employed the asymmetric power ARCH model to analyze the linkages between bitcoin and gold in terms of their hedging features and concluded that they have similar features. Moreover,
Selmi et al. (
2018) investigated whether bitcoin and gold can act as a diversifier or hedger against crude oil by employing quantile-on-quantile regression estimation. They pointed out that Bitcoin and gold can be used as safe havens against the oil market, especially during turbulent times. Furthermore, other studies by
Panagiotidis et al. (
2018),
Bouoiyour et al. (
2019), and
Shahzad et al. (
2019) also revealed that there is a strong connection between bitcoin and gold. Studies such as
Dyhrberg (
2016a),
Wu et al. (
2019),
Kang et al. (
2019),
Gajardo et al. (
2018),
Henriques and Sadorsky (
2018);
Pal and Mitra (
2019), and
Panagiotidis et al. (
2019) showed weaker connections between bitcoin and gold. Finally, there have also been studies which have presented outcomes against bitcoin sharing similar characteristics with gold, such as
Baur et al. (
2018),
Al-Khazali et al. (
2018),
Klein et al. (
2018),
Symitsi and Chalvatzis (
2019), and
Panagiotidis et al. (
2020). A detailed overview of the empirical findings on the comparison of bitcoin and gold performances can be found in
Kyriazis (
2020).
Although the literature on bitcoin and gold is extensive, studies focusing on spillovers and connectedness between bitcoin and crude oil or among bitcoin, gold, and crude oil are more limited.
Okorie and Lin (
2020) investigated the volatility connectedness between the crude oil and 10 cryptocurrencies using the VAR−MGARCH−GJR−BEKK techniques and the Wald tests. Their results indicated both bidirectional and unidirectional spillovers from (to) the crude oil market to (from) the cryptocurrency markets.
Jin et al. (
2019) tried to identify which one is more informative in determining price fluctuations in a system consisting of three commonly used hedging assets by employing multifractal detrended cross-correlation analysis (MF–DCCA), multivariate GARCH (MVGARCH), and information share (IS) analysis. In their results, significant volatility spillovers were detected among the three assets. The spillover effects from gold and crude oil markets to the bitcoin market are much stronger than other spillovers. Moreover, their results also indicated that the dynamic correlations between gold and crude oil markets were almost positive; on the other hand, between bitcoin and gold, those between bitcoin and oil markets were nearly negative during their whole sample periods.
Zeng et al. (
2019) also analyzed the linkages between bitcoin, gold, and crude oil, and they also included the dollar. Their methodology is similar to that used in this paper; however, they analyzed a more extended period from 1 May 2013 to 15 February 2019. However, this paper’s analysis only covers the period from 3 January 2017 to 31 December 2019, where huge price fluctuations were observed in bitcoin prices. Their results showed that although spillovers for returns exist in the short-term, spillover among volatilities existed in the long-term for the given period.
Gkillas et al. (
2020) analyzed the spillover effect for higher distribution moments, namely, realized volatility, realized skewness, and realized kurtosis for bitcoin, gold, and crude oil via Granger causality and generalized impulse response analyses. The results of their analysis of high-frequency data suggested that they were related not only to the realized volatility level but also to jump components, skewness, and kurtosis.
3. Data
The data set employed in this paper consists of daily US dollar price series of bitcoin, gold, and crude oil. The daily series ranged from 2 January 2017 to 31 December 2019. All the series are readily available at Investing.com. However, since gold and crude oil do not have weekend values, bitcoin’s price values for Saturdays and Sundays were removed from the data set. Moreover, if there were any other unmatched days in the data sets, they were also removed. There were 777 data points in total. In terms of the returns series, logarithmic returns were computed for all three series.
Figure 1 and
Table 1 below represent the return series and the descriptive statistics for the return series, respectively.
Based on the mean values of the return series, bitcoin offered the highest average return, followed by gold. Furthermore, the maximum values also suggested that bitcoin had the highest maximum return values in the time range used. However, the minimum values showed that bitcoin also had the maximum loss, equal to almost 24% in this period. These results are not surprising since the data period covered the period where bitcoin price increased suddenly to almost $20,000 and then suddenly dropped back to the $7000–8000 range and then to $3500 afterward. Crude oil also had a wide return range, as suggested by the maximum and minimum values of 0.1369 and −0.0823, respectively. Finally, based upon the choice of time range again, bitcoin return had the highest standard deviation as well.
Since the connectedness between volatilities of bitcoin, gold, and crude oil series was also analyzed, the volatilities were filtered for all three series. The volatilities of the series were filtered out based on the basic stochastic volatility (hereafter SV) model by
Taylor (
1982) and the efficient importance sampling (EIS) methodology suggested by
Richard and Zhang (
2007). The SV model is formulated as follows:
where
and
represent return and volatility, respectively, at time t:1
T. The random error terms,
and
are Gaussian standard normal.
represents the constant in the volatility function;
is the persistence of volatility, and
is the standard deviation of volatility. Equations (1) and (2) characterize a Gaussian nonlinear dynamic state-space model. Since
on
in (1) are nonlinearly related, sequential EIS was applied to evaluate the likelihood function of the basic SV model. The procedure produces highly accurate Monte-Carlo estimates of likelihood functions for a wide range of SV models, as
Liesenfeld and Richard (
2003,
2006) have shown. Details of the procedure can be found in
Richard and Zhang (
2007). The graphs for daily volatility series are given in
Figure 2, and the descriptive statistics for filtered volatilities are given in
Table 2 below.
Although bitcoin had the highest mean value for the return series, gold had the highest mean value in terms of the volatility series, followed by crude oil. On the one hand, when maximum and minimum values were considered together, crude oil had the widest volatility value range, and gold had the narrowest. On the other hand, bitcoin had the highest standard deviation.
Finally, since the methodology depends on VAR methodology, all the series’ stationarity was tested using the augmented Dickey–Fuller series. The unit root was rejected for all the price and volatility series; therefore, all the series were stationary.
4. Methodology
The connectedness between return and volatility series bitcoin, gold, and crude oil was analyzed using
Diebold and Yilmaz (
2009,
2012,
2014; hereafter, DY) and
Baruník and Křehlík (
2018; hereafter, BK) spillover frameworks. The frequencies in the spectral representation of variance decompositions were employed to visualize connectedness between time and frequency dimensions. In the first step, the spillovers are computed in the DY framework, which is then decomposed into frequencies using the BK approach. Although total connectedness for the variables is computed under the DY approach, it is not possible to decompose it to different frequencies in this approach. However, the BK approach allows us to decompose the total connectedness value into frequencies, and therefore we can analyze the connectedness between variables in the short-, medium-, and long-term. When all different frequency connectedness values are summed up, they add up to the DY approach value. Furthermore, the BK approach also allows us to compute the within connectedness, which shows how the shocks are transmitted within the frequency band, and it ignores the outside of the band.
The DY spillover framework depends upon the forecast error variances derived from a VAR model to identify the responsiveness of dependent variables to the changes in independent variables. A VAR model with n variables and p lags can be presented as
where
stands for Gaussian error term with zero mean and covariance matrix Σ. In the model,
stands for the
n × 1 coefficient vector of
. Moreover, the term
is the polynomial matrix of coefficients, with lag operator
, based on
pth order and
n ×
n lags.
We can represent the moving average version of the VAR process, assuming covariance stationarity, by Equation (4), as follows:
where
represents an
n ×
n lag polynomial matrix for the forecast errors.
Pairwise connectedness using own and cross variance decomposition matrix by
Diebold and Yilmaz (
2012) methodology is represented by Equation (6), as follows:
where
represents the effect of the
jth variable on the
ith variable’s forecast error at time horizon H.
Equation (5) is divided by
to achieve normalization since shocks are not orthogonal and, therefore, forecast error variances do not add up to 1. Equation (6) is as follows:
In the second part of the methodology, the frequency responses to shocks are analyzed by using the
Baruník and Křehlík (
2018) approach. Fourier transformation can be used to compute the frequency responses since frequency responses to shocks are time-variant and, thus, do not follow a periodic pattern.
The Fourier transformation to
coefficients is done using Equation (7):
where the term
stands for the frequency of the response functions and
.
The power spectrum
, which overlays the distribution of the variance of
Xt, can be inferred using Equation (8), as below:
Afterward,
Baruník and Křehlík (
2018) estimated generalized forecast error variance decomposition corresponding to a specific frequency ω by using Equation (9), as follows:
The equation measures the pairwise connectedness from
j to
i for a given shock and at a given frequency ω. Then Equation (9) is normalized by dividing it by
For a given frequency, d = (a,b), the overall pairwise connectedness measure with aggregated information is computed using Equation (11).
from which Equation (12) can be driven.
The
Baruník and Křehlík (
2018) methodology also allows us to compute directional spillovers. The directional spillovers from other variables to variable
i for a specific frequency band can be computed by using Equation (13), as follows:
Moreover, to estimate the directional spillovers from variable
i to other variables for a specific frequency band, Equation (14) is used as
Net nonpairwise spillovers between variable
i and variables other than it can be obtained by subtracting Equation (14) from Equation (13), as shown in Equation (15). If Equation (15) has a positive value, more spillover is transmitted from
i than it receives from other variables.
Finally, the specific frequency band’s influence on the VAR network system is estimated by using Equation (16), as follows:
where
estimates the impact of a specific frequency band on the entire connectedness of the network, which is represented in Equation (12). When we sum up the connectedness values for all available frequencies, it equals the accumulated total connectedness, as explained by
Diebold and Yilmaz (
2014).
5. Empirical Results
5.1. Results for Volatility Series
In
Figure 3 and
Figure 4, total connectedness and frequency connectedness over 50-day rolling-sample windows are plotted. The total connectedness in
Figure 3 ranges between 5% and 70%, with a variation over the course of almost three years. The overall connectedness reached its highest level, almost 70%, in November 2017, when the upward movement in the prices started and volatility was high. It also covers June 2018 and December 2018 period, where the price dropped to
$3500. This period also coincided with the period where crude oil prices started to increase and reached a maximum in 2018, and, therefore, the volatility in the return of crude oil increased. Moreover, the gold price dropped to
$1200 in the same period. Between March and April 2019, one more peak point was observed when bitcoin and oil prices started to increase, and the volatilities in all the return series also increased.
Although total connectedness captures the peak in connectedness among the assets in the periods of financial turmoil, it does not give us information about how these shocks will be transmitted to the different frequencies such as the short-, medium- and long-term. Since different horizons are important for investors, it would be useful to decompose the connectedness into different frequencies, especially for their diversification decisions.
Figure 4 reveals the frequency decomposition of the connectedness between bitcoin, gold, and oil volatilities. First of all, high total connectedness is mostly driven by short- and medium-frequency components. In all the periods where total connectedness rises, medium-term connectedness also peaks but not high and low frequencies. The connectedness in the low frequency is between 0–5% over the whole period. The shape and movement of medium frequency connectedness are similar to the total connectedness throughout the period. All these results indicate that the shocks to the system affect the short-term, but it takes more than a week to see the main effect in the system, and they die out after 20 days in the long-term since the shocks do not affect investor expectations. Low-frequency connectedness peaked only when total connectedness peaked around August 2018, when the price of bitcoin dropped to
$3500. Only towards the end of the data period does the low-frequency connectedness increase, and, therefore, total connectedness does not decrease even though medium-frequency connectedness decreases. This result indicates that the bitcoin price’s huge drop had affected investor expectations and created long-term instability. Overall, it is possible to conclude that an increase in medium-term uncertainty mostly caused the increases in the level of total connectedness throughout the whole period; however, the effect of the drop in bitcoin price towards the end of 2018 also changed investors’ expectations.
Figure 5a below displays the within connectedness among the variables. The within connectedness ignores the outside of the band and shows how the shocks are transmitted within the frequency band. Therefore, they can be interpreted as pure, unweighted connectedness. Time dynamics are more similar for all the frequencies, except the beginning and end of the data period, when within connectedness is considered. Although the movements of the connectedness figures in different frequency bands are quite similar, at the beginning and end of the analysis period, a rise in the high frequency is not observed as it is observed in the other frequencies. Overall, this similarity in all frequencies’ movements indicates that it is mainly the power of frequency responses that drives the time-frequency decomposition found in the previous figures.
Figure 5b shows the within connectedness when the effect of cross-correlations is excluded. If there is a strong contemporaneous relationship between variables, this can cause a bias since variance decomposition is used. Therefore, BK also computes within connectedness when no cross-correlation exists between variables. However, the similarity between the different frequencies does not change much, especially between medium and high frequencies. High-frequency connectedness is slightly different when we allow for cross-correlations for the period after December 2018. Despite this small difference, it is possible to conclude that the shocks throughout the analysis period are almost the same, except for this period. Results show that, after this date, for a period of 5–6 months, the contemporaneous connection between the assets also increased and affected the connectedness between the assets.
5.2. Results for Return Series
In
Figure 6 and
Figure 7 below, the graphs for total and frequency connectedness of the returns are displayed. Compared with the connectedness of return volatilities, the connectedness among returns is not as high as it is among volatilities and ranges between 5% and 35%. The highest peak point is observed at the end of the analysis period between October and December 2019. In this period, a small downward movement in the gold and bitcoin prices was observed.
The frequency connectedness graphs in
Figure 7 show that when compared with total connectedness, connectedness among the variables is mostly driven by connectedness in the high- frequency. Medium and low frequencies only range between 0% and 5% throughout the whole period. The movement and the range of the high-frequency graph are quite similar to the total connectedness. It indicates that the total connectedness between returns is mostly driven by high frequency; therefore, it shows that the market processes the information rapidly, and a shock to one of the assets only affects the short-term behavior. This result is different than what is observed in the volatility series. These results imply that the effects of shocks on returns are observed in the short-term; their effects are mostly observed in the medium-term for volatilities, which indicates the necessity of analyzing not only volatilities but also returns in terms of connectedness.
Figure 8a below displays the within connectedness among the variables. Time dynamics are more similar for all the frequencies when compared with the graphs above. Furthermore, when the figure is compared with
Figure 5a, the main difference is that within connectedness in volatilities in
Figure 5a is mostly dominated by medium and low frequencies. However, all the frequencies have almost the same importance for returns; sometimes, even low frequency may dominate the others, such as in the August–December 2018 period.
Figure 8b shows the within connectedness when the effect of cross-correlations are excluded. As mentioned above, if there is a strong contemporaneous relationship between variables, this can cause a bias. Therefore, within connectedness with no cross-correlation prevents this bias. When compared with
Figure 8a, the different frequencies still have similar movements and values. The connectedness values are a little bit lower than
Figure 7a, but they again reached the 30% level throughout the time period. The difference that existed for the volatilities towards the end of the data period also existed for returns. When compared with the whole period, it was a little bit higher for the period after December 2018. Despite this small difference, it is possible to conclude that the shocks throughout the analysis period are almost the same; therefore, there is no bias caused by the strong contemporaneous relationship between variables.
6. Conclusions
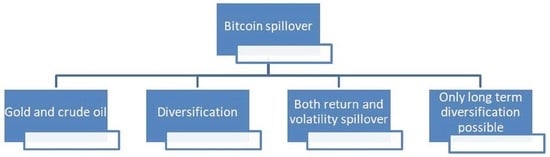
The connectedness among financial assets is essential for investors since it may affect their diversification decisions. In this study, the main objective was to understand if bitcoin, gold, and crude oil markets are connected and also, if they are, to try to decompose the connectedness into its frequencies. The analysis of the connectedness at different frequencies has important implications since some shocks to some assets may be effective on the others only in the short-term, and this implies possibilities for long-term diversifications among these assets. On the other hand, some shocks may affect investor expectations and may cause long-term instabilities. Furthermore, the analysis of only the volatility connectedness may not be adequate in terms of diversification decisions. The return connectedness may have different frequency dynamics. Therefore, both returns and volatilities should be analyzed.
The analysis was based upon methodologies by
Diebold and Yilmaz (
2009,
2012) and
Baruník and Křehlík (
2018). The data period mainly covered the period of January 2017 to December 2019, where big price fluctuations were experienced in bitcoin. Moreover, both volatilities and returns were analyzed to be able to see if any differences exist in their dynamics. The results suggested that although connectedness in volatilities was mostly driven by medium frequency, in returns, it was driven by high frequency throughout most of the period. However, the period towards December 2018 was different from the rest of the period since the drop of bitcoin price to
$3500 affected investor expectations and, therefore, created a long-term instability for a while. Furthermore, the results of within connectedness with contemporaneous correlation for both volatilities and returns suggested that contemporaneous correlations do not bias connectedness results. Moreover, the percentage of connectedness between volatilities was much higher and almost doubled the connectedness in returns. Finally, in terms of the overall connectedness, the results suggested that the connectedness was higher when volatilities were higher.
Overall, total connectedness results are useful for examining the increasing connectedness between bitcoin, gold, and crude oil in the periods where the volatilities have increased. However, it is not enough for investors to examine only total connectedness for diversification purposes. Investors also need to know the persistence of the connectedness between them. On the one hand, the results regarding the return connectedness suggested that the market processes the information related to price changes rapidly. On the other hand, the volatility results suggested that the system’s shocks are also transmitted to the longer-term, namely, the medium-term, which ranges from 5 to 20 days. Therefore, analysis of the returns alone may be misleading for investors in terms of diversification since diversification is more difficult only in the short-term since connectedness is much higher. The analysis of volatilities suggested that the effect of connectedness also exists in the medium-term, and investors should diversify their portfolios when considering this information. Furthermore, the period towards December 2018 and afterward was different from the rest of the period in terms of connectedness dynamics. In conclusion, when all the results are taken into consideration altogether, it can be concluded that for investors, diversification by using bitcoin, gold, and crude oil is not optimal in the short-run and medium-run, especially when there is a volatility increase. However, investors may gain from diversification in the long-run since connectedness among these assets is limited. Moreover, investors should also be careful since the dynamics of connectedness may be different for different shocks. The results suggest that a significant drop in the bitcoin price has different effects than a period of high price rises and normalization back to the previous price.
Although the results provide some valuable information in terms of the connectedness between bitcoin, gold, and crude oil, it may be useful to analyze other periods and compare the results with the findings in this study. An extended analysis will help us to see whether if these results are specific to the periods used or if they may be generalized. Furthermore, investors should keep in mind that the dynamics in the financial markets may change even if we can generalize this study’s findings since financial markets are affected by many factors.


