Article

Bottlenecks to Financial Development, Financial Inclusion, and Microfinance: A Case Study of Mauritania

by
Mohamedou Bouasria
1,*,
Arvind Ashta
2 and
Zaka Ratsimalahelo
1
1
CRESE EA 3190, Université Bourgogne Franche-Comté, F-25000 Besançon, France
2
CEREN EA 7477, Burgundy School of Business, Université Bourgogne Franche-Comté, F-25000 Besançon, France
*
Author to whom correspondence should be addressed.
J. Risk Financial Manag. 2020, 13(10), 239; https://doi.org/10.3390/jrfm13100239
Submission received: 3 September 2020 / Revised: 8 October 2020 / Accepted: 8 October 2020 / Published: 13 October 2020
(This article belongs to the Special Issue Banking and the Economy)

Abstract

:
The objective of the study was to enhance our knowledge on institutional bottlenecks for financial development, financial inclusion, and microfinance, using Mauritania as a case study. We used a mixed-methods’ methodology that combines analysis of secondary data and an expert interview. First, a logit model with dummy independent variables was used to investigate the factors that impact the households’ access to credit, the main advantage of this model being to avoid confounding effects by analyzing the association of all variables together. Our study found that access to financial services is equal in Mauritania between men and women, but that access to credit is higher for public sector employees, educated people, and households with smaller families. Second, using principal components’ analysis, we found that the different regions of Mauritania can be divided based on unemployment, income, literacy, financial inclusion, and population density into two main dimensions, yielding four quadrants: Attractive, industrious, moderate, and resource cursed. We expected that sparsely populated countries would have less access to credit. Counterintuitively, we found that within a low-density country, people in the lowest-density regions have higher odds of getting credit. Third, based on an interview with an expert, we noted the key challenges that microfinance is facing in Mauritania and provided recommendations to overcome these. As in most case studies, external validity was limited.

Graphical Abstract

1. Introduction

According to the World Bank (2019), resource-cursed countries like Mauritania need to strike the right balance between investment and consumption across the key sectors such as physical and human capital and across the country’s different income groups. In this study, we were concerned with the poorest of these income groups and researched if they can develop their investment and consumption through microfinance and financial inclusion. Indeed, microfinance has spread all over the world, but in some poor countries, like Mauritania, it has not. According to the Central Bank of Mauritania (CBM 2018), the big microfinance institutions (CBM) seem to be collapsing in Mauritania while elsewhere in the world they are profitable and becoming banks. Therefore, studying the case of Mauritania was interesting to discover the institutional lessons we can take from this failure. Our study found that Mauritania faces numerous challenges: A sparsely populated country, where the existing informal sector suffices for most people; loans are mostly short term and do not build on infrastructure; microfinance institutions (MFIs) insist on collateral, which poor people do not have; refinancing is not available at reasonable interest rates; high interest rates charged by MFIs crowd out projects; fragmentation of the market with too many MFIs; and, overall, a lack of data that keeps public policy makers and researchers from making more-detailed analysis and recommendations.
The present-day notion of microcredit originated in the 1970s, in developing countries like Indonesia, India, Bangladesh, and Bolivia (Robinson 2001). This financial innovation provides access to financial services to low-income people and helps them start an income-generation activity. Later, this diversified to other financial services and became known as microfinance, including other dimensions such as checking accounts, savings, and insurance. The goal of microfinance is to give to the poorest access to financial services.
Nowadays, we can find MFIs everywhere, even in developed countries. In 1997, according to the Microcredit Summit Campaign, there were only 618 institutions in the world giving access to financial services to more 13 million people (Awimbo et al. 1999). By 2012, there were around 3700 MFIs reporting to the Microcredit Summit Campaign, indicating an outreach to 204 million people, of which 116 million were very poor (Reed et al. 2014). The increase in clients’ access was impressive, even without taking into account that many small MFIs do not report to the Microcredit Summit Campaign. Even though the potential for growth in most microfinance markets is vast, financial exclusion remains widespread.
The term financial inclusion refers to the delivery of financial products and services at affordable costs to all sections of the population. Financial inclusion has been embraced as a crucial development goal by global as well as national-level policymakers because of its positive impact on economic indicators. Empirical evidence at the macroeconomic level shows that financial inclusion is not only positively correlated with employment and growth but also causally impacts growth (Cull et al. 2014; Paşalı 2013). However, empirical evidence at the microeconomic level on indicators like self-employment, household consumption, women empowerment, and wellbeing is mixed (Angelucci et al. 2013): Some literature suggests a positive impact (Attanasio et al. 2014; Cull et al. 2014) while most researchers have found no significant impact (Banerjee et al. 2015; Duvendack et al. 2011). The International Monetary Fund (IMF 2013) postulated the ‘Universal Financial Access Goal’, which strives to achieve a world where everyone will have access to formal financial services by 2020. Nevertheless, about 2 billion adults across the globe, i.e., 38% of adults in the world, do not have access to basic financial services (World Bank 2014).
If so much importance is being provided to microcredit, why are some countries finding it so difficult to spread this innovation? To answer this research question, we examined the case of Mauritania. The objective of the study was to enhance our knowledge on institutional bottlenecks for financial development, financial inclusion, and microfinance, using Mauritania as a case study. Since little is known about financial development in Mauritania, this was an exploratory research. We were looking for causes for lack of financial development, financial inclusion, and growth of microfinance without any a priori hypothesis. We would expect, though, that low population density, low urban infrastructure, lack of education, and extreme poverty may be possible causes.
We used a mix-methods’ methodology that combines analysis of secondary data and an expert interview. First, a logit model with dummy independent variables was used to investigate the factors that impact the households’ access to credit, the main advantage of this model being to avoid confounding effects by analyzing the association of all variables together. Second, using principal components’ analysis, we analyzed the regional differences in regions of microfinance in Mauritania. Third, based on an interview with an expert, we noted the key challenges that microfinance is facing in Mauritania and provided recommendations to overcome these. As in most case studies, external validity was limited.
Our study found that access to financial services is equal in Mauritania between men and women, which is significantly different from South Asia where mostly women get credit. Secondly, we found that public sector employees get access to credit more than others. Third, being educated makes a big difference in order to get loans. Fourth, small families of three to five are able to get loans more easily. Therefore, it may not be the poorest who are getting access to credit in Mauritania. Finally, as opposed to previous research that shows that high-density countries get more credit and low-density countries like Mauritania have low access to credit, our study found it surprising that within a low-density country, people in the lowest-density regions have higher odds of getting credit despite a lower number of MFIs.
After a brief literature review and a description of our research methodology, we first provide a socio-economic and financial context to this country since all initiatives are related to their context. Then, we present our findings on access to credit in Mauritania and evolution of financial inclusion and of microfinance. Finally, we discuss the reasons why microcredit may have been less successful in Mauritania, its uneven geographic dispersion, and the policy lessons associated.

2. Literature Review

There are over 200 research papers in microfinance every year (Ashta 2013, 2020) and an absence of any on Mauritania is, therefore, disturbing. There are a large number of literature reviews on microfinance (Duvendack and Mader 2019; Gutiérrez-Nieto and Serrano-Cinca 2019; Hermes and Hudon 2018; Milana and Ashta 2012; Van Rooyen et al. 2012) and these bring out many themes of interest to researchers. In this exploratory research, we were looking at why access to microfinance did not evolve in Mauritania and, so, we focus on two elements in this literature review: First, the history of the evolution of microfinance, especially in neighboring regions, and, second, a few stylized themes such as poverty and education that should be correlated to microfinance.

2.1. A Brief Review on History/Evolution of Microfinance

At the end of the 1970s and the beginning of the 1980s, many initiatives of microloans came out (Robinson 2001). The most renowned example was in Bangladesh with the creation of the famous Grameen Bank by Muhammad Yunus (1976) and the Association for Social Advancement (Islam et al.) in 1978. BRAC (Bangladesh Rural Advancement Committee), created in 1972, started credit operations in 1986. Many other developing countries replicated these types of microcredit initiatives. However, even before the appearance of such institutions, the ‘non-bankable’ people were not entirely strapped of financing possibilities and had other means to finance their activities. The family, the close relations, friends, the usurers, the tontine, and other associations of credit and savings provided solutions for people excluded from the formal financial system (Lange et al. 2007; Tsai 2004). However, with the evolution of microcredit in the developing countries, the households excluded from the formal financial system have more access to alternatives to save and borrow (Islam et al. 2015). The poor tend to combine all these sources of funding (Collins et al. 2010).
Microfinance is considered semi-formal, between the formal and the informal financial system. Some research has taken examples of all three: For example, a bank in Bolivia, a cooperative in Thailand, and a microfinance institution in Kenya (Mutua et al. 1996). Among the informal systems quoted above would be the tontines, or rotating savings and credit association (ROSCA), and the semi-formal would include credit unions (also called savings and credit cooperatives).
However, ROSCAs present certain disadvantages. Indeed, even if the membership is completely free and each group can have its own rules, they are inflexible to the needs (unforeseen) of their members. Another disadvantage is the fact that the funds are limited to the contribution of the community and that they do not make it possible to mobilize external funds that may be necessary to escape the vicious circle of poverty (Armendàriz and Morduch 2010).
The cooperatives present also certain disadvantages: Human resource management is generally poorer in cooperatives than in other MFIs (Hudon 2010), it is difficult to diversify the risks because often the members exert the same trade, and, beyond the limits of the community, their growth is difficult.
In spite of their respective disadvantages, these two models present interesting mechanisms such as the auto-selection of the members and the monitoring by peers. These features were imitated and adapted by many MFIs (particularly the Grameen method of group-based lending and the village banks created by FINCA (Foundation for International Community Assistance), Pro Mujer, and Freedom from Hunger). Many scholars are suggesting applying lessons on governance from cooperatives to microfinance (Allemand et al. 2013; Mavrenko 2011) and to go back to the original cooperative model to further develop credit unions in Africa (Périlleux 2013).
The evolution of microfinance has been reviewed by institutional studies and is considered to be built on different cultures in different parts of the world (Ambec and Treich 2007; Bisrat et al. 2012). In countries such as Togo a strong spirit of cooperation in the face of isolation from the world by blockages led to cooperative-based savings and lending institutions (Ashta et al. 2016). The Indian experiment was based on trying to copy the best practices of the rest of the world and yet have a large group size based on the huge population of the country (Parekh and Ashta 2018). However, the cooperative model was not so successful in India. These studies show that international trends and local institutional arrangements and institutional logics are all important to explain the evolution of microfinance in any country. Our research question was why institutional factors in Mauritania have not produced a similar evolution of microfinance and financial inclusion despite being more open to the world than Togo. For this, we examined different economic and financial institutions existing formally and informally in Mauritania.

2.2. Basic Themes of Microcredit and Hypothesis Development

The literature reviews indicate that a large number of papers focus on poverty, regional issues (urban/rural), gender, age, size and composition of households, education, employment, and sector of activity. We should, therefore, have expected that financial services in Mauritania would respect global trends. We were interested in the determinants of basic access to credit that some feel should be a human right (Hudon 2009). A basic question that can be asked is whether Mauritanians who are poor are having access to financial services such as credit.
Access to credit may be a useful tool of women empowerment (Garikipati 2012; Hansen et al. 2020; Johnson 2005) and there is a basic consideration that 75% to 80% of microcredit is provided to women (Maes and Reed 2012; Reed et al. 2015). Yet this world view is largely influenced by the large share of microcredit in South Asia where over 80% of loans are provided to women (Maes and Reed 2012). However, when investigating access to credit in South Asia, Hewa Wellalage and Locke (2017) found that enterprises owned by female entrepreneurs are on average only 3% less likely to be credit constrained compared to their male counterparts. However, Khoi et al. (2013) did not find that gender influences access to credit in Vietnam. The proportion of microcredit to women in Africa is lower but still close to 66% (Maes and Reed 2012).
Hypothesis 1 (H1):
Women have more access to credit than men.
Credit alone is insufficient to increase productivity and complementary human capital is essential (Armendàriz and Morduch 2010). There is some evidence that more educated entrepreneurs get more access to credit (Mottaleb and Sonobe 2013) and we can expect that education will provide greater access to financing (Amendola 2017; Khoi et al. 2013). Essien (2015) found that education has a positive impact on formal access to credit. Furthermore, the analysis done by Assogba et al. (2017) in Benin revealed that access to credit among smallholder farmers is determined by the number of years of schooling and literacy. A recent study done in Ethiopia shows the importance of education as a determinant of access to credit (Waje 2020). However, other studies show that school education may not be related to the survival of an enterprise in poor countries and may lead to less success in terms of profit or size of business or on growth (Elston et al. 2016; Mor et al. 2020).
Hypothesis 2 (H2):
Access to credit may be related to education level.
Also, it is possible that age increases the experience and, therefore, this could also be a source of human capital. Along these lines, the results are mixed since some researchers find that age increases business survival (Coleman et al. 2013; Mor et al. 2020) and others do not find this (Hansen and Rand 2014). For access to credit, Essien (2015) finds that in Nigeria, age has a positive impact on both formal and informal access to credit. In Ethiopia, Waje (2020) finds that age is one of the determinants of access to credit. Furthermore, there might be positive relation of age with semi-formal microcredit, a negative relation with informal credit, and no relation with formal credit (Khoi et al. 2013).
Hypothesis 3 (H3):
Access to credit will increase with age.
The spread of microcredit may be higher in Asia than in Africa, owing to the high population density of countries such as Bangladesh in Asia (Hulme and Moore 2006). It may also be higher in urban areas than in rural areas since the cost of traveling may be lower in dense, urban neighborhoods (Vanroose 2008). However, there is some evidence indicating a lower probability of access to credit in urban areas (Khoi et al. 2013). Indeed, the results from the study done by Lyons et al. (2017) suggest that those living in more urbanized areas and megacities are less likely to demand bank and nonbank loans in China.
Hypothesis 4 (H4):
Access to credit is linked to population density and urbanization.
One main difficulty expressed by developing nations is that large, growing populations eat into economic growth. Therefore, household size may be an indicator of poverty. Some research indicates that household size does not impact access to credit (Amendola 2017; Khoi et al. 2013). However, other research indicates that there may be some relationship with household size but not to the number of children in the household (Koloma and Alia 2014).
Hypothesis 5 (H5):
Access to credit is not related to household size and composition.
The philosophy of microcredit has been that it is supposed to help people to start enterprises. Some sectors of entrepreneurship may be requiring greater access to credit because of working capital or investment needs. For example, rice farming, level of skills, or having agricultural land may influence access to credit (Khoi et al. 2013). Yet a large part of the credit may be consumer credit, going to people who have stable jobs. Access to credit may be linked to the sector of the activity. Microfinance may be primarily working capital loans in trade. In a study in Spain, some industries have a higher survival rate for startups, but the industries were different for men and women (Cabrer-Borrás and Belda 2018). In a study on survival of enterprises in India, manufacturing sector activities were found to have a higher rate of survival (Mor et al. 2020) and should, therefore, have more access to credit.
Hypothesis 6 (H6):
The nature and sector of activity influences the level of credit.

3. Research Methodology and Case Study Description

To answer our research question, we studied the financial system of our case study (Mauritania) at three levels: (1) At the level of the financial system and access to credit, (2) the evolution of financial inclusion, and (3) the evolution of microfinance. Case study research was useful when we were trying to study one participant in rich detail, to answer questions of processes (Yin and Heald 1975), rather than a group, for which we were looking to study relationships. They also provide good building blocks to grounded theory building (Eisenhardt 1989). Country and regional case studies have been extensively used in microfinance (Khoi et al. 2013; Phan et al. 2014).

3.1. Research Data

Compared to other countries, very little information is available on Mauritania and we had to combine different databases to get information. The secondary data for the first part of the study was obtained from the Survey of Household Living Conditions (EPCV 2014) implemented by the National Statistics Office (Office National de la Statistique, ONS) for 2014. The survey is the result of a partnership between the ONS, the Ministry of Economic Development, the World Bank, and Afristat. For consumer lending, we had data for 2014 with a sample of 9557 people indicating their access to credit and some demographic and geographical variables. The descriptive statistics are available in Table A1.
The second set of data that was used for financial inclusion came from the Global Financial Inclusion Database (Findex) (Demirgüç-Kunt et al. 2018). For microfinance, we obtained data from the Ministry of Employment, Professional Training, and Information and Communication Technologies (Ministère de l’Emploi, de la Formation Professionnelle et des Technologies de l’Information et de la Communication, MEFPTIC) for 2014, from the Central Bank of Mauritania (CBM 2018), and from the National Statistics Office (Office National de la Statistique, ONS) (RGPH 2013).
We examined secondary sources such as press and websites to get a more detailed understanding of microfinance and financial inclusion in Mauritania. To triangulate the results, we also conducted a 63-minute semi-structured interview with the Director of Microfinance Promotion and Professional Insertion at the MEFPTIC. The interview was based on open-ended questions such as “Can you describe the history of microfinance of Mauritania?”, “What have been the reasons for its growth?”, “What are the bottlenecks and challenges?” and “What do you expect for the future?” The interview was recorded and notes were taken during the interview.

3.2. Research Model

In order to have an adequate policy of microfinance institutions to help those excluded from banking systems, we believe it is essential to have a household indicator that can access microcredit. This indicator is the probability of households accessing credit.
We assumed a nonlinear probability model. Thus, we considered the following dichotomous model:
p i = P ( y i = 1 / x i ) = F ( x i β ) for   i = 1 , , n
where p i is the probability of accessing credit and y i is dichotomous dependent variables
y i = { 1 i f h o u s e h o l d a c c e s s t o c r e d i t 0 i f n o t
where x i is the vector of independent variables, β is the vector of unknown parameters, and F ( x i β ) is the cumulative distribution.
We explain how to choose an appropriate function of the cumulative distribution F ( . ) in our model where the independent variables are all dummies (see Table 1). A dummy variable is just a variable that will assume value one if subject presents the specified category and zero otherwise.
The functional forms of F ( . ) most frequently used in application are the probit and logit models. The probability functions used for the probit and logit models are the standard normal distribution function and the logistic distribution function, respectively. Both of these distributions have the familiar bell shape of symmetric distributions. The probit and logit models generally give relatively similar results. There are, however, some differences (Amemiya 1981):
(1) The logistic distribution tends to attribute to “extreme” events a greater probability than the normal distribution, and
(2) The logit model facilitates the interpretation of the parameters β (regression coefficient) associated with the independent variable x i .
Beyond these differences, there are indeed some properties of the logit model that are particularly useful for simplifying calculations as well as the economic interpretation of the estimation results of the parameter β associated with the explanatory variables. The logit model can be interpreted in terms of odds and odds’ ratios. For these reasons, the logit model corresponded better to our study where the independent variables are all dummies, and its principal advantage is to avoid confounding effects by analyzing the association of all variables together.
Let F ( . ) be the cumulative distribution of the logistic
F ( x i β ) = e j = 1 k x i j β j 1 + e j = 1 k x i j β j
Researchers (Liao 1994; Amemiya 1981, 1985; Agresti 2002; Greene 2012) vary in their preferences of how to discuss the effects of the independent variables from logit analyses. The most common approaches have relied on interpreting odds and odds’ ratios. The different methods of interpreting logit results can be transformed into one another.
According to Amemiya (1985) and Liao (1994), the logit model is convenient for a presentation of results in terms of effects of x i on odds of the outcome y i = 1 :
o d d s ( y i = 1 / x i ) = P ( y i = 1 / x i ) P ( y i = 0 / x i )
which can be written by
o d d s ( y i = 1 / x i ) = p i 1 p i = e j = 1 k x i j β j
The odds represent the ratio of the probability ( p i ) associated with the event y i = 1 to the probability ( 1 p i ) of non-occurrence of this event that is y i = 0 . For the purpose of interpretation, the odds, Equation (4), are transformed into a log form. So, the log of the odds’ equation is
ln ( p i 1 p i ) = j = 1 k x i j β j = β 1 + x i 2 β 2 + x i 3 β 3 + + x i k β k
This equation is quite similar to multiple linear regression with the exception that the dependent variable is a log(odds), where p i indicates the probability of accessing credit, β j is the regression coefficients associated with reference group, and the x i j for j = 1 , , k is the independent variables. In our model, the independent variables are all dummies. The reference group, represented by β 1 , is constituted by those individuals presenting the reference level of each and every variable x i j for j = 2 , , k .
For a continuous independent variable, its instantaneous effect on the odds of being in a particular category of the dependent variable can be identified by obtaining the first-order partial derivative. However, derivatives cannot be computed with respect to dummy independent variables because they are defined only for use with continuous variables.
The coefficients of Equation (5) are generally interpreted with respect to odds’ ratio. The odds’ ratio (OR) is defined as the ratio between odds (Agresti 2002; Amemiya 1985)
O R = o d d s ( y i = 1 / x i + 1 ) o d d s ( y i = 1 / x i ) = e β j for j = 2 , , k
The OR tells us how the odds of observing y i = 1 change when x i changes by one unit. For dummy coefficients, a unit difference in x i is the difference between membership category x i and membership in the omitted category. In this case, e β j is the OR for those in the membership category versus those in the omitted category. A large OR can represent a small probability and vice versa. If the exponential of the coefficient is greater than 1, that is e β j = O R 1 , the variable j increases the odds of observing y i = 1 . It means that there are strong odds of getting it associated with that variable. However, if e β j = O R 1 , then the variable j decreases the odds of observing y i = 1 . This way of presenting results is particularly convenient for dummy explanatory variables. Table 1 shows that living in a rural area significantly reduces the odds of accessing credit. We were interested in the dummy variable (rural-urban) and we wanted to know if the factors that explain access to credit are identical or not for both urban and rural areas. In order to estimate the probability of the outcome and the odds’ ratio, we needed the maximum likelihood estimate of the regression coefficient β and some realization of independent variables x i chosen by us. We proceeded as follows.
First, we estimated the complete model (rural-urban) with the constant term, and the coefficients associated with the intercept (the constant) and the medium are significant. This means that the community plays a role in access to credit. There is a difference between rural and urban areas. We could have stopped there in our study. However, we deepened our study by trying to determine the factors that explain access to credit in the case of rural areas and in the case of urban areas. To do it, we estimated the rural model only and then the urban model only.

4. Case Description: Background to Financial System in Mauritania

The Mauritanian financial system is composed of 14 commercial banks, two specialized financial institutions, 17 insurance companies, 112 registered MFIs, and more than 145 informal MFIs and government programs. Even though the development of the financial system for the past 15 years was impressive, it only covers 22.9% of the population, according to the Global Financial Inclusion Database (Demirgüç-Kunt et al. 2018). Data for 2014 from the ONS indicate that access to credit was only 6.93% in urban areas and 1.32% in rural areas, as shown in Figure 1. The figure also shows that some people may have a bank account but access to credit is denied.
Commercial banks in Mauritania are largely absent from small cities and towns inside the country. The new strategy of the commercial banks is to cover the entire territory of the nation by carrying out heavy investments in equipment and human resources. However, this new service offering does not target the micro-projects; it is, rather, directed toward companies, tradespeople, and civil servants, with a particular focus on housing finance and trade.
Since 2009, foreign banks such as Societe Generale have started coming to Mauritania. However, despite the recent opening of the national market to foreign banks, the financial offer remains insufficient to cover the domestic market demand. Banks are very cautious when looking into low-income clients desiring microcredit, owing to prudential regulations.
The banking system controls about 88% of the financial system assets and collects a gross domestic saving estimated at 20% of the gross domestic product (GDP). These savings represent 90% of the total savings in the “formal” financial system. The majority of short-term deposits come from public agencies. The deposits of individuals and firms remain relatively weak and represent only 35% of total deposits. This disproportion provides confirmation that banks are only slightly mobilizing savings of the private sector (firms and households). Furthermore, credits for the private sector represent only 25% of the gross domestic product (GDP) (the average is 66% for sub-Saharan Africa). Only 21% of the population has an account, which is low even compared to 42% for sub-Saharan Africa (Demirgüç-Kunt et al. 2018). The number of loans for 1000 inhabitants is 54.8, which is 27% below the median for low-income countries.
The access and cost of bank financing are perceived as the main barriers to the firms’ growth in Mauritania. Lack of collateral is the main reason for loan rejection. Loans that are granted increase with the size of the borrowing firm and are larger in the manufacturing sector (BCM 2015). Almost all loans are backed by guarantees that are substantial and represent, on average, 172% of the loan. The challenges of obtaining collateral underscores the problem of accessing credit: The register of commerce where they must be listed is not operational and the land titles can only be obtained by passing through government entities (BCM 2015).
Banks intervene generally for short-term financing of the firms, especially in international trade, fishing, and manufacturing. The interest rates are usually high: On average 18% nominal interest rate is charged.
Although there are 14 commercial banks, eight of them are only subsidiaries of commercial and industrial groups, resulting in a banking system that is strongly segmented and characterized by very limited competition. These banks deal mainly with members of the group and firms who do not belong to any group have difficulties accessing financial services. All these challenges are inflating the financial exclusion phenomenon.

5. Findings

5.1. Access to Credit in Mauritania

As stated earlier, we have data for 2014 with a sample of 9557 people indicating their access to credit and some demographic and geographical variables. An analysis of the odds of accessing credit provided the results shown in Table 1. The results in columns (2), (4), and (6) show that some common factors and some different factors explain the access to credit in urban and rural environments. We tested for multicollinearity, as shown in Table A2.
In Mauritania there is no significant difference between men and women for the odds of accessing credit nor is there any difference by being the head of the household. Therefore, Hypothesis 1 is not accepted since gender is not significant. It is often considered that microfinance is for the excluded and we should have expected that unemployed people, those on welfare, or inactive people would have higher odds of getting credit. However, we found that the only significant difference is that public sector employees have higher odds of access to credit, suggesting that consumer credit is a big part of the total loans being given. This is true for both urban and rural populations. Therefore, hypothesis 6 is accepted to a very small extent since the nature and sector of activity does not seem to influence access to credit.
Normally, we expect that education will provide greater access to financing (Hypothesis 2), so we compared illiterate people with different levels of education with respect to access to credit. We found that literacy alone does not make a difference except in rural areas. All other educational levels significantly increase the odds of getting access to credit. However, we found some curious results when we looked at rural and urban areas. In rural areas, literacy significantly increases the odds of getting credit but primary education is not significant. In urban areas, secondary technical education does not make a difference as compared to illiterate people for access to credit. Traditional education is not different from illiteracy for access to credit. Medium-size households (3 to 5 members) seem to have a higher chance of getting credit compared to single people or couples. However, as the number of members of the household increases further, the odds become the same as for single people or couples. The number of children is not significant, which confirms the results of Amendola (2017) and validates our Hypothesis 5. However, in our study, the age did not make any difference, contradicting the results of Amendola (2017) who found that older people get more credit. Therefore, our Hypothesis 3 is not accepted.
Normally, we expect greater access to credit in densely populated areas (Hypothesis 4). So, we compared the most populated region, Hodh Ech Chargui, with less-densely populated areas. Table 2 shows that for four regions of the south with a fairly high density of population the odds of access to credit are not significantly different from Hodh Ech Chargui at 5%, for both rural and urban areas. As expected, Nouakchott, which is the densely populated capital, has significantly more access to credit. However, counterintuitively, we found that all the other regions have significantly higher odds of getting credit than Hodh Ech Chargui. This means that less-densely populated areas are getting more credit. This may be because of pockets of extremely dense population areas in these regions. Tiris Zemmour is a low-density region but with big mining areas and that can explain the high odds of getting credit in these areas. Therefore, Hypothesis 4 cannot stand alone.

5.2. The Evolution of Financial Inclusion in Mauritania

Historically, Mauritania is a vast desert inhabited by Bedouins. Each tribe had its way of financing the activities of its members but always according to the Islamic law where usury is forbidden. As a result, in addition to the formal financial system, each category of the population has its own culture, its own social mechanisms, and its own informal finance. For example, the different types of informal finance present in Mauritania include the piyés used by the Fulanis and the «lawha», or blood money, used by the Arabs. However, we did not have enough information on the Harratins’ practices of informal finance.
The piyé is organized by family members to help out one of their members who is facing a financial challenge (marriage, for example). There are different types of piyé. The piyé Lenol is a permanent kitty to help members of the family deal with unforeseen expenses. The piyé jokkere endam is used to reinforce the relationship between two families or clans.
In the Arab culture, they also have a form of informal finance called the «lawha». Traditionally, the lawha was collected to pay the «diya» (blood money) in case of accidental homicide. However, nowadays the lawha is used for marriages, elections, or reimbursing the state in case of misappropriation of public funds.
Tontines and money transfers are the most common informal financial practices in Mauritania. All three communities use these as a way to finance their activities. Tontines’ members are usually from the same neighborhood, social background, or tribe. The agreement between members remains verbal; there are few tontines that have written rules.
The existence of this tribal financial system, the dearth of trust in the administration, and the lack of a stable government may explain why most of the population is excluded from the financial system.
In this section, we will look at the financial inclusion in Mauritania compared to other African countries and the world. Financial inclusion definition by the World Bank is the offering of financial products and services to the whole population of a country (World Bank 2014). This includes products and services offered by the formal financial sector (commercial banks and MFIs) and the informal financial sector (government programs, dealers, tontines, etc.). Even though the informal financial sector has still a large place and is one of the main challenges for the development of mobile banking in Mauritania, the formal sector should slowly but surely be increasing.
In Table 3, we extracted data from the recent FINDEX report (Demirgüç-Kunt et al. 2018). Here, we used the number of accounts as the proxy of the inclusion in the financial system. We were comparing Mauritania to Togo (a West African country that has about the same level of development of Mauritania), India (the developing country with the largest microfinance sector), and France (a developed country that provides a benchmark of what is possible). Developing country averages also provide benchmarks.
By looking at the number of bank accounts, we see that Mauritania has the lowest financial inclusion, with only 21% of its population having an account, compared to the average in the developing world, which is around 63%. Even if we look at a country like Togo, which is an African country, smaller in size than Mauritania and with fewer resources (lower per capita income), it has a better financial inclusion with an average of 45%. Moreover, 22% of those who have a bank account do not use it even once a year and only 7% take a loan from the financial institutions. In Mauritania, only 15% of women have an account. This exclusion of women can be explained by the fact that in the Mauritanian society, men must provide and women do not feel the need to engage in the financial system. Nevertheless, keeping everything in perspective, only 26% of men are included in the financial system.
Looking also at workers’ and nonworkers’ inclusion, we see that only 29% of workers have accounts. The principal reason is that only the government workers must mandatorily have an account, while private-sector workers have a choice of either receiving their salaries in cash or to have an account. However, there is an increase of banking penetration because more and more companies avoid giving cash to their workers and because a worker receiving his wages directly in a bank account is eligible for a loan.
Only 13% of the poorest 40% have an account, which is expected. When only 26% of your population is included, you can expect the poorest to be the most affected.
Often, when we talk about financial inclusion we have in mind the inclusion of the poorest of society. However, in Mauritania, even the rich (primarily in rural areas) are not in the financial system. This means that there are demand-side institutional barriers (norms, culture) that go beyond the supply-side economic barriers (income, guarantees).
The financial inclusion data from Table 4 shows that only 6% of the respondents list religious reasons for not accessing credit. Indeed, in Islam charging interest rates on loans is forbidden. Having a bank account, in itself, is not prohibited. What is not permitted is to take a loan with interest, and this explains the increase in recent years of Islamic products like the Murabaha. Nevertheless, the banking law in Mauritania is not influenced by Islamic tenets and interest rates can be charged. Our interview with the director of microfinance promotion indicated that MFIs charged 20% and obtained refinancing from banks at 14%, leaving them a spread of only 6%. Cooperative networks are probably charging about 17%.
The reasons for not having a bank account are numerous, some voluntary on the demand side and some involuntarily created by supply conditions. In most cases, people justify their exclusion by the fact that they do not have sufficient funds, which is understandable. If you are consuming your entire daily earnings, there is little need to incur transaction costs of going to a distant bank and withdrawing money within banking hours. In Nouakchott, opening a bank account can cost between 2000 Mauritanian Ouguiya (5 euros) to 5000 Mauritanian Ouguiya (12, 5 euros), which can explain that 24% of the respondents find it too expensive for them to have a bank account.
In Mauritania, ATMs are a recent phenomenon and are present only in a few big cities. Placing your money in a bank would automatically convert it into a saving since you cannot withdraw it whenever you feel like it. Moreover, rare are the people who use a credit card to buy and limited are the stores where you can buy with a credit card. All of this makes it rational for someone to only have a bank account when they feel that they have sufficient funds.
According to the director of microfinance promotion in Mauritania, the fact that Mauritania is an Islamic country may also mean that some people may not take microfinance loans and we need to develop Islamic microfinance products as a complementary offering.
In many sub-Saharan African countries, financial inclusion is much higher than in Mauritania because microfinance started much earlier. For example, microfinance started in the 1960s in some of these countries (Ashta et al. 2016; Ouédraogo and Gentil 2008), but in Mauritania the history of microfinance is more recent. Our study is probably the first academic research on this country’s financial inclusion and microfinance.

5.3. The Evolution of Microfinance in Mauritania

5.3.1. Description of the Microfinance Sector

According to the director of microfinance in Mauritania, the evolution of microfinance in Mauritania can be divided into three phases: Experimental (1997–2011), crisis (2012–2016), and renewal (2016 onward).
The microfinance sector in Mauritania is quite young. The first microfinance activity began in 1990, with “association pour le credit à la micro et petite enterprise” (ACMPE) and “initiative pour le développement en Mauritanie (IDM).” These two programs received the green light from the Central Bank to help with employment integration and to assist emigrants who wished to come back.
The first MFI opened in 1997 (Caisses Populaires d’Epargnes et de Credit), because of the first real public policy toward the development of a microfinance sector. In 1998, the first regulation of this sector saw the light. This regulation (008/98) specifies the management procedures of credit and savings’ cooperatives and insurance companies. The last legal regulation was issued in 2007, specifying the control of credit institutions including microfinance establishments, in an optic of improving the legal settings and rules.
Although microfinance started rather late in 1990, the number of MFIs is quite high and estimated at around 142. However, many of these are very small and often they regroup in formal networks or federations. The four largest networks of cooperatives account for 111 members: PROCAPEC (Projet de Gestion des Caisses Populaires d’Épargne et de Crédit) has 51 MFIs, UNMICO (Union Nationale des mutuelles d’investissement de crédit oasien) has 30 MFIs, UNCECEL (Union Nationale des Coopératives d’Épargne et de Crédit pour l’Élevage) has 20 MFIs, and UNCECDM has 10 MFIs (MEFPTIC 2014). Therefore, the other 20 licensees have about 31 members. The most recent information is probably that on the Central Bank of Mauritania’s website, which details 28 networks and 112 MFIS as of 29 July 2018.
The products and services offered by MFIs are restricted to loans, savings, cash transfers, and some Islamic products like the Murabaha.
Nominal interest rates vary from 15% to 24%. In reality, the effective interest yield (which takes into account additional fees applied to credit and the repayment plan) is often higher than the indicated nominal rate. However, such a lack of transparency is found in most countries (Attuel-Mendes and Ashta 2013; Waterfield 2012).
According to the director of microfinance promotion, the number of clients went from 94,000 in 2004 to 364,304 in 2010, which is an increase of almost 300%. However, official data are not readily available. Table 5 provides outreach statistics for three networks and two MFIs. Their total outstanding loans are UM 15.4 billion (about 385 million Euros).
In 2013, the outstanding credit was at 15.4 billion UM, representing 7% of the total net credits of the banking system.

5.3.2. Evolution of the Microfinance Sector

An interesting observation of the director of microfinance in Mauritania was that culture influences microfinance development. Mauritania is a country of Arabs and Bedouins. These people may now have become sedentary but they still owe allegiances to their tribes and villages. The population is only 4 million people and everyone knows everybody. So, there is no risk in lending to people and the repayment rate is high.
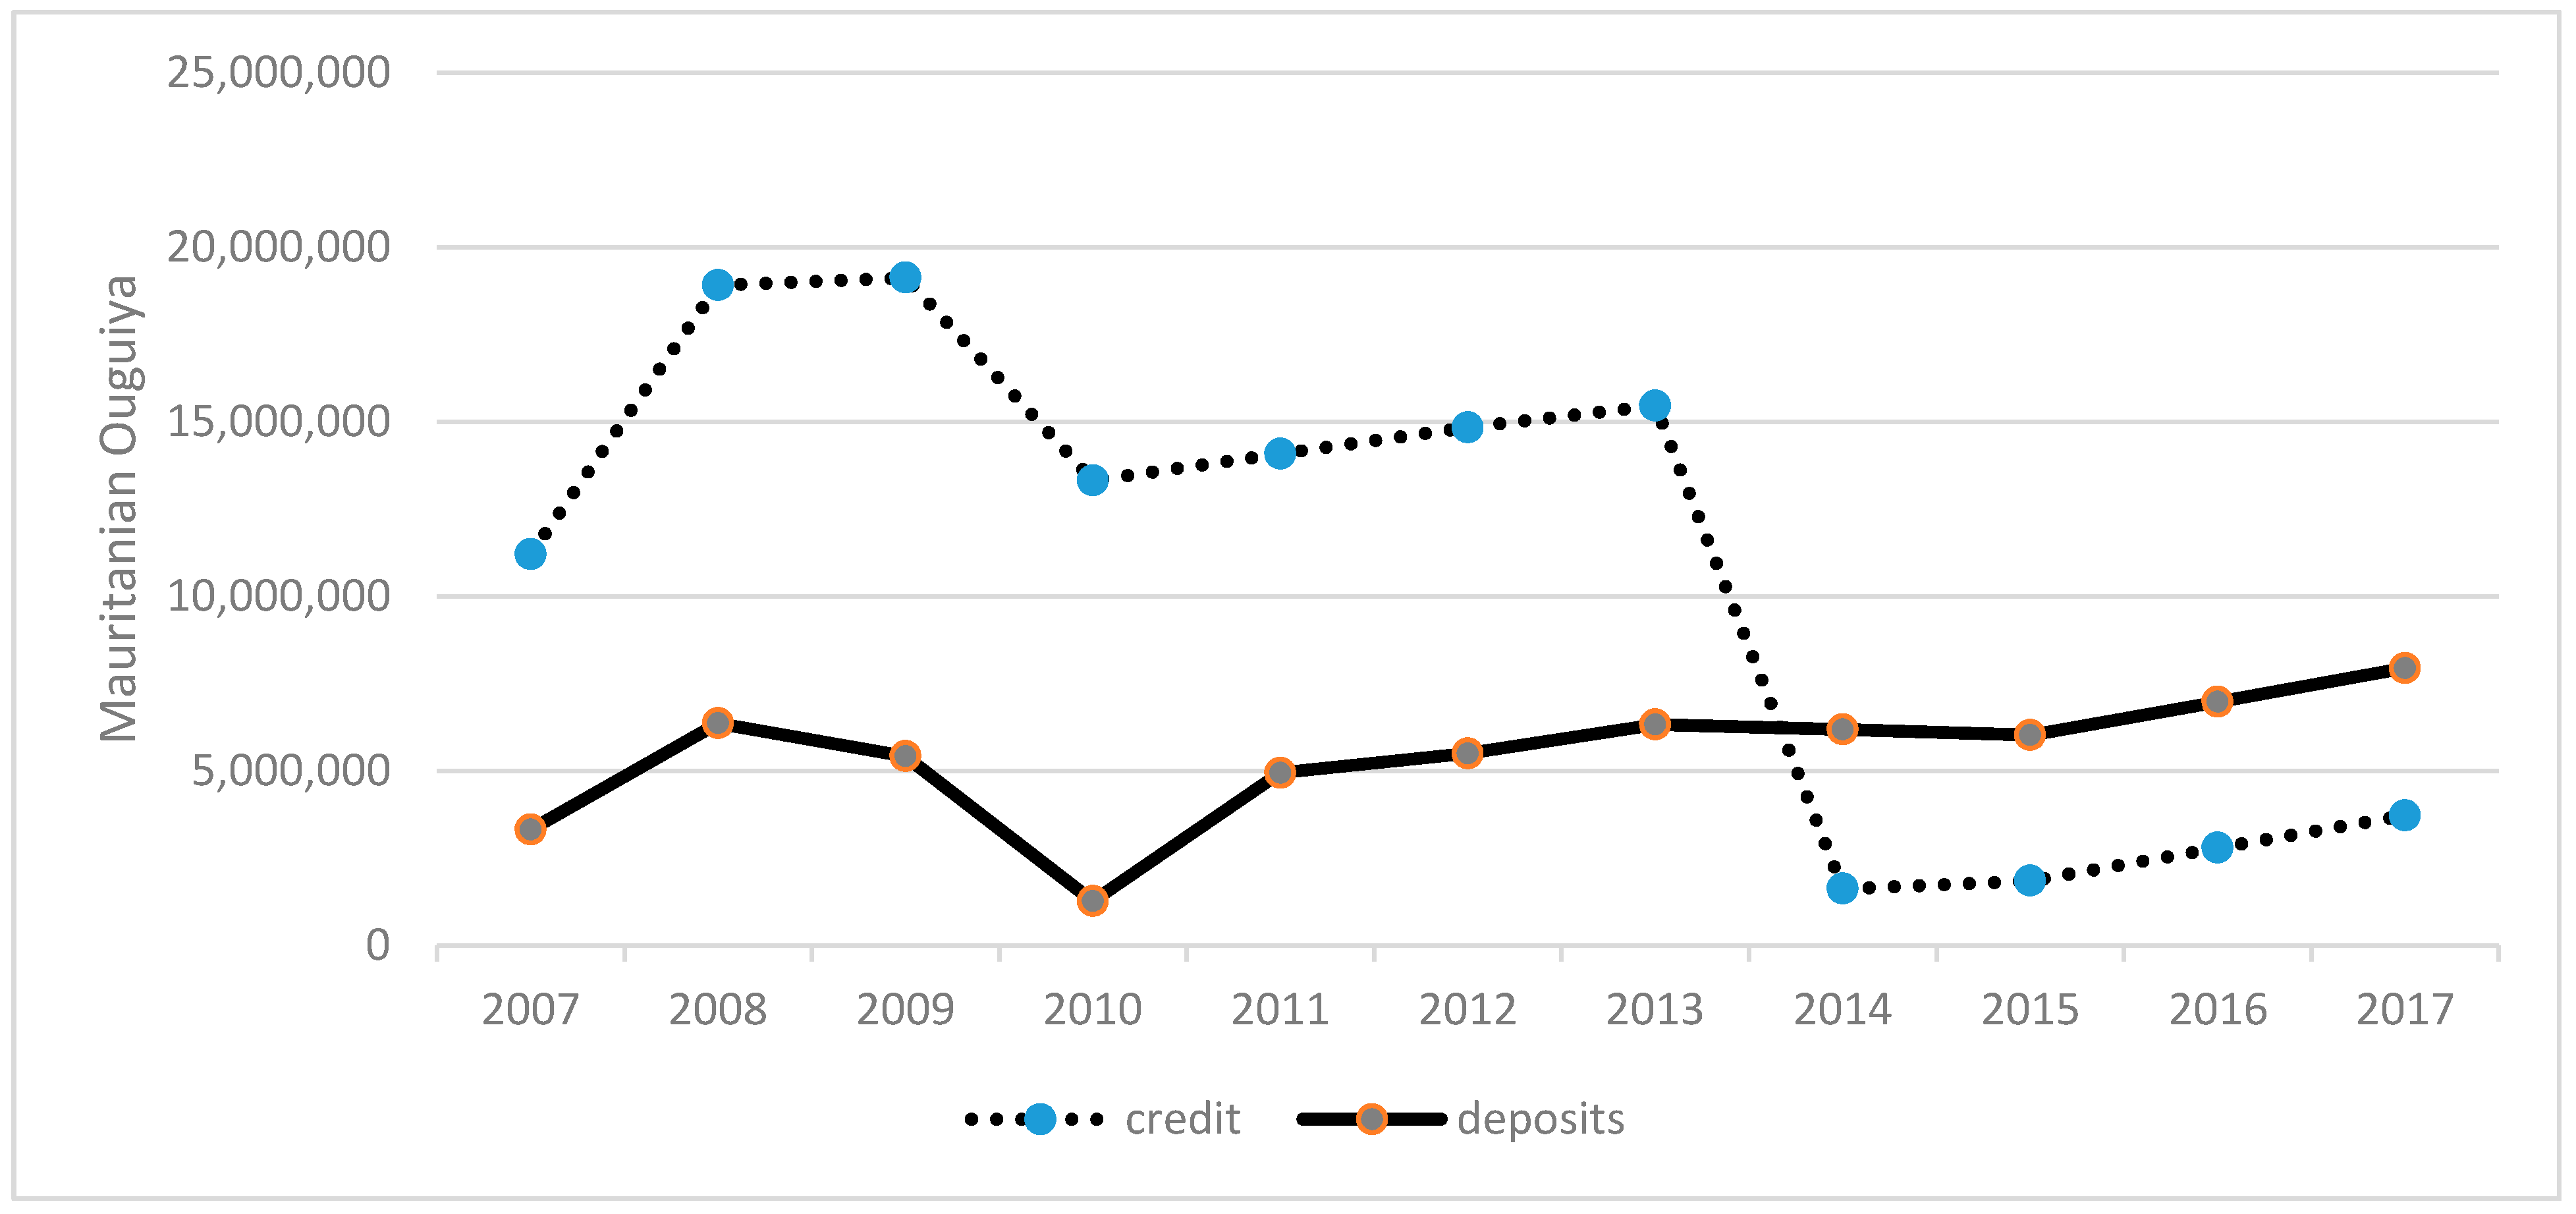
However, until 2012, the microfinance sector was still considered to be in a stage of development and principally based on subsidies and donations. Nevertheless, a major crisis came to the sector in 2014 and lasted for four years until 2017, as can be seen from Figure 2.
This crisis, according to the director of microfinance in Mauritania, originated in the leading cooperative network CAPEC (Caisses Populaires d’Epargnes et de Credit), which had more than 200,000 clients. The principal reason was bad management linked to overstaffing, confirming Hudon (2010), who found that cooperatives tend to be poorly managed. This was coupled with fraud where loans were given to fictive clients to show growth. Evidently, these were not repaid, driving up the nonperforming loans. At the same time, there was also the collapse of UNCACEM (Union Nationale des Caisses Agricoles, de Crédit et d’Épargne de Mauritanie). This institution was mainly providing agricultural loans. So, in bad times, all farmers are affected, and this is, therefore, risky.
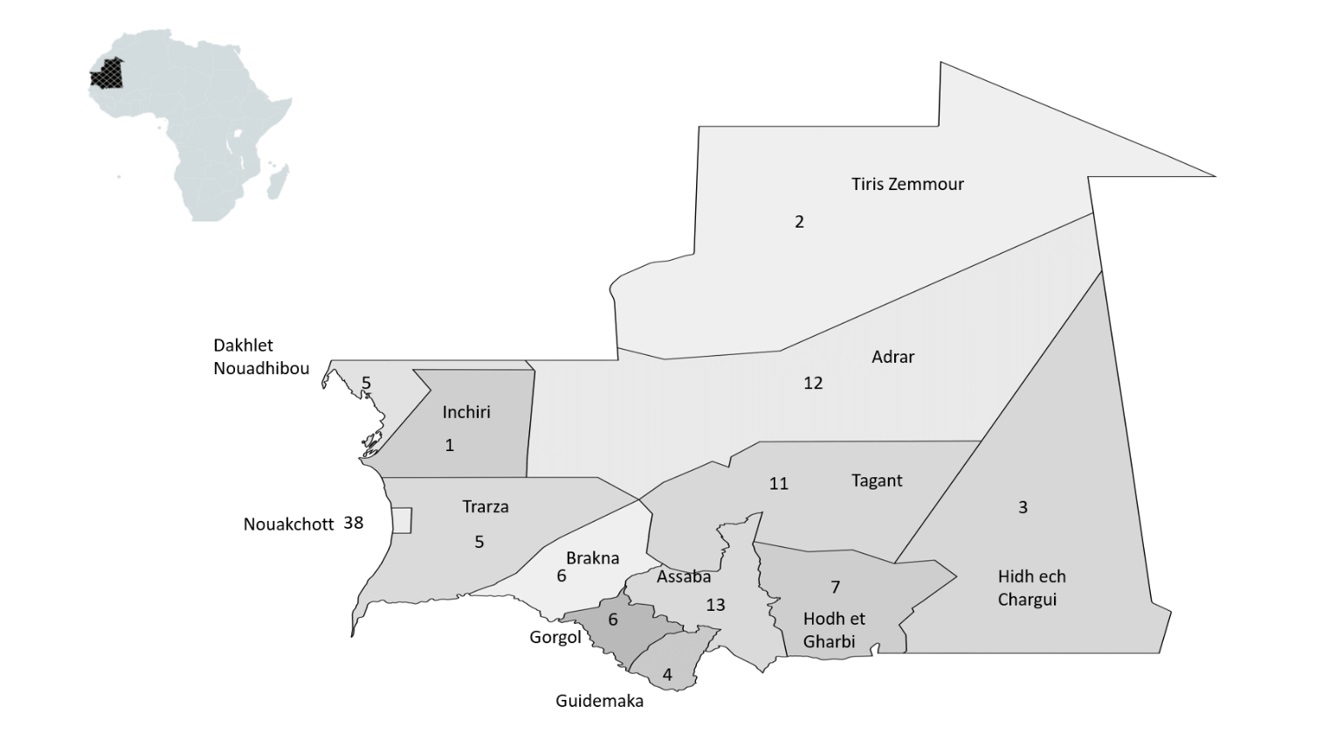
After two years (2014 and 2015), the crisis led to the intervention by the state and a plan for restructuring. A new phase started in 2016 with CAPEC becoming healthy again. The repayment rate rose back to 98%. The number of credit agents was reduced from 1000 to 273. All this helped the financial health of the institution. UNCACEM was replaced by a new institution. Now, the industry is growing year by year, but is spread disproportionately over the whole country, as shown in Figure 3.

5.3.3. Regional Analysis of Microfinance Development

We would expect MFIs to go where access to credit was low due to population density, unemployment, or poverty, and to prefer educated entrepreneurs who would be more likely to be successful. Table A3 provides data on some salient features of the different regions of Mauritania. It confirms that MFIs go to regions with high population density and high unemployment rate. Counterintuitively, in Table 2, we found that people in low-density areas had a higher likelihood of getting credit. This means that the few MFIs that go to low-density areas attract a lot of clients. We note also that Table 2 concerns all credit and not only microfinance. Using the data of 
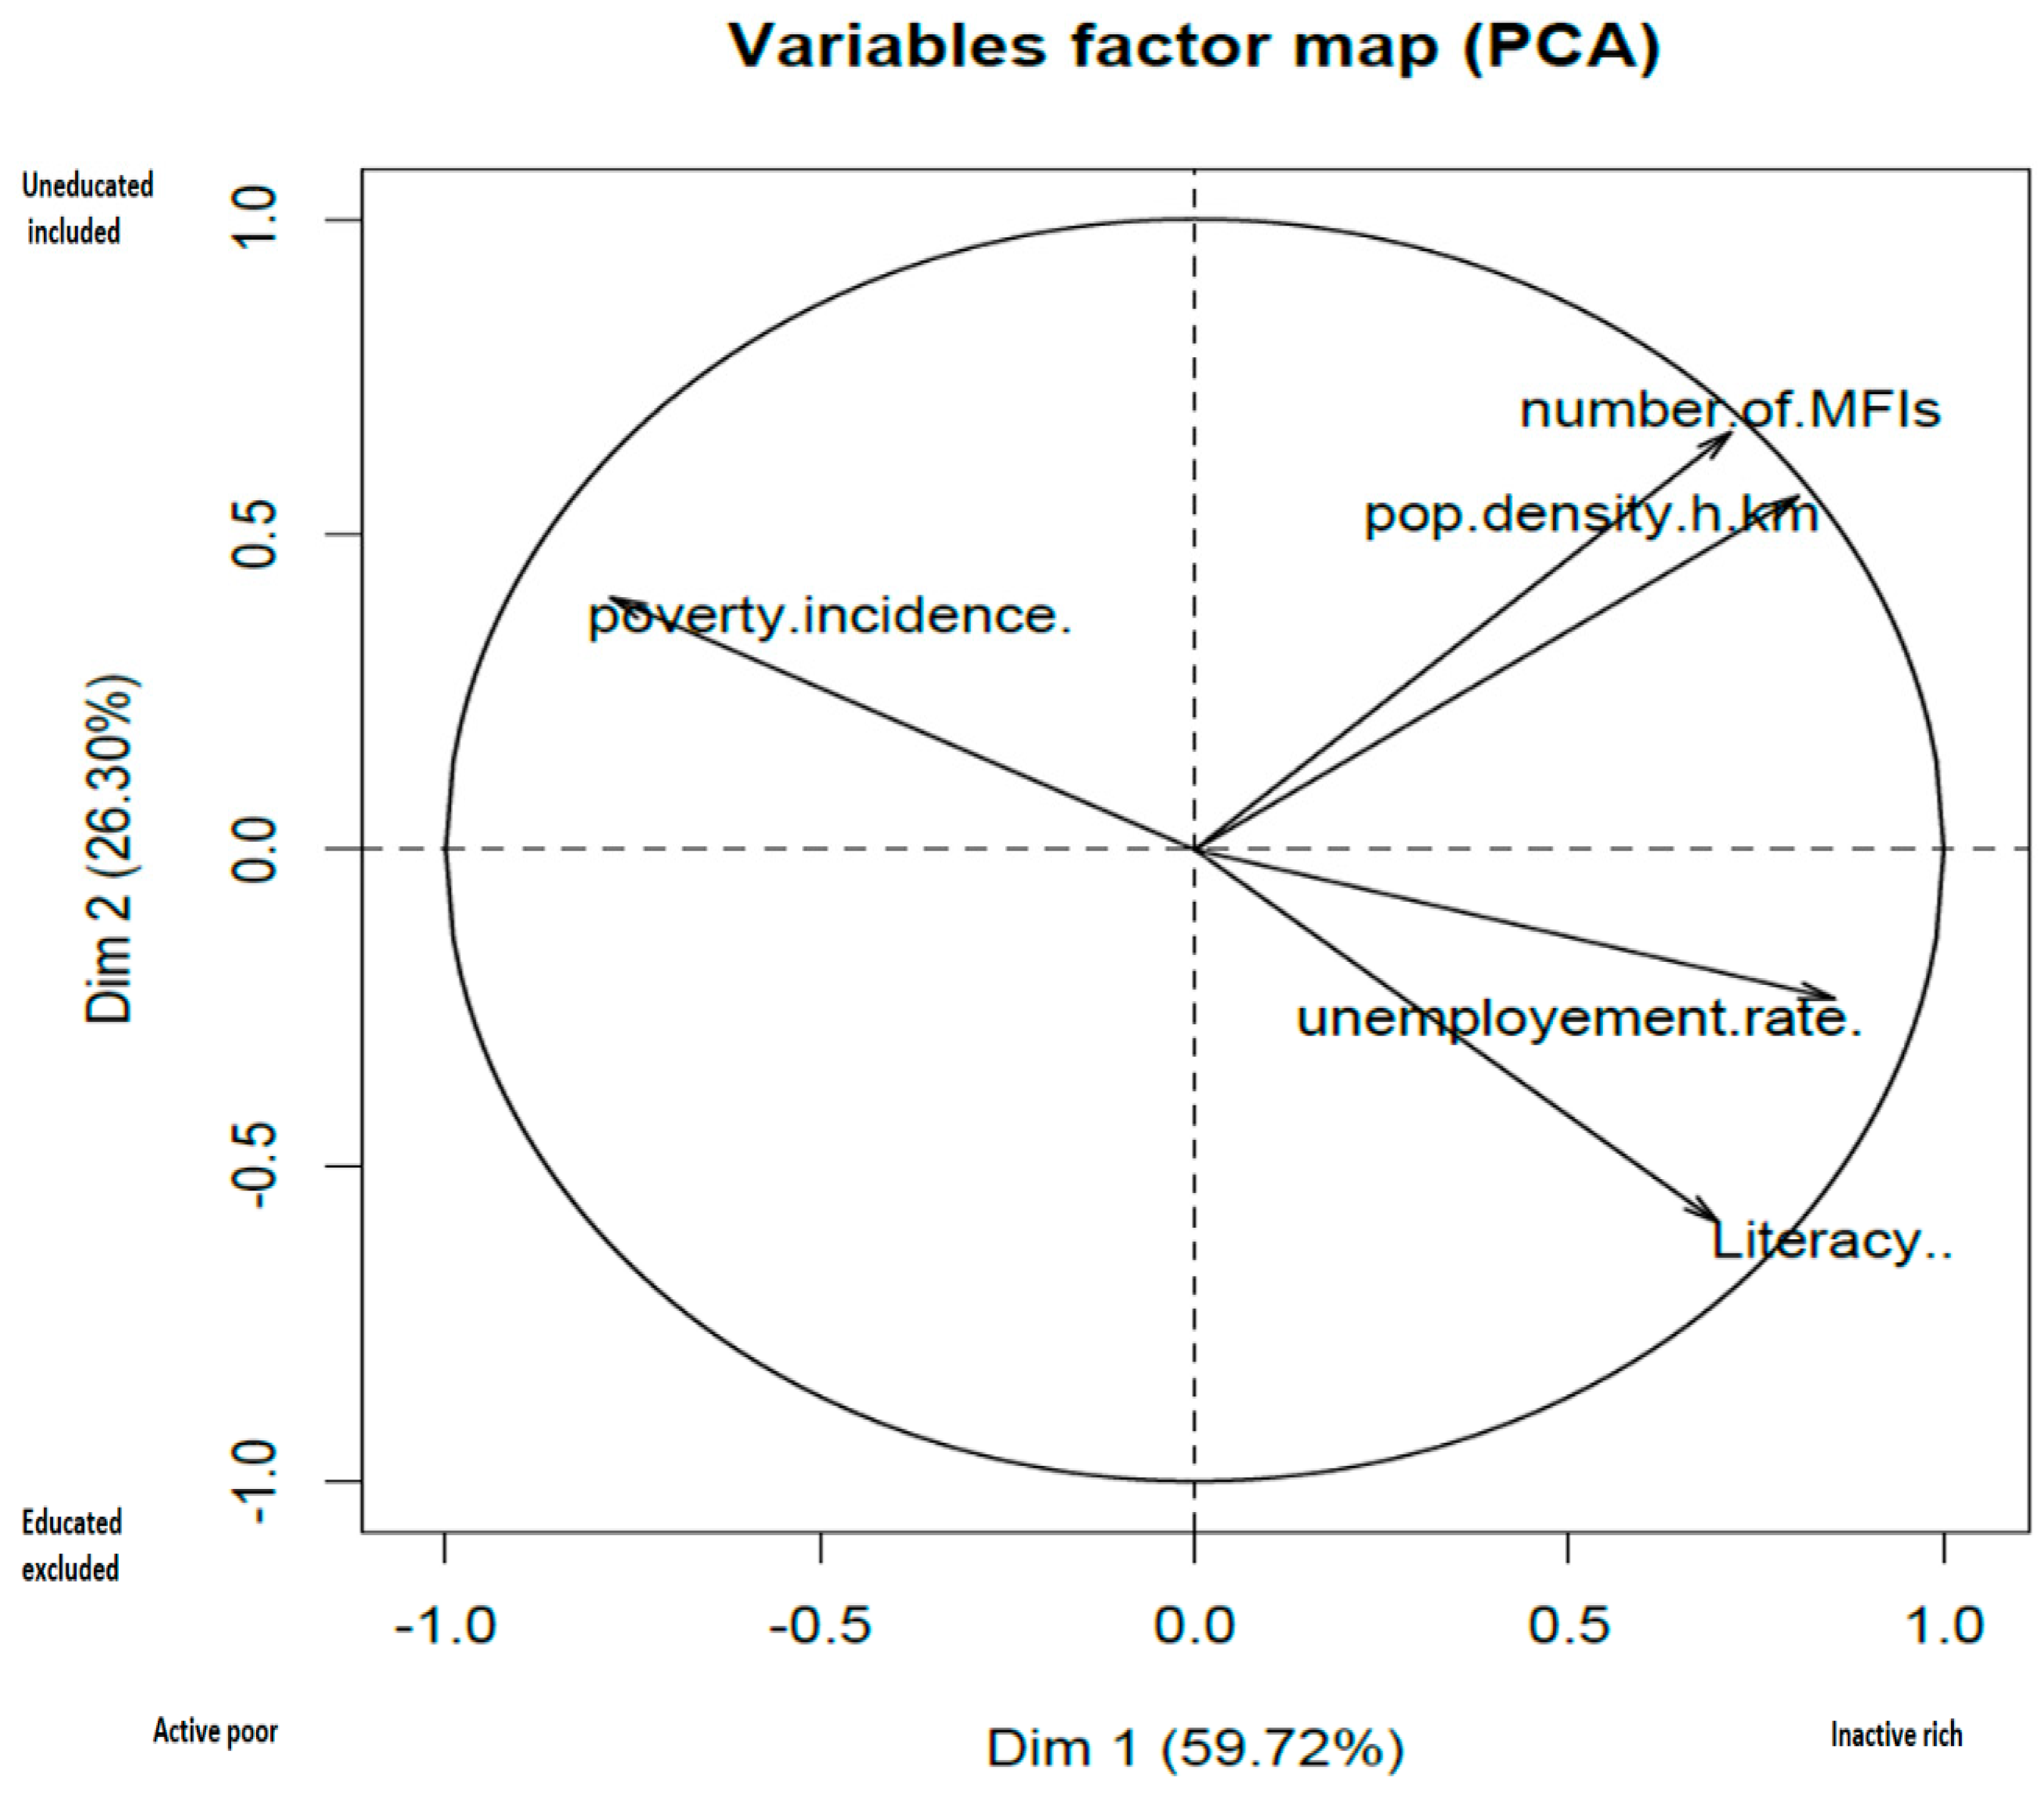
Table A3, we did a principal components’ analysis (PCA) using R software and the results are provided in Figure A1.
PCA allows a large amount of information to be concentrated in a few broad dimensions. It consists of choosing the items that best represent each of the dimensions. PCA is a descriptive multivariate method. It consists of establishing two types of typologies from metric data (Escofier and Pagès 1990; Abdi and Williams 2010):
Typology of individuals in Figure 4 (Are there homogeneous groups of individuals? Which individuals are alike?).
Typology of variables in Figure 5 (Which variables are linked positively/negatively between them?). Another aspect of studying the relationships between variables is to summarize the set of variables by a small number of synthetic variables called principal components.
The PCA provided us with rich insights on how the 13 regions were different. As shown by Figure 3 and Figure 4, we found two principal dimensions that comprise 86.02% of the total inertia. From the 
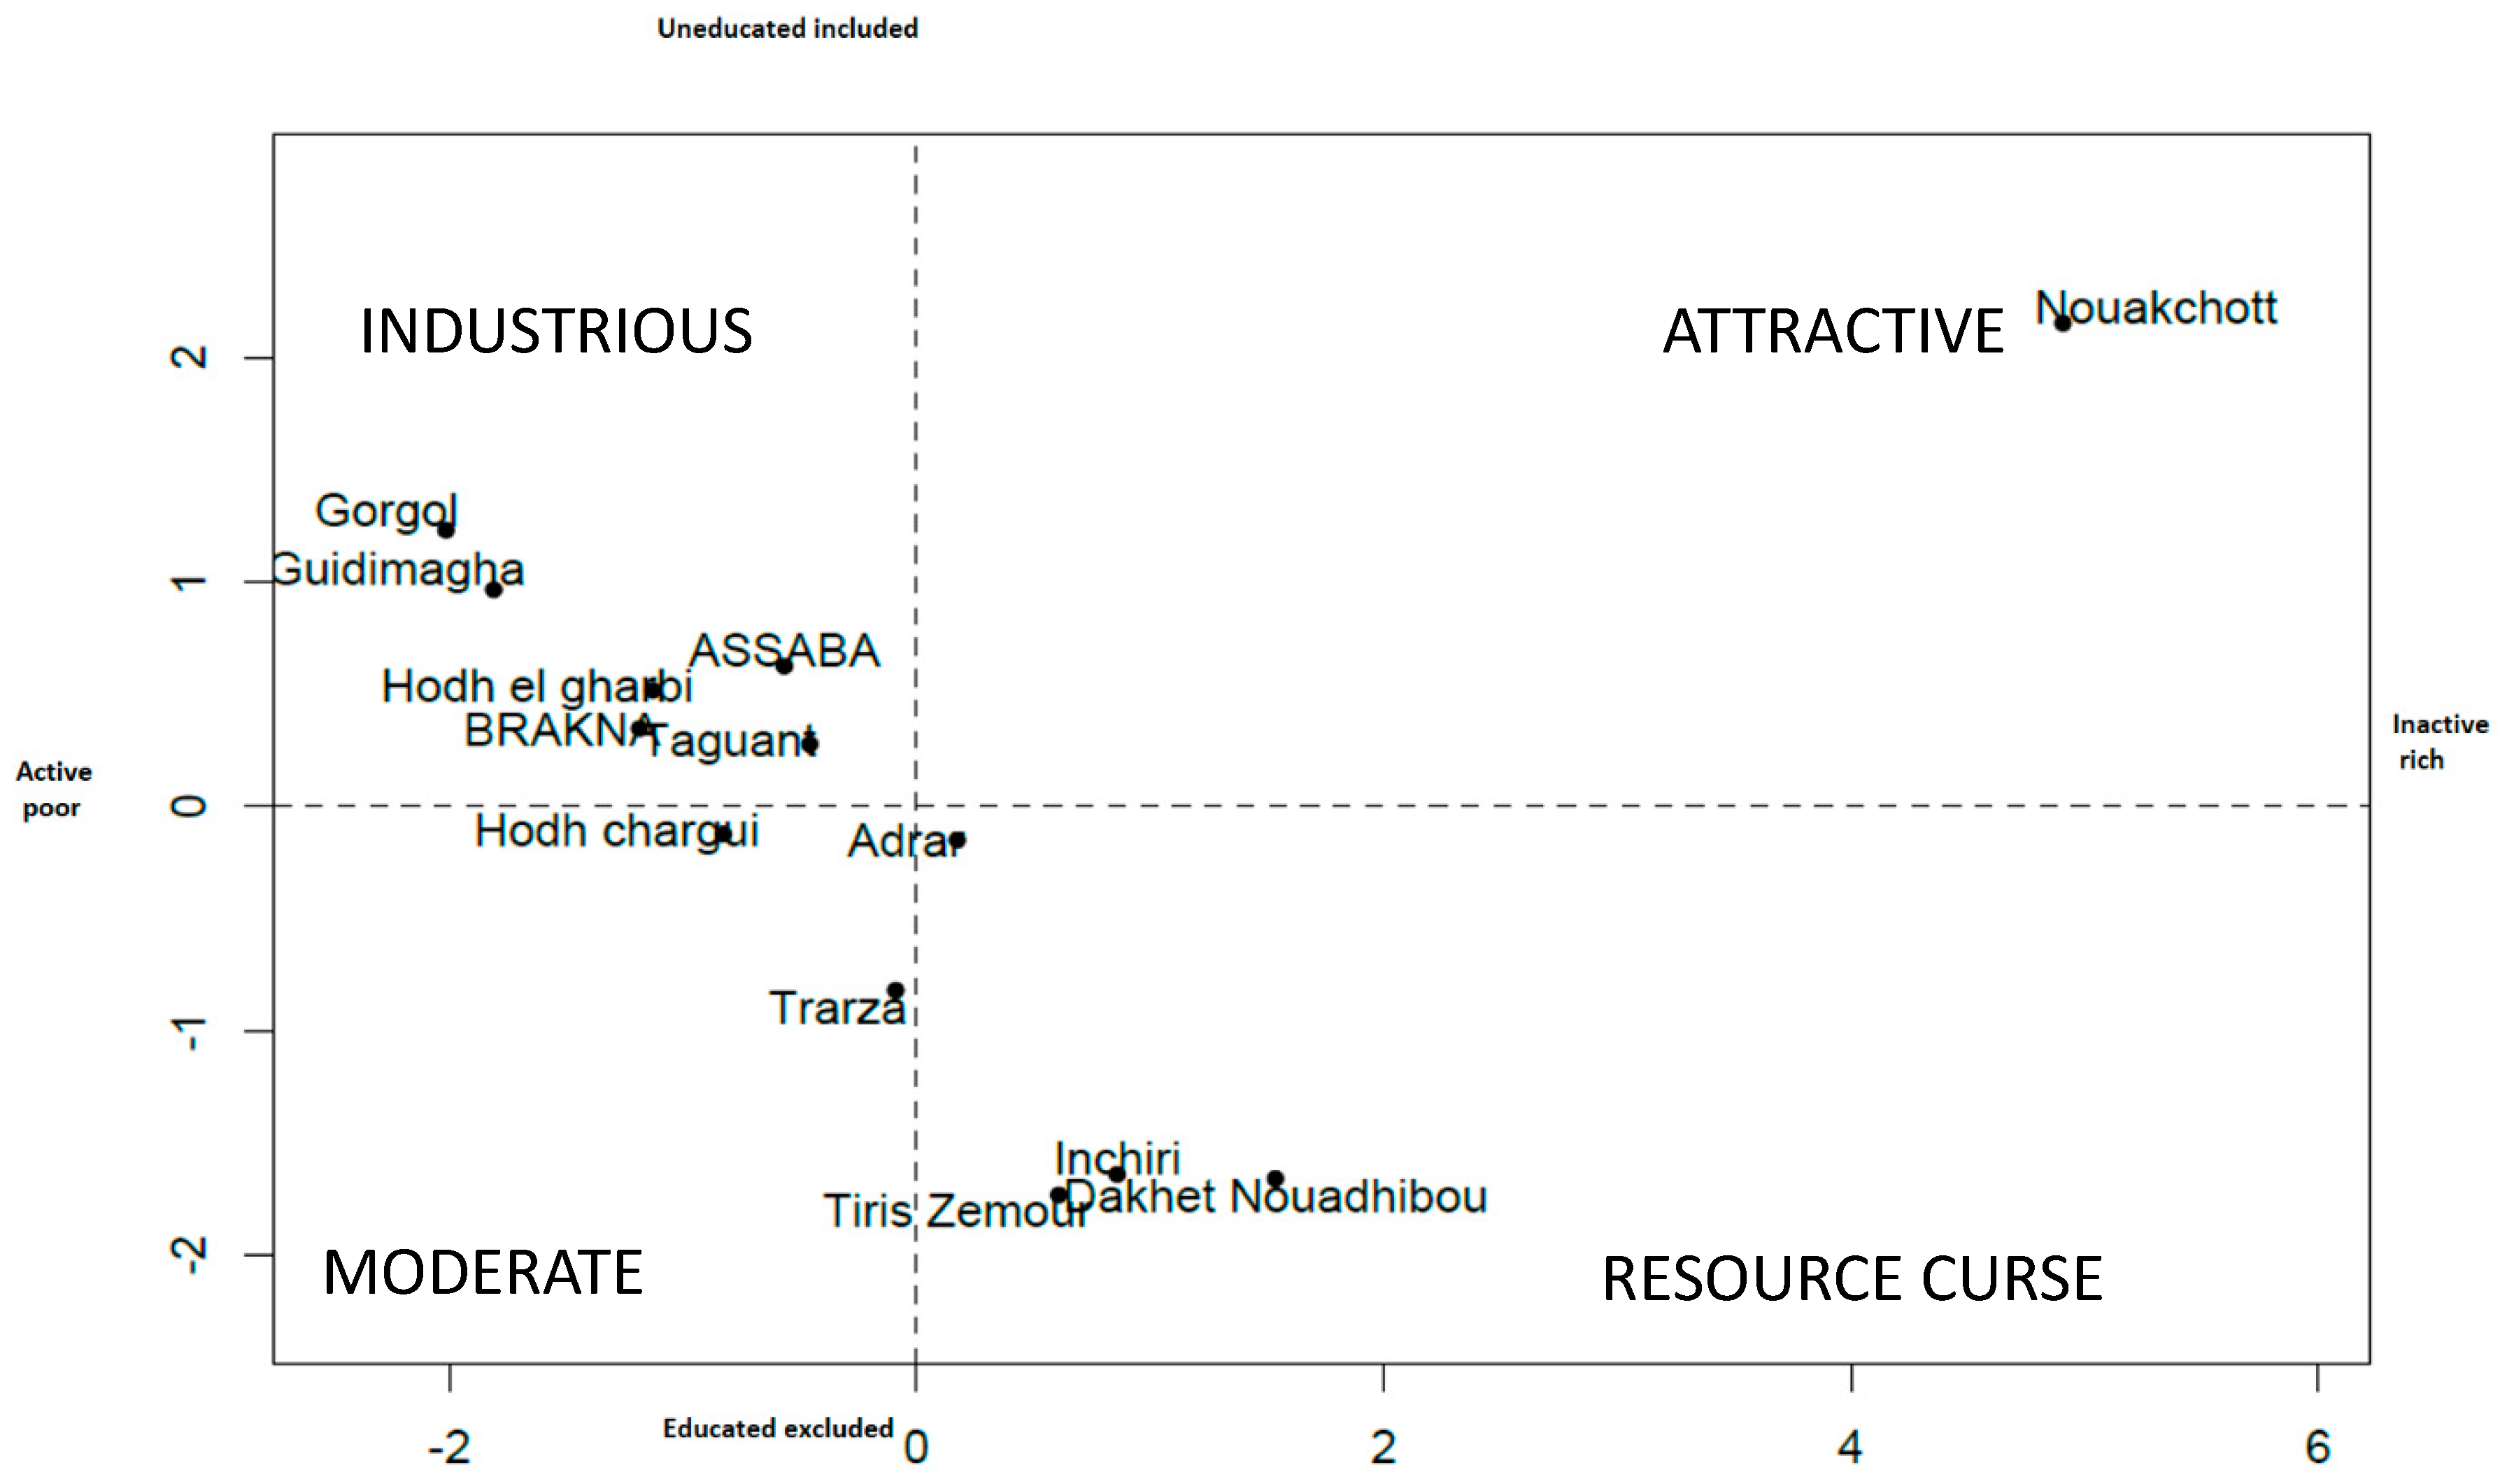
Figure A1, you can see that unemployment rate, high population density, and poverty are highly correlated with the first dimension. We call this dimension “Inactive rich” since most of the regions on this dimension have high unemployment rate and low poverty rate and the negative of this would be “Active poor”, as shown in Figure 4. Again, from Figure A1, we can see that the number of MFIs, literacy, and population density are correlated with the second dimension. In Figure 4, we call this dimension the “Educated excluded” and the negative of this would be “Uneducated included”. Since population density had a high loading in both dimensions, we did not use it in the name of the dimensions.
At one end, we found active poor regions such as Gorgol and Guidimagha, which were uneducated and included (high implementation of MFIs), as shown by Figure 5. More moderate were regions such as Hodh El Gharbi, Brakna, and Tagant, with less employment but more education than Gorgol. Assaba had less active poor and more uneducated included. Tagant has active poor with weak literacy and inclusion. Perhaps we can label this quadrant as INDUSTRIOUS.
On the other extreme, we found three regions with high literacy and exclusion but with more inactive rich (Dakhet Nouadhibou, Inchiri, and Tiris Zemour). This is explained by the resource curse since these are the northern regions with extensive deserts and rich in resources (gold, iron, oil, and gas). Clearly, for a financial inclusion viewpoint, this is the most difficult quadrant since the people do not need small loans. We can call this the RESOURCE CURSE.
There are three regions that seem to be in the active-poor and educated-excluded quadrant, but usually having only one dimension. Trarza has only one dimension: It is low on education and has exclusion. Another region, Hodh Ech Chargui, is only on one dimension: Active poor. We cannot say anything about Adrar. We can say that these regions are MODERATE (these results are based on the PCA analysis in Figure A1).
Finally, we found that Nouakchott was an outlier with a considerable number of MFIs and, thus, high on uneducated included as well as inactive rich. We can call this quadrant ATTRACTIVE because it is attracting illiterate unemployed people because it is the biggest urban center.

5.3.4. Diagnosis: Results of the Qualitative Interview

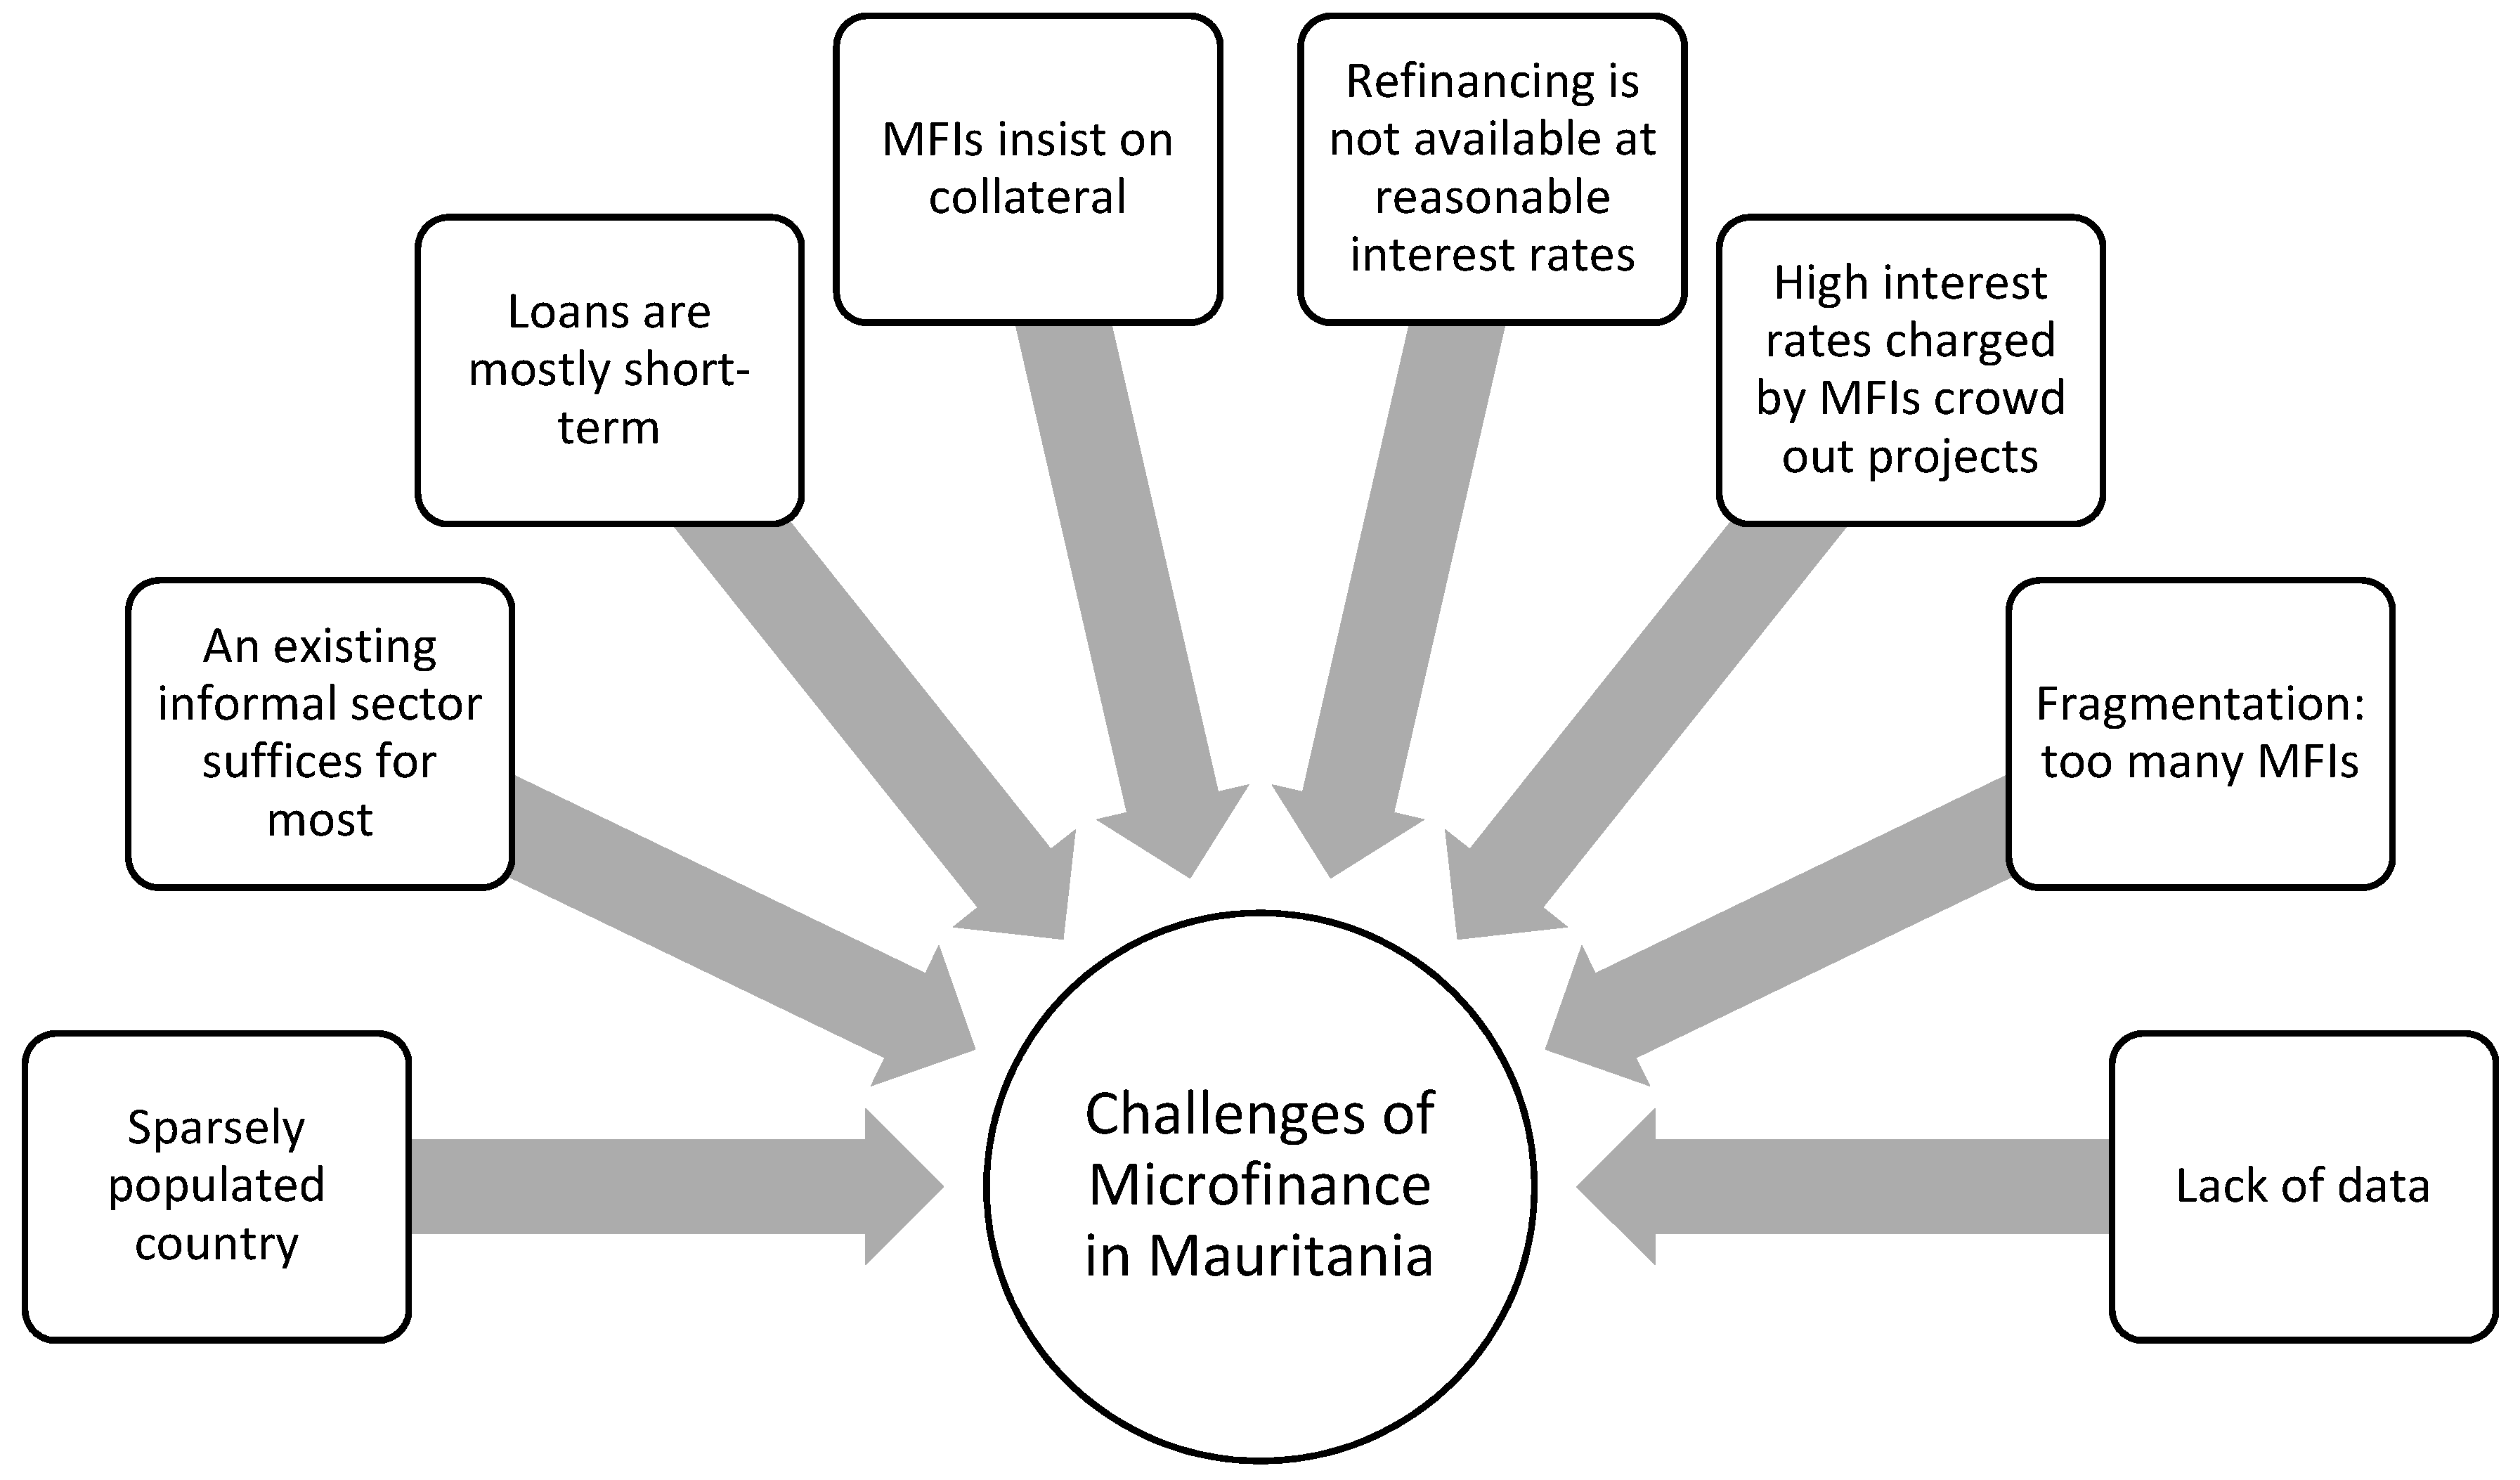
When asked for the key challenges impacting microfinance in Mauritania, the director of microfinance promotion mentioned a number of challenges, which are captured in Figure 6.
The first major challenge is spreading the geographical coverage in a sparsely populated country. This is especially true of the negligible rural coverage.
Second, there is already an informal financial system composed of tributary family financing systems, tontines, usurers, and dealers. This seems to suffice for most people. Indeed, commercial banks have not been able to open up to the marginalized population, as in Cameroon or Togo (Ashta et al. 2016; Messomo Elle 2017).
Third, the majority of loans do not exceed a duration of 12 months, notably because of a lack of long-term financial resources that can allow the MFIs to provide medium-term credits. Mostly, these are business loans for the trade sector. However, some credits have been granted for social needs or consumption purposes.
Fourth, unlike other countries, MFIs in Mauritania ask for collaterals such as blocked savings, pledging (commitment of seizure), and collateral security (joint collateral). For some relatively important loans, MFIs ask for some material surety (jewelry, cars, etc.). This requirement reduces the demand for loans from the poor. However, MFIs justify the need for collateral because repayment rates are only about 95% on averagebut relatively low compared to microfinance in other parts of the world where the norm is closer to 99% (Ashta 2016; Cull et al. 2009; Dowla and Barua 2006).
Fifth, banks intervene to refinance MFIs but they ask for important guarantees that exclude small MFIs. Therefore, young MFIs with a weak level of activity and weak administration are having difficulties in achieving self-sufficiency. As a result, government interventions have been increasing.
The sixth block could be that because of the high interest rates, the demand is lower and a number of useful projects get rationed out.
Seventh, there is fragmentation, owing to a tendency of creating more and more MFIs rather than merging or creating networks. This is a weakness of the sector because new MFIs have difficulties establishing themselves. This is especially because the government gives support to big players, such as PROCAPEC and UNCACEM. Indeed, these two networks have more than 50% of the sectors’ clients, and both are having difficulties. PROCAPEC has been in difficulties for almost 10 years due to bad management, but the government is still trying to redress it. As for UNCACEM, it went bankrupt because of its fragility and its dependence on external subsidies.
Finally, there is a lack of data on this sector, which makes it difficult to do a proper assessment of its performance.

6. Policy Recommendations

Evidently, each of the challenges that we described above should be addressed. We provide a few practical recommendations, aimed at the policy makers, keeping a long-term perspective.
We have seen that more than 50% proclaimed not having sufficient funds and, because of that, they do not see the importance of having a bank account. The first suggestion would be to create more opportunities for the population by providing jobs or business opportunities.
The second suggestion would be to improve the payment system and improve the possibilities of withdrawals in distant areas through ATMs and credit cards. This provides a sense of security, especially in developing countries where crime rates are high. To increase financial inclusion, the public and private sectors should all require their workers to have a bank account, because when workers have regular deposits on their accounts, it makes it easier to obtain a loan from the bank. Based on our empirical results, we found that public sector workers have a higher probability of getting credit. MFIs should be encouraged to lend to private sector employees also. However, these are still likely to be consumer loans and this will not resolve the problem fully since the unemployment rate is high in Mauritania: 31% in 2016. Perhaps the government could provide subsidized financing to banks and MFIs with priority lending targets, as in India.
Thirdly, too much government intervention leads to failure. Indeed, two of the most significant government-funded MFIs in Mauritania have collapsed, namely PROCAPEC and UNCACEM, even though the government is still trying to revive PROCAPEC. Therefore, the objective should be to establish a strategy for the self-sufficiency of MFIs. Unfortunately, sustainable MFIs tend to lend to the not so poor. Therefore, some kind of mix of subsidies and lending to the richer is required to reach the poorest and provide cross-subsidies.
Fourthly, since we found that MFIs tend to give credit to more educated people, a policy recommendation would be to increase literacy and education. At the same time, in the short or medium term, lending to the illiterate should be part of the priority lending targets. Special training may be required for illiterate people.
Fifthly, the results of our study seem to indicate that medium-size households, especially in urban areas, have a higher probability of getting access to credit. MFIs should be encouraged to extend their reach to large families by designing suitable products like education loans or housing extension loans. Population growth is essential to sparsely populated countries.
Sixth, since we found that MFIs tend to focus on dense areas, we need to provide a banking correspondent model that could serve customers in remote areas. This combined with mobile payments could significantly increase outreach.
As opposed to most parts of the world where microfinance was able to reduce the interest rate and absorb a part of the informal finance, as in India or Bangladesh, clearly informal finance, such as tontines or ROSCAs, is more resilient in Mauritania. The formal state-level institutions seem to fail in poor countries when the small population is dispersed over a large geographical area.
In neighboring countries of West Africa, cooperatives MFIs have functioned well. In Mauritania too, cooperatives are the only form of microfinance in all the regions except the capital. Yet in Mauritania, these cooperatives have suffered from poor management. It seems that the cooperative model requires further improvement in a country where education levels are low and, therefore, management capabilities are low. Our recommendation would be for the MFIs to join a network since this is beneficial especially for newborn institutions that still need to establish themselves and can benefit from the experience of other MFIs.
Finally, our institutional analysis showed that international and even national norms and values are difficult to disseminate to a population of Bedouins and tribes that are highly isolated from the rest of the world. The people also need a social system that reinforces the need for economic development:
“Social and economic sustainability requires the creation of a social system that supports the objectives of raising real incomes, raising educational standards, and improving health and the quality of life” (Yue et al. 2019).

7. Conclusions

In this paper, we tried to assess and present the microfinance sector and financial inclusion in a poor and low-population-density country. Mauritania is a relatively new country, with tribal culture, and it is difficult to build a nation around the multitude of tribes. Each tribe has its way of doing things and has low trust in the state administration. As a result, we can understand that only a fourth of the population has a bank account. At the same time, this culture means that tribal and village clan pressure can be used to get high repayment rates. Shame is used to push people to have good behavior, as in other poor countries (Karim 2011), but has not given the same repayment rates in Mauritania as in the rest of the world.
We found credit access is significantly more for public sector employees than other categories. Second, we also confirmed previous research (Amendola 2017; Khoi et al. 2013; Koloma and Alia 2014) that the odds of getting credit increases with the level of education and this difference is significant when compared with illiterate people. We found that medium-size households seem to have significantly higher odds of access to credit compared to single people or couples, confirming the results of Koloma and Alia (2014) that household size is important, but not the results of others (Amendola 2017; Khoi et al. 2013) who found no significant effect of household size. We found that microfinance institutions are more present in high-density areas, confirming previous research (Hulme and Moore 2006; Vanroose 2008), even though the probability of access to credit is higher in low-density areas, as found in other research also (Khoi et al. 2013). Despite global evidence that 80% of microcredit is provided to women (Maes and Reed 2012; Reed et al. 2015), we found that being a woman does not increase the probability of getting credit in Mauritania, similar to the results for Vietnam (Khoi et al. 2013). We did not find that age influences the probability of getting access to credit in Mauritania.
Financial inclusion in Mauritania is among the lowest in the world, with an average of 21% having a bank account, even lower for women. Part of this may be because large parts of the country are desert. Our principal components’ analysis indicated that the regions can be bifurcated along two dimensions grouping five variables: Unemployment, income, literacy, financial inclusion, and population density. The latter was present in both dimensions. It seems that high-income regions attract unemployment, perhaps because of resource curse, and poorer regions have higher employment. Similarly, MFIs seem to go to regions where unemployment and density are higher. However, counterintuitively, we found that the probability of access to credit may be higher in low-density areas.
Many reasons were listed to explain the lack of growth of microfinance, and the prominent one was the lack of geographical reach of MFIs. Indeed, MFIs in Mauritania are located in major, dense cities, meaning that the poor in small villages and rural areas are not reached by microfinance. Moreover, the existing MFIs are not well managed and are facing challenges. Finding a good strategy and an optimal combination between self-sufficiency and outreach would be the solution for the development of the microfinance sector.
For the moment, we are not aware of any impact study on microfinance in Mauritania. As a result, we do not know if the existing initiative has led to any improvement justifying further development work. This would be an area for future research.

Author Contributions

Conceptualization, M.B. and A.A.; Data curation, M.B.; Formal analysis, M.B.; Methodology, M.B.; Supervision, A.A. and Z.R.; Writing—original draft, M.B.; Writing—review & editing, A.A. and Z.R. All authors have read and agreed to the published version of the manuscript.

Funding

This research was partially funded by Banque Populaire and by Conseil Régional de Bourgogne Franche Comté.

Acknowledgments

The authors would like to thank the encouragement received from Alex Zhang and the efforts of the four reviewers to help us with this publication.

Conflicts of Interest

The authors declare no conflict of interest.

Appendix A

Table A1. Descriptive statistics of the EPCV (2014) survey of 9557 respondents.
VariablesDescription Percentage.Poverty
SexGender of the individual, 1 if Man and 0 if WomanMen: 68.26%Men: 22%
Women: 31.74%Women: 20%
num_childrenThis variable describes the number of children for each surveilled individual No children: 53.53%No children: 14%
One or Two Children: 41%One or Two Children: 27%
Three or four children: 4.27%Three or four children: 52%
Five or more: 0.42%Five or more: 88%
Size_HHThe number of people living under one roofHH with 1 or 2 people: 11.06%HH with 1 or 2 people:4%
HH with 3 to five people: 41.18%HH with 3 to five people: 11%
HH with 6 to 8 people: 33.59%HH with 6 to 8 people:28%
HH with 9 to 12 people: 11.84%HH with 9 to 12 people:46%
HH with 13 or more: 2.33%HH with 13 or more: 70%
Head_HH1 if the individual is the head of the household, 0 otherwiseHead of HH: 86.18%Head of HH: 21%
Not the head of the HH: 13.82%Not the head of the HH: 22%
socioeco_group7 categories: welfare, unemployed, inactive, independent nonagricultural, independent agricultural, private sector employee, public sector employeePeople on welfare: 8.71%People on welfare:25%
Unemployed: 0.93%Unemployed: 27%
Inactive: 26.44%Inactive: 22%
Independent nonagricultural: 33.57%independent nonagricultural: 20%
independent agricultural: 8.98%independent agricultural: 35%
private sector employee: 10.01%private sector employee: 20%
public sector employee: 9.36%public sector employee: 7%
educThis variable describes the education level of an individual.Illiterate: 56.55%Illiterate: 27%
Literate: 0.18%Literate: 29%
Primary school: 10.99%Primary school: 17%
Secondary school: 11.09%Secondary school: 8%
secondary technical: secondary
0.40%technical: 8%
superior education: 4.31%superior education: 4%
traditional educational: 16.02%traditional educational: 17%
No response: 0.48%No response: 20%
AgeThis variable describes the age of the individual. It has 4 categories, young for people from the age of 0 to 25, adults for 26 to 40, middle age for 41 to 55 and old for 56 and more.Young: 2.72%Young: 14%%
Adults: 27.31%Adults: 19%
Middle age: 37.03%Middle age: 22%
Old: 32.14%Old: 24%
Milieu This variable describes the area in which the individual lives. 1 for Urban area and 2 for Rural area.Urban: 54.94%Urban: 11%%
Rural:45.06%Rural:34%
Source: EPCV (2014).
Table A2. Multicollinearity test.
Variable VIF1/VIF
Milieu1.250.799032
Age
1–251.130.885477
26–401.650.605175
41–551.580.633602
Size_HH
1 to 25.150.194322
3 to 511.100.986345
6 to 810.250.097552
9 to 125.340.187221
educ1
Literate 1.00 0.995478
Primary 1.01 0.986345
Second1.17 0.853945
Sectech 1.30 0.768670
Sup educ1.02 0.982350
Trad educ1.34 0.746685
No resp1.10 0.912193
socioeco_g~p
Welfare 1.54 0.649580
Unemplo1.30 0.770623
Inactive 1.04 0.962498
Ind noag 2.25 0.444263
Ind ag 1.63 0.613162
Priv sec 1.98 0.504957
Gender1.56 0.642912
Mean VIF 2.58
Table A3. Regional dispersion of selected indicators for Mauritania.
RegionsNumber of MFIsPoverty Incidence %pop Density h/kmUnemployement Rate %Literacy Rate %
data for year20162014201420142014
Adrar1257.10.312.780.5
Assaba13568.98.564.4
Brakna656.79.26.162.5
Dakhet Nouadhibou518.65.619.981.7
Gorgol666.524.74.744.6
Guidimagha456.725.96.141.5
Hodh Ech Chargui358.42.411.165.4
Hodh El Gharbi745.25.5652.8
Inchiri131.70.417.983
Nouakchott3715.6958.420.581.9
Tagant 1167.80.911.273.9
Tiris Zemour217.80.229.289.8
Trarza537.147.781.6
Total112
Average8.6245.0280.4910.8969.51
standard deviation9.3118.8263.925.4215.7
Correlation with number of MfIs1−0.23910.91540.43500.1797
Source: Data for 2014 from ONS (Office National de la Statistique), 2014, and data for 2016 from the website of the Central Bank of Mauritania.
Figure A1. Regional dispersion of selected indicators for Mauritania (Source: Data from Table A3).
Jrfm 13 00239 g0a1

References

  1. Abdi, Hervé, and Lynne J. Williams. 2010. Principal component analysis. Wiley Interdisciplinary Reviews: Computational Statistics 2: 433–59. [Google Scholar] [CrossRef]
  2. Agresti, Alan. 2002. Categorical Data Analysis, 2nd ed. New York: John Wiley & Sons. [Google Scholar]
  3. Allemand, Isabelle, Bénédicte Brullebaut, and Sophie Raimbault. 2013. Exploring the Role of the Board of Directors in Cooperatives: Lessons for Microfinance. Strategic Change 22: 79–93. [Google Scholar] [CrossRef]
  4. Ambec, Stefan, and Nicolas Treich. 2007. Roscas as financial agreements to cope with self-control problems. Journal of Development Economics 82: 120–37. [Google Scholar] [CrossRef] [Green Version]
  5. Amemiya, Takeshi. 1981. Qualitative response models: A survey. Journal of Economic Literature 19: 1483–536. [Google Scholar]
  6. Amemiya, Takeshi. 1985. Advanced Econometrics. Cambridge: Harvard University Press. [Google Scholar]
  7. Amendola, Alessandra, Marinella Boccia, Gianluca Mele, and Luca Sensini. 2017. An Assessment of the Access to Credit-Welfare Nexus: Evidence from Mauritania. International Journal of Business and Management 12: 77–93. [Google Scholar] [CrossRef] [Green Version]
  8. Angelucci, Manuela, Dean Karlan, and Jonathan Zinman. 2013. Win Some Lose Some? Evidence from a Randomized Microcredit Program Placement Experiment by Compartamos Banco. Working Paper 330. Washington: Center for Global Development. [Google Scholar]
  9. Armendàriz, Beatriz, and Jonathan Morduch. 2010. The Economics of Microfinance. Cambridge: MIT Press. [Google Scholar]
  10. Ashta, Arvind. 2013. Contextualising Microfinance Research. Journal of Innovation Economics 11: 3–14. [Google Scholar] [CrossRef]
  11. Ashta, Arvind. 2016. Microfinance: Battling a Wicked Problem. Brussels: P.I.E. Peter Lang. [Google Scholar]
  12. Ashta, Arvind, Isabelle Demay, and Mawuli Couchoro. 2016. The Role of Stakeholders in the Historical Evolution of Microfinance in Togo. Economic History of Developing Regions 31: 303–44. [Google Scholar] [CrossRef]
  13. Ashta, Arvind. 2020. A Realistic Theory of Social Entrepreneurship: A Life Cycle Analysis of Micro-Finance. Cham: Palgrave MacMillan, Springer Nature. [Google Scholar]
  14. Assogba, Perceval N, Senakpon E Haroll Kokoye, Rosaine N Yegbemey, Jonas A Djenontin, Zacharie Tassou, Joanna Pardoe, and Jacob A. Yabi. 2017. Determinants of credit access by smallholder farmers in North-East Benin. Journal of Development and Agricultural Economics 9: 210–16. [Google Scholar]
  15. Attanasio, Orazio, Britta Augsburg, Ralph De Haas, Emla Fitzsimons, and Heike Harmgart. 2014. Group Lending or Individual Lending? Evidence from a Randomised Field Experiment in Mongolia. Berlin: WZB. [Google Scholar]
  16. Attuel-Mendes, Laurence, and Arvind Ashta. 2013. The Truth, But Not Always the Whole Truth in Lending Laws. Cost Management 27: 6–19. [Google Scholar]
  17. Awimbo, A. S., R. Gailey, L. Khun, and R. Randriamandrato. 1999. Meeting the Challenges of Reaching the Poorest. Washighton, DC: Microcredit Summit Campaign. [Google Scholar]
  18. Banerjee, Abhijit, Dean Karlan, and Jonathan Zinman. 2015. Six randomized evaluations of microcredit: Introduction and further steps. American Economic Journal: Applied Economics 7: 1–21. [Google Scholar] [CrossRef] [Green Version]
  19. BCM. 2015. Rapport Annuel sur la Supervision Bancaire et Financière. Nouakchott: Banque Centrale de Mauritanie. [Google Scholar]
  20. Bisrat, Agegnehu, Karantininis Kostas, and Li Feng. 2012. Are there Financial Benefits to Join RoSCAs? Empirical Evidence from Equb in Ethiopia. Procedia Economics and Finance 1: 229–38. [Google Scholar] [CrossRef] [Green Version]
  21. Cabrer-Borrás, Bernardí, and Paz Rico Belda. 2018. Survival of entrepreneurship in Spain. Small Business Economics 51: 265–78. [Google Scholar] [CrossRef]
  22. CBM. 2018. MFIs Consolidated Operations. Edited by Central Bank of Mauritania. Available online: https://www.bcm.mr/repartition-des-imf-par-wilaya (accessed on 12 October 2020).
  23. Coleman, Susan, Carmen Cotei, and Joseph Farhat. 2013. A Resource-Based View of New Firm Survival: New Perspectives on the Role of Industry And Exit Route. Journal of Developmental Entrepreneurship 18: 1350002. [Google Scholar] [CrossRef]
  24. Collins, Daryl, Jonathan Morduch, Stuart Rutherford, and Orlanda Ruthven. 2010. Portfolios of the Poor: How the World’s Poor Live on $2 a Day. Ranikhet. India: Permanent Black. [Google Scholar]
  25. Cull, Robert, Asli Demirgüç-Kunt, and Jonathan Morduch. 2009. Microfinance Meets the Market. Journal of Economic Perspectives 23: 167–92. [Google Scholar] [CrossRef] [Green Version]
  26. Cull, Robert, Tilman Ehrbeck, and Nina Holle. 2014. Financial Inclusion and Development: Recent Impact Evidence. Focus Note 92. Washington: The World Bank. [Google Scholar]
  27. Demirgüç-Kunt, Asli, Leora Klapper, Dorothe Singer, Saniya Ansar, and Jake Hess. 2018. The Global Findex Database 2017: Measuring Financial Inclusion and the Fintech Revolution. Washington: The World Bank. [Google Scholar]
  28. Dowla, Asif, and Dipal Barua. 2006. The Poor Always Pay Back: The Grameen II Story. Hartford: Kumarian Press. [Google Scholar]
  29. Duvendack, Maren, Richard Palmer-Jones, James G Copestake, Lee Hooper, Yoon Loke, and Nitya Rao. 2011. What Is the Evidence of the Impact of Microfinance on the Well-Being of Poor People? London: EPPI-Centre, Social Science Research Unit, Institute of Education, University of London. [Google Scholar]
  30. Duvendack, Maren, and Philip Mader. 2019. Impact of Financial Inclusion in Low- and Middleincome Countries: A Systematic Review of Reviews. Journal of Economic Surveys 34: 594–629. [Google Scholar] [CrossRef]
  31. Eisenhardt, Kathleen. M. 1989. Building Theories from Case Study Research. Academy of Management Review 14: 532–50. [Google Scholar] [CrossRef]
  32. Elston, Julie, Sandy Chen, and Alois Weidinger. 2016. The role of informal capital on new venture formation and growth in China. Small Business Economics 46: 79–91. [Google Scholar] [CrossRef]
  33. EPCV. 2014. Enquete Permanente Sur Les Conditions De Vie Des Menages (EPCV 2014). Edited by ONS. Nouakchott: ONS Mauritanie. [Google Scholar]
  34. Escofier, B., and J. Pagès. 1990. Analyses Factorielles Simples et Multiples: Objectifs. Méthodes et Interpretation. Paris: Dunod. [Google Scholar]
  35. Essien, Ubon Asuquo. 2015. Credit Access and the Performance of Small Scale Agro-Based Enterprises in the Niger Delta Region of Nigeria. Nsukka: University of Nigeria. [Google Scholar]
  36. Garikipati, S. 2012. Microcredit and women’s empowerment: Through the lens of time-use data from rural India. Development and Change 43: 719–50. [Google Scholar] [CrossRef] [Green Version]
  37. Greene, William H. 2012. Econometric Analysis, 7th ed. New Jersey: Prentice Hall. [Google Scholar]
  38. Gutiérrez-Nieto, Begoña, and Carlos Serrano-Cinca. 2019. 20 years of research in microfinance: An information management approach. International Journal of Information Management 47: 183–97. [Google Scholar] [CrossRef] [Green Version]
  39. Hansen, Henrik, and John Rand. 2014. The Myth of Female Credit Discrimination in African Manufacturing. Journal of Development Studies 50: 81–96. [Google Scholar] [CrossRef]
  40. Hansen, Nina, Marloes A Huis, and Robert Lensink. 2020. Microfinance Services and Women’s Empowerment. Handbook on Ethics in Finance, 1–22. [Google Scholar] [CrossRef]
  41. Hermes, Niels, and Marek Hudon. 2018. Determinants of the Performance of Microfinance Institutions: A Systematic Review. Journal of Economic Surveys 32: 1483–513. [Google Scholar] [CrossRef] [Green Version]
  42. Hewa Wellalage, Nirosha, and Stuart Locke. 2017. Access to credit by SMEs in South Asia: Do Woman Entrepreneurs Face Discrimination. Research in International Business and Finance 41: 336–46. [Google Scholar] [CrossRef]
  43. Hudon, Marek. 2009. Should access to credit be a right? Journal of Business Ethics 84: 17–28. [Google Scholar] [CrossRef] [Green Version]
  44. Hudon, Marek. 2010. Management of microfinance institutions: Do subsidies matter? Journal of International Development 22: 890–905. [Google Scholar] [CrossRef]
  45. Hulme, David, and Karen Moore. 2006. Why has Microfinance Been a Policy Success in Bangladesh (and Beyond)? London: Palgrave Macmillan. [Google Scholar]
  46. IMF. 2013. Islamic Republic of Mauritania: Poverty Reduction Strategy Paper. Washington: International Monetary Fund. [Google Scholar]
  47. Islam, Asadul, Chau Nguyen, and Russell Smyth. 2015. Does microfinance change informal lending in village economies? Evidence from Bangladesh. Journal of Banking & Finance 50: 141–56. [Google Scholar] [CrossRef]
  48. Johnson, Susan. 2005. Gender Relations, Empowerment and Microcredit: Moving on from a Lost Decade. European Journal of Development Research 17: 224–48. [Google Scholar] [CrossRef]
  49. Karim, Lamia. 2011. Microfinance and Its Discontents: Women in Debt in Bangladesh. Minnesota: University of Minnesota Press. [Google Scholar]
  50. Khoi, Phan Dinh, Christopher Gan, Gilbert V Nartea, and Cohen David A. 2013. Formal and informal rural credit in the Mekong River Delta of Vietnam: Interaction and accessibility. Journal of Asian Economics 26: 1–13. [Google Scholar] [CrossRef]
  51. Koloma, Yaya, and Hayyan Alia. 2014. Gendered Impact of Microcredit in Mali: An Evaluation by Propensity Score Matching. Strategic Change 23: 517–30. [Google Scholar] [CrossRef]
  52. Lange, Andreas, John A. List, and Michael K. Price. 2007. A fundraising mechanism inspired by historical tontines: Theory and experimental evidence. Journal of Public Economics 91: 1750–82. [Google Scholar] [CrossRef] [Green Version]
  53. Liao, Tim Futing. 1994. Interpreting Probability Models: Logit, Probit, and other Generalized Linear Models. Los Angeles: Sage. [Google Scholar]
  54. Lyons, Angela, John Grable, and Ting Zeng. 2017. Infrastructure, Urbanization, and the Financial Inclusion of Chinese Households. Available online: https://ssrn.com/abstract=3012453 (accessed on 14 July 2017).
  55. Maes, Jan P., and Larry R. Reed. 2012. State of the Microcredit Summit Campaign Report 2012. Washington: Microcredit Summit Campaign. [Google Scholar]
  56. Mavrenko, Tatjana. 2011. Development of Microfinance in Latvia: New Look At Savings and Credit Unions. Journal of Business Management, 85–98. [Google Scholar]
  57. MEFPTIC. 2014. Strategie Nationale de la Microfinance et Plan d’Action 2015–19. Nouakchott: Mauritania ONS. [Google Scholar]
  58. Messomo Elle, Serge. 2017. Understanding microfinance institutions and commercial banks’ relationships and innovations in the Cameroon financial environment. Strategic Change 26: 585–97. [Google Scholar] [CrossRef]
  59. Milana, Carlo, and Arvind Ashta. 2012. Developing Microfinance: A Survey of the Literature. Strategic Change: Briefings in Entrepreneurial Finance 21: 299–330. [Google Scholar] [CrossRef]
  60. Mor, Surender, Sonu Madan, Geoffrey R. Archer, and Arvind Ashta. 2020. Survival of the Smallest: A Study of Microenterprises in Haryana, India. Millennial Asia 11: 54–78. [Google Scholar] [CrossRef]
  61. Mottaleb, Khondoker Abdul, and Tetsushi Sonobe. 2013. The Development Process of Rural Informal Industries in Developing Countries: The Case of Bangladesh. Journal of Developing Areas 47: 229–49. [Google Scholar] [CrossRef] [Green Version]
  62. Mutua, Kimanthi, Pittayapol Nataradol, Maria Otero, and Beth R. Chung. 1996. The View from the Field: Perspectives from Managers of Microfinance Institutions. Journal of International Development 8: 179–93. [Google Scholar] [CrossRef]
  63. Ouédraogo, Alpha, and Dominique Gentil, eds. 2008. La Microfinance en Afrique de l’Ouest: Histoires et Innovations. Ouagadougou: Confédération des Institutions Financières (CIF). [Google Scholar]
  64. Parekh, Nadiya, and Arvind Ashta. 2018. An institutional logics perspective to evolution of Indian microcredit business models. Strategic Change: Briefings in Entrepreneurial Finance 27: 313–27. [Google Scholar] [CrossRef]
  65. Paşalı, Selahattin Selşah. 2013. Where Is the Cheese? Synthesizing a Giant Literature on Causes and Consequences of Financial Sector Development. Washington: The World Bank. [Google Scholar]
  66. Périlleux, Anaïs. 2013. Strategic Governance Lessons from History for West African Microfinance Cooperatives. Strategic Change 22: 95–106. [Google Scholar] [CrossRef]
  67. Phan, Dinh Khoi, Christopher Gan, Gilbert V. Nartea, and David A. Cohen. 2014. The impact of microcredit on rural households in the Mekong River Delta of Vietnam. Journal of the Asia Pacific Economy 19: 558–78. [Google Scholar] [CrossRef]
  68. Reed, Larry R., Jesse Marsden, Camille Rivera, Amanda Ortega, and Sabina Rogers. 2014. Resilience: State of the Microcredit Summit Campaign Report 2014. Washington: Microcredit Summit Campaign. [Google Scholar]
  69. Reed, Larry R., D.S.K. Rao, Sabina Rogers, Camille Rivera, Fabiola Diaz, Sara Gailly, Jesse Marsden, and Xochitl Sanchez. 2015. Mapping Pathways out of Poverty: State of the Microcredit Summit Campaign Report 2015. Washington: Microcredit Summit Campaign. [Google Scholar]
  70. RGPH. 2013. Recensement Général de la Population et de l’Habitat. Edited by Mauritania ONS. Nouakchott: Mauritania ONS. [Google Scholar]
  71. Robinson, Marguerite S. 2001. The Microfinance Revolution: Sustainable Finance for the Poor. Washington: The World Bank. [Google Scholar]
  72. Tsai, Kellee S. 2004. Imperfect Substitutes: The Local Political Economy of Informal Finance and Microfinance in Rural China and India. World Development 32: 1487–507. [Google Scholar] [CrossRef]
  73. Van Rooyen, Carina, Ruth Stewart, and Thea De Wet. 2012. The Impact of Microfinance in Sub-Saharan Africa: A Systematic Review of the Evidence. World Development 40: 2249–62. [Google Scholar] [CrossRef] [Green Version]
  74. Vanroose, Annabel. 2008. What macro factors make microfinance institutions reach out? Savings and Development, 153–74. [Google Scholar]
  75. Waje, Samuel. 2020. Determinants of Access to Formal Credit in Rural Areas of Ethiopia: Case Study of Smallholder Households in Boloso Bombbe District, Wolaita Zone, Ethiopia. Economics 9: 40. [Google Scholar] [CrossRef]
  76. Waterfield, Chuck. 2012. Moving toward More “Transparent Pricing”. Bengaluru: Microfinance Focus. [Google Scholar]
  77. World Bank. 2014. Gloal Financial Development Report 2014: Financial Inclusion. Washington: The World Bank. [Google Scholar]
  78. World Bank. 2019. How Can Mauritania Avoid the Natural Resource Curse? Washington: The World Bank. [Google Scholar]
  79. Yin, Robert K., and Karen A. Heald. 1975. Using the Case Survey Method to Analyze Policy Studies. Administrative Science Quarterly 20: 371–81. [Google Scholar] [CrossRef]
  80. Yue, Xiao-Guang, Yong Cao, Nelson Duarte, Xue-Feng Shao, and Otilia Manta. 2019. Social and Financial Inclusion through Nonbanking Institutions: A Model for Rural Romania. Journal of Risk and Financial Management 12: 166. [Google Scholar] [CrossRef] [Green Version]
  81. Yunus, Muhammad. 1976. Banker to the Poor: Micro-Lending and the Battle against World Poverty. New York: Public Affairs. [Google Scholar]
Figure 1. Credit demand by area in Mauritania in 2014. Source: The Survey of Household Living Conditions (EPCV 2014).
Jrfm 13 00239 g001
Figure 2. Evolution of MFI credits and deposits. Source: Central Bank of Mauritania, CBM (2018). Note 1 euro = 425 Mauritanian Ouguiya (MRU).
Jrfm 13 00239 g002
Figure 3. Implantation of MFIs in different regions of Mauritania. Source: Map generated by using Mapchart.com and number of MFIs was taken from the website of the Central Bank of Mauritania.
Jrfm 13 00239 g003
Figure 4. Circle of correlations and plot of the loadings of the variables with principal components. Source: Based on data from Table A3.
Jrfm 13 00239 g004
Figure 5. Regional analysis using principal components’ analysis. Source: Based on data from Table A3.
Jrfm 13 00239 g005
Figure 6. Major challenges to the development of microfinance. Source: Our analysis and interview.
Jrfm 13 00239 g006
Table 1. Determinants of access to credit in Mauritania by borrower profile in 2014.
Models(1)(2)(3)(4)(5)(6)
VariablesCredit AccessOdds_credit_accessUrbanUrban_oddsRuralRural_odds
acces_credit1
Milieu (Rural)−1.063 ***0.345 ***
(0.162)(0.0559)
Gender (female)0.1781.1940.2091.2330.1521.165
(0.154)(0.184)(0.167)(0.205)(0.426)(0.497)
Head-HH0.2140.8070.1110.8950.5210.594
(0.183)(0.148)(0.204)(0.183)(0.440)(0.261)
Reference Welfare recipients
indep_agriculture−0.02260.978−0.3080.7350.5791.785
(0.395)(0.387)(0.650)(0.478)(0.662)(1.181)
Unemployed0.3031.3540.3351.398
(0.571)(0.773)(0.589)(0.823)
Inactive−0.003280.997−0.08550.9180.1821.200
(0.275)(0.274)(0.312)(0.286)(0.606)(0.727)
Indep_none_agriculture−0.0003321.000−0.2120.8090.7012.016
(0.264)(0.264)(0.294)(0.238)(0.596)(1.201)
Private_sector_emp0.3241.3830.2541.2890.2521.286
(0.297)(0.411)(0.326)(0.420)(0.806)(1.037)
Public_sector_emp1.405 ***4.076 ***1.274 ***3.575 ***1.743 **5.717 **
(0.275)(1.123)(0.302)(1.079)(0.716)(4.096)
Reference illiterate
Literate1.2753.579 2.118 *8.313 *
(1.049)(3.756) (1.099)(9.139)
Don’t know−0.7070.493−0.7790.459
(1.025)(0.506)(1.028)(0.471)
Primary_educ0.541 ***1.717 ***0.490 **1.633 **0.4991.648
(0.179)(0.307)(0.190)(0.311)(0.526)(0.866)
Secondary_general_edu0.912 ***2.490 ***0.748 ***2.113 ***2.082 ***8.020 ***
(0.157)(0.391)(0.166)(0.351)(0.434)(3.477)
Secondary_technical1.120 **3.064 **0.5731.7745.158 ***173.9 ***
(0.479)(1.466)(0.562)(0.997)(1.319)(229.4)
Superior_educ1.231 ***3.425 ***1.109 ***3.030 ***2.314 ***10.12 ***
(0.187)(0.642)(0.194)(0.589)(0.660)(6.674)
Traditional−0.1300.878−0.06610.936−0.2490.780
(0.214)(0.188)(0.243)(0.227)(0.461)(0.360)
Reference size hh (1 to 2)
size_hh (3 to 5)0.437 **1.549 **0.501 **1.651 **0.2681.307
(0.210)(0.325)(0.233)(0.385)(0.521)(0.681)
size_hh (6 to 8)0.2541.2900.2591.2950.4691.599
(0.224)(0.289)(0.248)(0.321)(0.557)(0.891)
size_hh (9 to 12)0.4071.5030.497 *1.644 *0.1981.219
(0.260)(0.390)(0.283)(0.465)(0.724)(0.882)
size_hh (>=13)−0.2930.746−0.3130.7310.4641.591
(0.506)(0.377)(0.565)(0.413)(1.190)(1.893)
Reference no children
num_children (1 to 2)0.02001.0200.02891.029−0.05440.947
(0.119)(0.122)(0.128)(0.132)(0.338)(0.320)
num_children (3 to 5)0.09881.104−0.02600.9740.3151.370
(0.311)(0.344)(0.365)(0.356)(0.620)(0.849)
num_children (>=6)0.6641.9431.1863.273
(1.076)(2.091)(1.128)(3.691)
Reference age (1 to 25)
age (26 to 40)0.2071.2300.2961.345−0.1580.854
(0.408)(0.502)(0.480)(0.646)(0.796)(0.680)
age (41 to 55)0.4791.6140.5931.810−0.1480.862
(0.408)(0.659)(0.480)(0.868)(0.818)(0.706)
age (>=56)0.3651.4410.4951.641−0.2370.789
(0.419)(0.604)(0.492)(0.807)(0.851)(0.671)
Constant−4.257 *** −4.189 *** −5.441 ***
(0.502) (0.575) (1.057)
Loglikelihood−1448.361 −1177.762 −257.326
LR Chi2529.39 276.57 79.43
McFadden R20.1545 0.105 0.133
Observations9472 5232 4173
Note: Coefficients were estimated using a logistic regression with robust standard errors. The dependent variable is access to credit. Columns (2), (4), and (6) report the odds’ ratios of credit access. * Implies a significant coefficient at 10% level, ** at 5%, and *** at 1%. Source: The Survey of Household Living Conditions (EPCV 2014) for 2014.
Table 2. Determinants of access to credit in Mauritania by region compared to the region of Hodh Ech Chargui in 2014.
Models(1)(2)(3)(4)(5)(6)
VariablesCredit_accessOdds_credit_accessUrbanUrban_oddsRuralRural_odds
acces_credit
Hodh El Gharbi0.697 **2.009 **1.052 **2.863 **
(0.327)(0.658)(0.435)(1.244)
Assaba−0.03930.961−0.09650.908−0.1300.878
(0.400)(0.384)(0.564)(0.512)(0.573)(0.503)
Gorgol0.3411.406−0.2000.8180.6401.896
(0.382)(0.537)(0.635)(0.520)(0.489)(0.928)
Brakna0.635 *1.888 *0.855 *2.351 *0.4901.633
(0.349)(0.658)(0.504)(1.185)(0.489)(0.799)
Trarza1.041 ***2.832 ***0.2391.2701.473 ***4.363 ***
(0.303)(0.858)(0.441)(0.560)(0.419)(1.829)
Adrar2.747 ***15.60 ***2.301 ***9.984 ***0.1261.135
(0.290)(4.531)(0.406)(4.059)(1.066)(1.210)
Dakhlet_NDB0.917 ***2.502 ***0.1051.1112.111 ***8.260 ***
(0.342)(0.856)(0.449)(0.499)(0.816)(6.742)
Tagant0.2401.2710.8622.367−0.5560.574
(0.568)(0.721)(0.710)(1.681)(1.064)(0.610)
Guidhimaga0.6531.9200.969 *2.636 *0.2681.307
(0.401)(0.771)(0.549)(1.447)(0.616)(0.805)
Tiris-Zemour1.459 ***4.301 ***0.7712.1611.3793.971
(0.417)(1.793)(0.515)(1.114)(1.079)(4.286)
Inchiri2.156 ***8.637 ***1.891 ***6.629 ***1.4594.302
(0.505)(4.359)(0.622)(4.124)(1.081)(4.649)
Nouakchott1.726 ***5.617 ***0.970 **2.639 **
(0.272)(1.527)(0.392)(1.034)
Constant−4.256 *** −3.501 *** −4.637 ***
(0.260) (0.384) (0.355)
Loglikelihood−1614.5 1249.278 −302.144
LR Chi2241.58 136.11 25.49
Pseudo R20.0696 0.05 0.04
Observations9556 5250 3694
Note: Coefficients are estimated using a logistic regression with robust standard errors. The dependent variable is access to credit. Columns (2), (4), and (6) report the odds ratios. * Implies a significant coefficient at 10% level, ** at 5%, and *** at 1%. Source: The Survey of Household Living Conditions (EPCV 2014) for 2014.
Table 3. Financial inclusion using bank percentage account as a proxy, 2017: Mauritania compared with selected countries.
% of Adults Aged 15+FranceIndiaMauritaniaTogoDeveloping
Having a Bank Account 94%80%21%45%63%
Having a Bank Account, male97%83%26%53%67%
Having a Bank Account, female 91%77%15%38%59%
Having a Bank Account, in labor force 98%84%29%49%69%
Having a Bank Account, out of the labor force89%75%12%35%53%
Having a Bank Account, young adults (% ages 15–24)70%71%13%44%53%
Having a Bank Account, older adults (% ages 25+)98%83%25%46%66%
Having a Bank Account, primary education or less80%75%14%38%54%
Having a Bank Account, secondary education or more97%85%32%56%72%
Having a Bank Account, poorest 40%93%77%13%35%54%
Having a Bank Account, richest 60%94%82%26%52%69%
Having a Bank Account, rural 94%79%15%45%62%
Source: Based on data from Demirgüç-Kunt et al. (2018).
Table 4. Reasons for financial exclusion, 2017: Mauritania compared with selected countries.
Reason As a % of Unbanked (without a Financial Account)Category MauritaniaMaliTogoSenegalIndiaDeveloping
Insufficient fundsVolontary 51%75%72%65%54%63%
someone in the family has an accountVolontary 13%9%11%9%52%25%
lack of trust in financial institutionsVolontary 9%17%19%18%20%16%
religious reasonsVolontary 6%12%8%12%6%6%
no need for financial servicesVolontary 3%1%1%2%1%3%
financial services are too expensiveInvoluntory24%24%24%33%27%26%
financial institutions are too far away Involuntory16%22%25%22%23%22%
Lack of necessary documentationInvoluntory19%26%43%16%22%19%
Source: Based on data from Demirgüç-Kunt et al. (2018).
Table 5. Leading Microfinance Institutions (MFIs) and networks in Mauritania in 2013.
NameInstitutional FormNumber of Clients
PROCAPEC: Projet de gestion des caisses populaires d’épargne et de créditNetwork163,154
Nissa Banques MFI120,000
UNCACEM: union nationale des coopératives Agricoles de crédit et d’épargne en MauritanieNetwork25,000
Beit el MalMFI24,000
MICO: Mutuelles d’investissement pour le crédit oasienNetwork13,430
Source: The Ministry of Employment, Professional Training, and Information and Communication Technologies. (Ministère de l’Emploi, de la Formation Professionnelle et des Technologies de l’Information et de la Communication, MEFPTIC).

