Abstract
This study aims to investigate the relationship of economic development, measured as economic growth, energy use, trade and foreign direct investment, on the one hand, and environmental degradation (carbon dioxide (hereafter CO2) emissions), on the other hand, in eleven emerging Eastern European and Central Asian countries during the period of 1990 to 2014. The empirical results give an evidence of a carbon emission Kuznets curve for these emerging economies. The current income level indicates that not every country has reached the turning point for CO2 emissions reductions. Income elasticities for CO2 are positive for all eleven countries. The paper concludes that within the group, Ukraine and Kazakhstan have the most sensitive change in economic growth in respect to CO2. In addition, it concludes that there is a negative effect of total energy consumption on environment as such consumption increases CO2 emissions. The results also show a positive effect of foreign direct investment (FDI) on CO2 emissions in Eastern European and Central Asian countries. It is expected that the innovative transition to a low-carbon economy offers great opportunities for economic growth and job creation. Technological leadership (the initiative Industry 4.0) should be accompanied by the development and introduction of new technologies throughout Eastern European and Central Asian countries, hence, the paradigm of “sustainable development” should be considered as fatal. Furthermore, Eastern European and Central Asian economies should consider the experience of policy making implications made by other developing countries in gaining sustainable growth. Econometric analyses prove the existence of different impact on energy consumption of the ICT sector, which plays a key supporting role for intelligent manufacturing. Thus, there is a need for further investigations of the relationship between technology use and CO2 emissions.
1. Introduction
In time of global climate change and risks it poses, a question arises: “Why is it vital for global security and stability to tackle climate change and invest in sustainability?”. According to the report of the World Wide Fund for Nature, there is a statement concerning the 3S doctrine. It can be summed up in the following formula: a system that is not environmentally sustainable creates instability that inevitably devolves into insecurity. In other words: an environmentally unsustainable system produces instability, which leads to insecurity. When the balance between man and the ecosystem that provides him with key resources is upset, instability takes over; and in areas unprepared for these situations, the threats to security and economic growth arise as well (WWF 2017).
Figure 1 presents a vision of the relationship between sustainable development and key economic components.
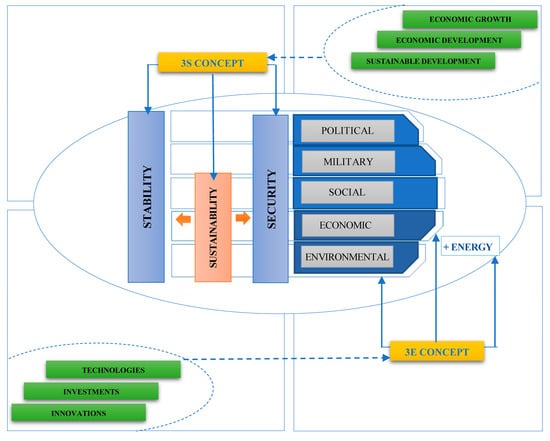
Figure 1.
The relationship between sustainable development and key economic components. Source: Compiled by author.
From Figure 1 we can see that the sustainable development paradigm is based on three main pillars: environmental protection, social justice, and economic development. In recent studies researches consider such development as a complex of strong ethical and moral goals as what should be done. Such a pronouncement is called a moral imperative and it incorporates three main elements: satisfying human needs, ensuring social equity and respecting environmental limits (Holden et al. 2017).
If the system is not stable it cannot be resistant to changes, and—thus, not able to sustain values in future. This may lead to an increase of threats to the security in unprepared areas. In other words, there should be an economy, which is able to meet the needs of society and express potentials at present, while preserving biodiversity and natural ecosystems for future generations. Furthermore, in a world where security is of ever-greater importance, relevant parameters should be taken into account to analyze problems and come up with the most effective responses. The first requirement is to recognize that climate changes and the risks they pose are a threat to stability and security. It should be noted that in some national classifications energy is used as a part of economic security (Buzan et al. 1998). But in fact, energy security is more about the link between national security and availability of natural resources for energy consumption. Hence, economic, environmental, and energy securities together create the 3E-concept.
In the market it is important to find the cheapest ways of energy resources’ supply. This issue disturbs lots of countries and creates many threats to national security and sustainable development.
It is not easy to build sustainable system and at the same time continue to increase production capacity of the country Moreover, economic growth is finally entering a new era of automation and data exchange in manufacturing technologies (Industry 4.0) that is driven by the interaction between sustainable infrastructure investment, resource productivity and rapid technological innovation.
On entering into Industry 4.0, one is faced with the 4th Wave of Environmentalism, which is characterized by the use of innovation, digital technologies, and achievement of different environmental goals, such as reduction of natural resource consumption, CO2 emissions and waste generation (Manoukian 2018). In “Business and the Fourth Wave of Environmentalism” by Environmental Defense Fund (2018) it is stated that there are several technologies which can drive sustainability: data analytics, block-chain, automation technologies, sharing technologies, sensors, dematerialization, and mobile ubiquity.
Obviously, innovations can speed the transition to a low-carbon economy and create smart traffic management networks, which allow use of less energy and propose better ways to conserve fuel resources. However, several questions arise: is society prepared to deal with the environmental challenges and does Industry 4.0 affect the environmental sustainability in emerging economies?
Thus, there is a need to investigate the relationship between economic development and environmental degradation in emerging economies, and the expected profound impact of Industry 4.0 on emerging economies.
Without doubt, the inherent characteristics of new technologies make an impact on energy, flow of raw materials, waste, etc. and these changes have an influence on environmental sustainability. It is expected that there should be a synergy effect between Industry 4.0 and sustainability. The setting of goals is an important condition to begin the journey towards sustainability (Bonilla et al. 2018).
According to the Paris Climate Agreement and the United Nations Program 2015, in order to meet the Sustainable Development Goals (SDGs) it is necessary to create an integrated environmental performance methodology to investigate countries’ pollution situation and measure the deterioration of natural resources. For this purpose, a new approach was presented, which calculated the Environmental Performance Index (EPI).
EPI scores 180 countries on 24 performance indicators across ten issue categories covering environmental health and ecosystem vitality.
The evaluation of environmental situation is better to do in comparison with the level of economic development of the countries. Therefore, it was decided to present this relationship between EPI and Human Development Index (HDI) in form of the correlation matrix. The analysis shows the situation in Eastern European and Central Asian countries and compared them with TOP-11 developed countries.
As can be seen from the Figure 2 for emerging economies the EPI varies from 0.26 to 0.70 and for developed economies from 0.48 to 0.90 respectively.
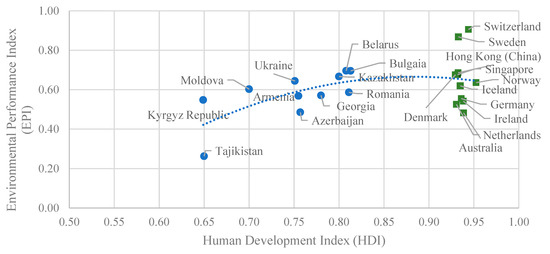
Figure 2.
Correlation matrix between the Environmental Performance Index (EPI-2018) and the Human Development Index (HDI-2017). Sources: Environmental Performance Index (2018) and Human Development Index (2017).
The HDI is different for these groups, as emerging economies are classified as countries with high human development and developed economies with very high human development. Nevertheless, the environmental pollution levels do not show a significant difference.
It should be noted that energy use and economic development could be important sources of variation in CO2 emissions for economies characterized by a rapid increase in economic activity and at the same time characterized by obsolete machinery and equipment. These economies have both energy-intensive production and high levels of CO2 emissions.
Hence, studying the relationship between environmental degradation, economic development, and energy use is an important issue for research.
2. Theoretical Background
2.1. Studies on the Relationship between the Economic Development and Environmental Degradation
Issues concerning relationships between environmental indicators and income have been widely discussed. A major concept is investigation of the environmental Kuznets curve (EKC) hypothesis, which refers to the inverted U-shaped curve, mapping the relationship between economic growth and environmental degradation.
The original EKC hypothesis suggests that while improving economic development the environment at the initial stage is rapidly deteriorating. However, along with increase of income, demand for a safe and prosperous environment grows (Stern 2004).
In the work of Frankel and Rose (2005) the EKC analysis was extended by adding new variable—trade liberalization. Empirical testing proved the EKC hypothesis and also indicated a positive influence of trade on environmental pollution.
Similarly, the influence of economic growth, FDI inflows and trade on CO2 emissions was investigated in Turkey (Kaya et al. 2017). The authors found empirical evidence of the existence of the EKC in this country and positive long run effects of variables on CO2 emissions.
Another approach presented by Kacar and Kayalica (2014): examined the relationship between sulfur emission and economic development. Again, one found evidence of the EKC hypothesis.
A recent study investigated the long-run relationship between CO2 emissions, economic growth and energy use in North Africa and the Middle East (Zaied et al. 2017). In their study it was concluded that only oil producing countries have already reached the inflection turning point of emissions.
Tjoek and Wu (2018) analyzed the relationship between SO2 and CO2 emissions and economic growth. The results showed that the EKC hypotheses can be applied for CO2 emissions. They also argued that the current Southeast Asia income level has not reached the inflection turning point.
In a study Shahbaz and Sinha (2018) states that developing and emerging economies still have not reached the turning point, but it is possible to do so in sustainable manner ensuring an inclusive growth. Thus, an approach, which is based on public-private partnership, should be considered.
Panayotou (1993) empirically examined and made a policy analysis of environmental degradation at different stages of economic development. He established that environmental degradation is worse in countries with income per capita levels less than $1000. Another group of countries ($1000–$3000) is characterized by a transition tendency from agricultural to industrial economy. The last group ($10,000) shows a shift from energy intensive manufacturing to information/technology-intensive production.
Vuong et al. (2019) tested if green growth policies can help to protect the environment and keep the industrial growth at the same time. The final estimation showed a mixed evidence for the EKC hypothesis.
2.2. Concept of Industry 4.0 and Sustainability Implications
The term “Industry 4.0” was introduced in 2011, when the business community of German political and academic circles launched an initiative under this name to increase the competitiveness of German industry (Kagermann et al. 2011). Additionally, it was mentioned that the fourth Industrial Revolution (Industry 4.0) proposes intelligent manufacturing through development of Cyber-Physical Production Systems (CPPS), equipped with large variety of digital technologies. These systems include objectives communicating with each other, and exchange with autonomous and self-optimized information. Hence CPPS rely on further implementation of computer, manufacturing science and technology, along with ICT (Kagermann et al. 2013).
It should be mentioned that Industry 4—is not just about helping people to minimize and eliminate problems, but also about innovations, increase of productivity and more customer-centricity (Lee et al. 2018).
Industrial enterprises around the world are beginning to pay attention to business in the context of the Industry 4.0 program. About a third of companies all over the world estimate their level of digitalization as high. In the next five years, the share of such companies is expected to increase from 33% to 72%. For example, according to forecasts, it is expected that the number of connected devices will exceed 30 billion in the next few years (PricewaterhouseCoopers 2016). Hence, there is a growing trend in ICT demand.
Also, it should be noted that one of the most important aspects of implementation of Industry 4.0 are the rational use of natural resources and energy efficient technologies (Blunck and Werthmann 2017). In this regard Industry 4.0 was also discussed in relation to the SDGs (Figure 3).
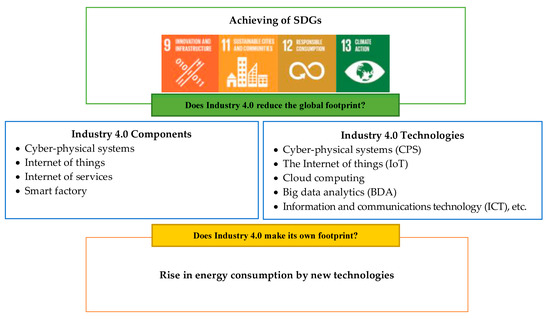
Figure 3.
Concept of Industry 4.0 and sustainability implications. Source: Compiled by author.
For example, for achieving SDG #9 new technologies can contribute to the integration of renewable energy sources and digitization of production processes.
SDG #11—Industry 4.0 provides an opportunity to explore the potential of cities, apply innovative development, digitalization and new technologies, especially information and communication technologies (ICTs).
SDG #12—ICTs can also contribute to sustainable consumption and production, and also be useful for improving resource utilization (HLPF 2019).
Nonetheless, Industry 4.0, especially ICT, can have different impact on sustainability, both positive and critical.
In fact, the ICT sector consumes 7% of the world electricity, and the share is expected to rise approximately to 13% in ten years (Bertoldi et al. 2017). Moreover, the rapid growth of new data centers has fastened the carbon footprint increase. Literature review shows that this issue has been widely discussed. The impact and problems of Industry 4.0 on sustainability have been studied in four different scenarios: deployment, operation and technology, integration, and compliance with sustainable development goals and long-term scenarios (Bonilla et al. 2018).
Despite the fact that information and communication technologies are responsible only for about 2% of anthropogenic emissions ICT is one of the fastest growing sectors of the economy. As result, there is growing concern about the impact of the sector on the environment, especially on the potential climate change caused by related energy consumption. At the same time, there is a growing understanding that ICTs can also significantly reduce the environmental impact of other sectors, by increasing their energy efficiency (Pouri and Hilty 2018).
To sum up, this study will contribute to the existing literature in two ways. Firstly, this paper will provide insights about the carbon emission Kuznets curve in Eastern European and Central Asian countries. Secondly, study will examine the impact of the ICT use on energy consumption in each region.
3. Data and Methodology
In order to test the relationship between air pollution and economic development this paper applies annual data of GDP, net inflows of FDI, energy intensity and trade openness. The data are gathered from the open World Bank database (The World Bank 2019). The indicators were assessed by national statistical authorities and then processed by the World Bank under common processing standards. It would have been preferable to use quarterly data for the analysis, but due to the lack of reliable series it is decided to use annual data, covering the years from 1990 to 2014. The average values of the indicators have been processed to a certain degree using a repeated observation method.
A Hodrick Prescott-filter is used to find significant short-term deviations from long-term equilibriums in data serials (Annen 2006). However, the results show that there are no significant deviations from trend, hence there is no need to use structural time series analysis to separate cycle component and trend.
The following study is based on the analysis of indicators of eleven Eastern European and Central Asian economies, i.e., Armenia, Azerbaijan, Belarus, Bulgaria, Georgia, Kazakhstan, Kyrgyz Republic, Moldova, Romania, Tajikistan, and Ukraine. These countries had until the 1990s approximately the same economic systems and mechanisms, and, thereafter, began to transform their political and economic systems towards market-oriented economies.
The main common characteristics for these countries a rapid growth pace of foreign trade, significant increase of the share of the private sector, and foreign investment remains key factor for economic growth. Also, the structure of the economy of the countries of Eastern Europe and Central Asia is changing. Previously the national economies of these countries were oriented to agriculture, extraction of raw materials and production of low-level processed products. Then, during the reform the share of ready-made industrial products, with high technology standards, competitive at international level, increased.
Nevertheless, for most post socialist countries the biggest serious issue for development of its own industry still is the dependence on import of energy resources at market prices. This problem is very difficult to solve due to the fact that in Soviet times, production as a whole had high energy intensity.
Thus, investigating the relationship between environmental degradation, economic development, and energy use in emerging economies is an important task.
The paper uses a logarithmic form of the variables to make differences relative and reduce the effect of heteroscedasticity problems.
It should be noted, when using econometric models based on time series, an important point is to check the adequacy of these models. Hence, the paper applies different econometric tools to proceed the regression validation. A Durbin–Watson test has been included to detect possible autocorrelation of the residuals (Hisamatsu and Maekawa 1994). An important precondition for obtaining reliable results are stationary circumstances. Therefore, it is necessary to check the model for stationary This is done by using a Dickey–Fuller test (EViews 2019).
In this paper a log-linear quadratic regression was used to check the environmental Kuznets curve hypothesis on the relationships between the explanatory variables and carbon emission:
where
logCO2t = α + β1logGDPt + β2log2GDPt +β3logFDIt + β4logEnergyt + β5logTradet + εt
- logCO2t—is the logarithm of CO2 emissions;
- logGDPt and log2GDPt—is the logarithm of GDP and its square;
- logFDIt—is the logarithm of FDI net inflows;
- logTradet—is the logarithm of trade in services (the sum of service exports and imports divided by the value of GDP);
- logEnergyt—is the logarithm of energy intensity level of primary energy;
- t—is the sampling year;
- ε—is the vector of the residuals;
The foundation of the environmental Kuznets curve hypothesis is that the environmental degradation level is expected to increase at the same time as real GDP per capita increases, until a certain point, at which environmental degradation is expected to decrease as income per capita enters a different level (Xu et al. 2018). The relationship between emissions and economic growth is explained as follows:
- if β2 = β1 = 0, the hypothesis on the relationships between economic growth and environmental degradation can be rejected;
- if β2 = 0 and β1 > 0, there is a linear relationship;
- if β1 > 0 and β2 < 0, there is an inverted U-shaped relationship between economic growth and CO2 emission (in this case, the environmental Kuznets curve hypothesis can be accepted);
- if β1 < 0 and β2 > 0, there is a positive U-shaped relationship;
where −β1/2β2 is the inflection point.
In addition, the study examines the influence of the ICT use on energy consumption, which was based on the Statistical Review of World Energy and has been provided by BP (Statistical Review of World Energy 2018). ITU Telecom World presents data of the global ICT sector for the major world manufacturers, telecom operators and innovative players which are guided by new technologies (International Telecommunication Union 2017).
Among the main indicators, which characterize ICT development are: ICT1—Fixed-telephone subscriptions; ICT2—Mobile-cellular telephone subscriptions; ICT3—Individuals using the Internet. The following study is based on the analysis of indicators of six regions. The data was collected for the period 2005–2017.
It explores the relationship between energy consumption and ICT variables in Microsoft Excel using econometric analysis.
4. Results
4.1. Regressions on Relationships between Carbon Emission and Economic Development
Based on the adjusted R2 value, it can be concluded that the model can explain 95% of the variation in CO2 emissions. In addition, the error correction term is 0.05. The results are reliable (statistically significant): Prob (F-statistic) is less than 0.05. Another step is finding the likelihood of the sample result, if the null hypothesis is true:
- H0: μ1 = μ2 = μ3
- H1: at least one of the means is different.
If F > F criteria, we reject the null hypothesis. In this case, 92.94 > 0.00 (Table 1). Hence, the null hypothesis can be rejected.

Table 1.
Regression test results.
The next step is to check the adequacy and reliability of the obtained data.
Durbin–Watson (DW) statistic is a test of possible presence of serial correlation of residuals. Values of the DW criterion range on the interval DW1-DW2, where DW1 is the lower limit, DW2 is the upper limit. The actual values of the criterion are compared with critical values for the number of observations n and the number of independent variables m at the selected confidence level a.
If the DWfact < DW1, the residuals have autocorrelation. If DWfact > DW2, the hypothesis about the absence of auto-correlation is accepted. If DW1 < DWfact < DW2 concrete conclusions cannot be obtained. In this model, DWfact = 1.10 and DW1 = 0.95, DW2 = 1.89, which cannot determine the existence or absence of the autocorrelation in the sample (0.95 < 1.10 < 1.89).
The next step is to check the model for stationarity using the expanded Dickey–Fuller test, which assumes that the null hypothesis confirms non stationarity of the applied data. If t-statistics > Augmented Dickey–Fuller (ADF) critical value, then the hypothesis that data is non stationary is rejected; if t-statistics < ADF critical value, the null hypothesis is accepted or, in other words, unit root exists.
The obtained results show that the test statistic for the CO2 time series is substantially lower than all of the critical values −3.74 (t1%), −2.99 (t5%), −2.64 (t10%) > −4.99 (ADF). Thus, the hypothesis that investigated time series is non stationary is rejected (Figure 4). The same conclusion was made for other indicators of the regression model.
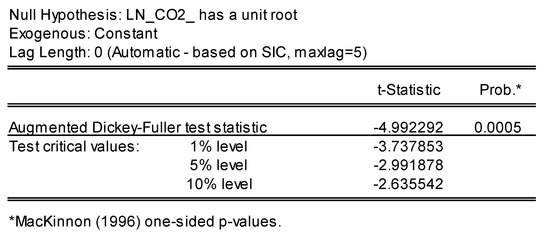
Figure 4.
Results of the check on the stationary time series in the EViews program.
According to the regression analysis the estimated regression line can be presented as the following:
logCO2 = −9.16 + 2.27GDP − 0.12GDP2 − 0.03FDI + 0.71Energy − 0.15Trade
This implies that for each percent increase in Energy, CO2 emission increases with 0.7 percent, and for each percentage increase in FDI and Trade, CO2 emission decreases with 0.03 and 0.15 units respectively.
The results also indicate significant positive relationship between GDP and CO2. The estimated results showed that a one percent increase in GDP leads to increase of CO2 by 2.27 percent. This change is statistically significant at a p-value (two-tail) of 0.001 with t-statistics = 3.99.
If we look to the energy consumption impact on CO2 emissions, we find a significant increase (coefficient is 0.71 and p-value = 0.136). In addition, t-statistics show how far the estimated coefficient is from zero, which is calculated in terms of standard deviations. It should be noted that the variable Energy has the highest level of t-statistic—4.19.
Empirical findings indicate that FDI has a positive effect on CO2. This means that one percent increase in FDI leads to decrease of emission level by 0.03 percent. This relationship is significant (p-value = 0.0005) and at the same time a standard error of the estimated coefficient is the lowest (Std. Error = 0.02).
A similar situation is observed with Trade: one percent increase in trade openness decreases CO2 levels by 0.16 percent. The relationship is significant with a p-value = 0.071. These analyses prove the statement that in emerging economies FDI and trade openness have positive influence on environment and lead to economic growth at the same time.
According to the regression results, the coefficient of the logarithm of GDP is positive (2.27) and the coefficient of the logarithm of squared GDP is negative (−0.12). Hence, there is an inverted U-shaped relationship between economic growth and CO2 emission. Thus, in this case, the environmental Kuznets curve hypothesis can be accepted.
Therefore, this study preliminarily validates the EKC hypothesis in Eastern European countries: the turning point is 9.18. Figure 5 shows that after the inflection point, CO2 emissions tend to decline with economic growth. It should be mentioned that not every country reached that point.
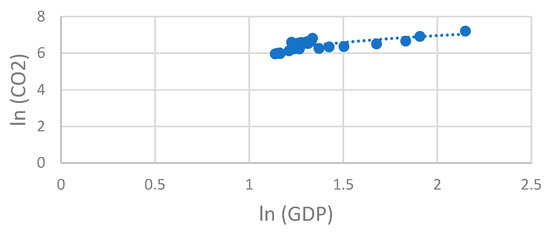
Figure 5.
Environmental Kuznets curve (EKC) for carbon emissions and economic growth in Eastern European countries. Source: Authors’ calculations.
A similar Kuznets curve is also estimated for eleven developed countries, with very high human development according to the HDI, the results show that after the inflection point is reached, carbon emissions begin to decrease with further economic growth, as shown in Figure 6. Moreover, this point was reached in 2003. In consequence, these results support the EKC hypothesis.
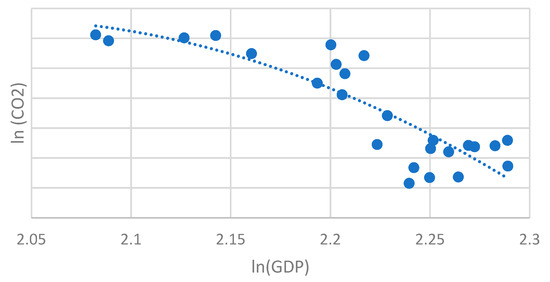
Figure 6.
EKC for carbon emission and economic growth in developed countries. Source: Authors’ calculations.
According to the regression analysis the regression line for developed countries can be presented as follows:
logCO2 = −33.43 + 6.64GDP − 0.32GDP2 − 0.01FDI + 0.45Energy + 0.01Trade
To conclude, the influence of FDI for emerging and for developed economies on CO2 emission is negative. Hence, it decreases the environmental degradation level. Energy consumption has a positive impact on environmental pollution for both groups, but in Eastern European and Central Asian countries this level is stronger. In contrast, trade openness decreases the environmental degradation level in emerging economies, while in developed countries it shows another tendency (for each unit increase in Trade, CO2 emission increases with 0.01 units). In other words, developed countries produce more goods, so they need more permissions to do that. That proves, according to the Kyoto agreement, countries that produce less CO2, can sell surplus quotas to other countries that are exceeding their limits and acquiring the right to increase emissions.
4.2. Income Elasticity of Environmental Degradation
The analytical assessment of income elasticity coefficients allows one to identify the degree of influence of environmental degradation on economic growth. Hence, it is necessary to calculate the relative change in average CO2 emissions per capita for every percent change in GDP per capita in each Eastern European and Central Asian country. Income elasticity of environmental degradation can be presented as follows:
Table 2 describes the income elasticity of CO2 emissions for Eastern Europe and Central Asia. The computed CO2 emissions varies between 0.48 and 11.95 metric tons per capita, and real GDP per capita ranges between 438.16 to 4851.06 US$ annual for every country in the 25-year period 1990‒2014.

Table 2.
Income elasticity of CO2 emissions for individual countries in Eastern Europe and Central Asia.
Table 2 shows that among eleven countries, Armenia is the least elastic country within this analysis, with a coefficient of 0.091 at this level. The results show that Kazakhstan and Ukraine have the most sensitive change in economic development in respect to its CO2 changes—0.690 and 0.604 respectively. The income elasticities also indicate that CO2 emission for the individual emerging economies has different impact on economic development. Also, it should be noticed that only Tajikistan has negative elasticity, meaning that in this country the relationship between its real GDP per capita and environmental degradation is inelastic (should be added, Tajikistan has the lowest level of income per capita and the lowest level of CO2 emissions).
To sum up, empirical investigation of EKC shows us a strong influence of energy consumption on CO2 emissions.
Energy seems to be the main intensive factor of growth and development of both as industrial, as innovative modern economy (The Global Commission on the Economy and Climate 2018).
The total amount of electricity generated worldwide increased almost three times during last 30-year period), from 9882.22 TWh in 1985, 14,916.79 TWh in 1999, and finally 25,551.28 TWh in 2017.
At the beginning North America was the leader and generated 33% of the world electricity. According to BP Statistical Review of World Energy (2018), some Eastern European countries belonging to the Commonwealth of Independent States (CIS) group, and it took the 4th position at the beginning of the investigated period. The situation rapidly changed during the last 30 years and Asia Pacific became the main active producer of energy with a share of 45%. If we talk about CIS countries, the electricity generation decreased by 11%.
Figure 7 depicts the share of electricity generation by fuels by region in 2017.
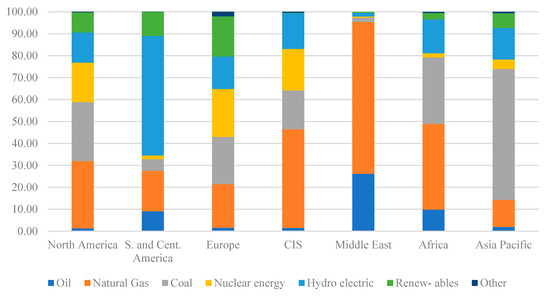
Figure 7.
Regional electricity generation by fuels, 2017. CIS: Commonwealth of Independent States. Source: BP Statistical Review of World Energy (2018).
It should be noticed that the share of renewables is extremely low in the CIS countries, meanwhile the share of natural gas and coal is very high. If we compare with data of Europe in general, there is a better tendency (percentages of electricity generation by fuels have almost equal shares of total generation). This implies a good diversification in electricity generation in these countries.
Concerning regional energy consumption, there is a steady growth in several developing countries, especially in Asia (+4%). China became the world’s largest energy consumer (23% of the total). Another tendency is presented in North America—where consumption has generally declined by 5%. The same tendency can be observed in countries of CIS group, when Europe has a stronger decline of 8%.
It should be noted that throughout the period of independence of the Eastern European and Central Asian countries, the energy sector remains the most vulnerable segment of the economy. Main problems seem to be: energy intensity of GDP, carbon intensity of GDP, and high level of CO2 emission. For example, in this context, the Energy Strategy of Ukraine until 20301, approved by the Cabinet of Ministers, set fixed key targets. Presently the document was changed and a new Action Plan for implementation of the Energy Strategy of Ukraine until 20352 “Safety, Energy Efficiency, and Competitiveness” (2018) was approved. Nevertheless, none of the strategic goals were achieved (reducing the energy intensity of GDP, intensifying the development of own energy resources, diversifying sources and routes of energy supplies, creating a strategic oil reserve, creating elements of the nuclear fuel cycle, and comprehensive development of alternative energy).
4.3. Energy Intensity of GDP
The analysis reveals that the energy intensity level of Eastern European and Central Asian countries exceeds most limits, e.g., in Ukraine it is the highest among the group, furthermore, the intensity level two times higher than the average world level and almost three times higher than in the EU (Table 3).

Table 3.
Energy intensity level of primary energy, MJ/$2011 PPP GDP.
This is mainly due to the high degree of wear of domestic infrastructure, in particular energy infrastructure, low efficiency of use of fuel and energy resources in technological processes. It should be noted, the use of electric power in these emerging economies can be divided by types of power plants, which produce electricity, i.e., hydro, atomic, thermal power and other renewable. For example, the biggest share of energy in Ukraine is produced precisely at thermal power plants. A problem with these plants is that they remain the largest pollutants of the atmosphere.
Also it should be noted that the level of energy intensity in these countries decreased since their independence year, but despite of this fact is still remains extremely high.
4.4. Carbon Intensity of GDP
The CO2 intensity shows a similar tendency. The intensity of carbon emissions from fossil fuel combustion in Eastern European and Central Asian countries has decreased almost by 50% during the period from 1990 to 2016. At the same time, the carbon intensity still remains the highest (e.g., in Ukraine this level exceeds the CO2 intensity of Poland by 1.8, Germany—by 2.8, and is 2 times higher than the world level) (Table 4).

Table 4.
CO2 emission intensity at constant parity of purchasing power, kg СО2/$ 2005.
4.5. Level of CO2 Emissions
It should be mentioned that presently there is a high disproportion between regional emissions and population size, e.g., North America is a home to 5% of the world population and at the same time this region emits approximately 18% of CO2. As for Africa, it has 16% of the world population, but emits only 4% of total world carbon dioxide. In fact, Asia has 60% of the world population, but the pollution level is 49% (Figure 8).
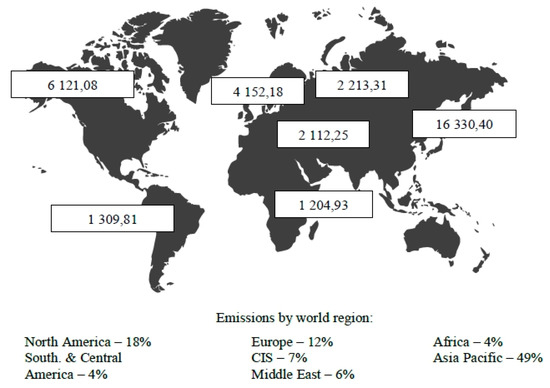
Figure 8.
World carbon dioxide emissions by region (in million metric tons of carbon dioxide). Source: BP Statistical Review of World Energy (2018).
Hence, finding the compatible pathway for levelling this inequality is a great challenge.
Population growth, rising GDP levels lead to resource scarcity. Also, the regression analyses proved this statement: according to the obtained results, one percent increase in GDP leads to increase of CO2 by 2.27 percent.
Referred to the vision of Industry 4.0, it is still based on automation technology, which requires consumption of electricity, but at the same time these technologies contribute to reduction of the larger impact of many industries through the smart traffic management. Hence, this raises a valid question: how does the new technologies use affect the environmental sustainability?
4.6. Investigation of the Relationship between ICT Use and Energy Consumption
The role of Industry 4.0 is significant, however, the technologies need more and more energy, particular the ICT sector. Moreover, the obtained results proved a negative influence of energy consumption on CO2 in emerging economies (for each percentage increase in energy, emission increases with 0.7 percent). Thus, there is a problem of energy efficiency policy in emerging economies.
In order to investigate the relationship between the ICT use and energy consumption for each region, the paper offers a correlation matrix to visualize correlation coefficients between relevant variables (Table 5).

Table 5.
Correlation matrix.
The analyses show that in CIS countries there is a positive correlation between energy consumption and ICT indicators, at the same time, the values of the coefficients are very low: ICT1 (0.16), ICT2 (0.24) and ICT3 (0.32). In Europe there is another situation—a negative relationship between two ICT indicators and energy: ICT2 (−0.67) and ICT3 (−0.81), that can be a result of active implementation of energy saving technologies in European countries. In general, the analysis shows, that the ICT sector increases the energy consumption in CIS countries.
5. Discussion
5.1. Limitations and Recommendations
This study has several limitations. First, on a sector level the study looks at indicators of the ICT sector only, which plays a key supporting role for intelligent manufacturing.
Second, this present study of the relationship between environmental degradation and economic development samples the data for eleven Eastern European and Central Asian economies for the period 1990 to 2014. Hence, it remains uncertain, if these countries have reached the turning point for CO2 emissions during the recent years.
Thus, in order to obtain more comprehensive results future research should be expanded using additional indicators to measure the impact of Industry 4.0 in a more recent period.
The results show that emerging economies have similar problems. Hence, to create a well-balanced system and improve an energy situation in terms of technological leadership of each emerging country the following pillars can be of interest:
- −
- energy saving and energy efficiency (attraction of FDI to unleash innovation potential of the industry);
- −
- strategic reserves (harnessing the power of the energy sector, including renewables);
- −
- import diversification (advanced supply chain transparency);
- −
- integration into the EU energy area (connected and synchronized energy networks).
Such a system will become one of the safe guards of the country’s survival under adverse external circumstances, preserving its sovereignty, territorial integrity and further economic development.
5.2. Implications
International experience shows that social progress largely depends on maintaining a balance between the goals of supporting economic growth, business competitiveness, environmental security and reducing social inequality. In order to achieve long-term goals, certain short- and medium-term tasks must be consistently implemented along with sufficient policy measures.
Overall, it is clear that innovations play a central role in the policymaking process. Park et al. (2010) stated that technological development in the ICT sector, services, industry, agriculture and market-based policies are main strategies of ecological modernization in China. Also, it should be noted, circular economy (Garcia-Muiña et al. 2018), cleaner production (Gavrilescu 2004), low-carbon technologies (Karpa 2017), corporate social responsibility are key components of ecological modernization.
Furthermore, it is recommended for Eastern European and Central Asian economies to consider the experience of the policy implications of other developing countries, which are also struggling with striking a balance between economic growth and environmental protection (Nguyen et al. 2019). For example, Vuong (2018) highlights the significance of high-tech industries in Vietnam, which presently takes high position in the global value chain among emerging markets. At the same time, the society has been enthusiastic for technology and startups in recent years. But in fact, this situation leads to some changes in Vietnamese agriculture, finance, and banking, and even Hanoi urban (Vuong 2019).
Bocken et al. (2014) have pointed out that for successful adoption of sustainable business models it is needed to combine innovations, technology, new innovative approaches to collaboration and education, and to raise awareness to facilitate and obtain application of the system perspective.
Also, this approach is widespread nowadays, some researchers have already offered actionable recommendations on how to mitigate and curb the explosive industry sector global greenhouse gas emissions footprint, through a combination of renewable energy use, tax policies, managerial actions, and alternative business models (Belkhir and Elmeligi 2018).
Moreover, the results show that some Eastern European countries, which are members of EU, nowadays implements different tools toward the protection of environment and provides effective energy saving policy. Thus, the situation in these economies has improved substantially. Also, the institutional development index of these countries shows huge differences between the EU members and other Eastern European and Central Asian countries, e.g., Bulgaria and Romania at the top and Tajikistan at the bottom of the list (Grytten and Koilo 2019).
To sum up, the obtained results prove that implementation of new technologies have huge impact on energy consumption, which presently leads to environmental degradation in some regions.
6. Conclusions
The present study empirically investigates the long-run relationship between carbon dioxide emissions, economic growth, net FDI inflows, energy intensity, and trade openness.
According to the data analysis, the following conclusions was obtained: the results confirm the carbon emission’s Kuznets curve hypothesis in Eastern Europe and Central Asia. The relationship between carbon emission and economic growth tends to follow an inverted U-shaped Kuznets curve.
Also, estimated income elasticities of CO2 emissions for individual countries in Eastern Europe and Central Asia perform differently. The paper concludes that within a group Ukraine and Kazakhstan has the most sensitive change in economic growth in respect to its CO2. At the same time, Tajikistan has a negative elasticity, thus in this country the relationship between its real GDP per capita and environmental degradation is inelastic.
The results confirm that some emerging economies have already reached the point, when the environmental situation can be improved and sustainable goals can be achieved. Based on above mentioned results derived from this study the following conclusions can be obtained: politics, which are based on innovative transition to a low-carbon economy can offer great opportunities for economic growth and achieving the sustainable development goals.
Industry 4.0 could promote significant environmental, economic, and social benefits, therefore, new technologies should strive to contribute towards a more “sustainable development” and promote energy conservation in order to reduce carbon emissions.
Nevertheless, the results show that ICT sector has a different impact on sustainability in different regions, e.g., new technologies use increases the energy consumption in CIS countries, while in Europe there is another tendency. As long as energy intensity and carbon intensity levels remain high in emerging economies, there is a need for further investigation of the relationship between technology use and CO2 emissions. Moreover, future studies should be expanded using additional indicators to measure the impact of Industry 4.0 on sustainability.
Funding
This research received no external funding.
Conflicts of Interest
The authors declare no conflict of interest.
References
- Annen, Kurt. 2006. HP-Filter Excel Add-In. Available online: https://web-reg.de/webreg-hodrick-prescott-filter/ (accessed on 12 May 2019).
- Belkhir, Lotfi, and Ahmed Elmeligi. 2018. Assessing ICT global emissions footprint: Trends to 2040 & recommendations. Journal of Cleaner Production 177: 448–63. [Google Scholar]
- Bertoldi, Paolo, Maria Avgerinou, and Luca Castellazzi. 2017. Trends in Data Centre Energy Consumption under the European Code of Conduct for Data Centre Energy Efficiency. Luxembourg: Publications Office of the European Union. [Google Scholar]
- Blunck, Erskin, and Hedwig Werthmann. 2017. Industry 4.0—An Opportunity to Realize Sustainable Manufacturing and its Potential for a Circular Economy. Microeconomics 3: 645–66. [Google Scholar]
- Bocken, Nancy M. P., Samuel W. Short, Padmakshi Rana, and Steve Evans. 2014. A literature and practice review to develop sustainable business model archetypes. Journal of Cleaner Production 65: 42–56. [Google Scholar] [CrossRef]
- Bonilla, Silvia, Helton Silva, Marcia Terra da Silva, Rodrigo Franco Gonçalves, and José Sacomano. 2018. Industry 4.0 and Sustainability Implications: A Scenario-Based Analysis of the Impacts and Challenges. Sustainability 10: 3740. [Google Scholar] [CrossRef]
- BP Statistical Review of World Energy. 2018. Centre for Energy Economics Research and Policy, Heriot-Watt University (67th ed.). Available online: https://www.bp.com/content/dam/bp/business-sites/en/global/corporate/pdfs/energy-economics/statistical-review/bp-stats-review-2018-full-report.pdf (accessed on 17 May 2019).
- Buzan, Barry, Ole Wæver, Ole Wæver, and Jaap De Wilde. 1998. Security: A New Framework for Analysis. Boulder: Lynne Rienner, p. 239. [Google Scholar]
- Environmental Defense Fund. 2018. Business and the Fourth Wave of Environmentalism. Available online: https://www.edf.org/sites/default/files/documents/business_and_the_fourth_wave.pdf (accessed on 17 May 2019).
- The Environmental Performance Index. 2018. Yale University. Available online: https://epi.envirocenter.yale.edu/ (accessed on 17 May 2019).
- EViews. 2019. Unit Root Testing. Available online: http://www.eviews.com/help/helpintro.html#page/content/advtimeser-Unit_Root_Testing.html (accessed on 17 May 2019).
- Frankel, Jeffrey A., and Andrew K. Rose. 2005. Is Trade Good or Bad for the Environment? Sorting Out the Causality. The Review of Economics and Statistics 87: 85–91. [Google Scholar] [CrossRef]
- Garcia-Muiña, Fernando, Rocío González-Sánchez, Anna Ferrari, and Davide Settembre-Blundo. 2018. The Paradigms of Industry 4.0 and Circular Economy as Enabling Drivers for the Competitiveness of Businesses and Territories: The Case of an Italian Ceramic Tiles Manufacturing Company. Social Sciences 7: 255. [Google Scholar] [CrossRef]
- Gavrilescu, Maria. 2004. Cleaner production as a tool for sustainable development. Environmental Engineering and Management Journal 3: 45–70. [Google Scholar] [CrossRef]
- Grytten, Ola Honningdal, and Viktoriia Koilo. 2019. The Financial Instability Hypothesis and the Financial Crisis in Eastern European Emerging Economies. Available online: https://papers.ssrn.com/sol3/papers.cfm?abstract_id=3381533 (accessed on 11 May 2019).
- Hisamatsu, Hiroyuki, and Koichi Maekawa. 1994. The distribution of the Durbin–Watson statistic in integrated and near-integrated models. Journal of Econometrics 61: 367–82. [Google Scholar] [CrossRef]
- The Division for Sustainable Development Goals (DSDG). 2019. The High-Level Political Forum on Sustainable Development in 2019 (HLPF 2019). Available online: https://sustainabledevelopment.un.org/hlpf/2019/ (accessed on 12 May 2019).
- Holden, Erling, Kristin Linnerud, David Banister, Valeria Jana Schwanitz, and August Wierling. 2017. The Imperatives of Sustainable Development. Sustainable Development 25: 213–26. [Google Scholar] [CrossRef]
- Human Development Index. 2017. United Nations Development Programme. Available online: http://www.hdr.undp.org/en/data (accessed on 17 May 2019).
- International Telecommunication Union. 2017. TU World Telecommunication. ICT Indicators Data. Available online: https://www.itu.int/en/ITU-D/Statistics/Pages/stat/default.aspx (accessed on 22 June 2019).
- Kacar, S. Burak, and M. Ozgur Kayalica. 2014. Environmental Kuznets Curve and sulfur emissions: A comparative econometric analyzis. Environmental Economics 5: 8–20. [Google Scholar]
- Kagermann, Henning, Wolf-Dieter Lukas, and Wolfgang Wahlster. 2011. Industrie 4.0: Mitdem Internet der Dinge auf dem Weg zur 4. Industriellen Revolution. VDI Nachrichten 13. Available online: http://www.wolfgang-wahlster.de/wordpress/wp-content/uploads/Industrie_4_0_Mit_dem_Internet_der_Dinge_auf_dem_Weg_zur_vierten_industriellen_Revolution_2.pdf (accessed on 11 May 2019).
- Kagermann, Henning, Wolfgang Wahlster, and Johannes Helbig. 2013. Secoring the Future of German Manufacturing Industry: Recommendations for Implementing the Strategic Initiative INDUSTRIE 4.0, Final Report of the Industrie 4.0 Working Group. Available online: https://www.din.de/blob/76902/e8cac883f42bf28536e7e8165993f1fd/recommendations-for-implementing-industry-4-0-data.pdf (accessed on 30 June 2019).
- Karpa, Waldemar. 2017. The Effect of Low-Carbon Innovations on Reducing Environmental Threats to Health. Journal of Innovation Economics & Management 24: 89–104. [Google Scholar]
- Kaya, Gizem, Merve Kumaş, and Burc Ulengin. 2017. The role of foreign direct investment and trade on carbon emissions in Turkey. Environmental Economics 8: 8–17. [Google Scholar] [CrossRef]
- Lee, Jay, Hossein Davari, Jaskaran Singh, and Vibhor Pandhare. 2018. Industrial Artificial Intelligence for Industry 4.0-based Manufacturing Systems. Manufacturing Letters 18: 20–23. [Google Scholar] [CrossRef]
- Manoukian, Jean-Grégoire. 2018. Industry 4.0 meets the 4th Wave of Environmentalism. Available online: https://enablon.com/blog/2018/06/28/industry-4-0-meets-the-4th-wave-of-environmentalism (accessed on 12 May 2019).
- Nguyen, Viet-Ha T., Thu-Trang Vuong, Manh-Tung Ho, and Quan-Hoang Vuong. 2019. The new politics of debt in the transition economy of Vietnam Hong-Kong. Austrian Journal of South-East Asian Studies 12: 91–110. [Google Scholar]
- Panayotou, Theodore. 1993. Empirical Tests and Policy Analysis of Environmental Degradation at Different Stages of Economic Development. Geneva: International Labour Organization. [Google Scholar]
- Park, Jacob, Joseph Sarkis, and Zhaohui Wu. 2010. Creating integrated business and environmental value within the context of China’s circular economy and ecological modernization. Journal of Cleaner Production 18: 1494–501. [Google Scholar] [CrossRef]
- Pouri, Maria J., and Lorenz M. Hilty. 2018. Conceptualizing the Digital Sharing Economy in the Context of Sustainability. Sustainability 12: 4453. [Google Scholar] [CrossRef]
- PricewaterhouseCoopers. 2016. Industry 4.0: Building the Digital Enterprise. 2016 Global Industry 4.0 Survey. Available online: https://www.pwc.com/id/en/CIPS/assets/industry-4.0-building-your-digital-enterprise.pdf (accessed on 12 May 2019).
- Shahbaz, Muhammad, and Avik Sinha. 2018. Environmental Kuznets Curve for CO2 Emission: A Literature Survey, MPRA Paper. Available online: https://mpra.ub.uni-muenchen.de/86281/ (accessed on 17 May 2019).
- Stern, David I. 2004. The rise and fall of the environmental Kuznets curve. World Development 32: 1419–39. [Google Scholar] [CrossRef]
- The Global Commission on the Economy and Climate. 2018. Unlocking the Inclusive Growth Story of the 21st Century: Accelerating Climate Action in Urgent Times. Available online: https://newclimateeconomy.report/2018/wp-content/uploads/sites/6/2018/09/NCE_2018_FULL-REPORT.pdf (accessed on 19 May 2019).
- The World Bank. 2019. World Development Indicators. Washington, DC: World Bank. Available online: https://data.worldbank.org/indicator (accessed on 17 May 2019).
- Tjoek, Patrick Wijaya, and PI Wu. 2018. Exploring the environmental Kuznets curve for CO2 and SO2 for Southeast Asia in the 21st century context. Environmental Economics 9: 7–21. [Google Scholar] [CrossRef]
- Vuong, Quan-Hoang. 2018. The (ir)rational consideration of the cost of science in transition economies. Nature Human Behaviour 2: 5. [Google Scholar] [CrossRef]
- Vuong, Quan-Hoang. 2019. Computational Entrepreneurship: From Economic Complexities to Interdisciplinary Research. Problems and Perspectives in Management 17: 117–29. [Google Scholar] [CrossRef][Green Version]
- Vuong, Quan-Hoang, Manh-Tung Ho, and NGUYỄN Minh Hoàng. 2019. Exploring OECD SDGs Pilot City’s 50-Year Time Series Data and Its Environmental Kuznets Curves. Working Paper No. PKU-1907. Available online: https://doi.org/10.31219/osf.io/aexcd (accessed on 4 July 2019).
- World Energy Statistics. 2018. Yearbook. Energy Consulting Services on the World Energy Market—Enerdata. Available online: https://yearbook.enerdata.ru/co2-fuel-combustion/world-CO2-intensity.html (accessed on 17 May 2019).
- WWF. 2017. Sustainability, Stability, Security. Available online: http://d2ouvy59p0dg6k.cloudfront.net/downloads/embargoed_14nov_rapport3s_en_27102017.pdf (accessed on 18 May 2019).
- Xu, Hengzhou, Chuanrong Zhang, Weidong Li, Wenjing Zhang, and Hongchun Yin. 2018. Economic growth and carbon emission in China. Proceedings of Rijeka Faculty of Economics 36: 11–28. [Google Scholar]
- Zaied, Younes Ben, Nidhaleddine Ben Cheikh, and Pascal Nguyen. 2017. Longrun analysis of Environmental Kuznets Curve in the Middle East and North Africa. Environmental Economics 8: 72–79. [Google Scholar] [CrossRef]
| 1 | Energy Strategy of Ukraine until 2030. Approved by the Cabinet of Ministers No.1071 on July 24, 2013. |
| 2 | The Energy Strategy of Ukraine until 2035 “Safety, Energy Efficiency and Competitiveness”. Approved by the Cabinet of Ministers No.1071 on June 6, 2018. |
© 2019 by the author. Licensee MDPI, Basel, Switzerland. This article is an open access article distributed under the terms and conditions of the Creative Commons Attribution (CC BY) license (http://creativecommons.org/licenses/by/4.0/).