1. Introduction
A fundamental principle of finance is the positive expected return-risk trade-off. In this paper, we examine the dynamic dependencies between future equity returns and the term structure of VIX futures, i.e., the curve that connects daily settlement prices of individual VIX futures contracts to maturities across time. This study extends the VIX futures-related literature by testing the market timing ability of the VIX futures term structure regarding future stock movements. We also investigate whether a steep upward-sloping term structure signals the late phase of a bullish trend and, conversely, if an inverted VIX futures term structure indicates a potential stock buying opportunity. The analysis of the VIX futures term structure is compelling because its shape may provide market signaling information (
Feldman et al. 2018).
The CBOE Volatility Index (known as VIX) was introduced by Chicago Board Options Exchange (CBOE) in 1993 and was the first publicly-available volatility index. In 2004, the CBOE Futures Exchange (CFE) introduced futures contracts with VIX as the underlying asset, while VIX options were launched in 2006. At any current point in time, the VIX futures price represents the risk-neutral expectation of VIX at the contract’s expiration and, as a result, can vary significantly from the actual VIX level (
Goltz and Stoyanov 2013). The simple cost-of-carry arbitrage relationship between future and spot prices cannot be obtained for VIX and its futures contracts, since VIX is not directly investable. The difference between future and cash prices is often called roll yield, and it is positive when the VIX futures term structure is in contango (when the spot price is lower than the future prices) and negative when it is in backwardation (when the spot price is higher than the future prices). Market participants call it a yield because this price differential results in a small amount being made or paid every day as the futures and the spot prices gradually converge.
One of the main factors behind VIX’s success, both in the literature and in practice, is related to the negative and asymmetric relationship of VIX variability with the underlying S&P500 returns. The information content of VIX, which has been extensively explored in the empirical literature, is found to be useful in determining the future dynamics of the S&P500 index (
Chung et al. 2011). Since the level of VIX is calculated based on S&P500 call and put option prices, it reflects any positive or negative event that influence stock prices. Therefore, a negative shock on the stock market will drive put options prices higher and call options prices lower. Conversely, a positive shock will result in lower S&P500 put prices and higher call prices. The net result on the level of VIX, i.e., if the volatility index will rise or fall, depends on the relative size of the opposing call and put prices move. If the increase in option prices outweighs the respective decrease, VIX will increase, and vice versa. When investors are bullish or bearish, this can be a rational reflection of expectations, or irrational enthusiasm/pessimism, or a combination of both (
Soydemir et al. 2017).
There is a long-standing academic interest in studying the relation between underlying equity returns and implied volatility (indicatively,
Fleming et al. 1995;
Whaley 2000;
Allen et al. 2013;
Sun and Wu 2018). Comparatively fewer studies focus on the relation between implied volatility and future returns of the underlying assets. In particular,
Copeland and Copeland (
1999) investigated whether VIX timing signals may generate positive excess returns, while
Simon and Wiggins (
2001) examined (along with other market derived indicators) the predictive power of VIX for S&P500 future contracts returns.
Giot (
2005) tested if high levels of implied volatility indicate oversold stock markets, and his findings suggest that extremely high levels of VIX may signal attractive buying opportunities, while
Banerjee et al. (
2007) and
Chung et al. (
2011) also lent support to using VIX as an indicator for gauging future excess returns.
Bollerslev et al. (
2009) and
Drechsler and Yaron (
2010) showed that the variance risk premium, the difference between implied (as proxied by the squared VIX index) and realized variance, significantly explains future stock market returns. Finally,
Lubnau and Todorova (
2015) analyzed the predictive ability of implied volatility in two U.S., two European, and one Asian market in forecasting stock returns.
With respect to the above framework, this paper is motivated by these earlier studies that examined the relationship between VIX and future equity returns and examined the market timing ability of the VIX futures term structure regarding future stock movements. The volatility term structure is, in principle, analogous to the term structure of interest rates and, thus, it may provide information about expected future short-term volatilities (
Krylova et al. 2009). In addition, it also reflects the different variance risk premia for different time horizons (
Johnson 2017). Thus, there are two potentially complementary explanations for a downward- (upward)-sloping VIX futures term structure: the first is that market participants expect return variability to decline (increase) in the future, and the second is that market participants demand a larger (smaller) risk premium for short-term variance risk exposure compared to long-term variance risk exposure. Therefore, we can reasonably assume that the term structure of VIX futures embeds more information regarding the equity market dynamics than spot VIX, which is a single market-derived estimate of future realized volatility.
The papers that are closer to the scope of the present paper are by
Johnson (
2017), who studied the shape of the VIX term structure with respect to the price of variance risk, the expected changes in the VIX, and future equity returns, and by
Feldman et al. (
2018), who attempted to determine whether the slope of the VIX futures curve can aid in detecting inflection points in the U.S. stock market. Both studies, however, used a different approach in estimating the term structure;
Johnson (
2017) constructed the VIX term structure by replicating the CBOE’s VIX calculation, but with target maturities longer than one month, while
Feldman et al. (
2018) employed the standardized difference between the seven- and four-month VIX futures prices. The approach of this article differs from the previous literature in a few ways. First, we estimate the VIX futures term structure by fitting a linear model of the available futures prices and spot VIX level as a function of time to maturity based on least squares criterion. The proposed methodology of estimating the VIX futures term structure does not require an interpolation scheme in order to construct futures contracts with fixed constant maturities (as in
Johnson 2017), nor an exponential moving average smoothing process in order to reduce the noise of the VIX futures curve (
as in Feldman et al. 2018). In addition, we follow an approach similar to that of
Giot (
2005), who divided recent VIX history into 20 equally-spaced percentiles and examined the underlying future returns following each of these percentiles, in order to examine whether extremely high levels of the VIX futures term structure may signal profitable buying or selling opportunities. Finally, we incorporate in our empirical analysis the well-documented asymmetric risk–return relation, in order to investigate whether there is a different market reaction depending on the sign of the VIX term structure.
The paper proceeds as follows: the next section includes an analysis of the proposed estimation of the VIX futures term structure and its statistical attributes.
Section 3 describes the empirical analysis of the relationship between the VIX futures term structure and S&P500 returns, while
Section 4 discusses the relevant findings and their implications. Finally,
Section 5 includes the concluding remarks.
2. The VIX Futures Term Structure
The CBOE Futures Exchange (CFE) launched VIX futures in March 2004. For a detailed description of the VIX futures market and its trading application, see
Fassas and Siriopoulos (
2012). According to the contract specifications, the exchange “may list for trading up to nine near-term serial months and five months on the February quarterly cycle.” In practice, during the first two years of trading of the VIX futures contracts (until 8 March 2006), there were four contracts listed. The CFE gradually increased the listed contracts series from four to six on 9 March 2006, to seven on 24 April 2006, to nine on 23 October 2006, and finally, to ten on 22 April 2008 (this is still the number of series currently trading).
The dataset of the current analysis consists of the daily closing prices of spot VIX and the seven nearest VIX futures for the period from 4 January 2010–29 December 2017. The daily prices were retrieved from the website of the CBOE Futures Exchange. We set the beginning date of our sample in 2010, because that was the year in which the average daily volume of VIX futures began to increase significantly. According to CBOE data, the average daily volume was 4543 in 2009 (approximately at the same level compared to 2007 and 2008), while in 2010, it reached 17,430; in 2016, the average daily volume reached 238,773 contracts.
The present estimation of the VIX futures term structure (following
Äijö (
2008),
Krylova et al. (
2009), and
Fassas (
2012)) was conducted on each trading day by fitting a linear model of the available futures prices and spot VIX level as a function of time to maturity based on the least squares criterion using the following specification:
in which FVIX
i,t represents the price of VIX futures contract i on day t and TtM
i,t is the time to maturity in days for the respective contract i on day t. Spot VIX was considered as the price for VIX futures with maturity equal to zero. Everyday t, we considered seven futures contracts and the spot VIX. The estimated VIX futures term structure was the daily estimated coefficient β.
Table 1 reports the descriptive statistics of the estimated VIX futures term structure time-series
1. The estimated term structure is in units of volatility percentage points per year. Thus, the mean VIX term structure estimate of 2.32 indicates that the level of VIX futures price increases, on average, by 2.32 volatility percentage points per one-year horizon, or about 0.193 percentage points per month. A simple
t-test for means and the Wilcoxon signed ranks test for medians showed that the upward-sloping term structure was statistically significant (at the 1% significance level). Therefore, on average, during the period under examination (January 2010–December 2017), the VIX futures term structure was upward-sloping, i.e., short-term VIX futures traded at lower price than long-term contracts.
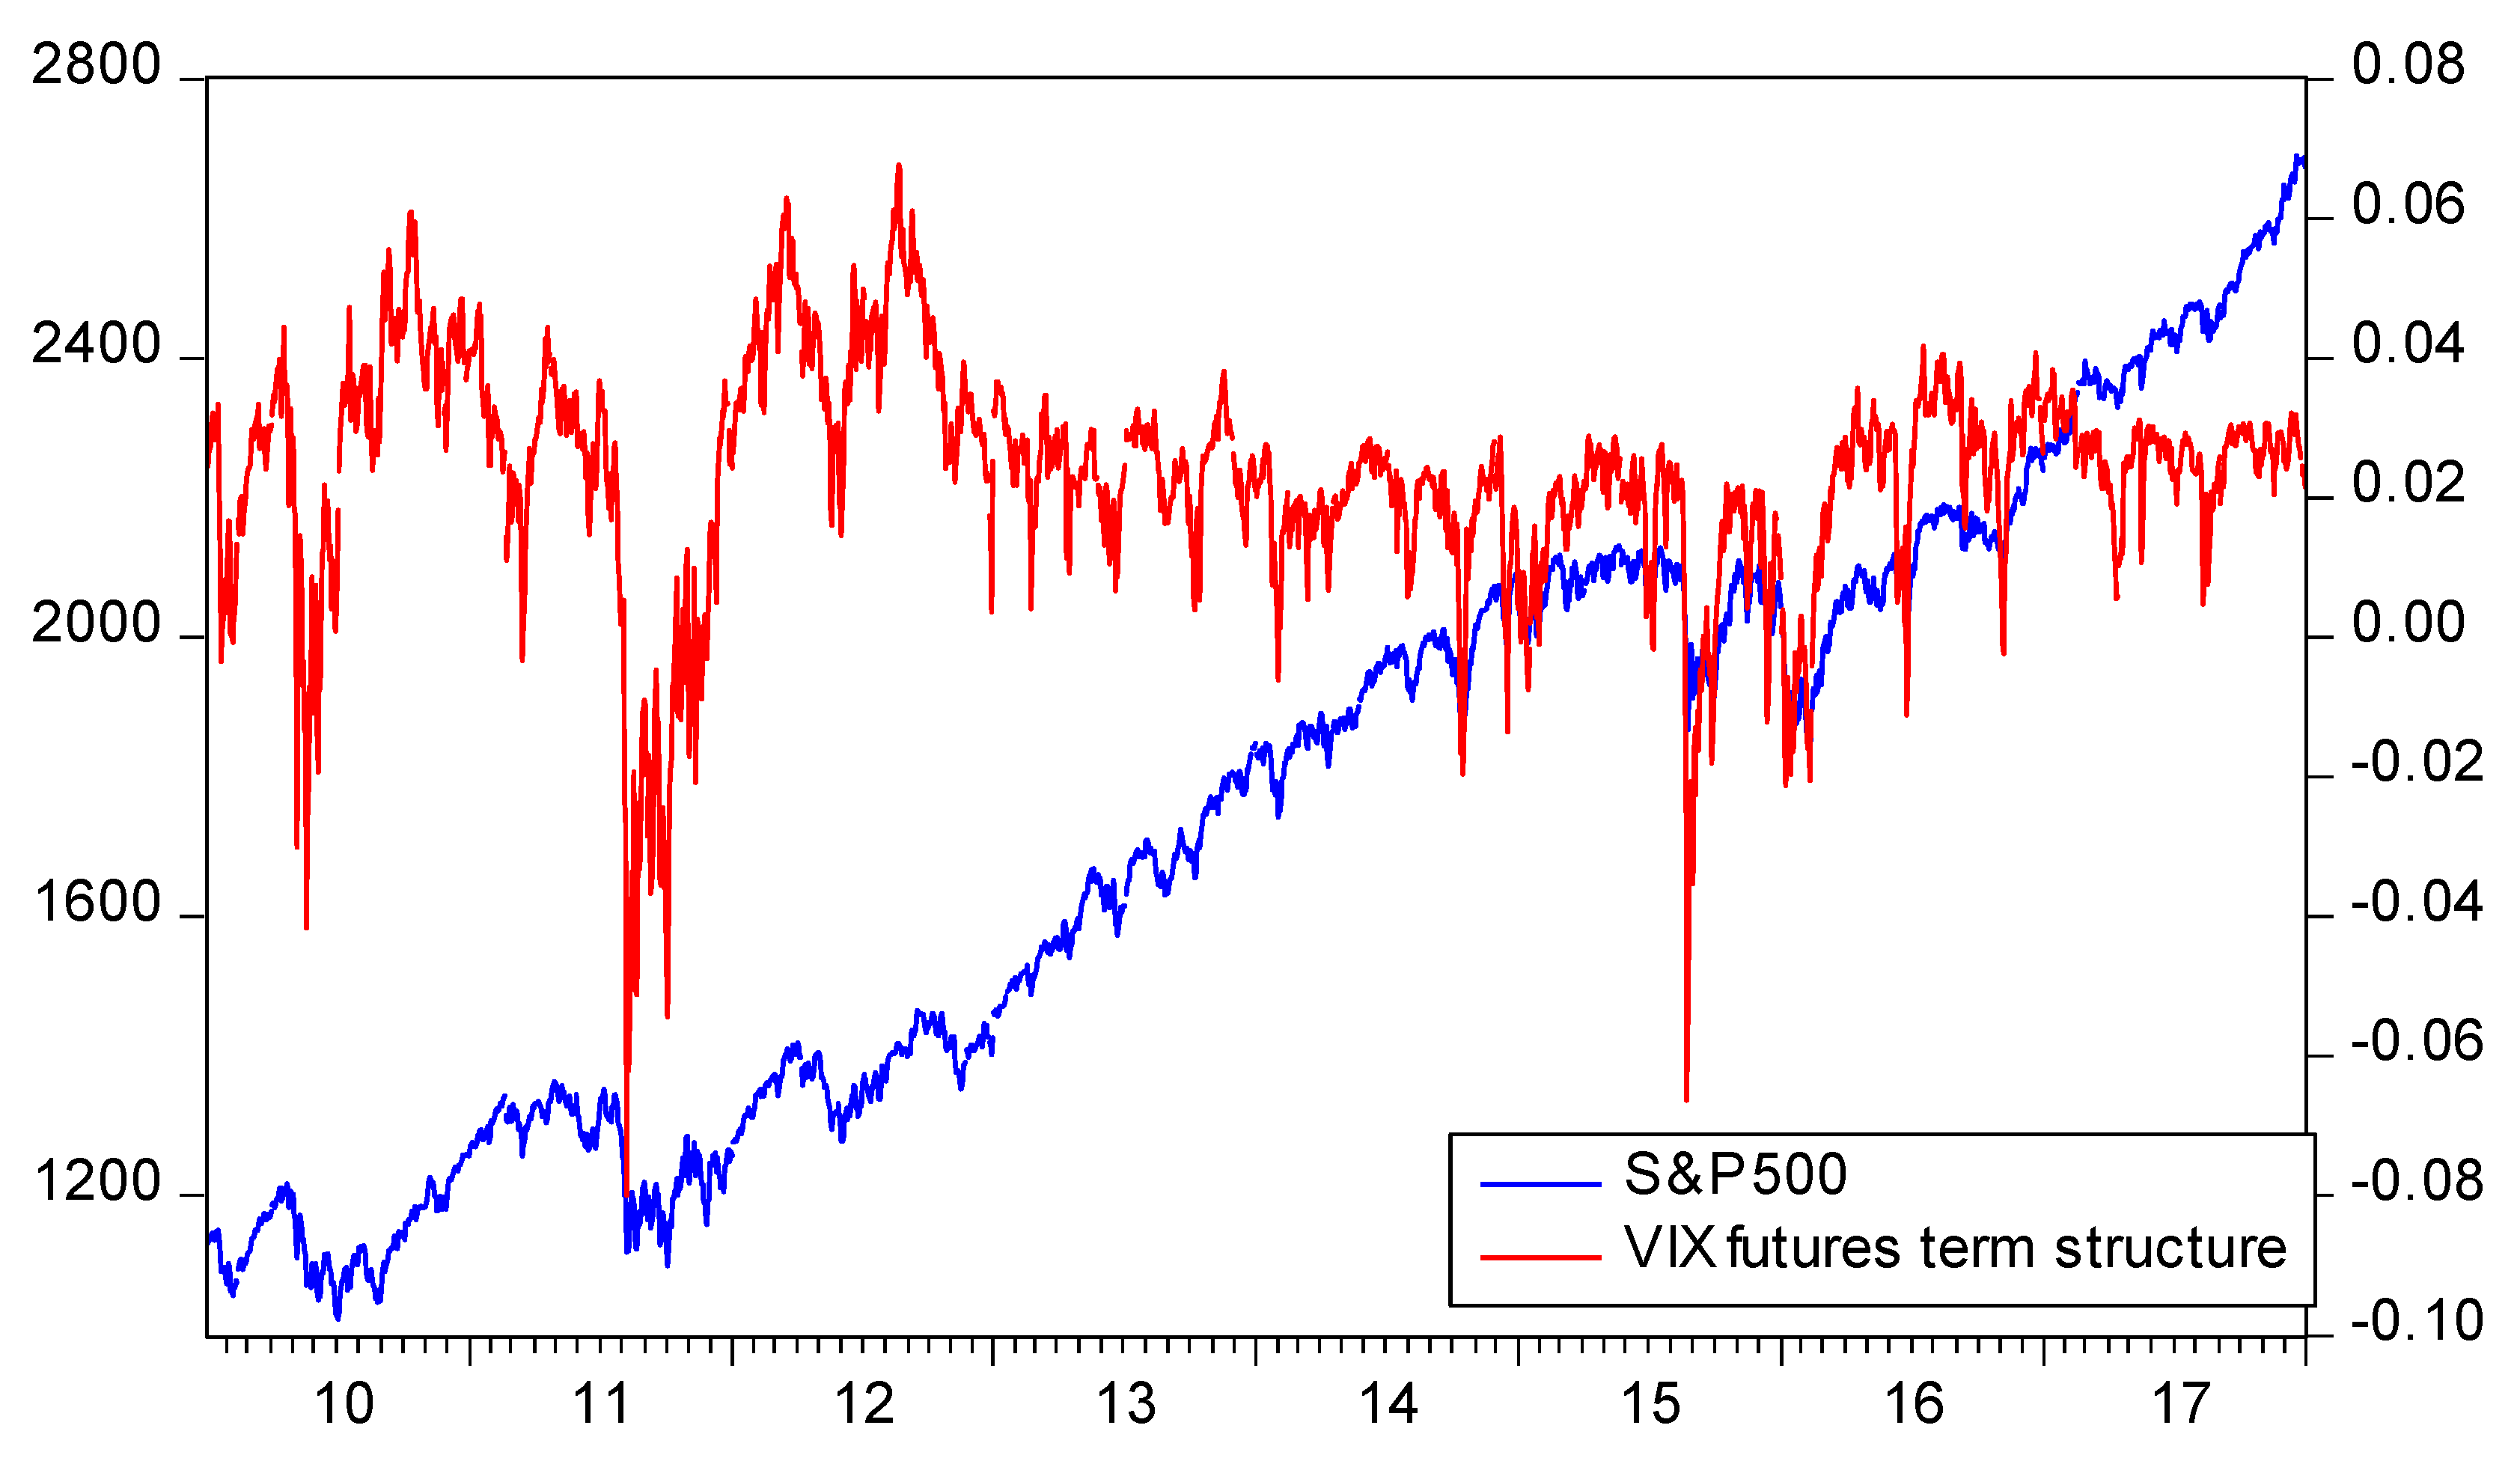
However, the range of observations was relatively large, suggesting that the VIX futures term structure was considerably time varying. In fact, as shown in
Figure 1, the VIX futures term structure may change considerably and turn from upward-sloping to downward-sloping, and vice versa, in a limited period of time. Furthermore, although the estimated term structure tended to be upward-sloping, there were also periods of a downward-sloping term during the time under review. For example, for the larger part of 2010 and 2011, the slope changed sign several times as stock prices experienced relatively high variability over the first two years of the bull market (which began in March 2009 and still holds).
After 2012, there were relatively limited instances of backwardation with most notable one in August 2015 (during the late summer 2015 selloff, which proved short-lived). Actually, during the last year (2017), the VIX term structure did not turn negative once, as VIX reached exceptionally low prices and remained in extremely low levels for an extended period of time. With VIX at such low levels, it is not surprising that VIX futures traded at a premium. Theoretically, when spot VIX is very low compared to its long-term average level, as was true during the 2016–2017 period, VIX futures trade at a premium because market participants expect that VIX will rise in the future. Conversely, when VIX is very high, VIX futures trade at a discount, implying that spot VIX will eventually decline to its normal levels.
3. The Relationship between the VIX Futures Term Structure and Future S&P500 Returns
Market participants very often use extreme levels of the VIX as a contrarian market timing indicator for the equity market. Generally, high levels of VIX are usually considered as a capitulation signal that indicates under-valuation of stock prices and thus, potential buying opportunities. Conversely, abnormal low VIX levels indicate potentially excessive complacency and, thus, may signal a market correction (
Simon 2003). This paper extends the use of VIX as a market timing signal by examining the information content of the VIX futures term structure regarding future S&P500 returns. Since the VIX futures premium/discount (compared to cash VIX) can be related to investors’ risk aversion, it may be informative regarding future stock returns.
In order to test the relationship of stock market returns and the VIX futures term structure, we ran a regression analysis of the equity index returns (R
t) against the estimated slope measure (Slope
t). Furthermore, this relationship was tested over several frequencies (for 1 day, 1 week, 2 weeks, 1 month, and 2 months) in order to test the potential different dynamics of this relationship. In order to deal with the overlapping observations problem, we employed heteroscedasticity and autocorrelation consistent Newey–West standard errors. Additionally, we separated the VIX futures term structure into positive (Slope
t+) and negative (Slope
t−), in order to take into consideration whether the futures term structure was in contango or in backwardation, respectively. As a result, the assessment of the relationship between the VIX futures term structure and future S&P500 returns was conducted using the following specification:
in which, R
t+K represents percentage returns in S&P500 in the subsequent K period (where K = 1 day, 1 week, 1 month, and 1 quarter), Slope
+t is the VIX futures term structure on day t, if positive, and Slope
−t is the VIX futures term structure on day t, if negative.
Additionally, in order to assess if extreme values of the VIX futures term structure (positive and negative) can be used as market timing indicators, we followed the example of
Giot (
2005) and examined the following specification. In order to quantify extreme levels of the term structure, we used a classification based on the rolling 20 equally-spaced percentiles (from 5–95 percentiles) of the estimated VIX futures slope at any given day t. In particular, at any given time t, we considered the information set available at that time, which was the past history of the VIX term structure up to time t−1. Then, Slope
t was compared to these 20 equally-spaced percentiles and ranked accordingly; if Slope
t was very high (i.e., steep upward-sloping), then it would be ranked much closer to 20, while if Slope
t was rather low (i.e., steeply backwardated), it would be ranked much closer to 1. After we classified each daily level of the estimated term structure, we calculated the forward returns of S&P500 for 4 different investment horizons and ran the following specification:
in which, R
t+K represents percentage returns in S&P500 in the subsequent K period (where K = 1 day, 1 week, 1 month, and 1 quarter) and D1
t, D2
t, …, D20
t are dummy variables that take the value of 1 if Slope
t falls into the particular percentile and 0 otherwise.
4. Empirical Results and Discussion
The usual regression statistics for Equation (2) for all four time horizons are given in
Table 2. In particular, we include the coefficient estimators and their Newey–West standard errors, the adjusted R-square, the F-statistic, and the Durbin–Watson statistic. The coefficient of negative slope (Slope
−t) had a negative sign in all cases, and it was statistically significant in the three out of four time horizons under review (except the monthly horizon). This means that whenever the estimated VIX term structure took negative values (i.e., the VIX futures were in backwardation), the subsequent future return of S&P500 was positive. It is noteworthy that the Slope
−t coefficient increased (in absolute terms) as the time horizon increased (−0.1687 for daily returns vs. −1.1809 for quarterly returns), indicating that the contrarian effect was stronger in the long run. On the contrary, the coefficient of the positive term structure (Slope+t) was not statistically significant in any instance, suggesting that when the VIX futures term structure was in contango (as it normally is), there was no meaningful market timing signal for S&P500 returns. Therefore, the upward-sloping VIX futures term structure cannot be associated with either subsequent market weakness or strength. This conclusion is closer to
Lubnau and Todorova (
2015), who argued that low implied volatility levels did not necessarily indicate complacency as
Simon and Wiggins (
2001) and
Giot (
2005) suggested. Furthermore, the coefficients of the negative slope were in all cases higher (in absolute values) than the respective coefficients of the positive slope, and these differences were statistically significant. Finally, we should note that the adjusted R-squared estimates were low and ranging from 0.01 (for daily observations) to 0.035 (for quarterly observations), but still, these results are economically significant and potentially useful, since we are talking about future returns (
Drechsler and Yaron,
2010). For comparison purposes,
Fassas and Papadamou (
2018) reported adjusted R-squared measures regarding the predictive power of the variance premium ranging from just above 0.01–0.09, while
Bollerslev et al. (
2009) reported measures ranging from 0–0.04 at a monthly horizon, and
Drechsler and Yaron (
2010) reported an estimate of 0.03.
The results of Equation (3) (reported in
Table 3) are comparable and suggest that VIX futures term structure can be used as a stock market timing tool. In particular, the lower percentiles (D1–D4, which correspond to 5–20 percentiles) coefficients were statistically significant in all cases and had statistically higher coefficients compared to the respective higher percentile coefficients (which correspond to the positive values of the VIX futures term structure, i.e., when the term structure is in contango). Similar to the results regarding Equation (2), the coefficients for the low percentiles (which corresponded to the negative values of the VIX futures term structure) increased as the time horizon increased. The R-squared estimates were also comparable with the respective estimates of Equation (2). Our empirical findings were not surprising and consistent with prior findings related to VIX and future returns (
Giot 2005,
Banerjee et al. 2007), which shows the existence of a significant negative volatility risk premium.
Thus, our empirical findings showed that VIX futures term structure can indeed be used as a stock market timing tool, as particularly the negative slope of the structure can be considered as a contrarian market timing indicator. This finding is consistent with
Feldman et al. (
2018), who showed that the VIX futures curve captures pivotal moments in the U.S. stock market. In addition, it also coincides with investors’ view that a downward-sloping VIX term structure is as an indication of an oversold market. The VIX futures term structure will ultimately flatten out, and according to the empirical history, this will happen when the stock market advances. The downward-sloping VIX futures term structure suggests that short-term volatility is relatively high compared to its long-term level and that investors expect a decrease in volatility in the future (
Zhang et al. 2010). This may prove bullish for the stock market as there is an inverse relationship between VIX and S&P500 returns (usually when VIX declines, S&P500 advances).
In conclusion, the VIX term structure, besides its usefulness as a market timing signal when it is in backwardation, can also be used for constructing trading strategies that attempt to earn the term structure risk premium, when it is in contango (which is historically the case). An investor that simultaneously buys the VIX and S&P500 Index puts for the same expiration month can capture this volatility premium. At expiration, the prices of spot and future VIX should converge; therefore, either spot VIX will rise or VIX futures price will fall. In the first case, if spot VIX advances, the VIX puts will be worthless, but most likely, the S&P500 puts will be profitable (since when VIX rises, S&P500 falls). In the second case, if spot VIX does not increase, the VIX futures price will fall, and the VIX puts will become profitable (since their pricing is based on the futures price and not on the cash VIX value).
5. Conclusions
The CBOE Volatility Index (VIX), originally introduced in 1993 and redesigned in 2003, is a widely-used measure of investors’ estimate of future realized volatility, as well as a “fear gauge” in the stock market (
Whaley 2000). VIX futures, which were introduced in 2004, offer investors the opportunity to attain more effective exposure to volatility compared to variance swaps and delta-neutral option strategies (such as straddles and strangles).
The VIX term structure, which captures the difference between the prices of short-term and long-term VIX futures contracts, should offer more information than the current VIX level, as it includes both the current level of implied volatility and the expectations regarding the future levels of implied volatility (as proxied by VIX futures). The present study contributes to the fast-growing literature on the VIX futures term structure by examining the relationship between the VIX futures term structure and S&P500 future returns. More precisely, we examined whether a steep upward-sloping VIX futures term structure (known as contango) signals the late phase of a bullish move and, conversely, whether an extreme negative term structure (known as backwardation) indicates an oversold market, as many investors believe. We showed that our estimated term structure measure can serve as an important signal for market timing. Understanding the dynamics of the equity returns and volatility relation has important implications for portfolio and risk management and asset pricing.
The initial part of our analysis involved the estimation of the VIX futures term structure and the description of its statistical characteristics. The VIX futures term structure varies heavily over time as it generally tends to be upward-sloping, but also persistent periods of downward-sloping term structure were recorded. Subsequently, we investigated the relationship between the estimated term structure of VIX futures and the future underlying equity returns. In particular, we divided the estimated slope price history into twenty equally-spaced rolling percentiles and investigated the S&P500 future returns for four different holding periods (one day, week, month, and quarter). Our main empirical finding can be summarized in the following dimension: a negative VIX futures term structure indicates oversold stock prices and may signal an attractive buying opportunity.


