
Safety Evaluation of Evacuation Routes in Central Tokyo Assuming a Large-Scale Evacuation in Case of Earthquake Disasters


Abstract
:1. Introduction
2. Related Work
3. ACO Principles and Basic Model
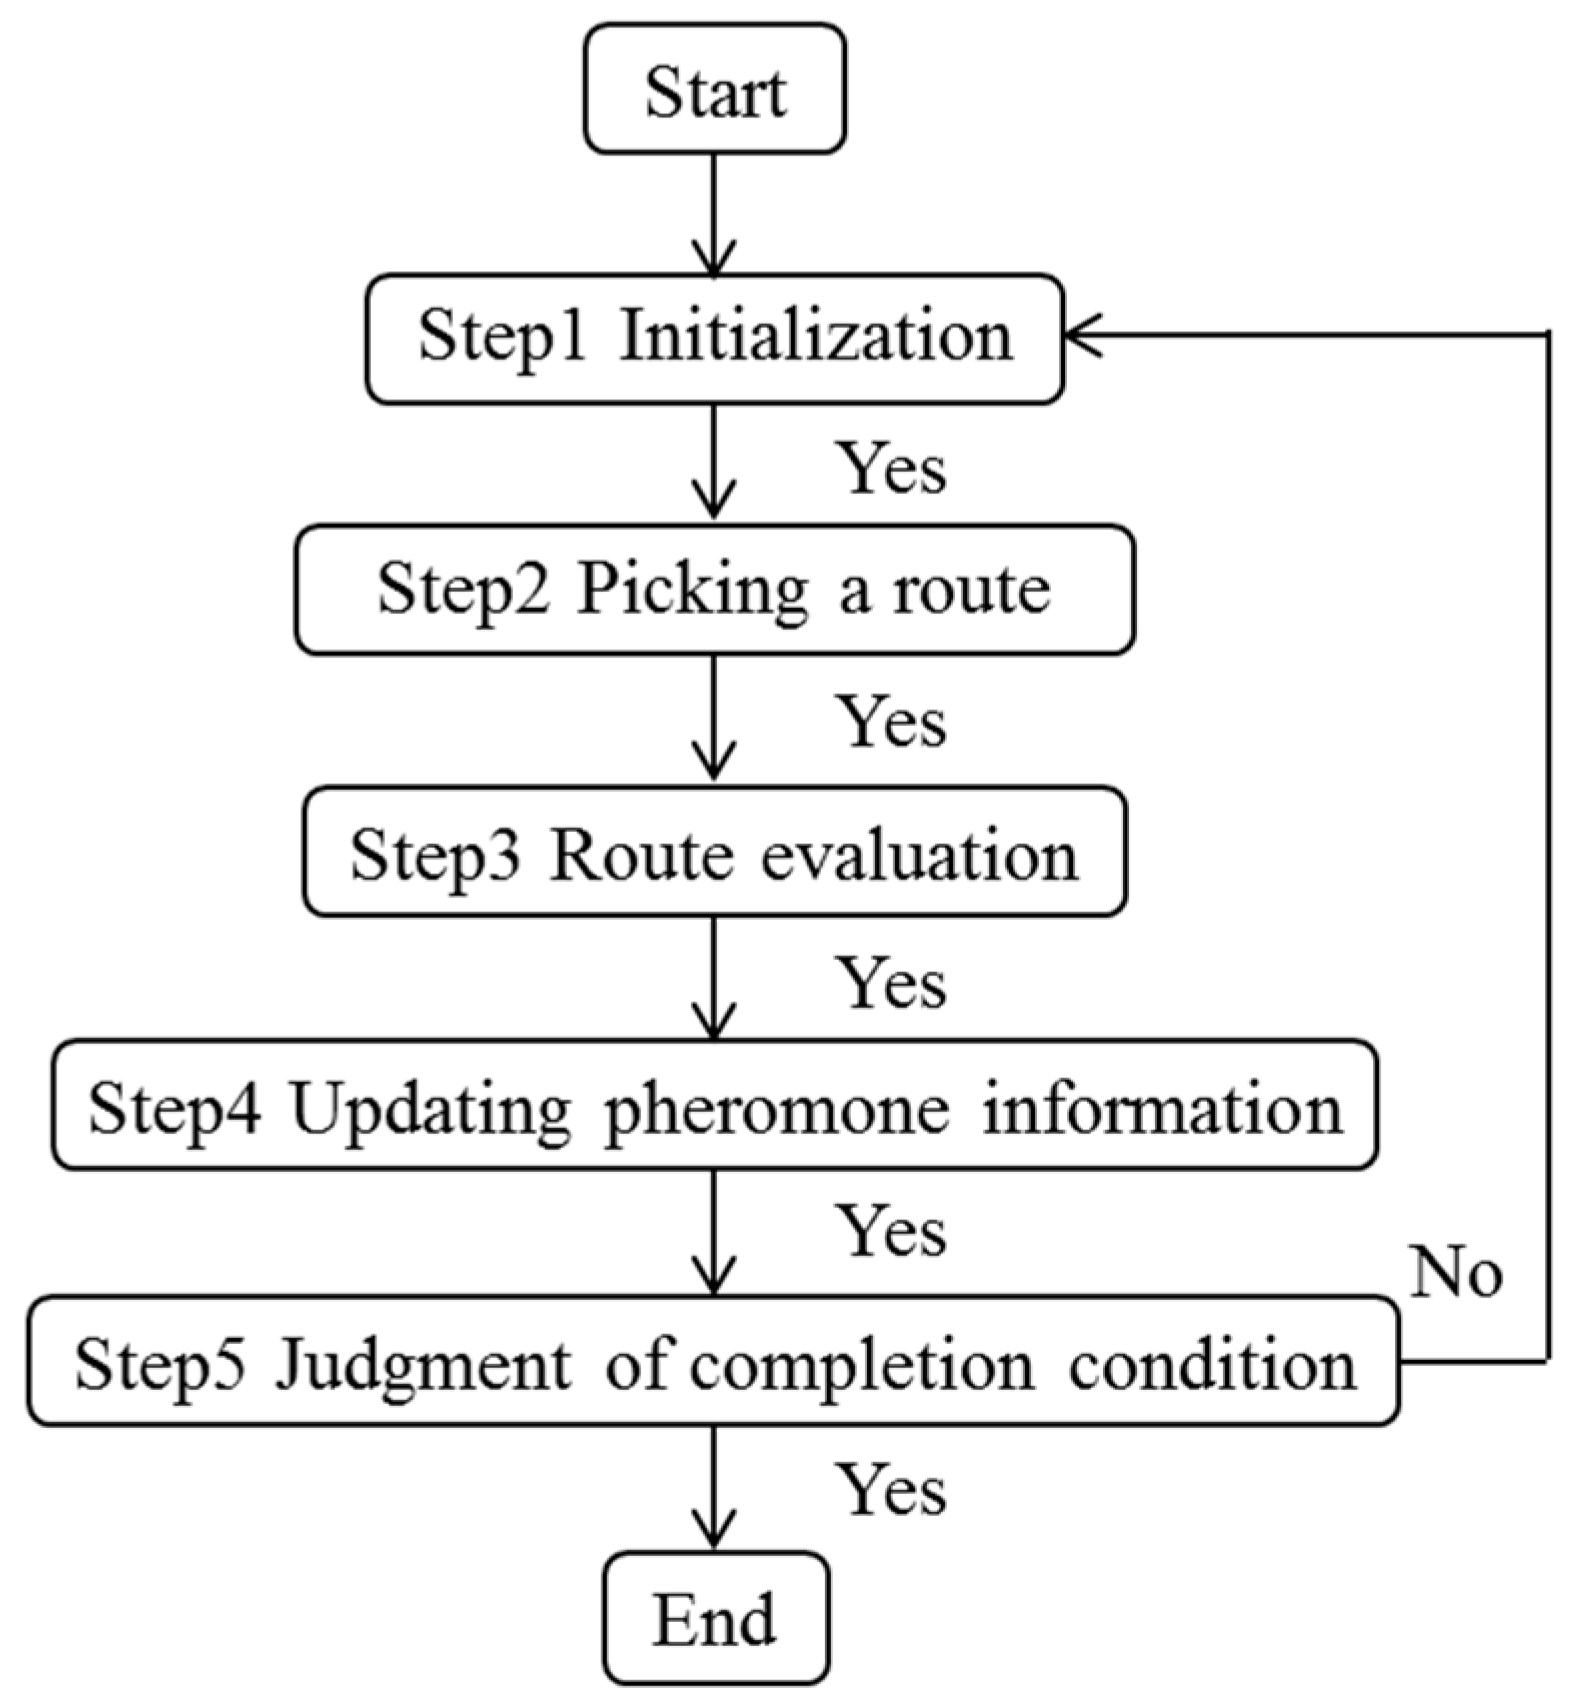
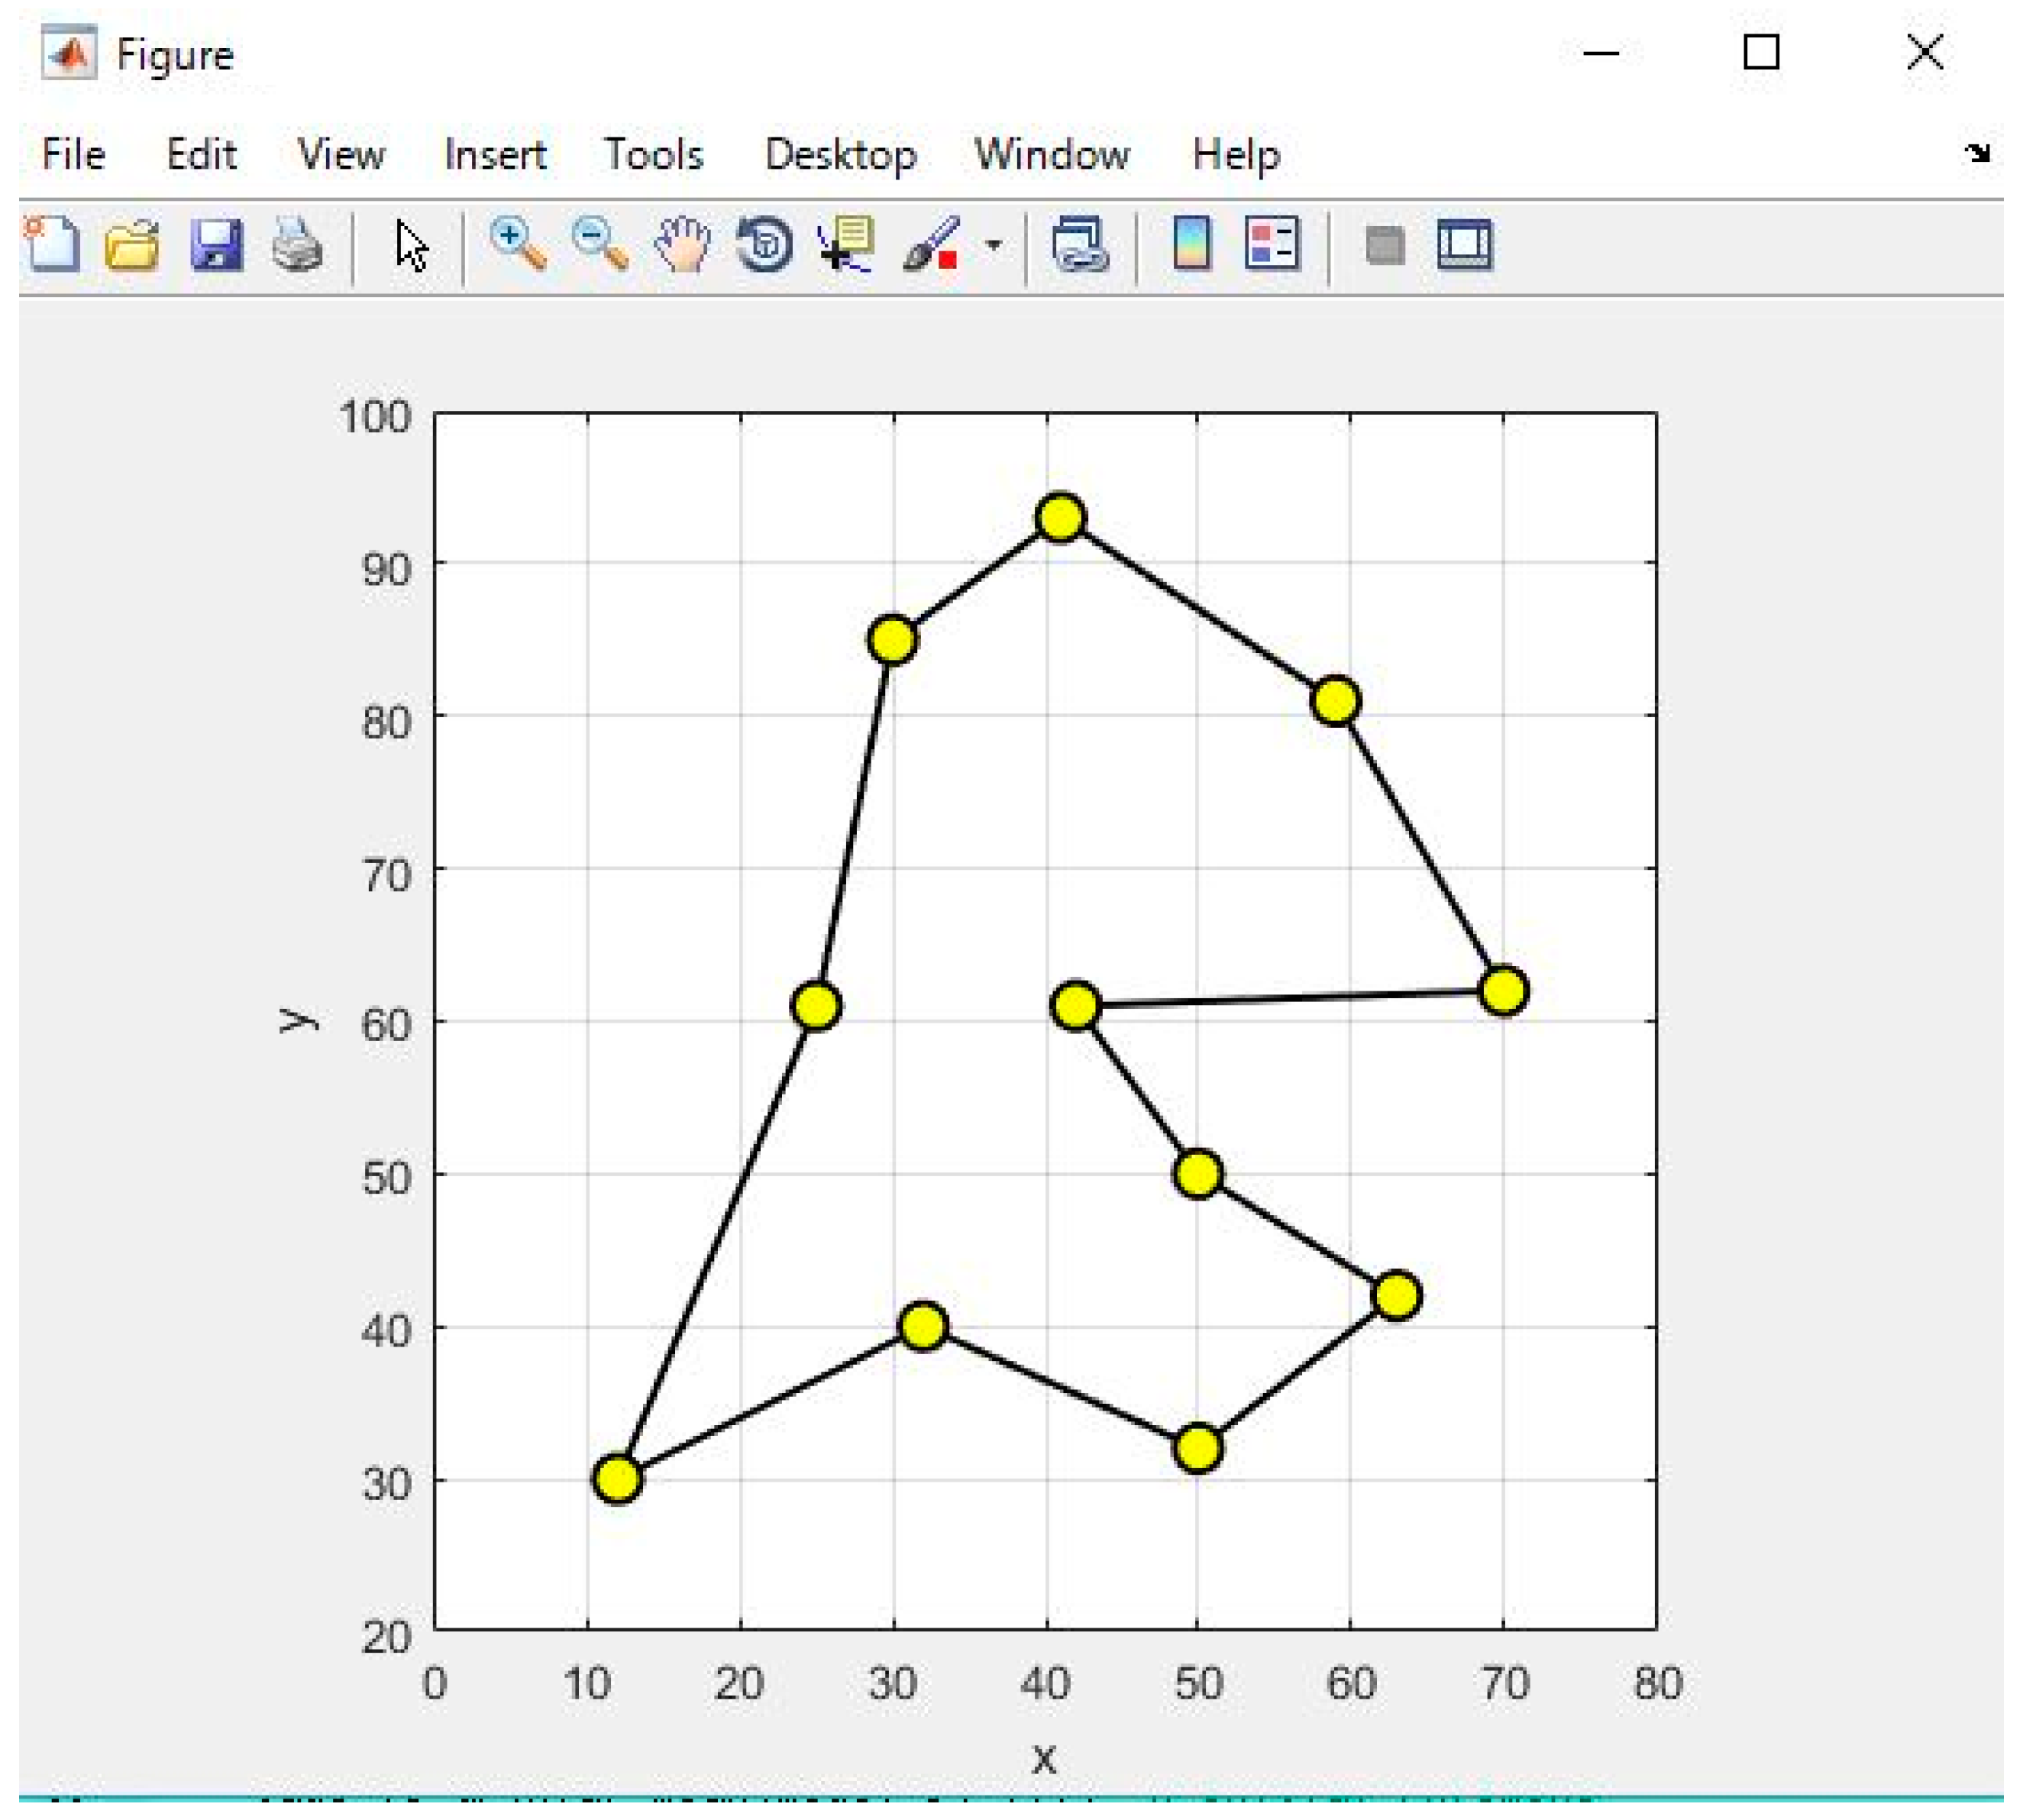
3.1. ACO Algorithm
- Step 1:
- Initial pheromone information will be attached to all routes, and the initial location of each agent will be set at random.
- Step 2:
- Each agent will randomly pick a route based on pheromone information and heuristic information.
- Step 3:
- The total distance of the collection of routes (circuit) selected by each agent in Step2 will be calculated.
- Step 4:
- Based on the total distance of the circuit mentioned in Step3, pheromone information will be attached to each route in the circuit. At the same time, a certain amount of pheromone put on all routes will be vaporized.
- Step 5:
- The process will go back to Step2, if the number of searches is below the maximum amount, and if it goes over the maximum number, the process will end here.
3.2. Stochastic Selection Method of Routes
4. Selection of Target Area and Creating Road Network Data
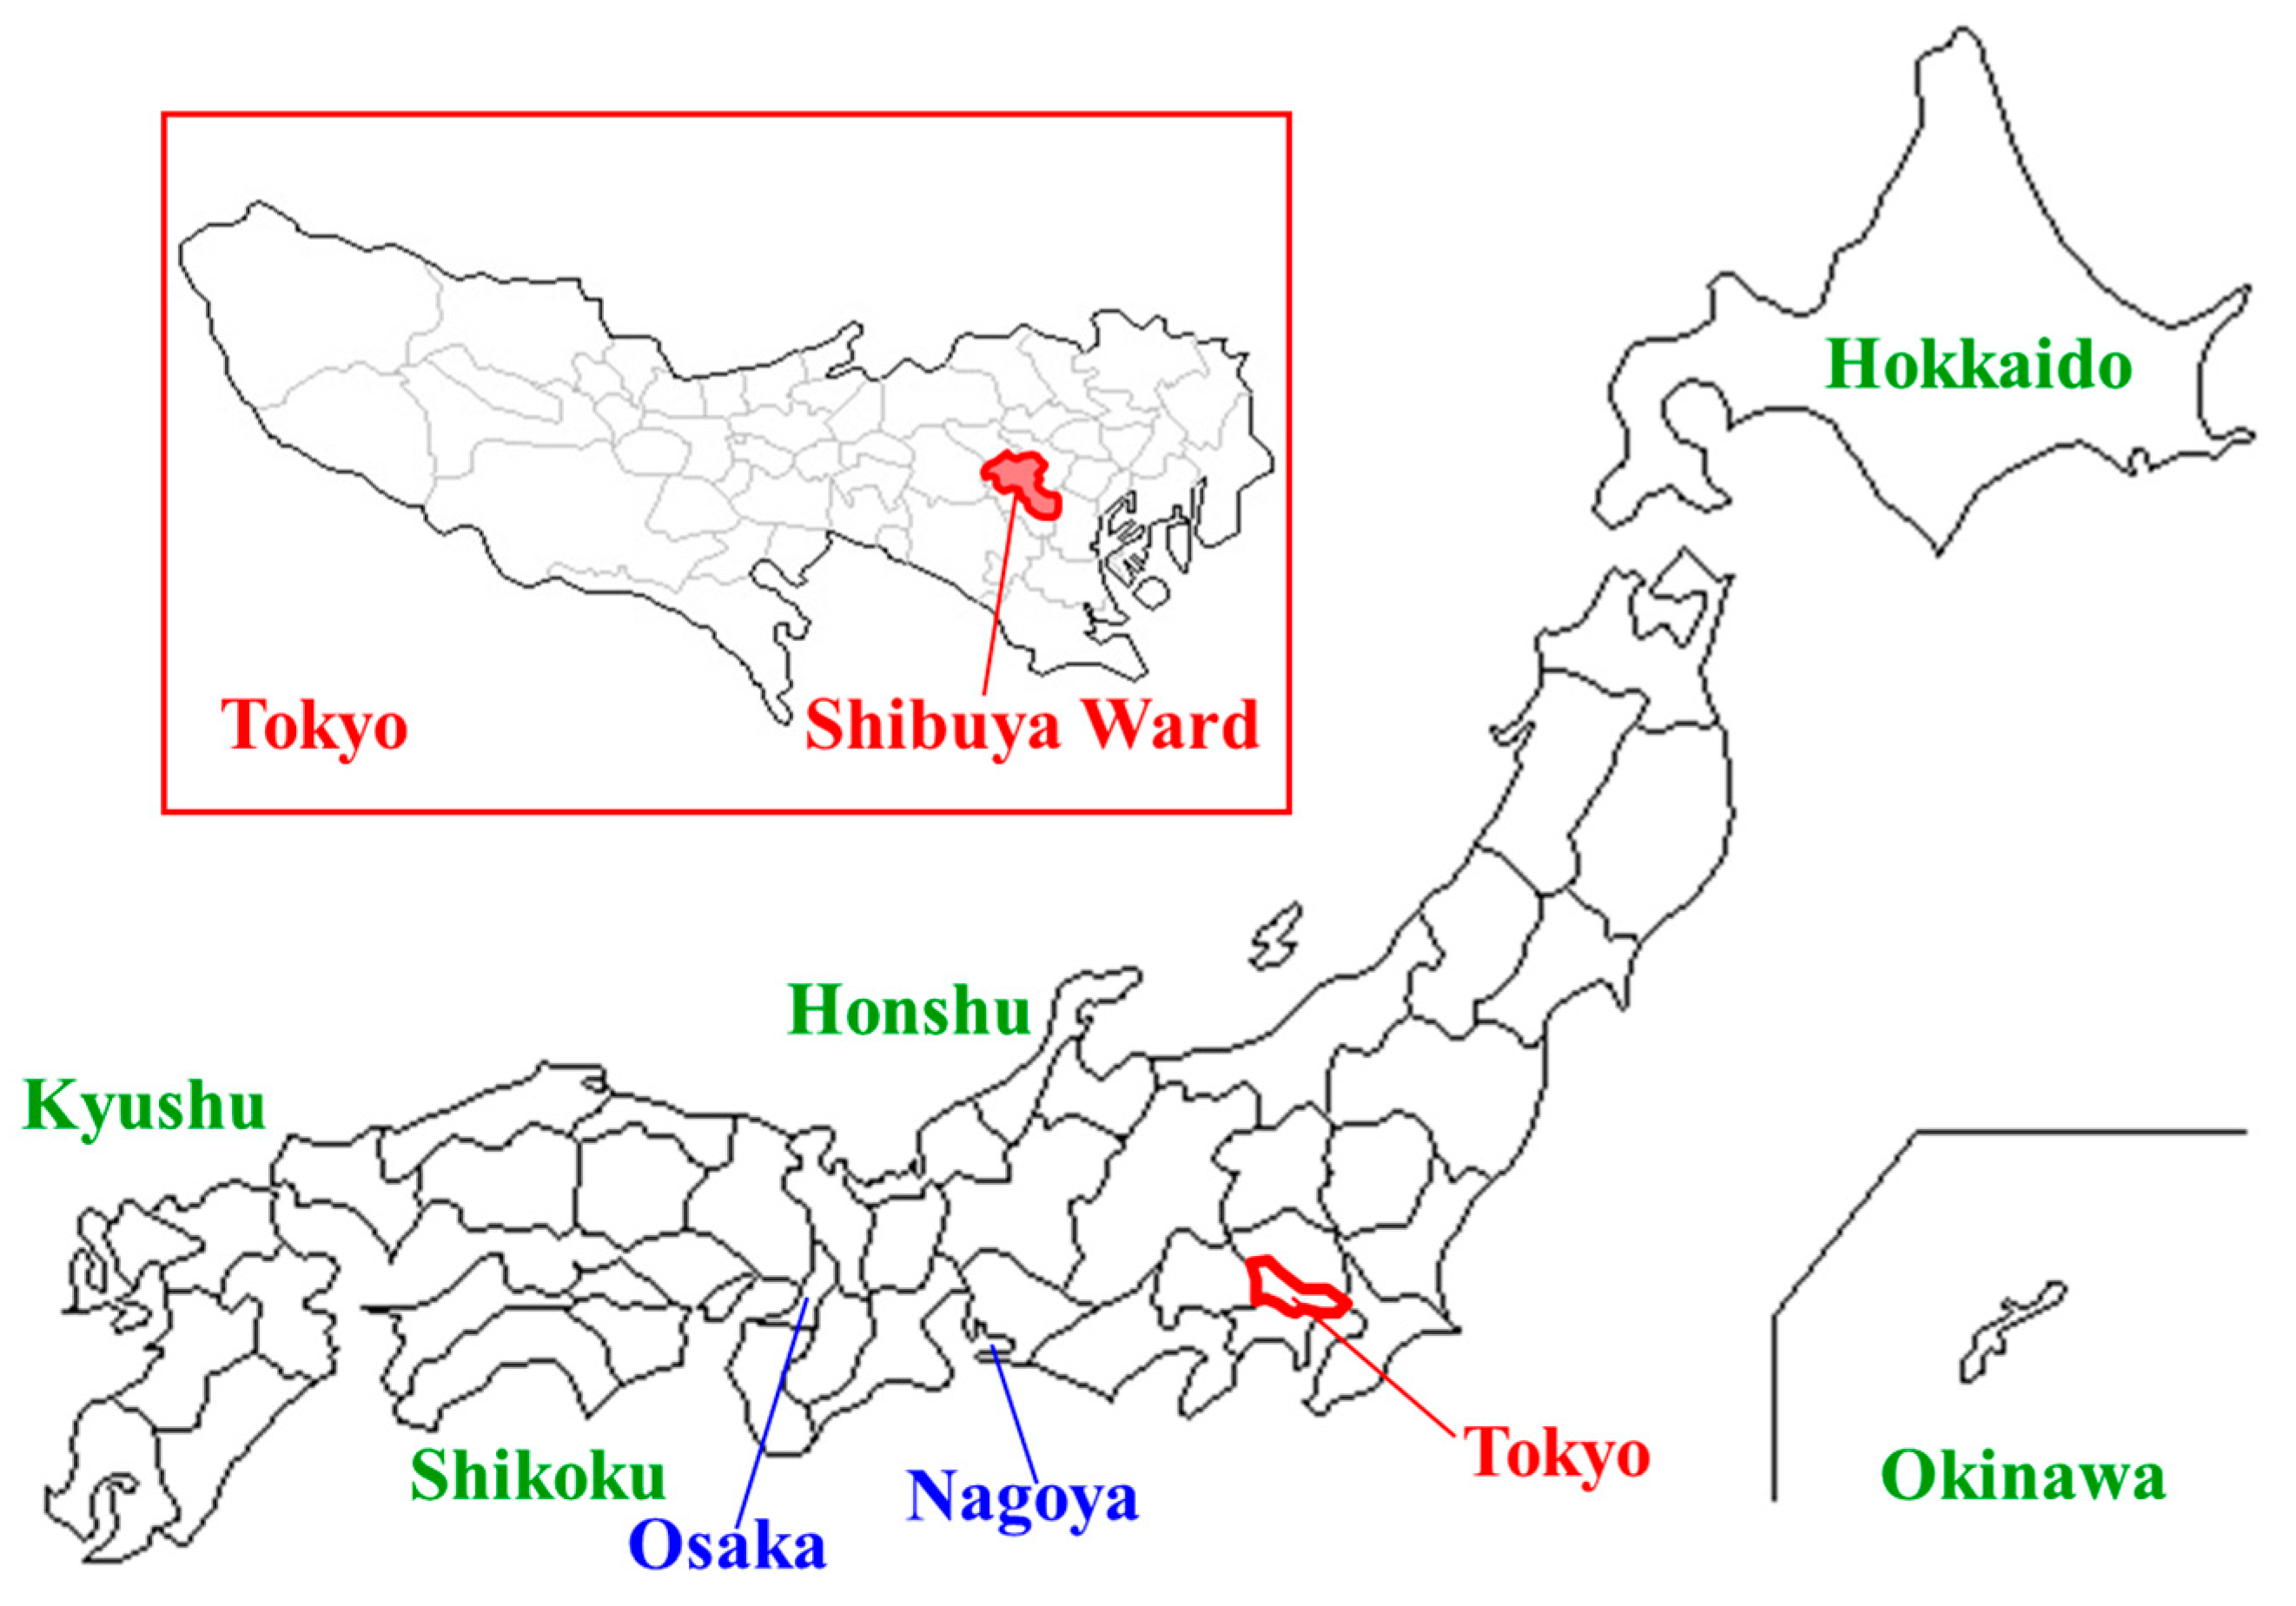
4.1. Selection of Target Area
4.2. Evacuation Rules
4.2.1. Order of Evacuation
4.2.2. Assignment of Evacuation Sites
4.2.3. Evacuation Distance and Time for Evacuation Routes
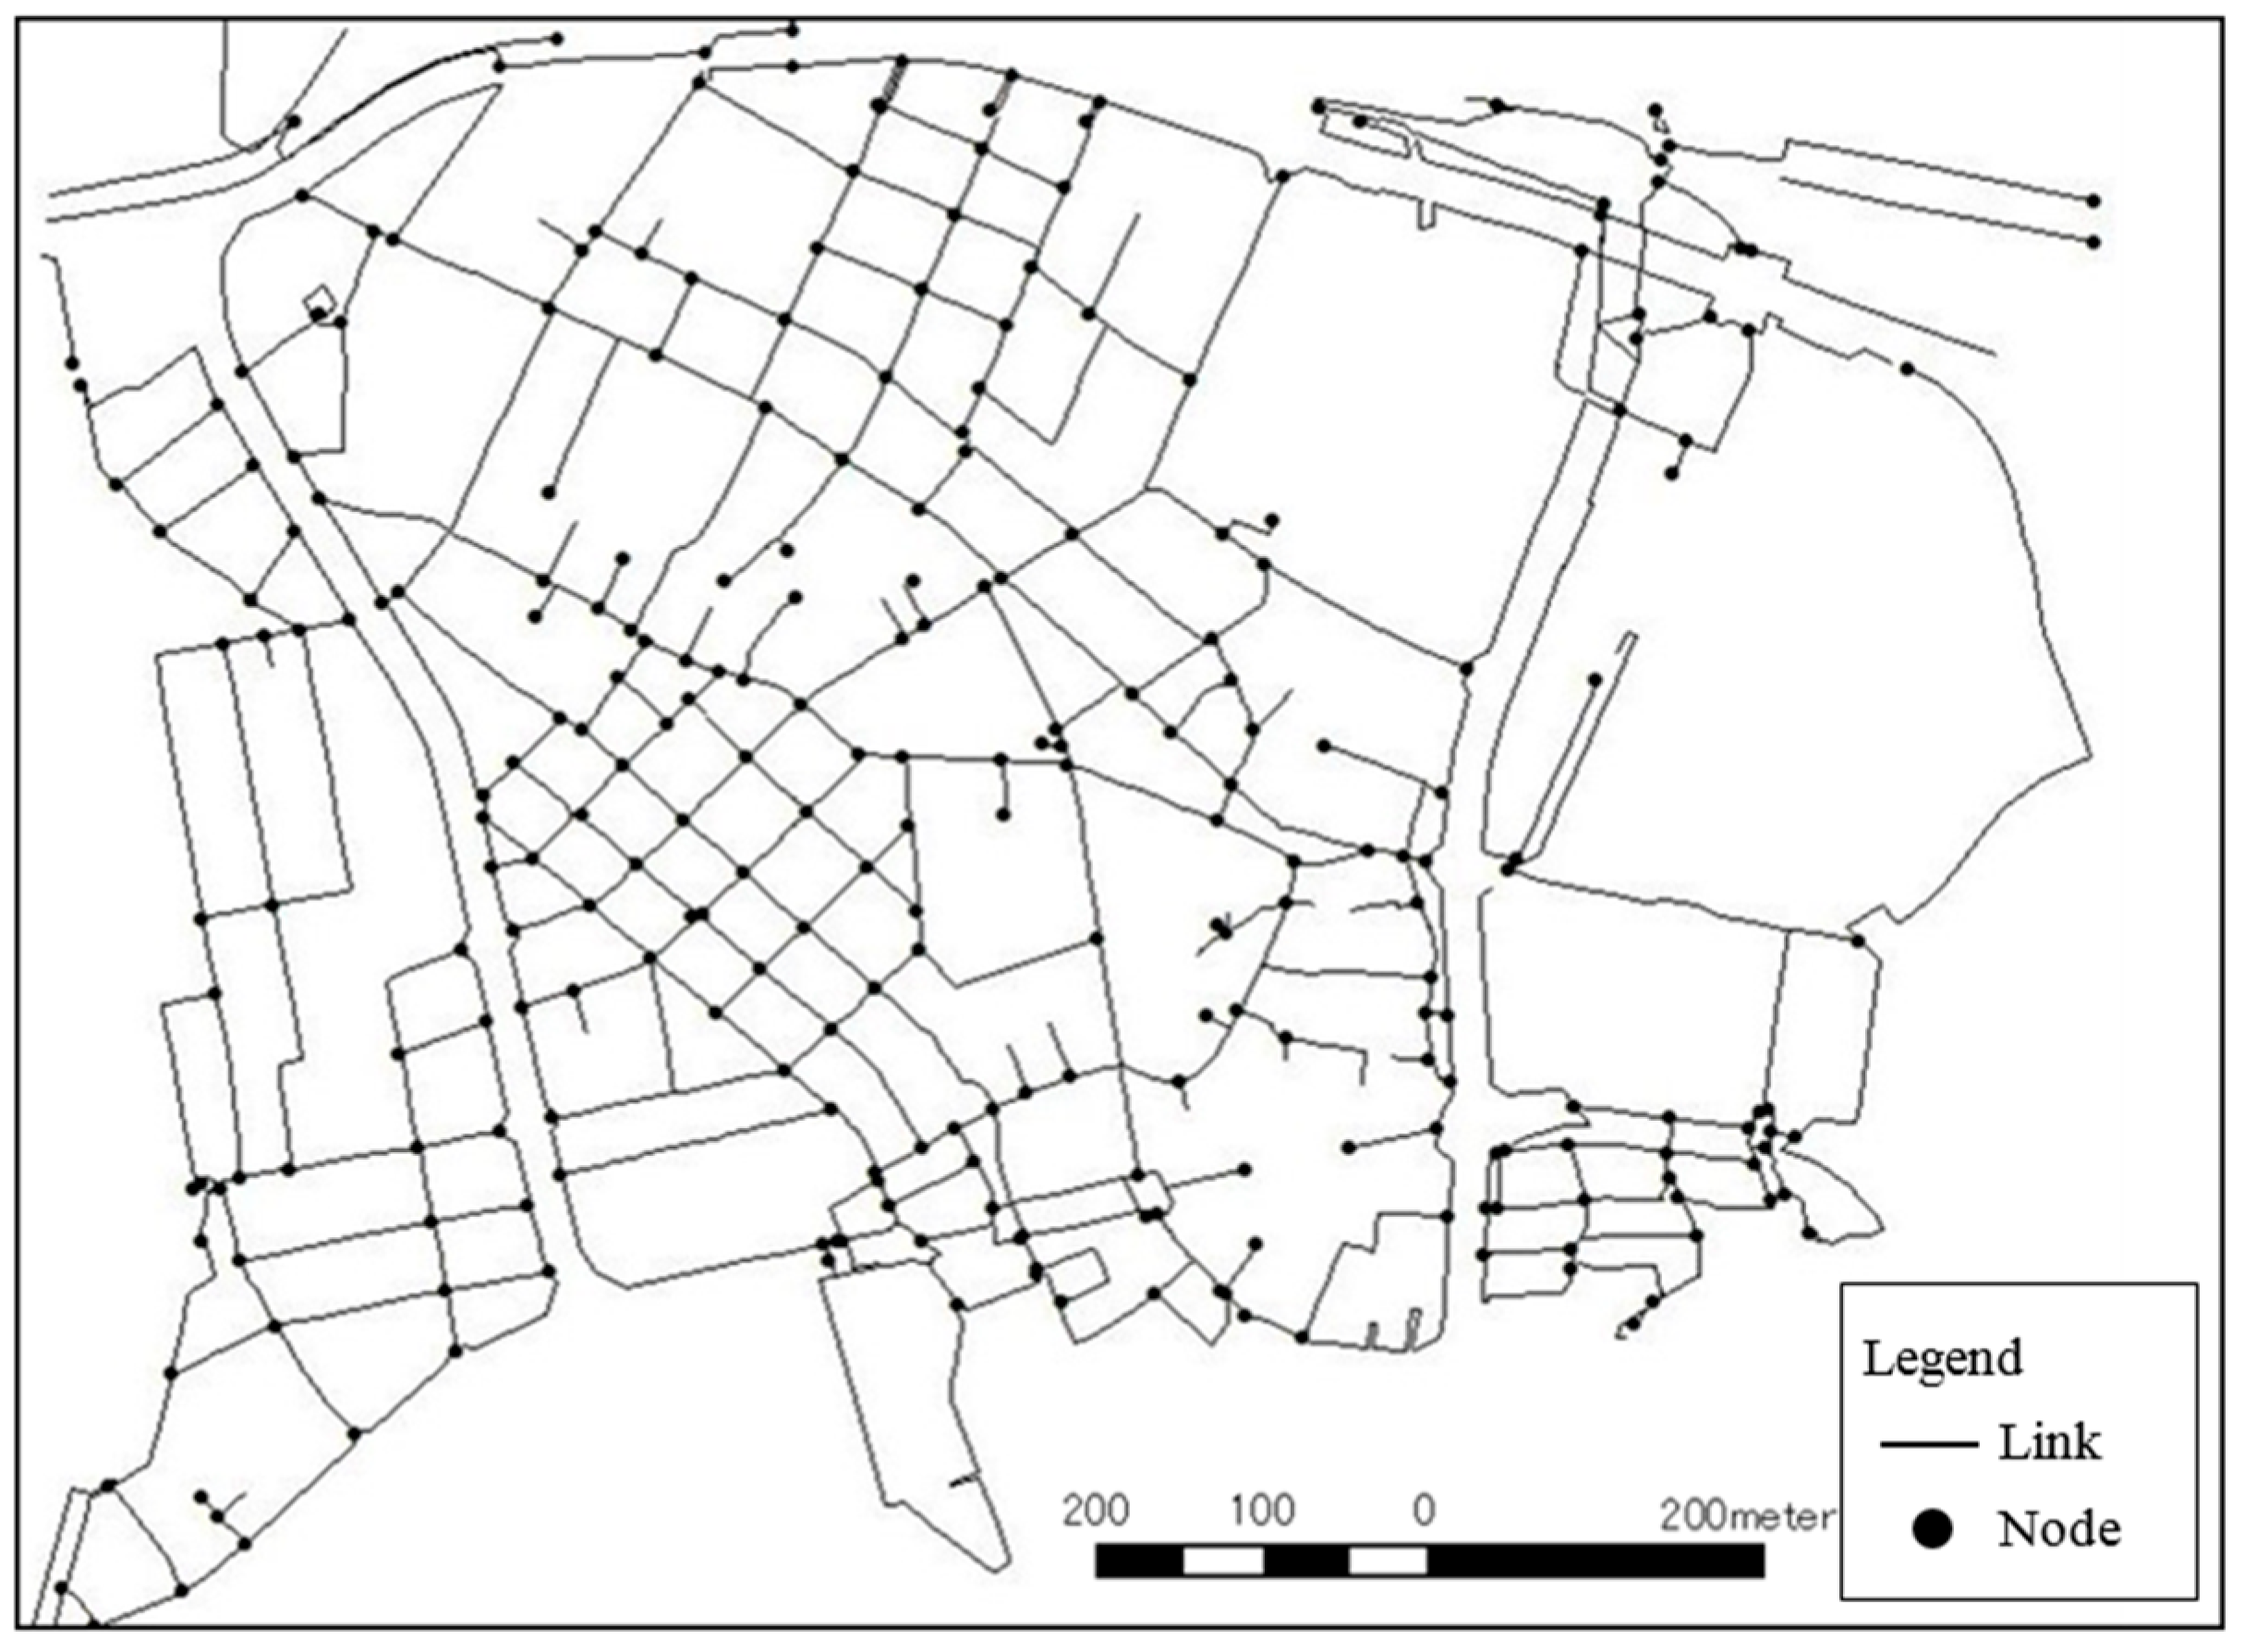
4.3. Making of Road Information Using GIS
4.3.1. Collection and Processing of Data Used
4.3.2. Making of Road Network Data
5. Road Classification Using Hierarchy Cluster Analysis
5.1. Generating of Road Network Information Using GIS
5.1.1. Calculation of Road Blockage Probability and Its Addition to the Road Network
5.1.2. Calculation of Estimated Evacuation Population in Road and Its Addition to the Road Network
- (1)
- Using the spatial search function of the GIS, based on data on present use of buildings which intersected with block (called chome in Japan) polygon data taken from data on the present land use situation, for each block, the buildings in the block were extracted.
- (2)
- Using the attribute search function of the GIS, from the data on buildings extracted in step (1), only the single or detached houses and apartment buildings or housing complexes with many evacuees were extracted.
- (3)
- Using Equation (8), estimated populations which matched the total floor space of each residence were assigned. Calculation for Equation (8) was performed using the field arithmetic function of the GIS in attribute fields for building data.
- (4)
- Using the spatial coupling tool of the GIS, the estimated evacuation population of each residence was assigned to the road link closest to the residence.
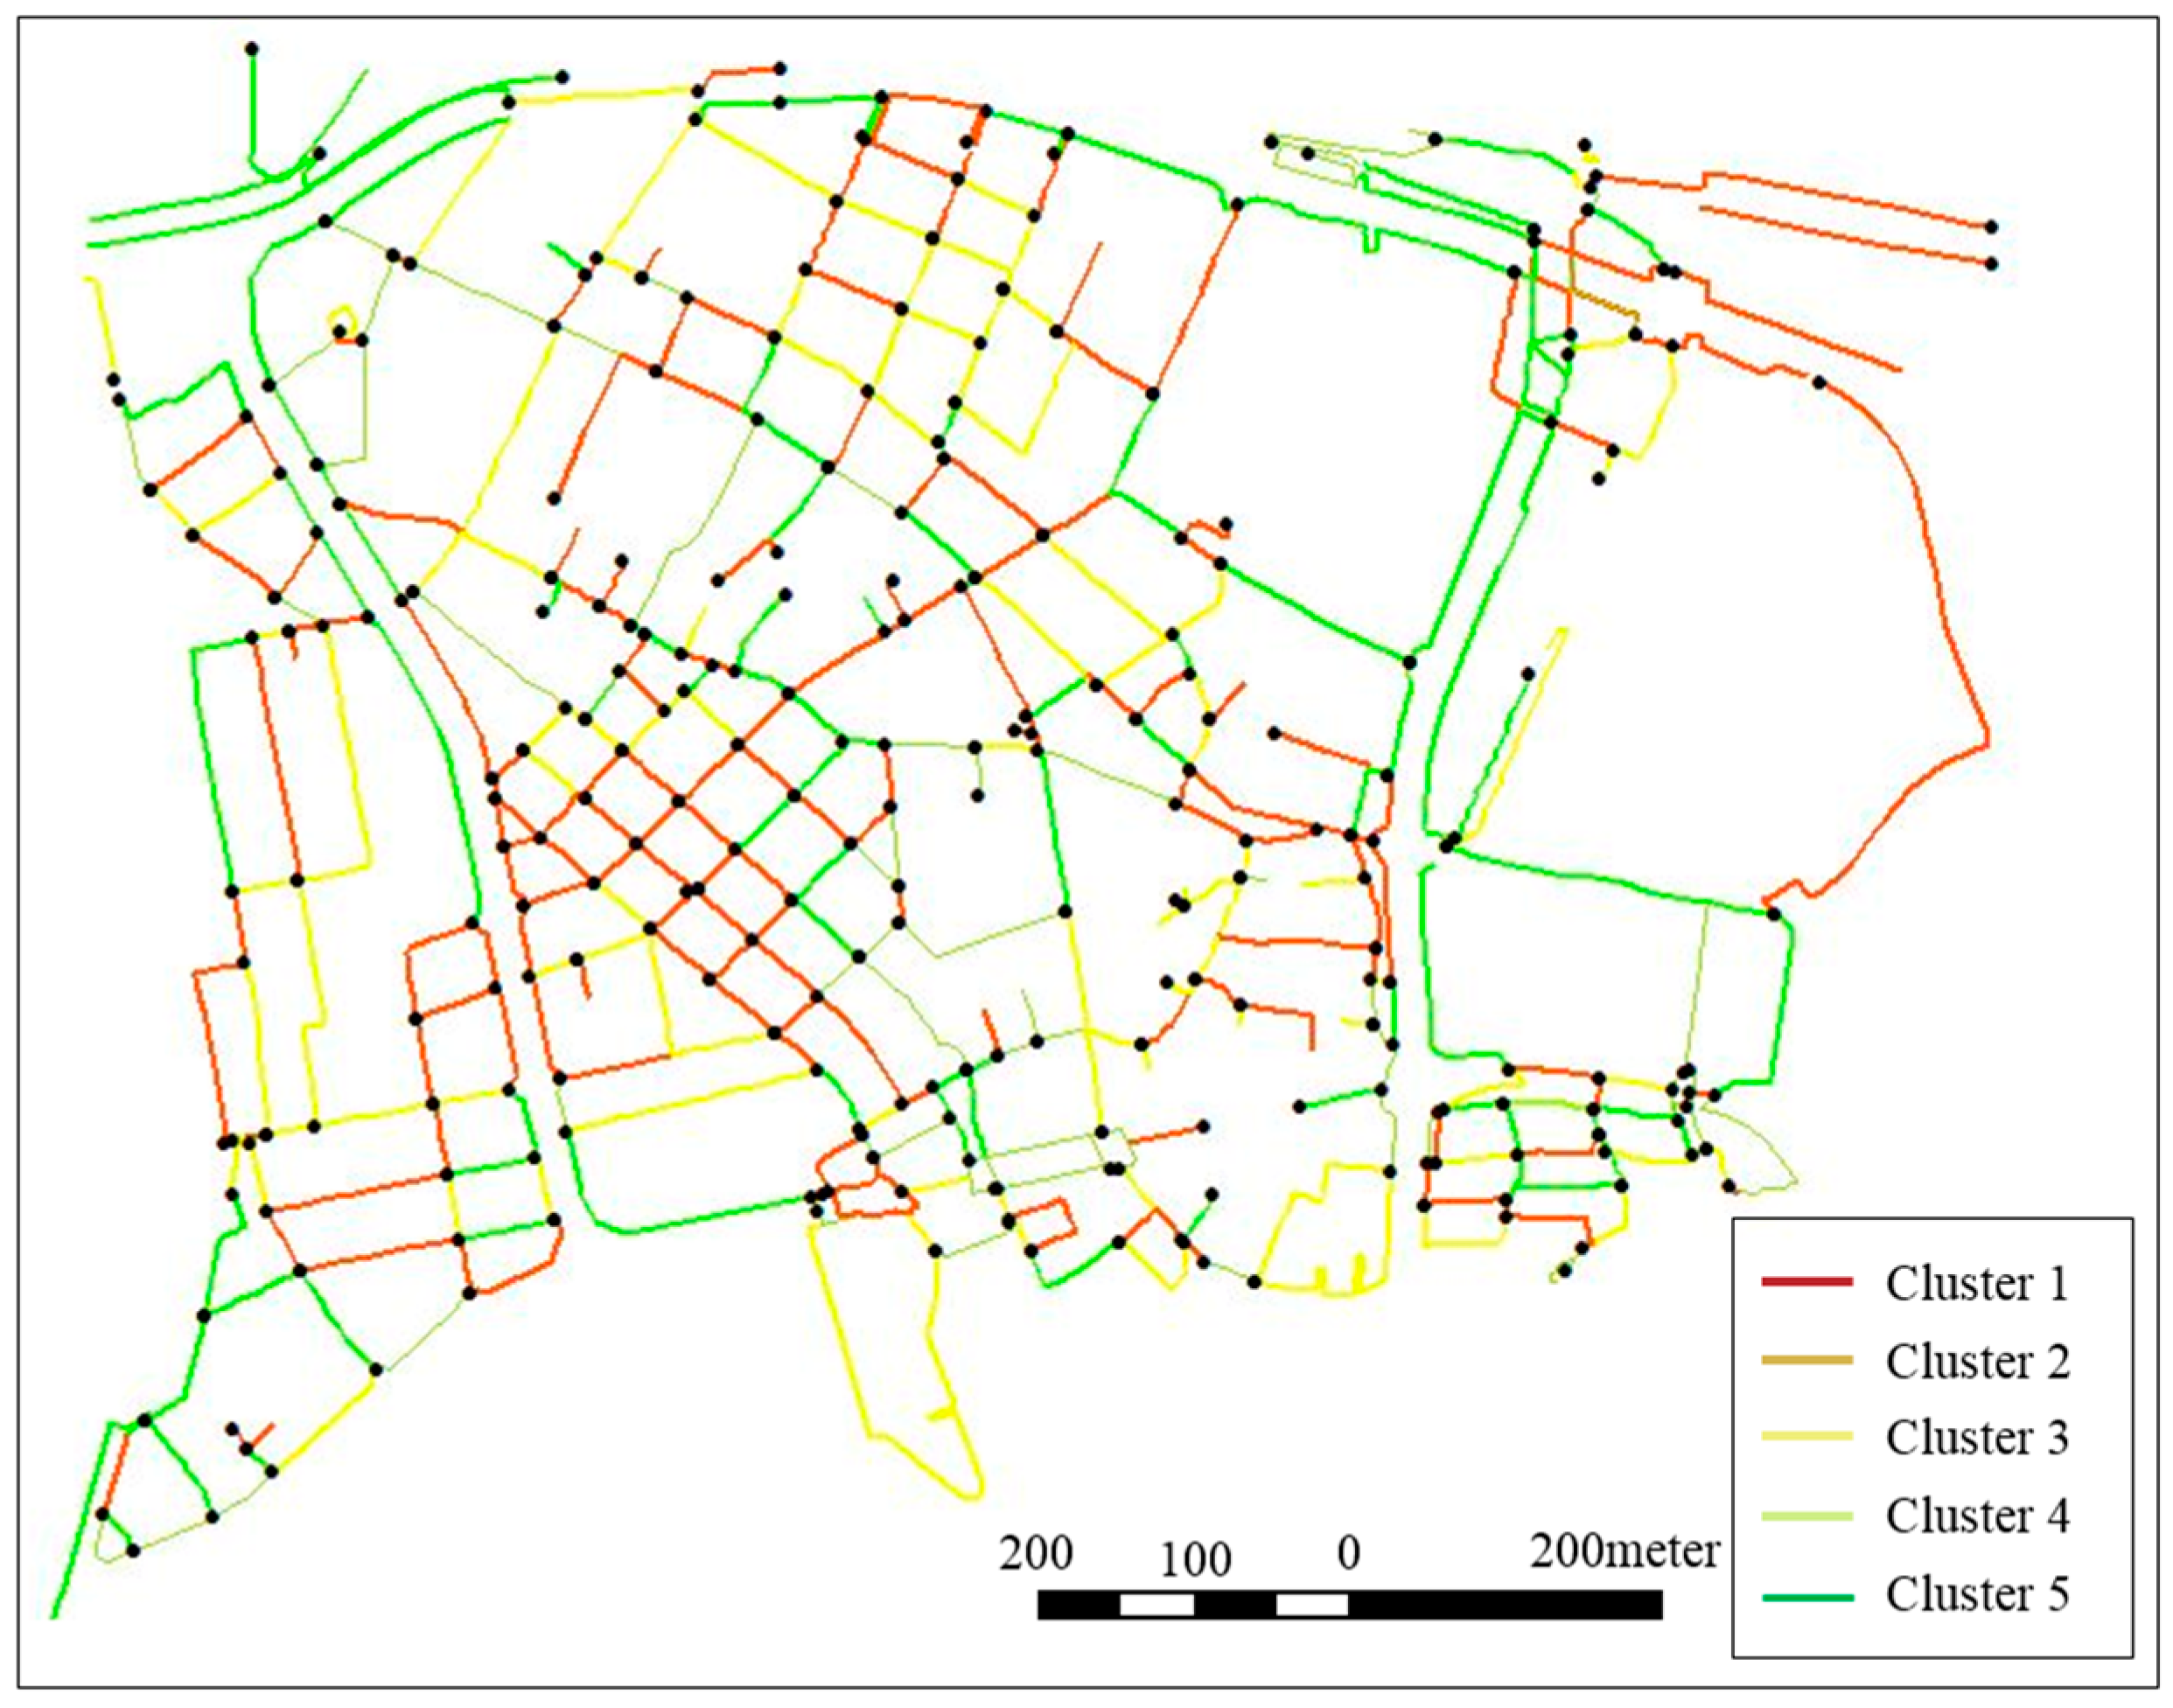
5.2. Road Classification
6. Evaluation Experiment of the ACO Algorithm
6.1. Method
6.1.1. Congestion Estimation Using the Back-Track Method
6.1.2. Simulation Process
- (1)
- 1st tour
- (i)
- All ants will select an evacuation route at random with the same probability.
- (ii)
- The evaluation function of the evacuation routes selected by each ant will be calculated.
- (iii)
- Based on the evaluation function value selected in (ii), pheromones will be attached to the evacuation routes
- (2)
- From the 2nd tour on
- (iv)
- All ants will select evacuation routes following the pheromones.
- (v)
- The evaluation function of the evacuation routes selected by each ant will be calculated.
- (vi)
- Based on the evaluation function value of each ant, the pheromones on the evacuation routes will be updated.
6.2. Simulation and Evaluation Experiments Concerning the Target Area
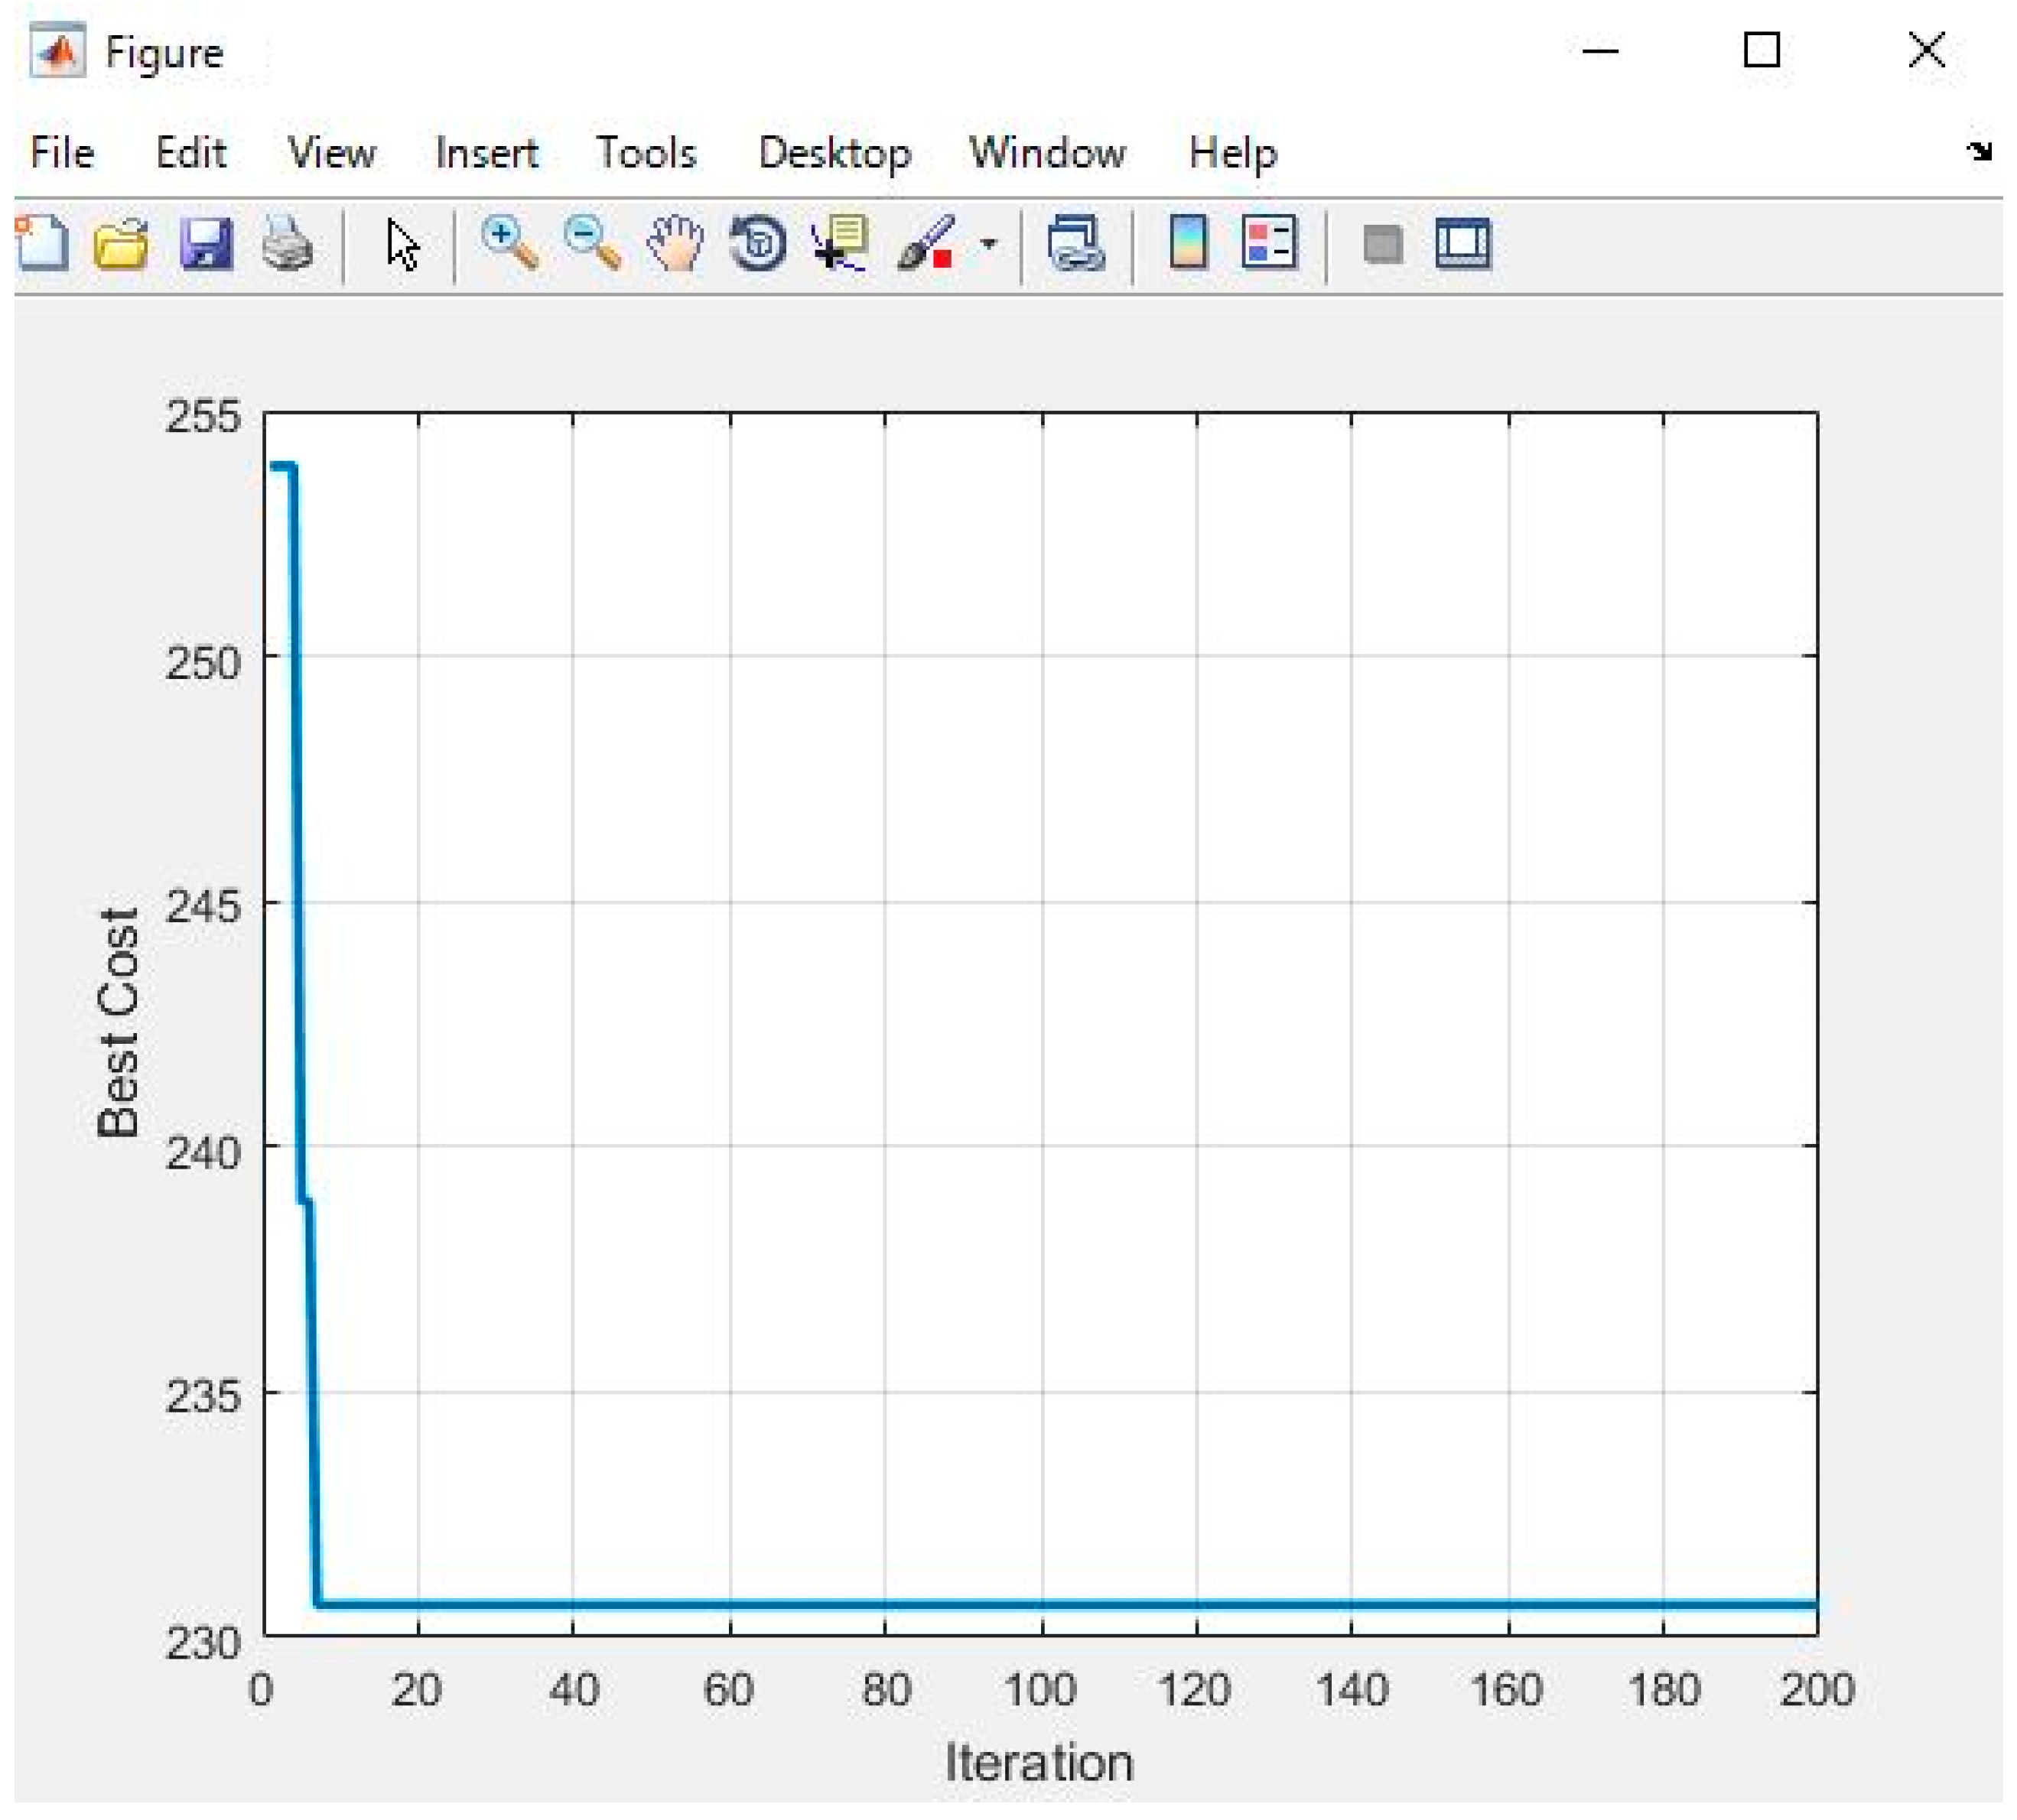
6.2.1. ACO Parameter
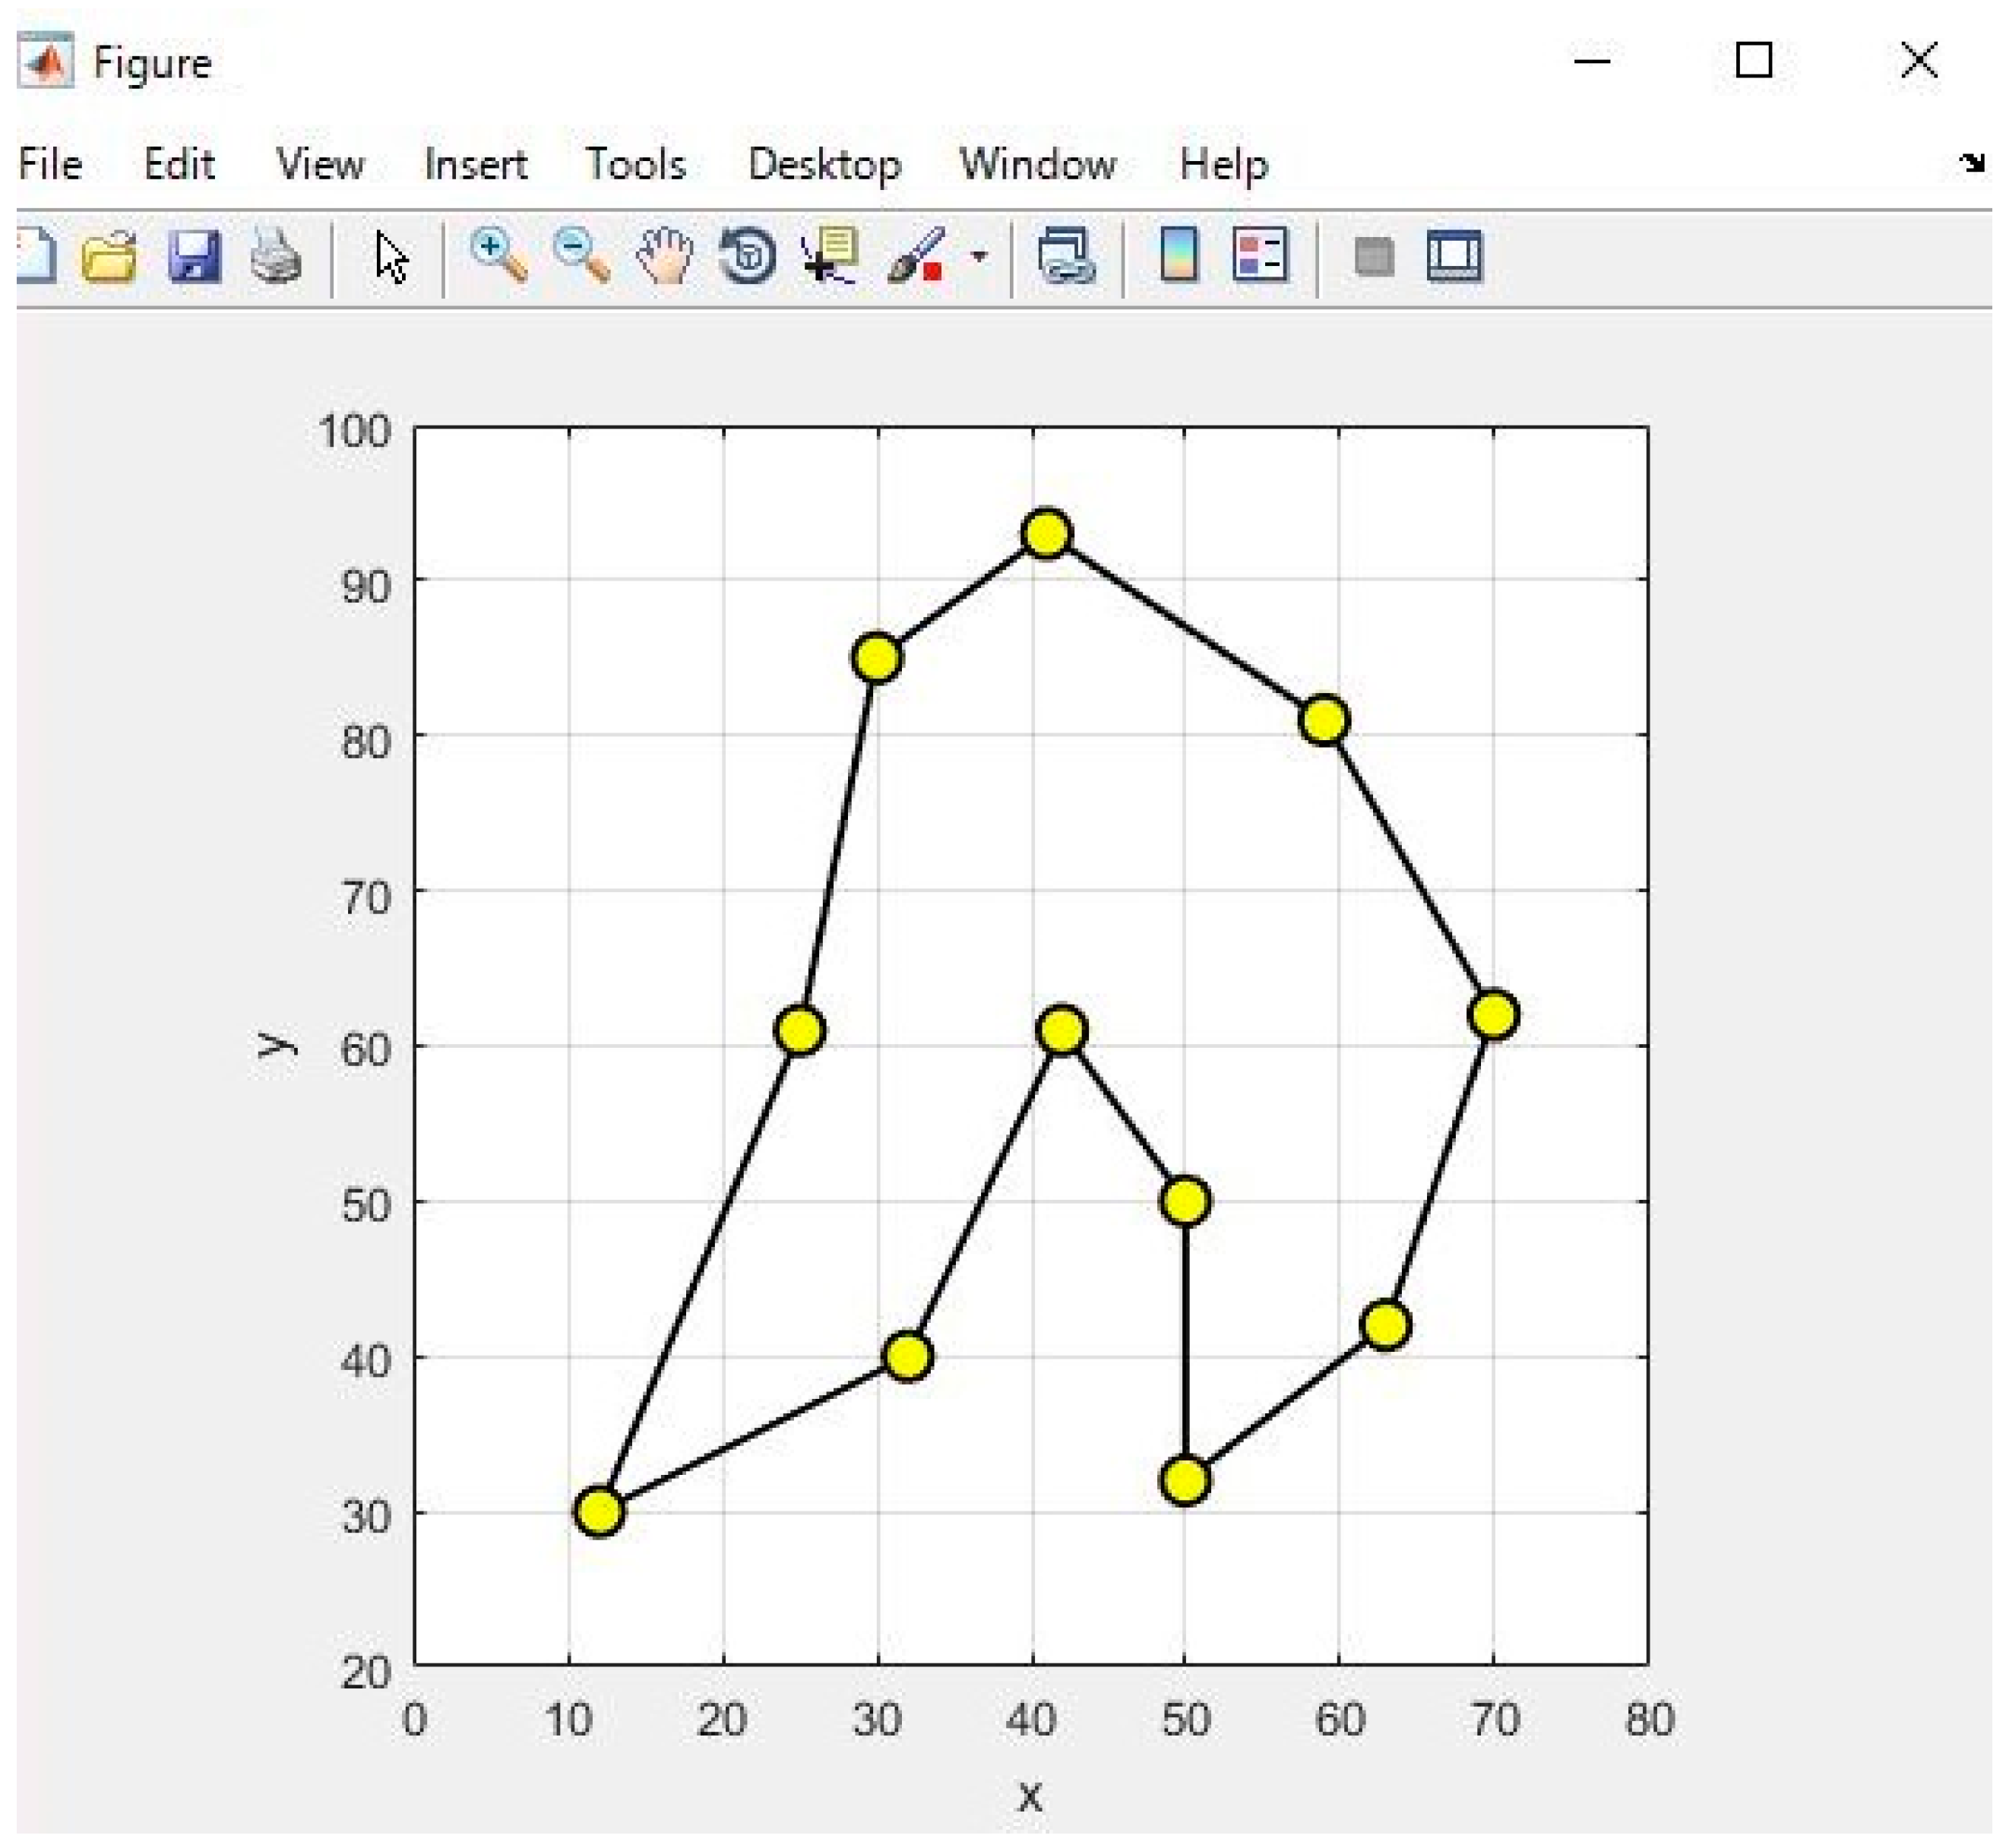
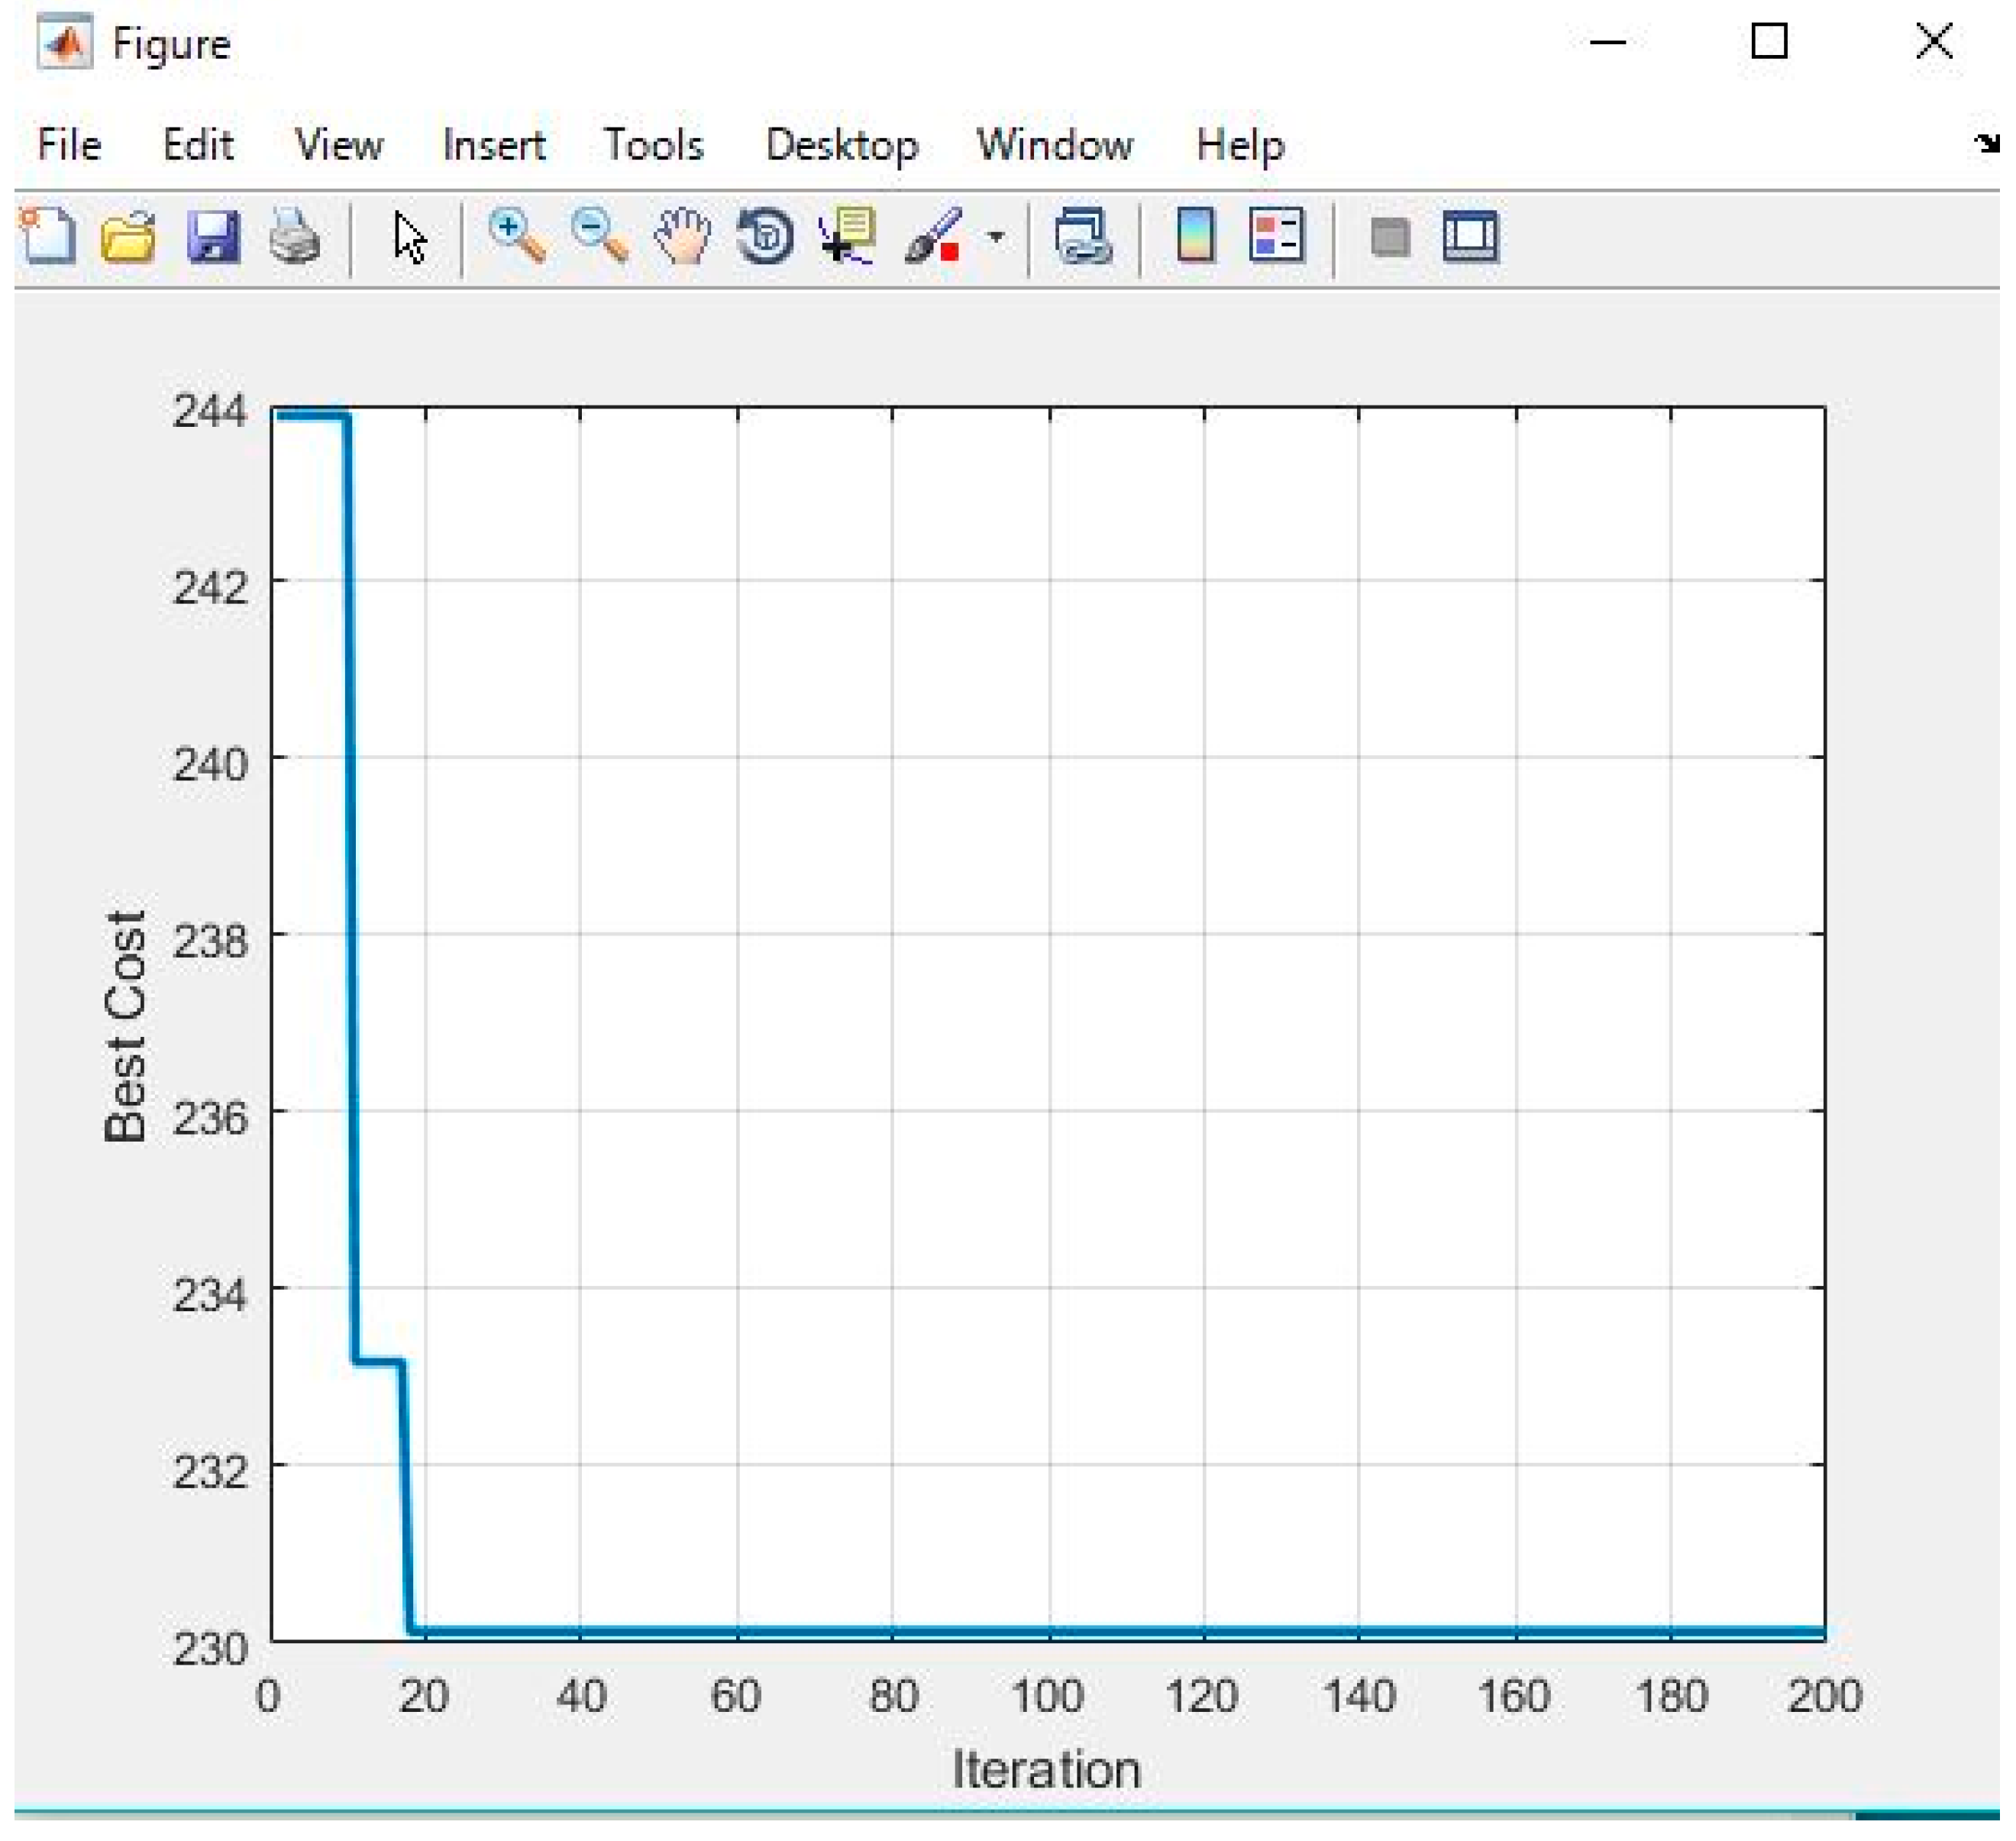
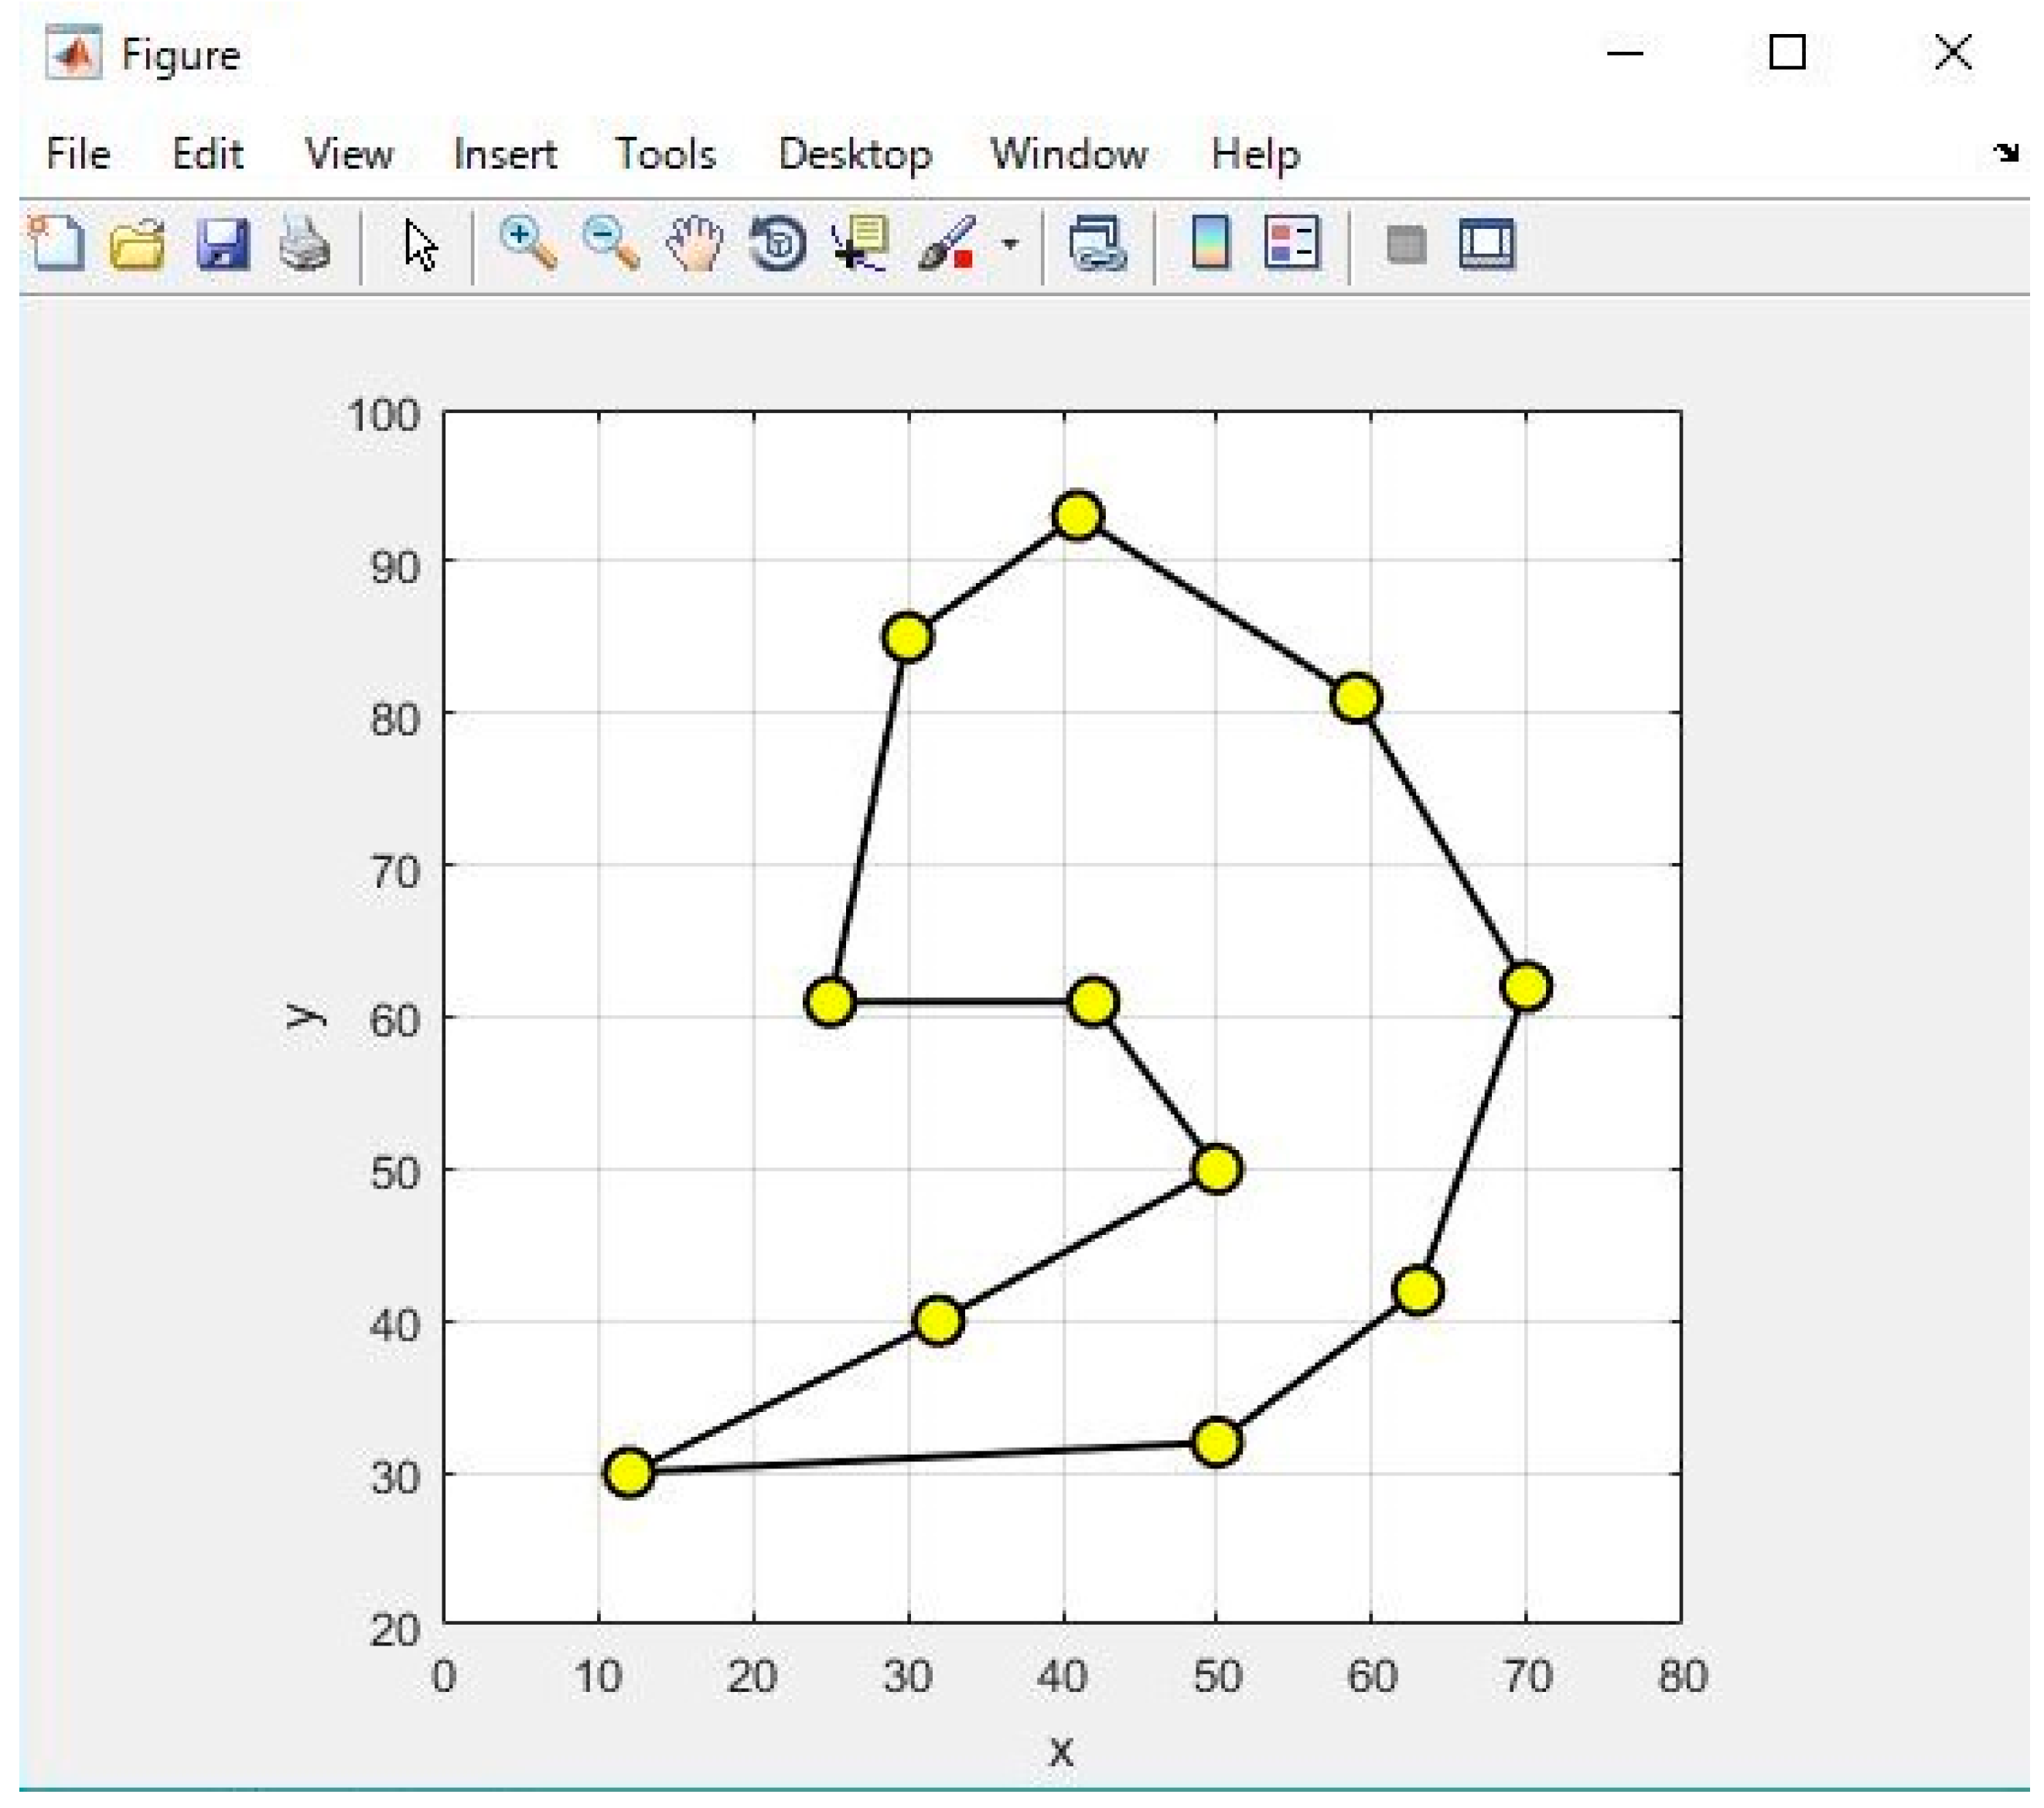
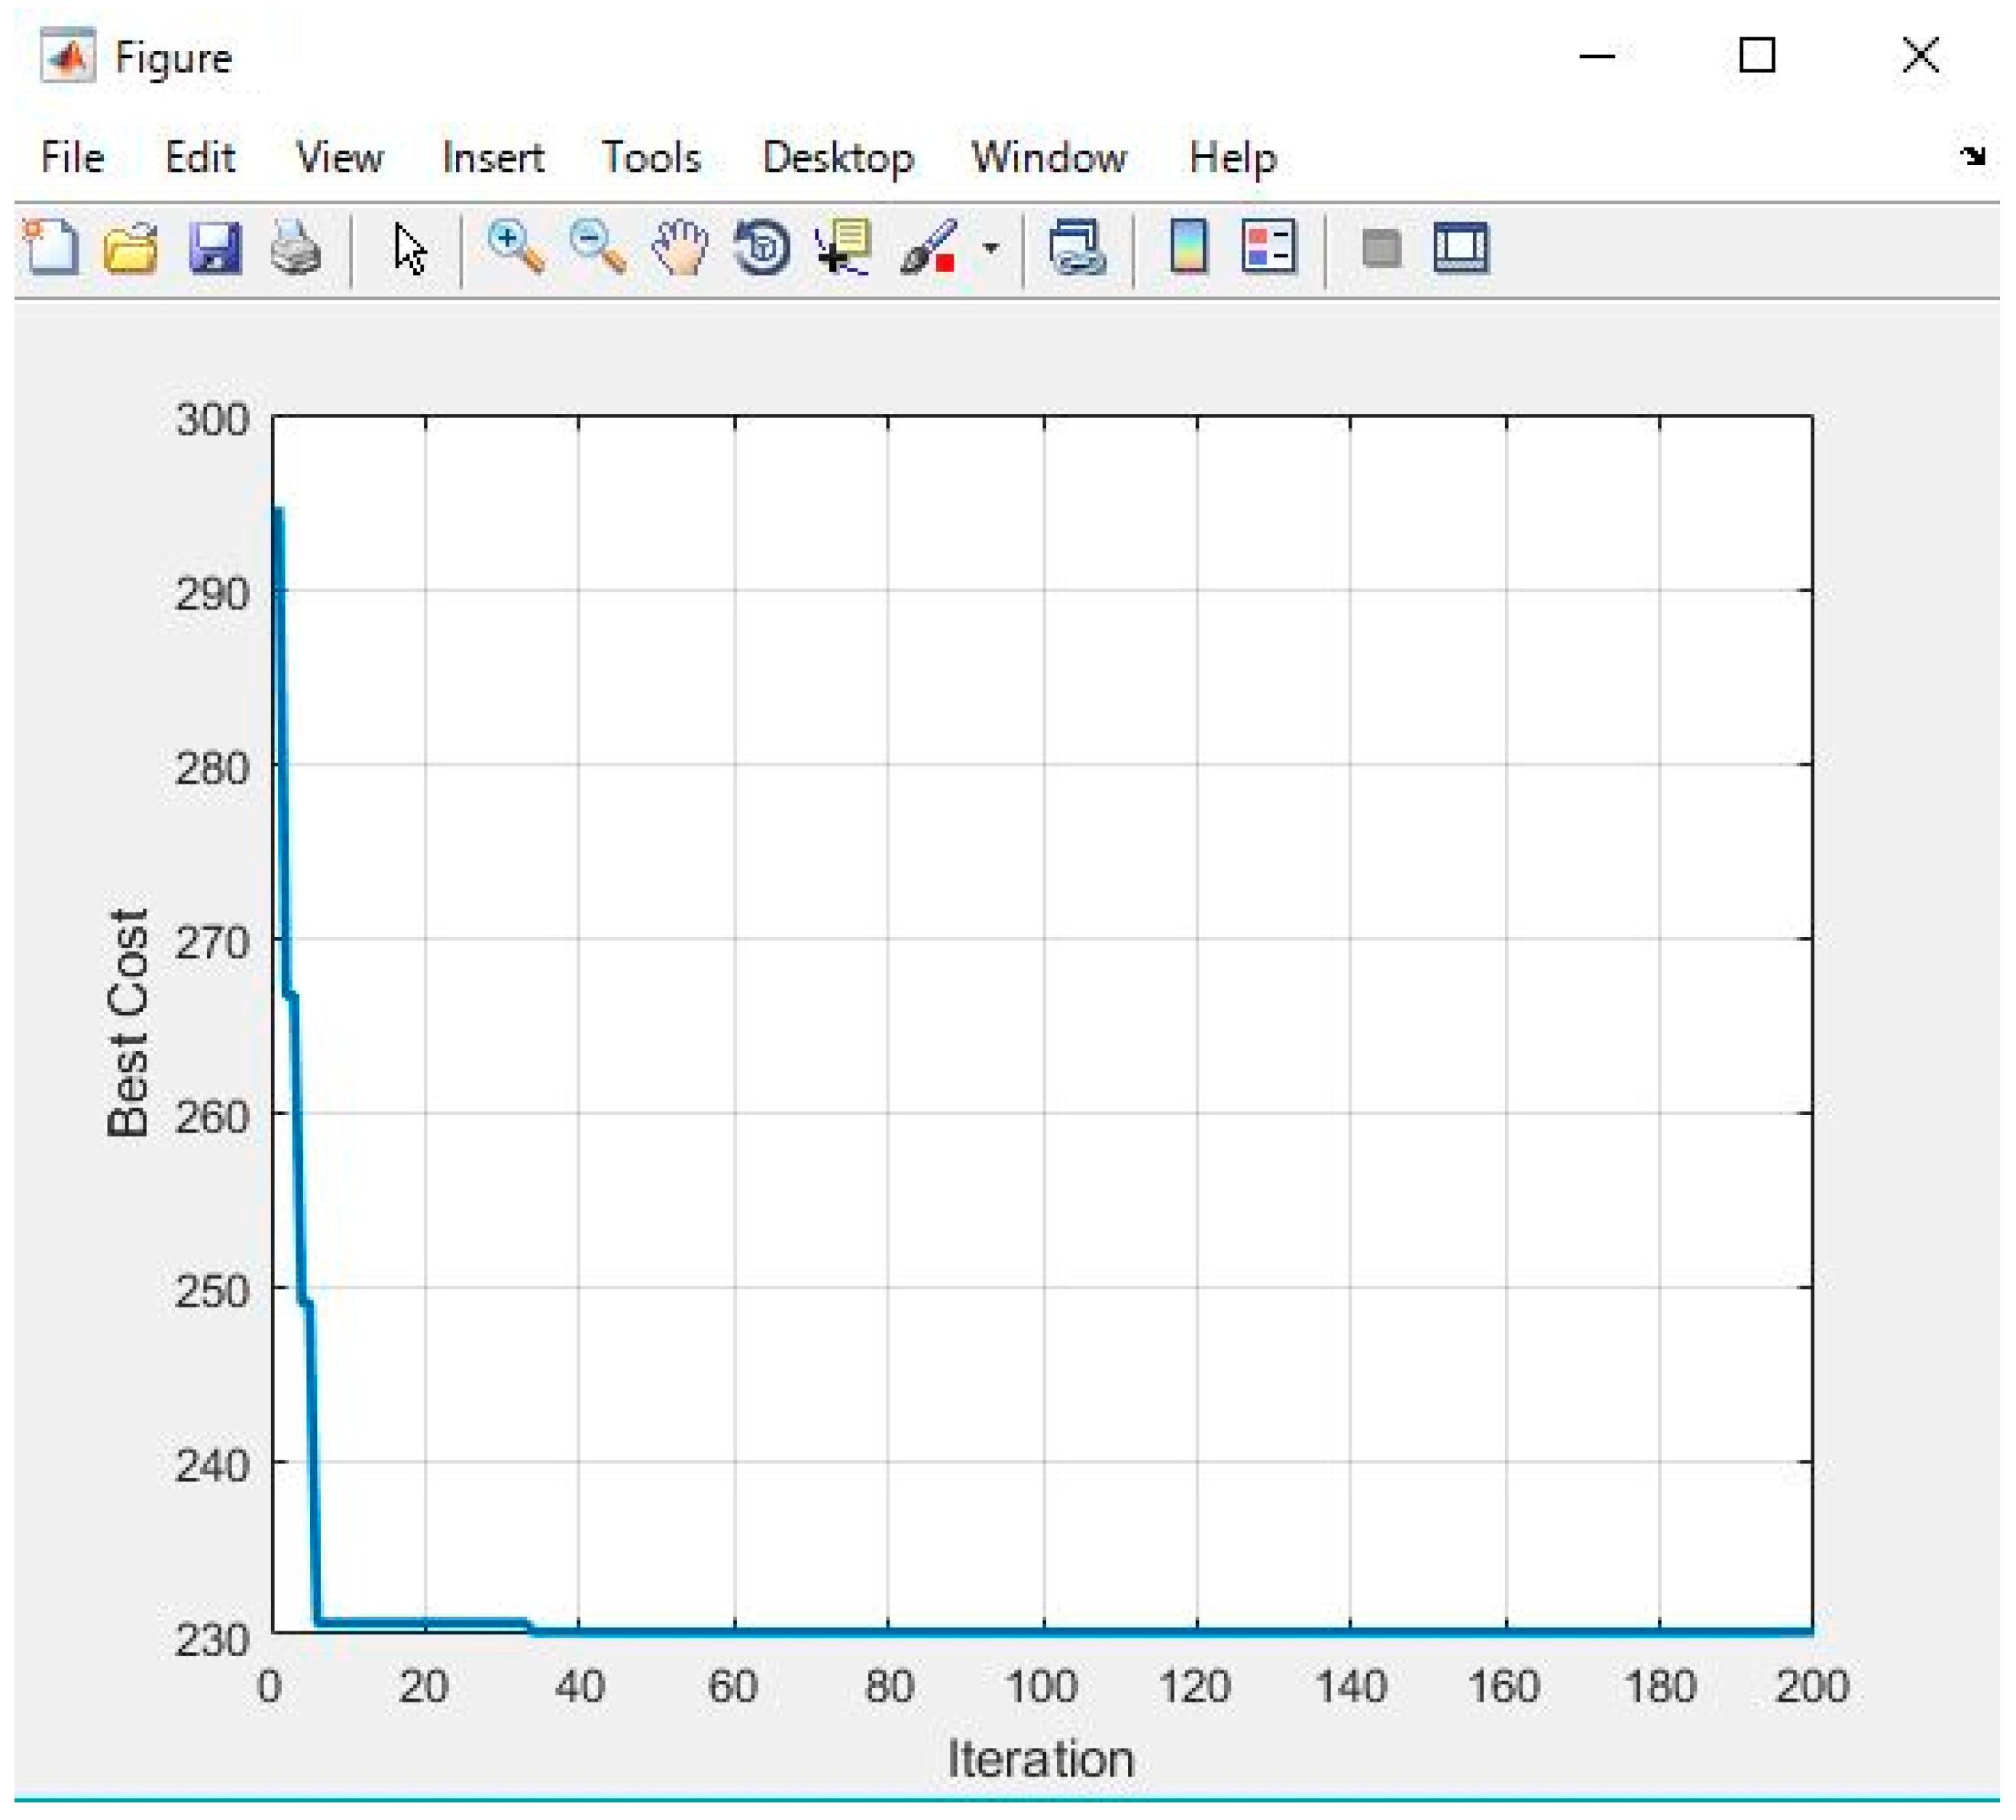
6.2.2. Results and Considerations Concerning the Simulations
7. Safety Evaluation of Evacuation Routes Assuming a Large-Scale Evacuation
7.1. Extraction Conditions of Evacuation Routes with a High Congestion Rate
- (i)
- Distance between evacuation sites is less than 1 km
- (ii)
- Evacuation time between evacuation sites is under 0.5 h
- (iii)
- Congestion rate is more than 80%
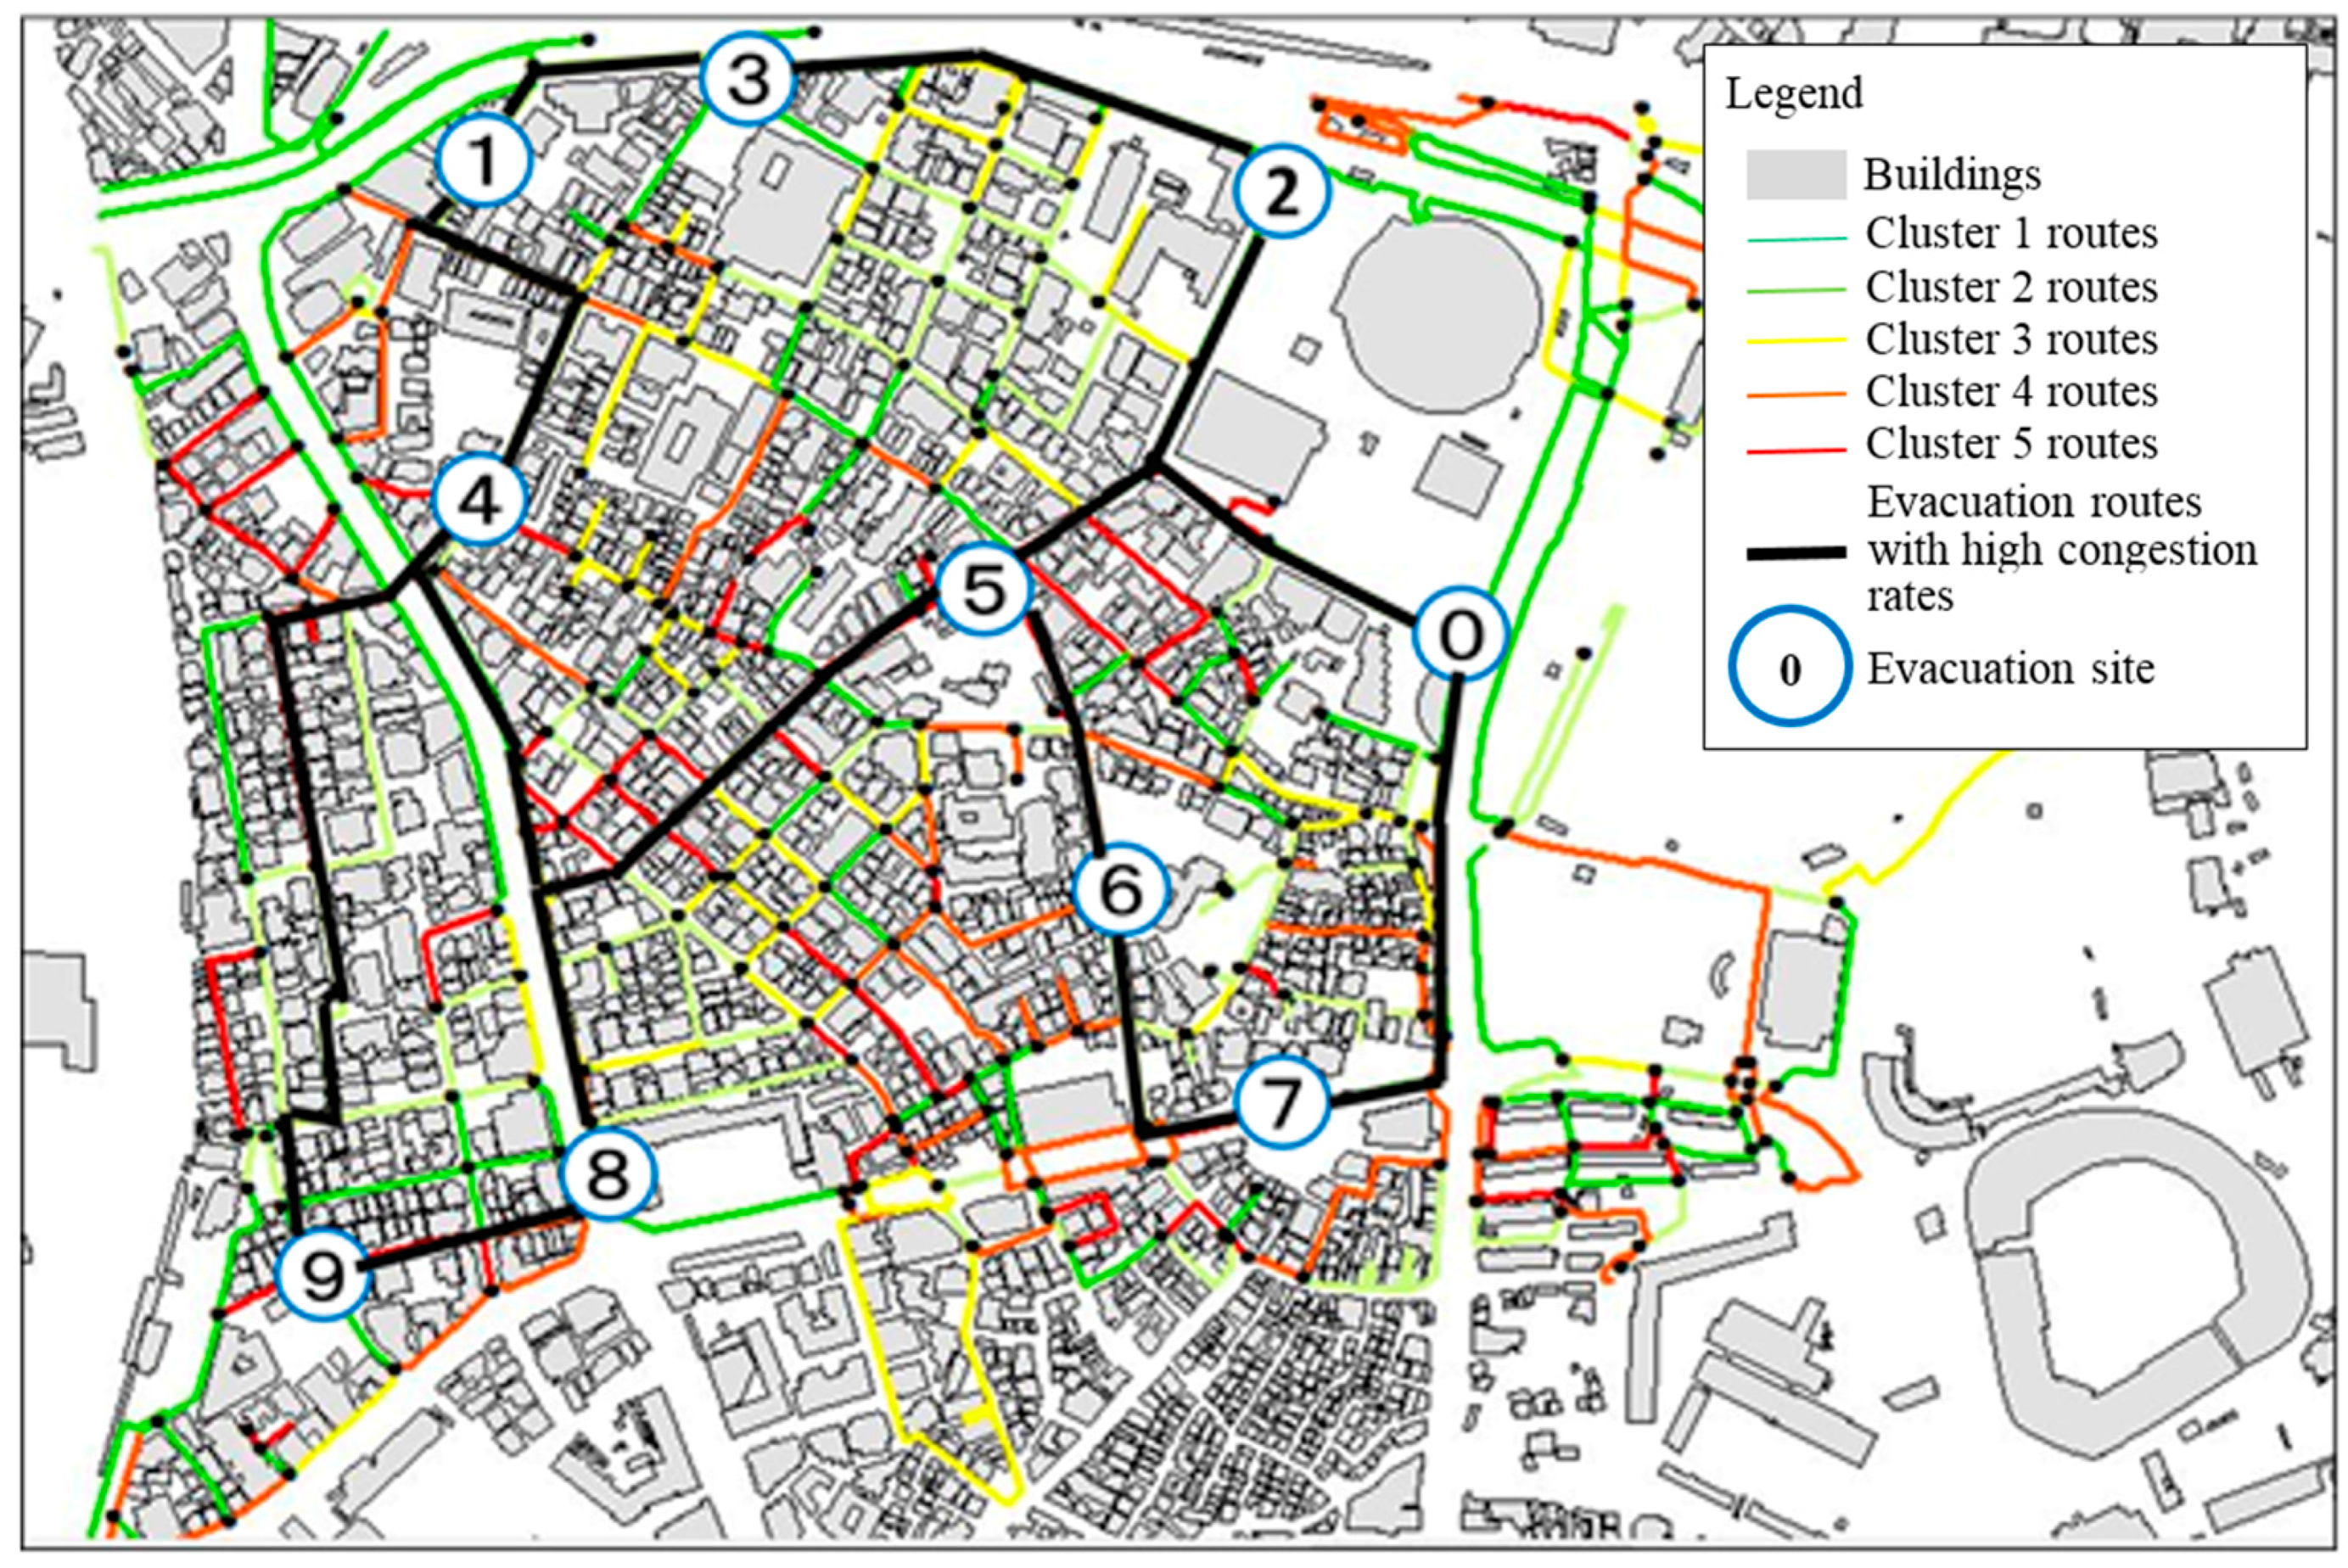
7.2. Safety Evaluation of Evacuation Routes
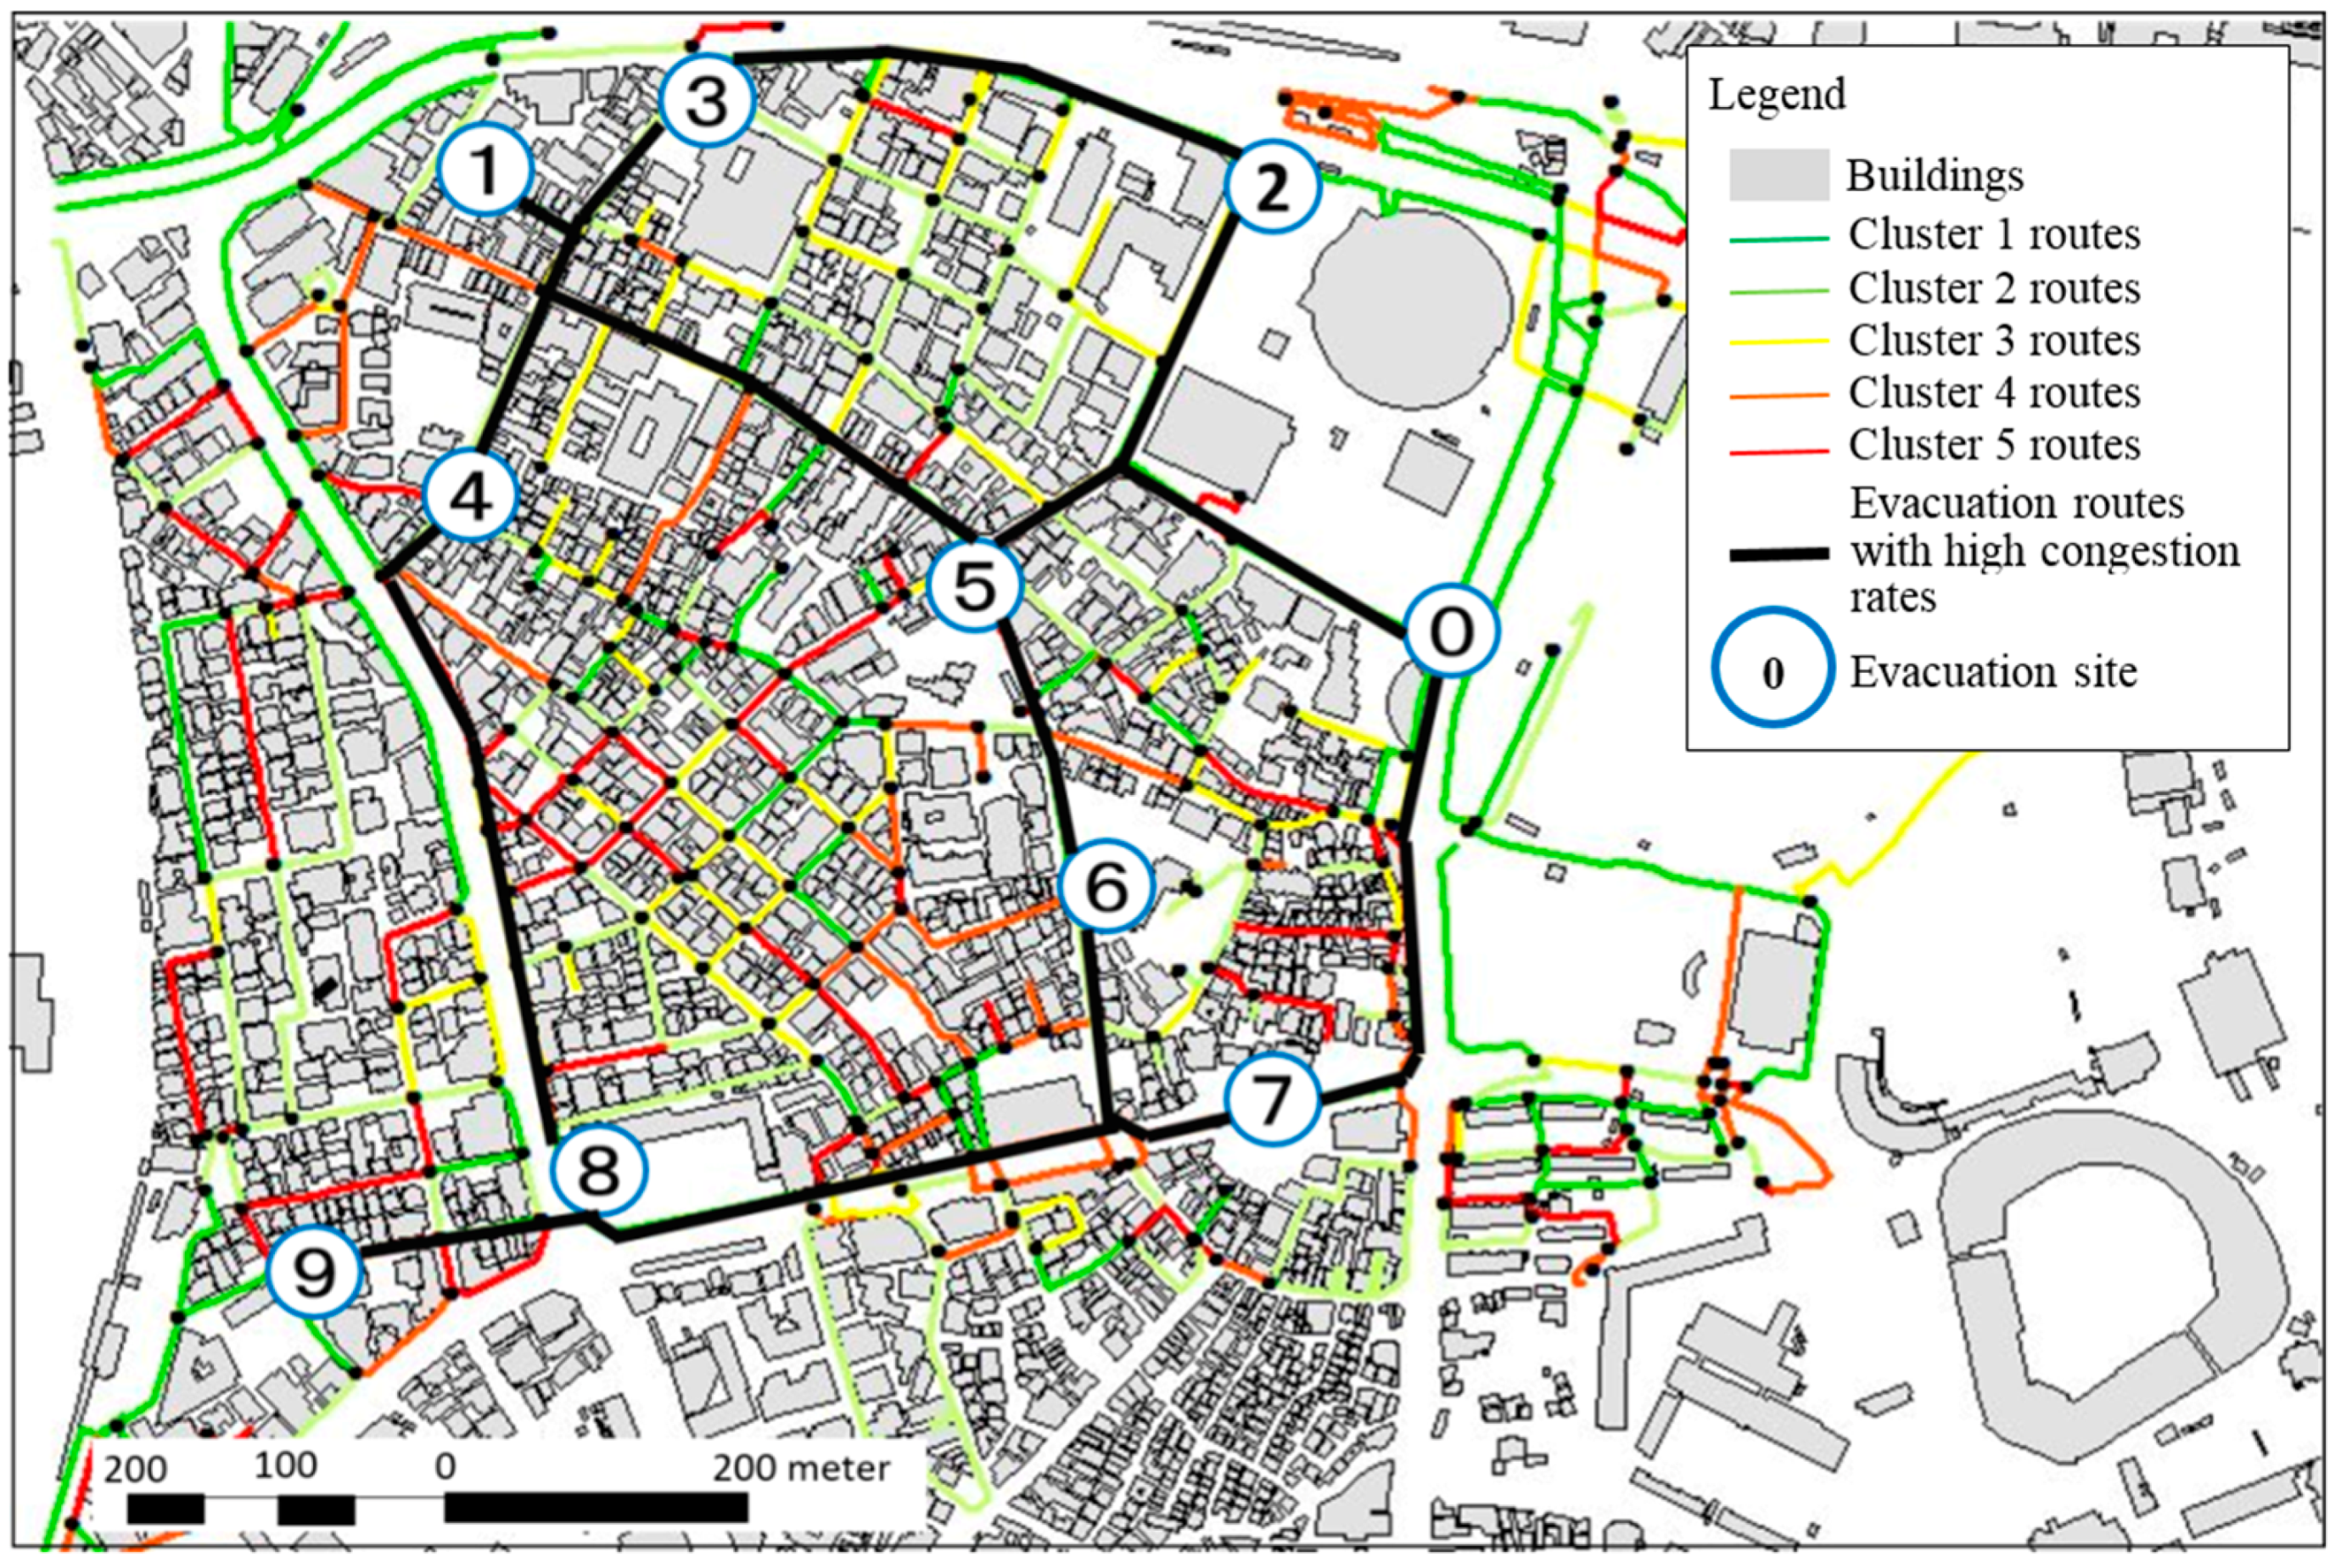
7.2.1. Extraction of Evacuation Routes with High Congestion Rates
7.2.2. Situation of Evacuation Route with High Congestion Rates
7.3. Safety Evaluation of Evacuation Route
7.4. Discussion
8. Conclusions
- (1)
- In the present study, the similarity in safety was focused on while taking into consideration road blockage probability, and after classifying roads by means of the hierarchical cluster analysis, the congestion rates of evacuation routes using ACO simulations were estimated. Based on these results, considering the evaluation values of evacuation distance, evacuation time, congestion rates, as well as building collapse risks, the multiple evacuation routes extracted were visualized on digital maps by means of GIS, and their safety was evaluated. Furthermore, the selection of safe evacuation routes between evacuation sites, for cases when the possibility of large-scale evacuation after an earthquake disaster is high, is made possible.
- (2)
- Using the evaluation method in the present study, if all data and research information is updated with the future technology developments and advances in the related fields, it will be possible to update and provide even more accurate information. Additionally, as the evaluation method is based on public information, by obtaining the same geographic information as the present study, it is effective in other areas, regardless of whether the information is from the past or future. Therefore, in addition to spatial reproducibility, the evaluation method also has high temporal reproducibility.
- (3)
- Because safety evaluations are conducted on evacuation routes based on quantified data, highly safe evacuation routes that are selected have been quantitatively evaluated, and thus serve as an effective indicator when selecting evacuation routes. Additionally, if more detailed information can be used as data, the derivation of evacuation routes that more accurately reflect real conditions can be possible.
Author Contributions
Conflicts of Interest
References
- Alçada-Almeida, Luís, Lino Tralhao, Luis Santos, and João Coutinho-Rodrigues. 2009. A Multiobjective Approach to Locate Emergency Shelters and Identify Evacuation Routes in Urban Areas. Geographical Analysis 41: 9–29. [Google Scholar] [CrossRef]
- Asou, Toshihiko, Yorikazu Matsumoto, and Kazuhisa Morishita. 2007. A Study on the Optimal Location of Disaster Shelters using Genetic Algorithm. Research Report of Faculty of Engineering, Yamaguchi University 58: 522–533. [Google Scholar]
- Bureau of Urban Development, Tokyo Metropolitan Government. 2013. District-Based Assessment of Vulnerability to Earthquake Disaster (No. 7); Tokyo: Bureau of Urban Development, Tokyo Metropolitan Government.
- Director-General for Disaster Management in the Cabinet Office. Report on Investigation into Wide-Area Disaster Prevention Measures in the "S.K.Y Kouikiken"* Area (*A Large Area centering on the Fuji, Hakone and Izu Areas), Tokyo: Director-General for Disaster Management in the Cabinet Office.
- Dorigo, Marco, Gianni Di Caro, and Luca M. Gambardella. 1999. Ant Algorithms for Discrete Optimization. Artificial Life 5: 137–172. [Google Scholar] [CrossRef] [PubMed]
- Ichikawa, Fusako, Tomohiko Sakata, and Toru Yoshikawa. 2004. An Analysis of Accessibility to Spaces for Disaster Refuge Considering Danger of Street-Blockades Caused by Collapse of Buildings on Evacuation Routes. Theory and Applications of GIS 12: 47–56. [Google Scholar] [CrossRef]
- Imaizumi, Kyoichi, and Yasushi Asami. 2000. A Study on Estimation of Street-Blockades Caused by a Great Earthquake—To improve densely inhabited urban area for disaster prevention. Journal of Architecture and Planning 65: 225–231. [Google Scholar] [CrossRef]
- Inoue, Mika, and Kayoko Yamamoto. 2013. Method for Evaluating the Location of Tourist-Related Public Facilities Using Genetic Algorithms and GIS. Journal of Communication and Computer 10: 496–512. [Google Scholar]
- Koarai, Mamoru, Hiroshi Sato, and Hiroshi Une. 2007. GIS Analysis of the Relationship between Earthquake-Induced Ground Disaster and the Physical Characteristics of Land. Bulletin of the Geospatial Information Authority of Japan 112: 115–123. [Google Scholar]
- Komura, Takashi, and Atsushi Hirano. 1997. Disaster Imagination Game (DIG), A Drill using Maps. Papers of the 7th Annual Conference of the Institute of Social Safety Science, 136–139. [Google Scholar]
- Liu, Yuling, Michinori Hatayama, and Norio Okada. 2006. Development of an Adaptive Evacuation Route Algorithm under Flood Disaster. Annuals of the Disaster Prevention Research Institute, Kyoto University 49B: 189–195. [Google Scholar]
- Mochio, Takashi, and Yoshihiro Kitahara. 2016. Application of Ant Colony Optimization Technique to Real Time Search of Optimal Evacuation Route after Severe Earthquake. Journal of Japan Association for Earthquake Engineering 16: 93–110. [Google Scholar] [CrossRef]
- Nakamichi, Yoshiyuki, and Takaya Arita. 2003. The Effects of Diversity Control Based on Random Selection in Ant Colony Optimization. IPSJ Journal 43: 2939–2947. [Google Scholar]
- Onorati, Teresa, Malizia Alessio, Antonia Diaz, and Aedo Ignacio. 2014. Modeling Ontology on Accessible Evacuation Routes for Emergencies. Expert Systems with Applications 41: 7124–7134. [Google Scholar] [CrossRef]
- Shibuya Ward. 2017. Shibuya Ward Disaster Prevention Map. Available online: https://www.city.shibuya.tokyo.jp/todoke/bosai/hasai/index.html (accessed on 22 May 2017).
- Shimura, Yuichiro, and Kayoko Yamamoto. 2014. Method of Searching for Earthquake Disaster Evacuation Routes using Multi-Objective GA and GIS. Journal of Geographic Information System 6: 492–525. [Google Scholar] [CrossRef]
- Takeuchi, Teruo, and Akio Kondo. 2002. An Analysis of Evacuation Routes Taking into Consideration Road Sections Blocked by Earthquake—A Case Study of Suzaki City. Papers of the 26th Research Meeting on Civil Engineering Planning, Presentation No. 332 (CD-ROM). [Google Scholar]
- Tokyo Metropolitan Government. 2017. Disaster Prevention Facilities, Shelters and Evacuation Areas in Tokyo Metropolis. Available online: http://www.bousai.metro.tokyo.jp/bousai/1000029/index (accessed on 22 May 2017).
- Urban Disaster Prevention Office of the City Bureau, Ministry of Construction. 1997. Practical Handbook of Urban Disaster Prevention—Earthquake Disaster Prevention; Tokyo: Urban Disaster Prevention Office of the City Bureau, Ministry of Construction.
- Yoshikawa, Toru, Keiji Yokota, and Tomohiko Sakata. 2003. A Stochastic Model Basis for Simulation of Road Blockage which Takes into Account Individual Collapsed Buildings in Actual Urban Areas in Great Earthquakes. Summaries of Technical Papers of Annual Meeting Architectural Institute of Japan F-1, 991–992. [Google Scholar]


| Use Data | Data Processing Method |
|---|---|
| 2012 current situation of land use (Bureau of Urban Development, Tokyo Metropolitan Government 2013) | Making of road network Measurement of road width |
| 2012 current situation of building use (Bureau of Urban Development, Tokyo Metropolitan Government 2013) Probability of total building collapse sorted by ground area and building type (Bureau of Urban Development, Tokyo Metropolitan Government: “District-based assessment of vulnerability to earthquake disaster (No. 7) in Tokyo Metropolis”) | Calculation of road blockage probability and its addition to the road network |
| Daytime and nighttime populations by the daytime and nighttime populations according to District (Ministry of Internal Affairs and Communications: “2010 National Census by the Statistic Bureau”) 2012 current situation of building use (Bureau of Urban Development, Tokyo Metropolitan Government 2013) | Calculation of estimated population in roads and its addition to the road network |
| Case | 1 | 2 | 3 |
|---|---|---|---|
| Solution options in which pheromones can be updated (evacuation sites) | 10 | 10 | 10 |
| Number of search ants (number of evacuees) | 300 | 200 | 100 |
| Volatilization rate (%) | 100 | 100 | 100 |
| Size of option list (convergence speed) | 110 | 110 | 110 |
| Number of occurrences | 200 | 200 | 200 |
| Solution options in which pheromones can be updated (evacuation sites) | 10 |
| Number of search ants (number of evacuees) | 300 |
| Volatilization rate (%) | 100 |
| Size of option list (convergence speed) | 110 |
| Number of occurrences | 200 |
| Solution options in which pheromones can be updated (evacuation sites) | 10 | |
| Number of search ants (number of evacuees) | 100 | |
| Volatilization rate (%) | 100 | |
| Size of option list (convergence speed) | 110 | |
| Number of occurrences | 200 | |
| Evacuation Routes with High Congestion Rates | Evacuation Distance (m) | Evacuation Time (h) | Congestion Rate (%) | Building Collapse Risk |
|---|---|---|---|---|
| Route 0–2 | 246.3 | 0.260 | 56 | 321.3 |
| Route 0–5 | 213.2 | 0.224 | 72 | 541.2 |
| Route 0–7 | 269.4 | 0.312 | 63 | 477.1 |
| Route 1–3 | 133.4 | 0.152 | 42 | 436.7 |
| Route 1–4 | 189.9 | 0.214 | 89 | 741.5 |
| Route 2–3 | 251.3 | 0.230 | 46 | 523.1 |
| Route 2–5 | 216.8 | 0.231 | 73 | 531.5 |
| Route 4–5 | 469.1 | 0.498 | 88 | 539.1 |
| Route 4–8 | 206.3 | 0.421 | 42 | 489.8 |
| Route 4–9 | 371.4 | 0.502 | 86 | 827.2 |
| Route 5–6 | 183.4 | 0.182 | 92 | 837.2 |
| Route 5–8 | 468.7 | 0.492 | 88 | 799.5 |
| Route 6–7 | 197.0 | 0.190 | 86 | 621.9 |
| Route 8–9 | 142.2 | 0.202 | 73 | 673.2 |
| Evacuation Routes with High Congestion Rates | Evacuation Distance (m) | Evacuation Time (h) | Congestion Rate (%) | Building Collapse Risk |
|---|---|---|---|---|
| Route 0–2 | 246.3 | 0.260 | 56 | 321.3 |
| Route 0–5 | 213.2 | 0.224 | 72 | 541.2 |
| Route 0–7 | 269.4 | 0.312 | 63 | 477.1 |
| Route 1–3 | 126.8 | 0.143 | 52 | 436.7 |
| Route 1–4 | 173.7 | 0.194 | 79 | 741.5 |
| Route 1–5 | 431.1 | 0.485 | 80 | 749.2 |
| Route 2–3 | 251.3 | 0.230 | 46 | 523.1 |
| Route 2–5 | 216.8 | 0.231 | 73 | 531.5 |
| Route 4–5 | 469.1 | 0.498 | 88 | 539.1 |
| Route 4–8 | 206.3 | 0.421 | 42 | 489.8 |
| Route 5–6 | 183.4 | 0.182 | 92 | 837.2 |
| Route 6–7 | 197.0 | 0.190 | 86 | 621.9 |
| Route 6–8 | 433.1 | 0.451 | 69 | 782.3 |
| Route 7–8 | 478.4 | 0.492 | 58 | 599.5 |
| Route 8–9 | 142.2 | 0.202 | 73 | 673.2 |
© 2017 by the authors. Licensee MDPI, Basel, Switzerland. This article is an open access article distributed under the terms and conditions of the Creative Commons Attribution (CC BY) license (http://creativecommons.org/licenses/by/4.0/).
Share and Cite
Yamamoto, K.; Li, X. Safety Evaluation of Evacuation Routes in Central Tokyo Assuming a Large-Scale Evacuation in Case of Earthquake Disasters. J. Risk Financial Manag. 2017, 10, 14. https://doi.org/10.3390/jrfm10030014
Yamamoto K, Li X. Safety Evaluation of Evacuation Routes in Central Tokyo Assuming a Large-Scale Evacuation in Case of Earthquake Disasters. Journal of Risk and Financial Management. 2017; 10(3):14. https://doi.org/10.3390/jrfm10030014
Chicago/Turabian StyleYamamoto, Kayoko, and Ximing Li. 2017. "Safety Evaluation of Evacuation Routes in Central Tokyo Assuming a Large-Scale Evacuation in Case of Earthquake Disasters" Journal of Risk and Financial Management 10, no. 3: 14. https://doi.org/10.3390/jrfm10030014
APA StyleYamamoto, K., & Li, X. (2017). Safety Evaluation of Evacuation Routes in Central Tokyo Assuming a Large-Scale Evacuation in Case of Earthquake Disasters. Journal of Risk and Financial Management, 10(3), 14. https://doi.org/10.3390/jrfm10030014