
The Effects of Land-Use and Climatic Changes on the Hydrological Environment in the Qinling Mountains of Shaanxi Province


Abstract
1. Introduction
2. Materials and Methods
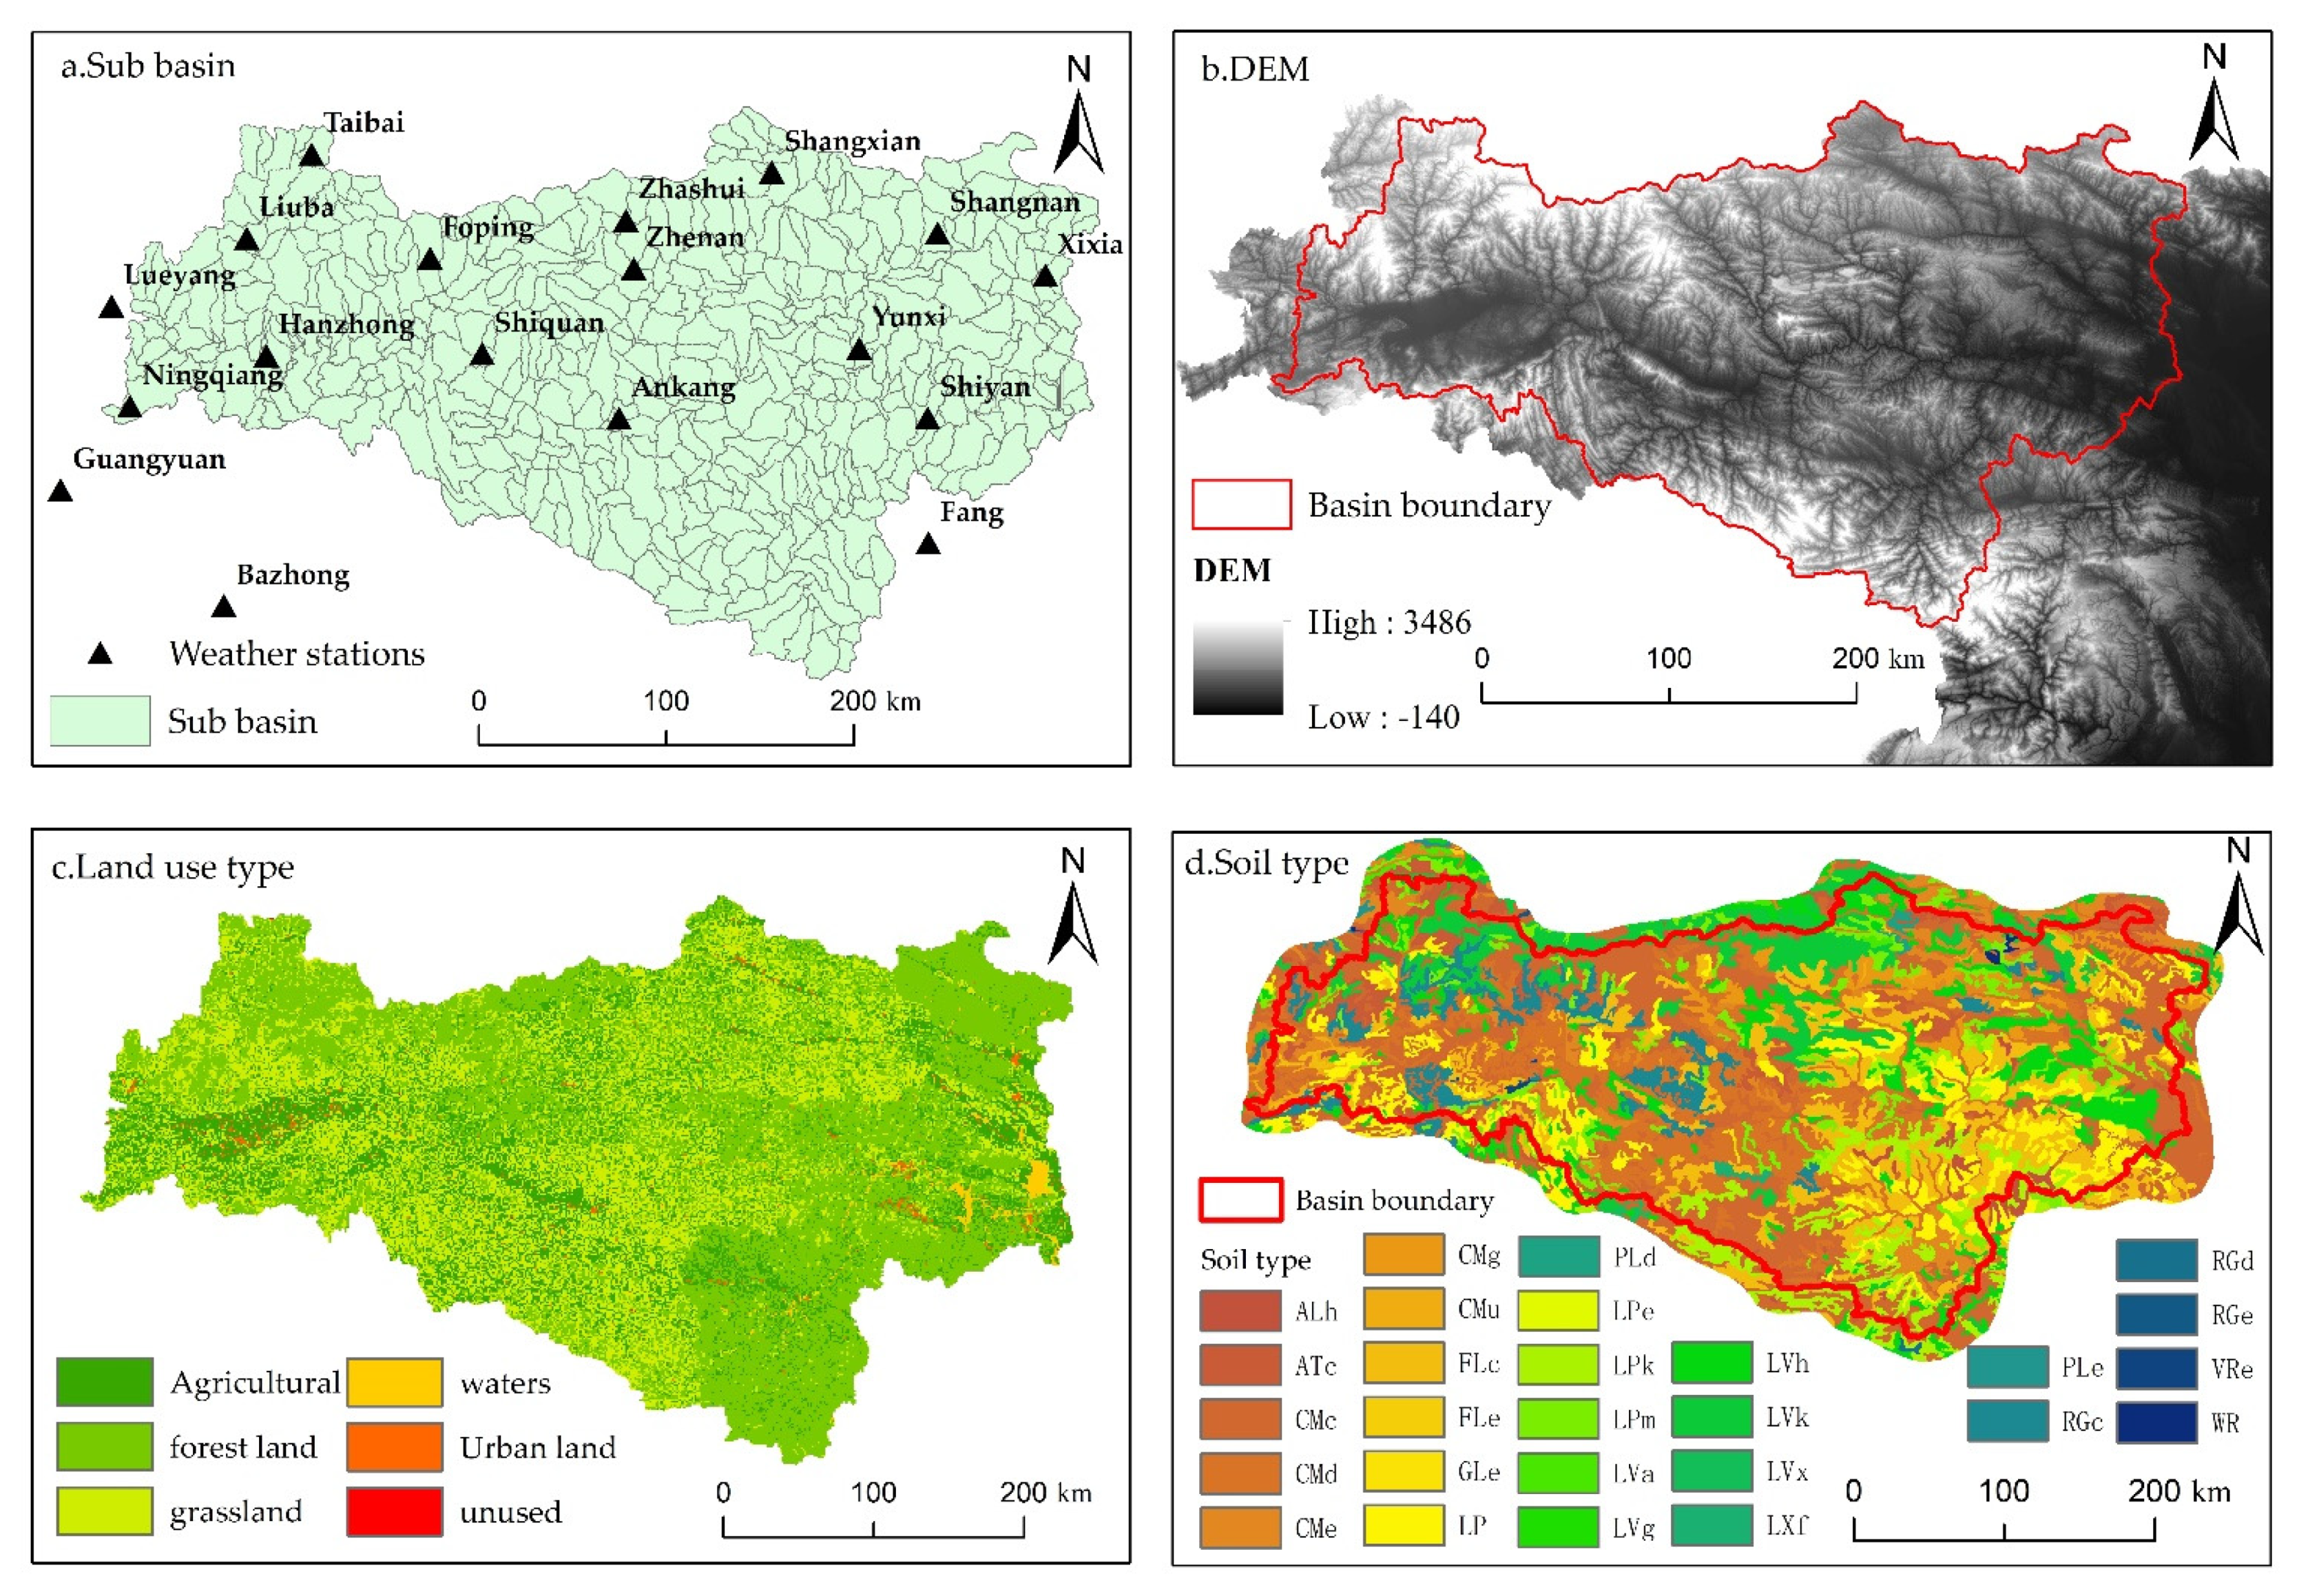
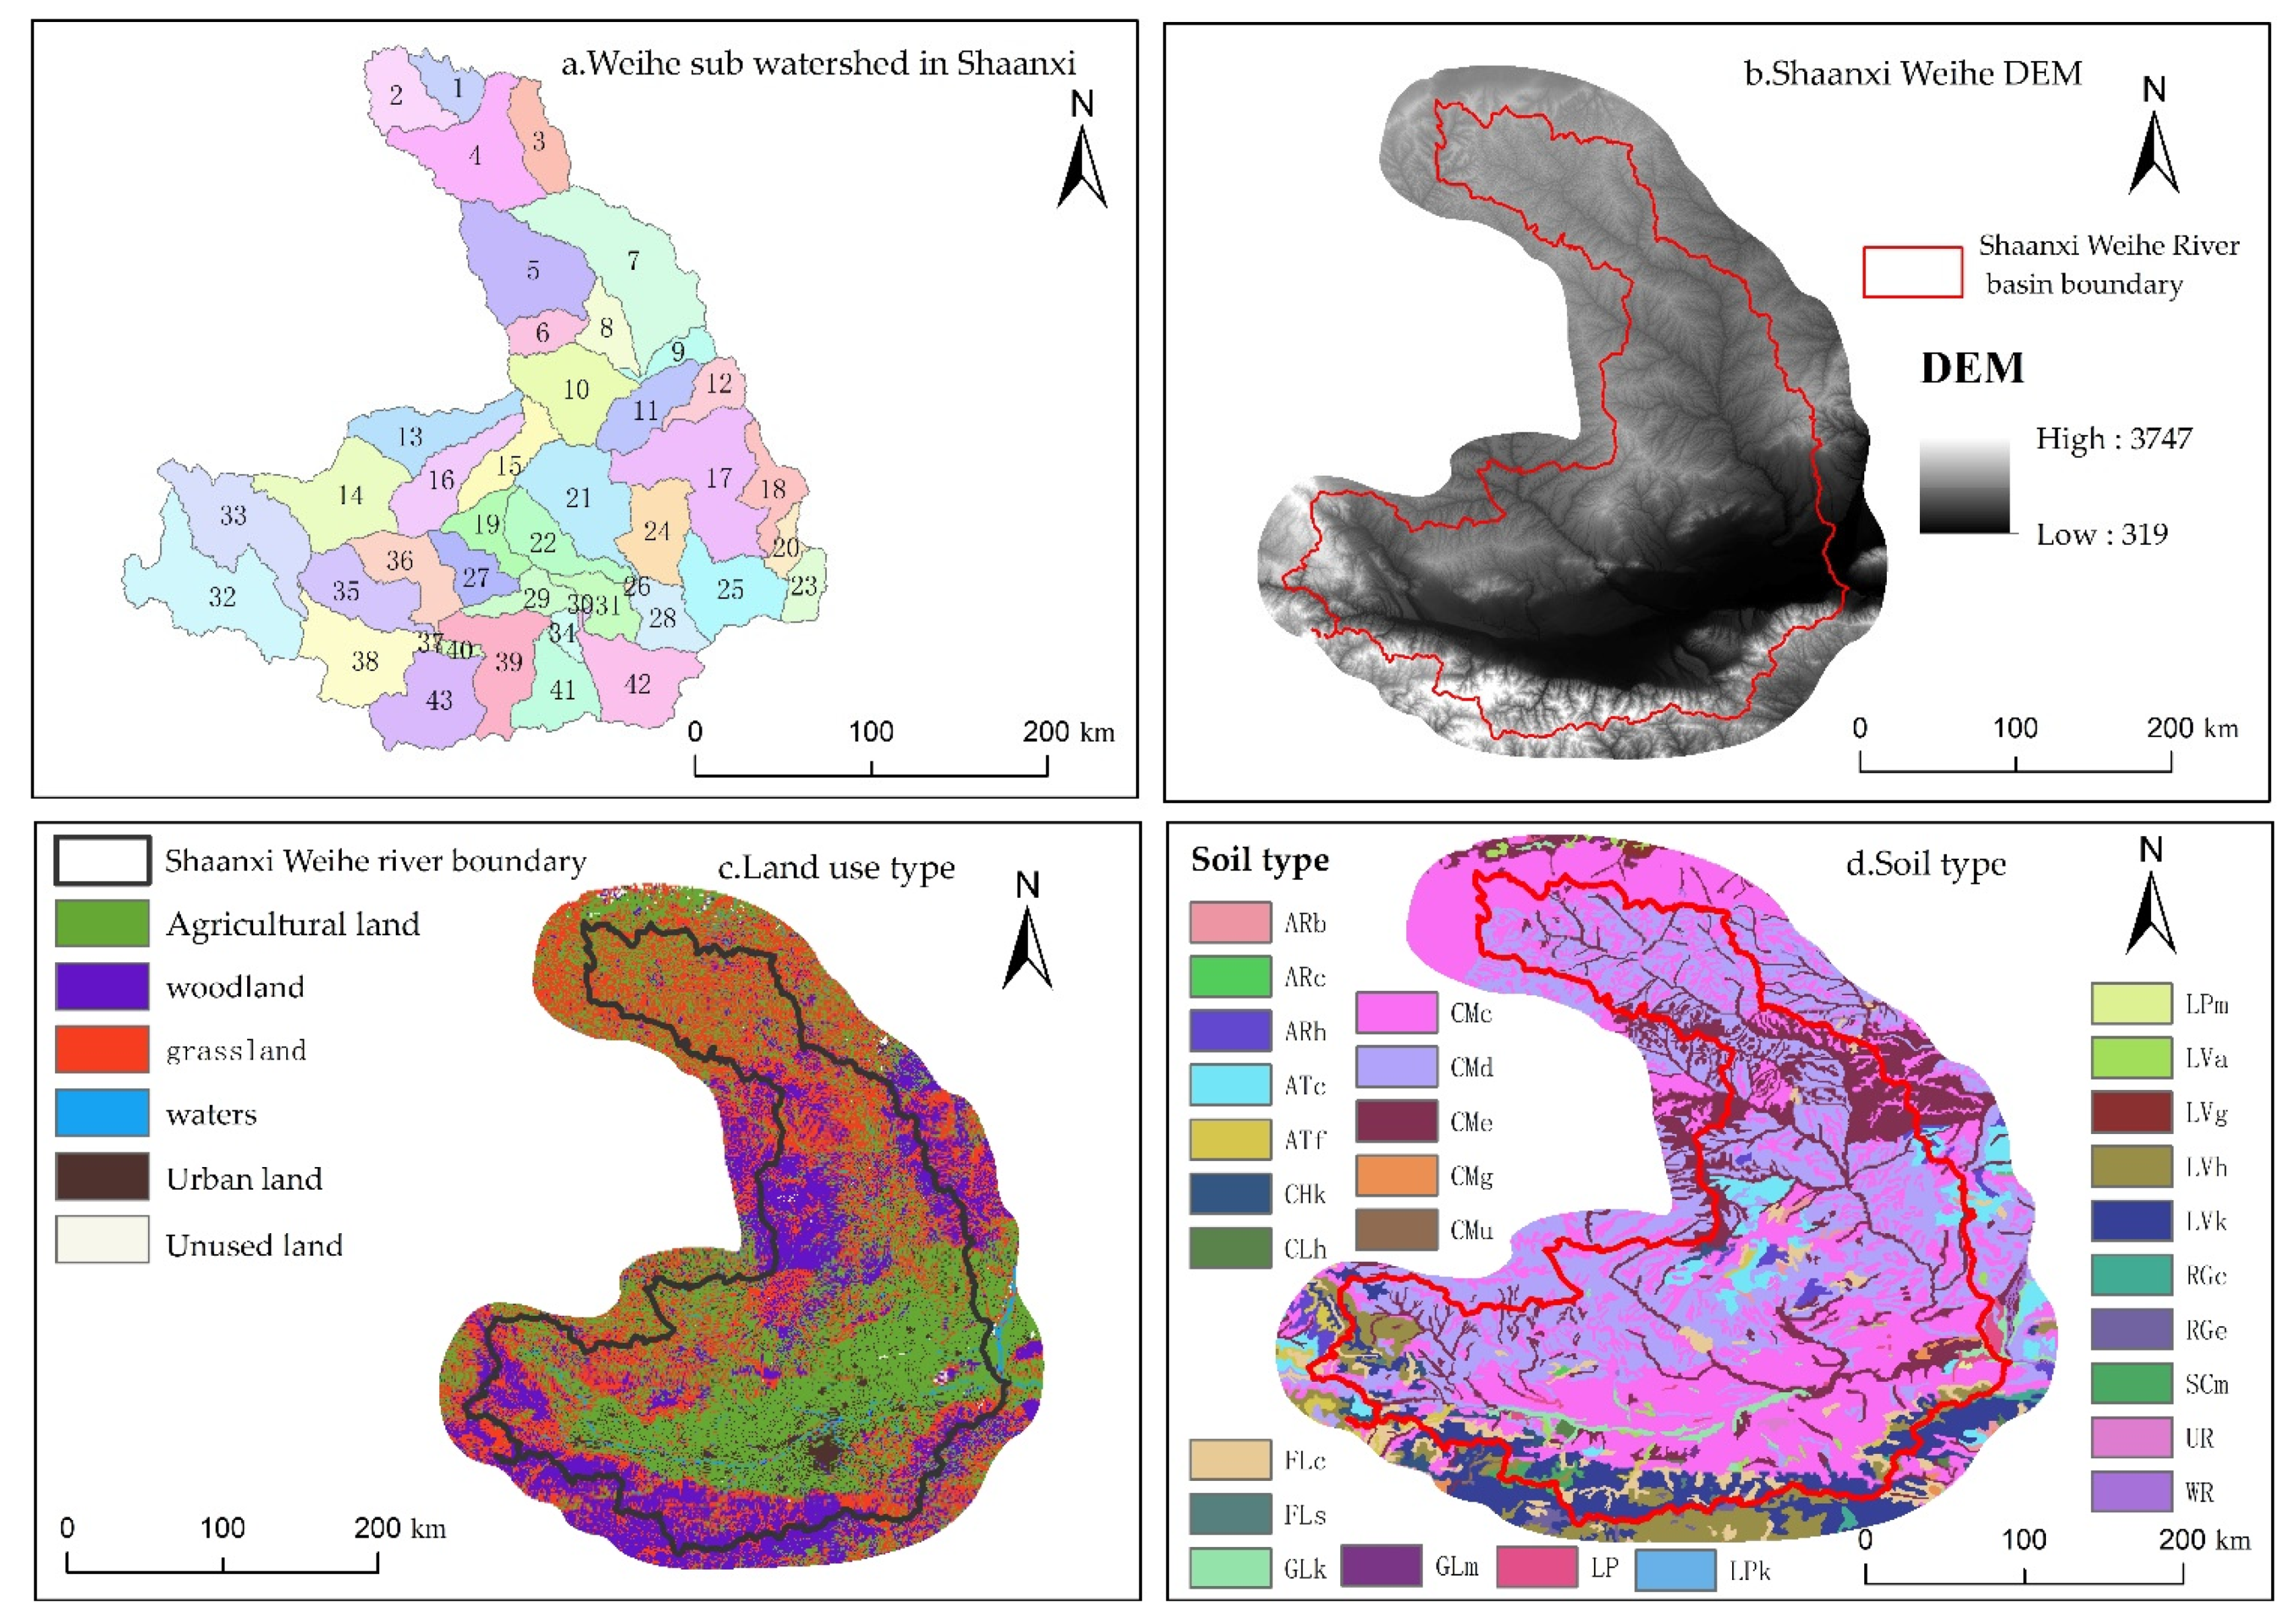
2.1. Study Area
2.2. Soil and Water Assessment Tool (SWAT) Model
2.3. PLUS Model
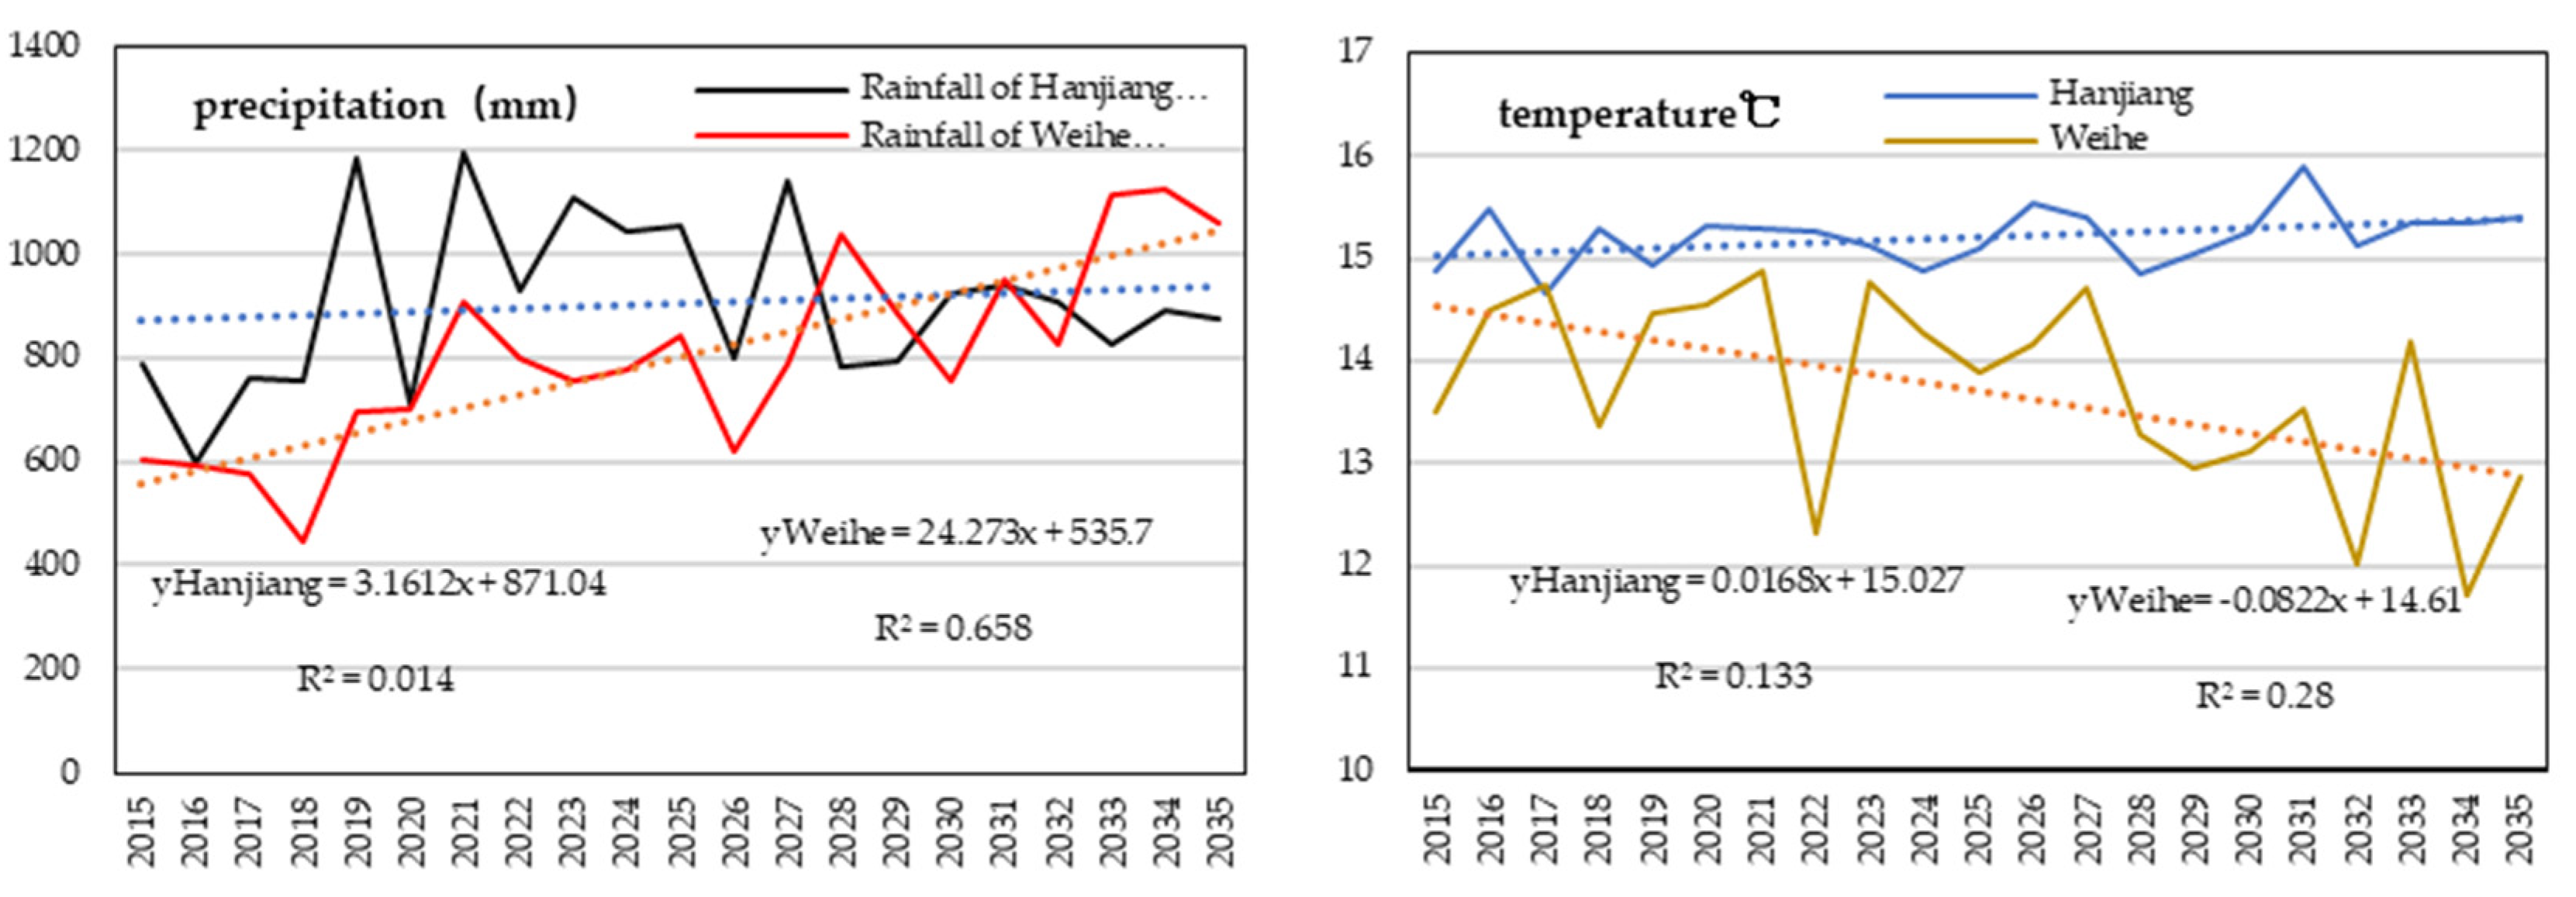
2.4. BCC/RCG-WG Weather Generator
2.5. Scenario Setting
2.6. Data Sources
3. Results
3.1. Response Model Construction of Land Use, Climate Change, and Runoff Change in the Qinling Mountains
- (1)
- Sensitivity parameter setting
- (2)
- Calibration and validation results
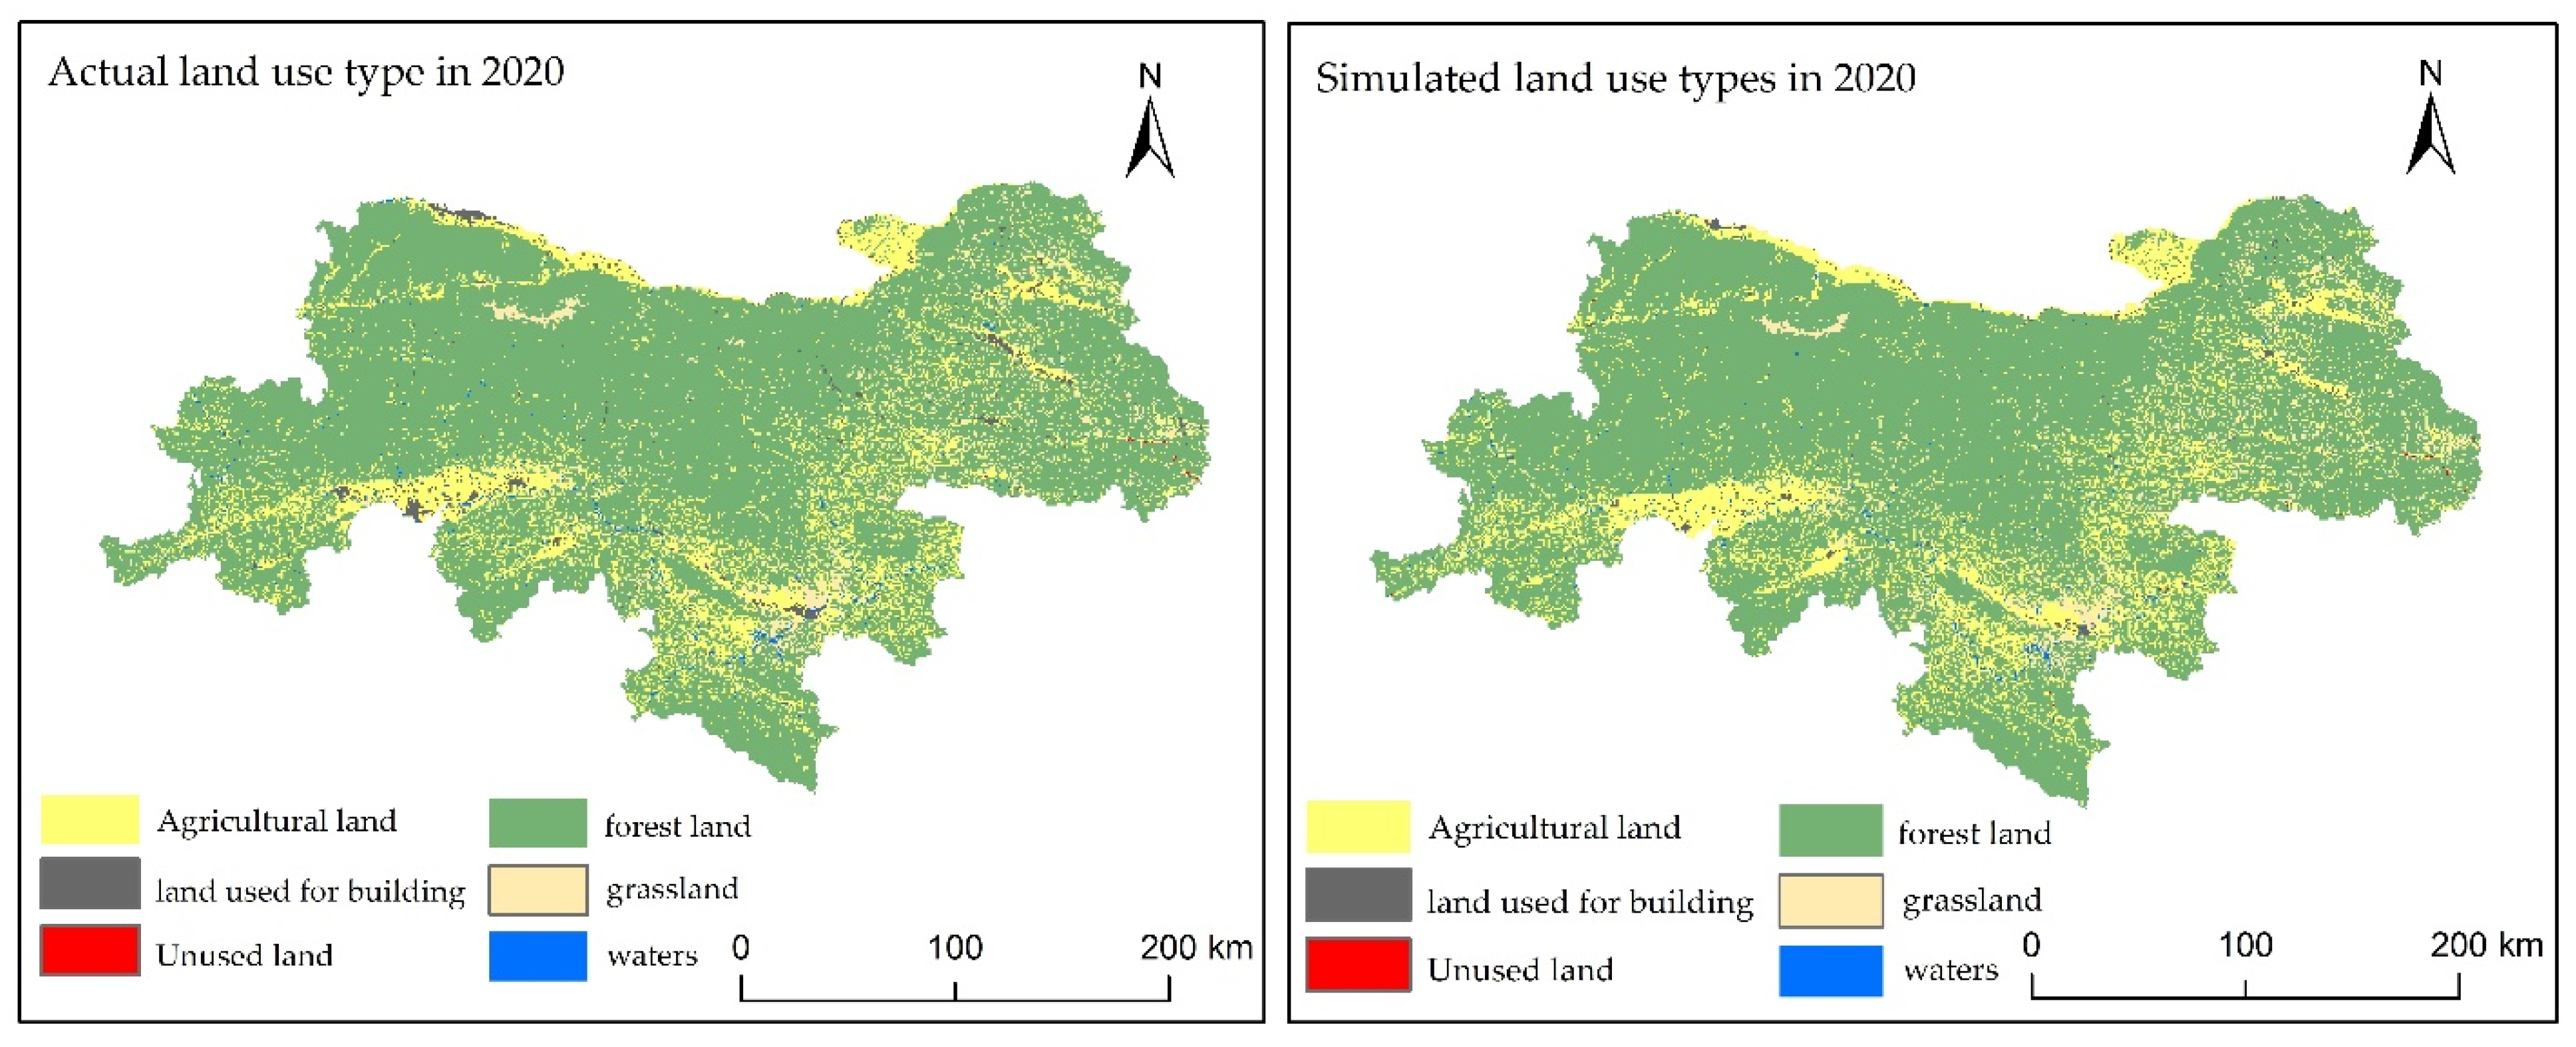
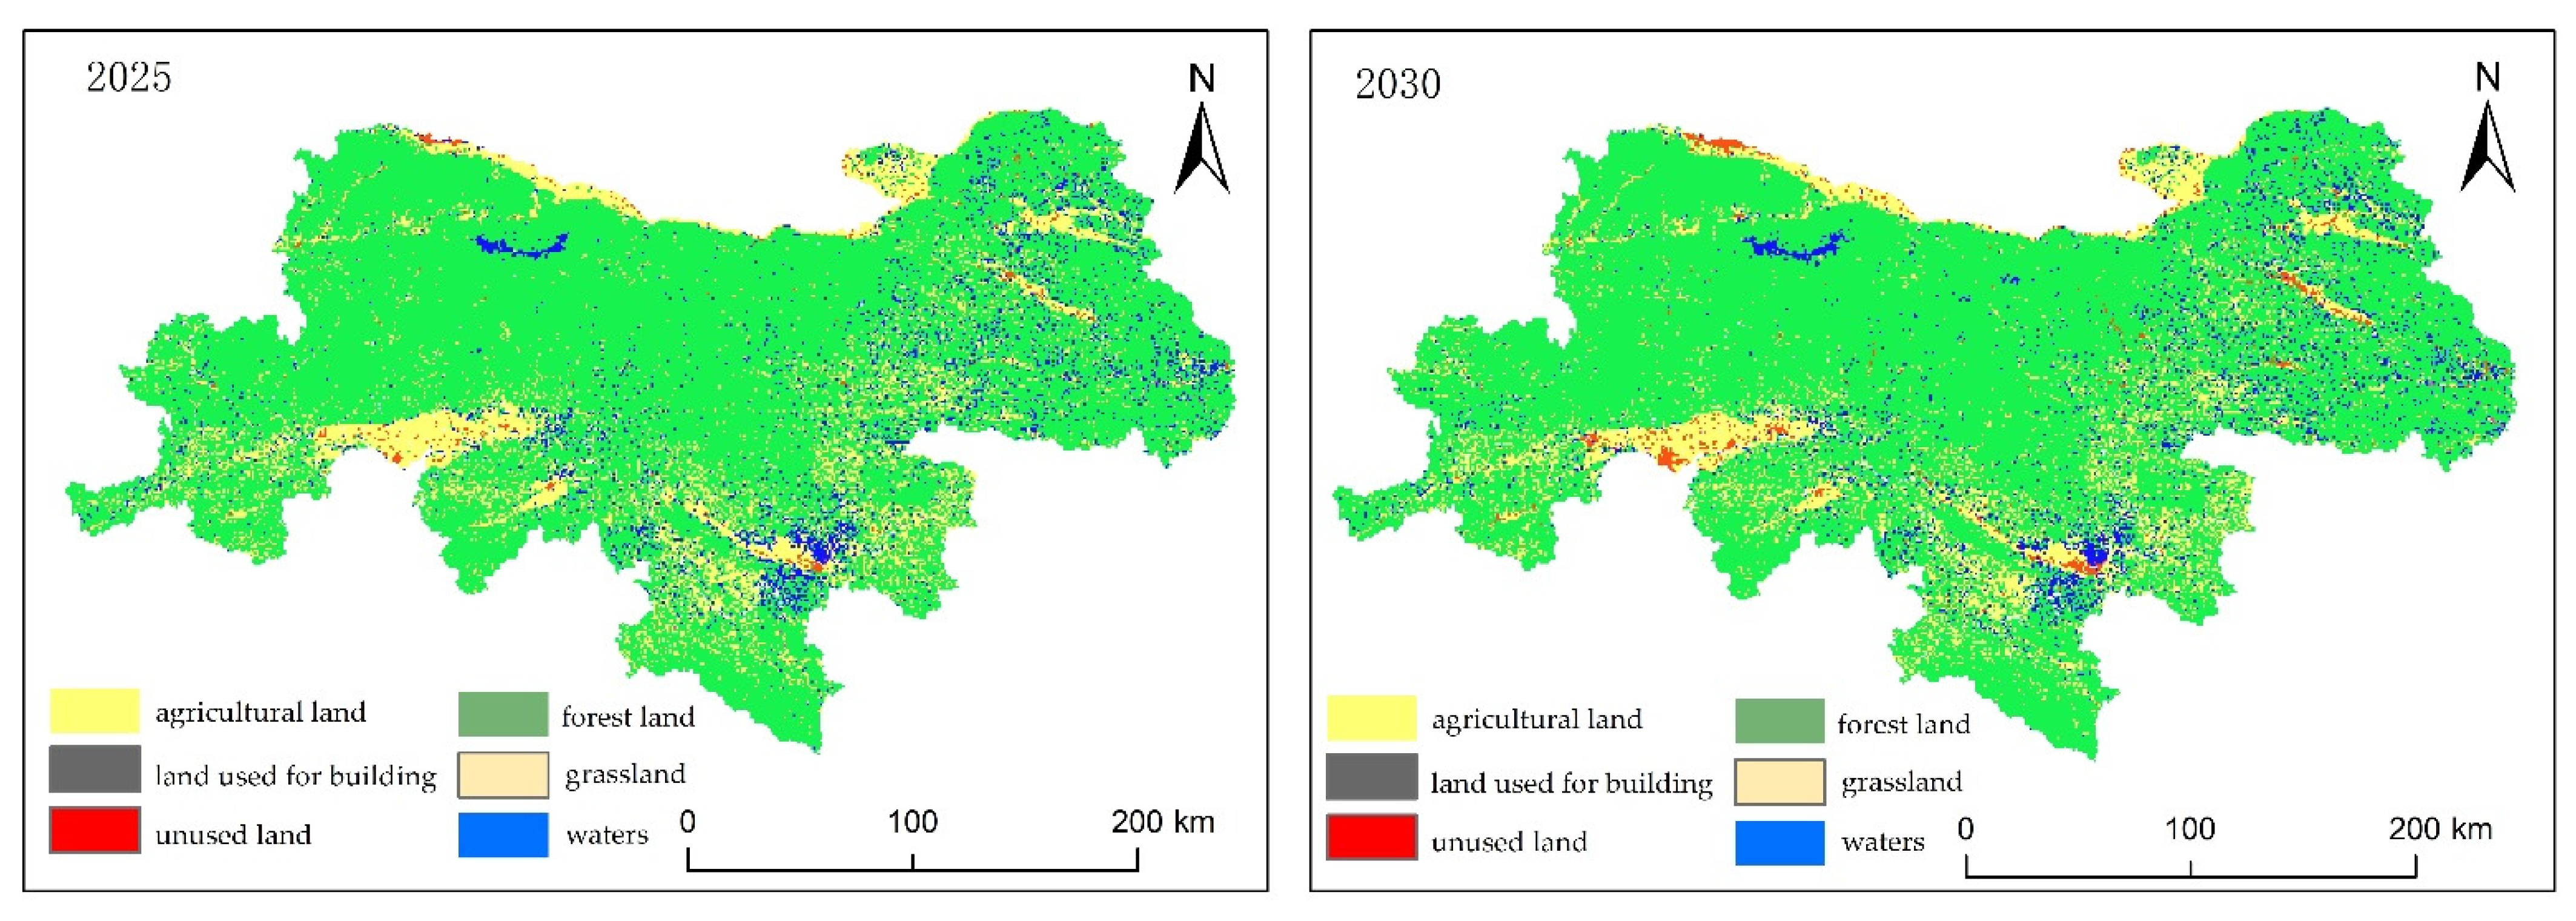
3.2. Prediction and Simulation of Land-Use Changes Based on the PLUS Model
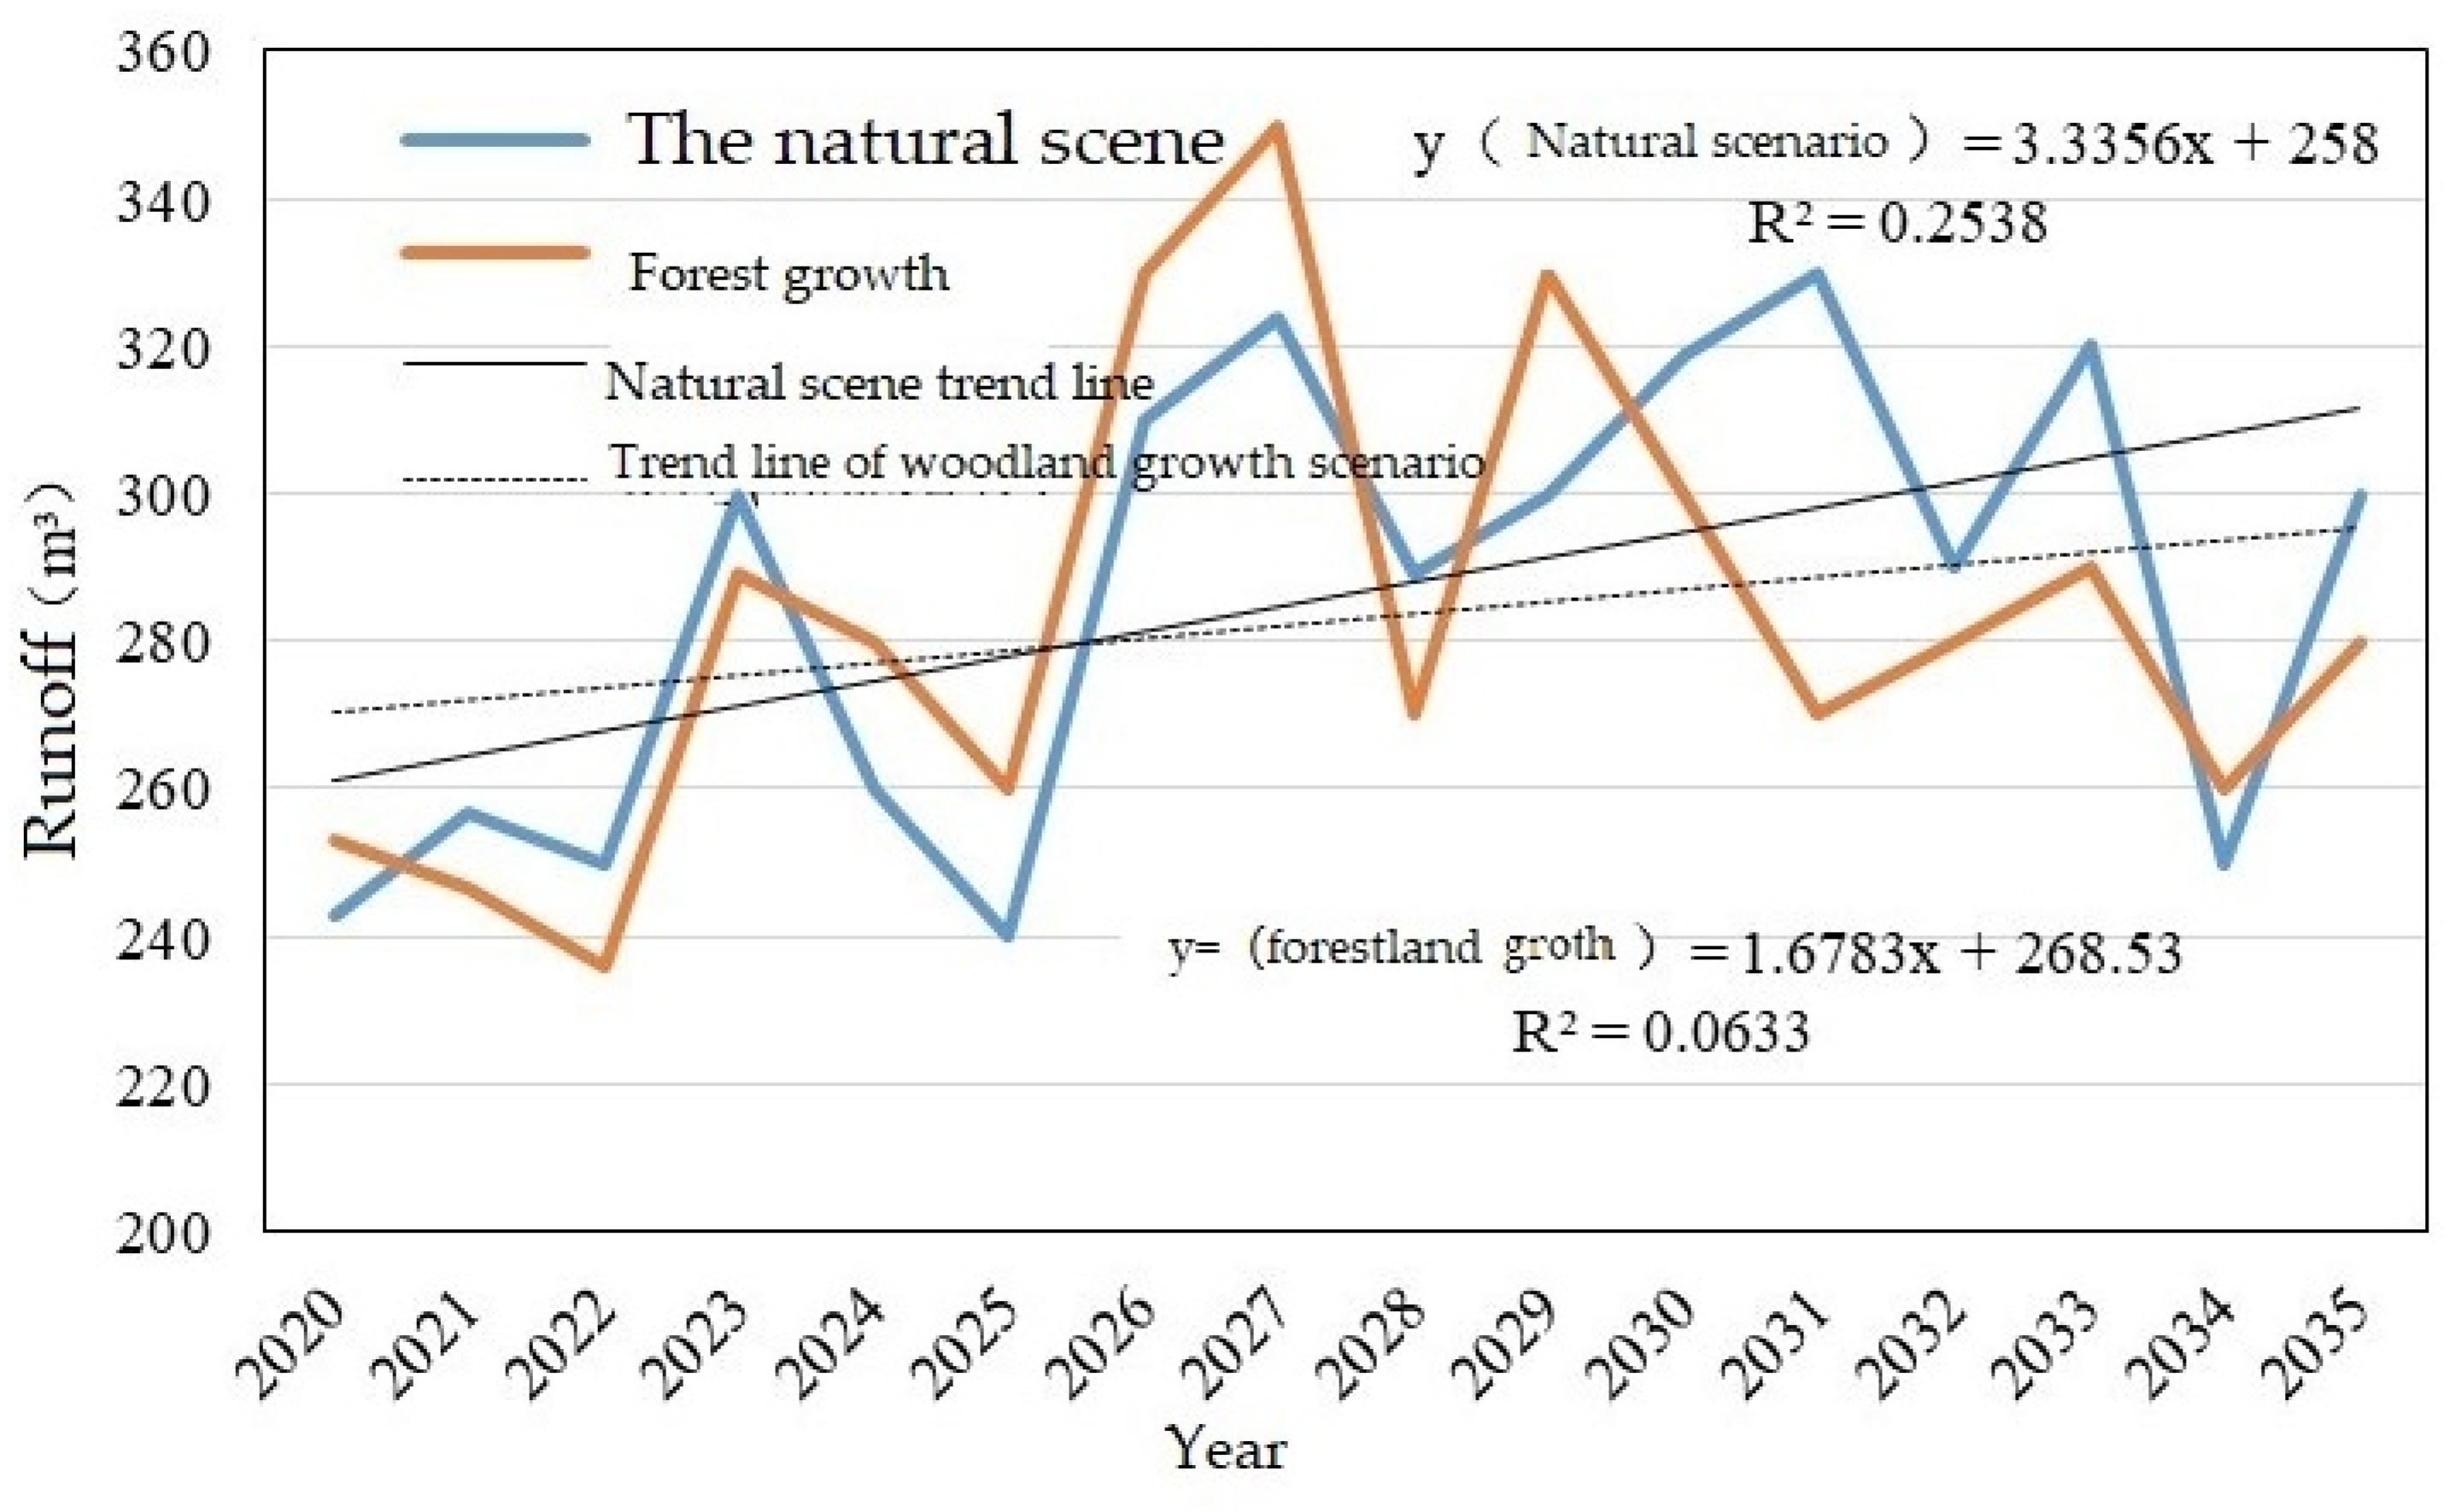
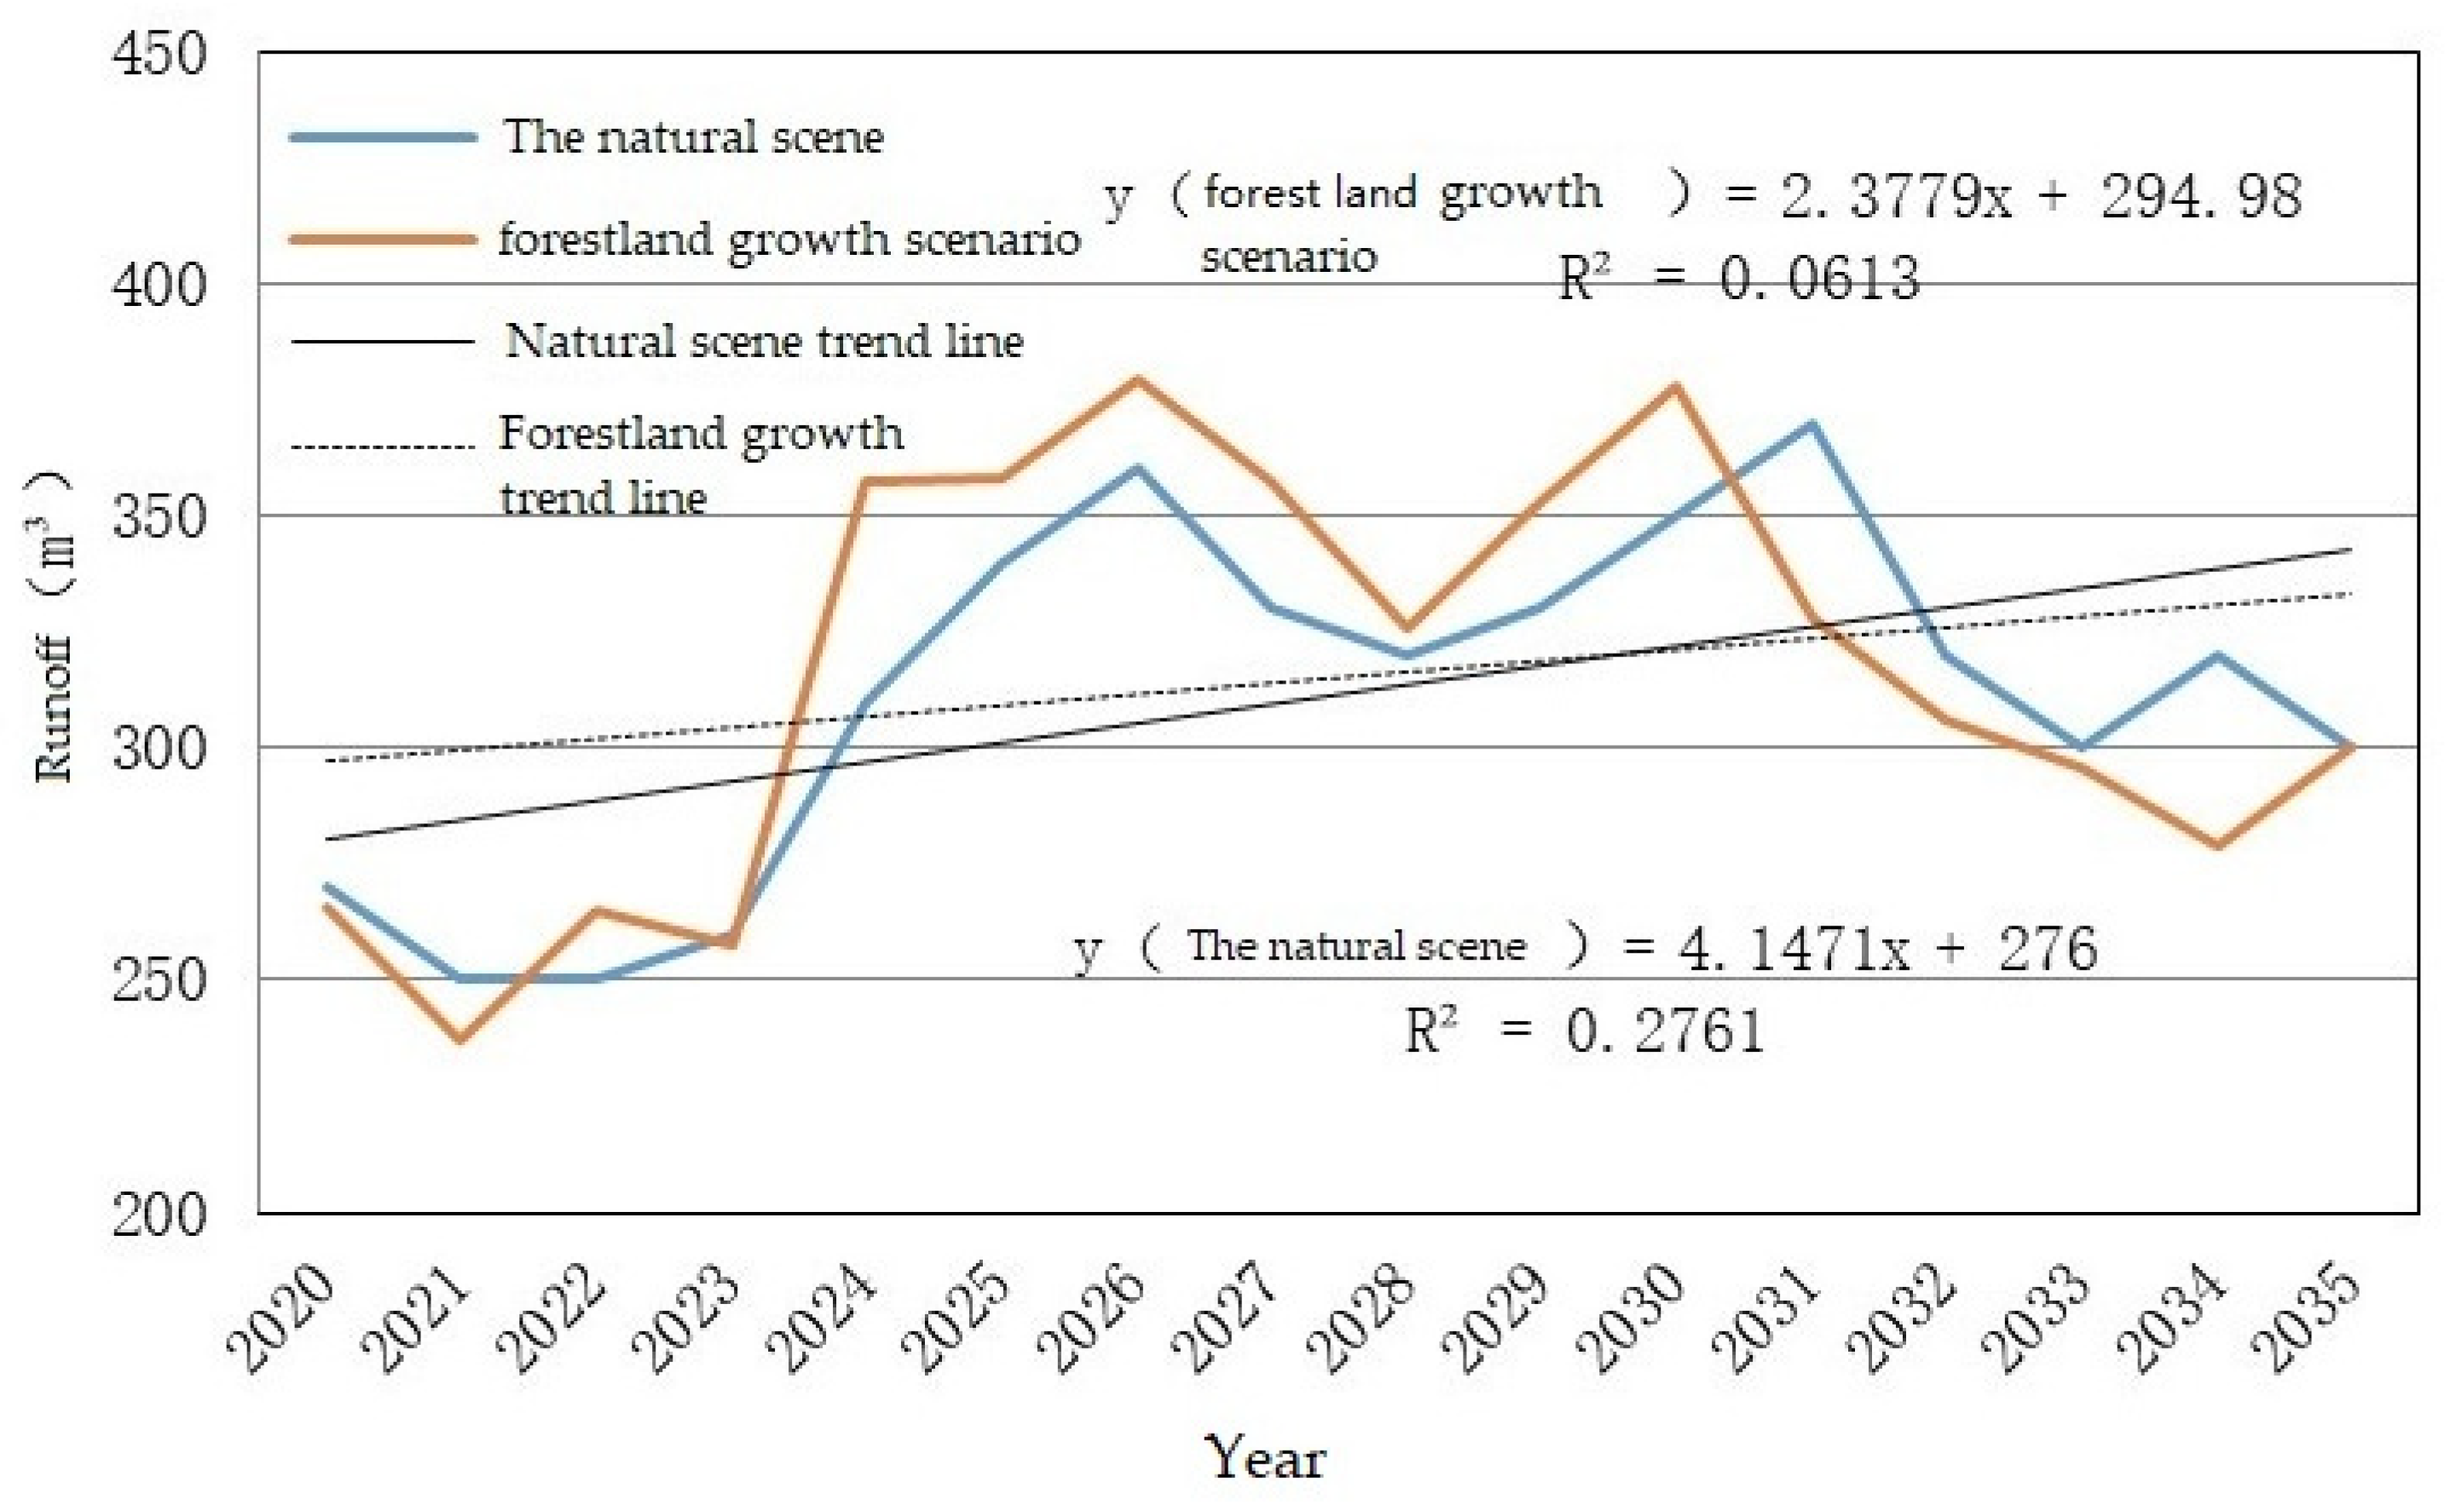
3.3. Impact of Land-Use Change on Future Runoff Based on Scenario Analysis
4. Discussion
5. Conclusions
- (1)
- The method adopted in this paper has been widely used in many other regions, but there are differences in climate change and land-use prediction methods. Most studies use international climate scenario data for climate change prediction, and the downscaling process often affects the simulation results. The land-use and land-cover change (LUCC) scenario settings of most studies were not analyzed in combination with national policies and the specific conditions of the study area. These problems can affect the results of research and the analysis of scientific problems. On the basis of the coupling of the new land-use model (PLUS), a land-use scenario was established by combining actual local policies, and the domestic weather generator model was used in climate change prediction. This is more realistic and enhances the practicability of the research results, so as to better serve policy making.
- (2)
- The protection of the Qinling forest area should follow the scientific method, and the evaluation index of ecological achievements should also pass scientific demonstration. Most of the previous studies focused on simple climate change and vegetation response, and most of the research results did not involve policy services. Translating research results into usable policies is the main direction of scientific research, and this direction is the main scientific problem of future climatic and land-use change research.
- (3)
- The hydrological model was first used to simulate the response relationship among climate, land use, and runoff in the northern and southern Qinling valleys. The results also reflect the north and south Qinling mountains’ differences in climate, land-use, and runoff changes. As reference for related research, the results can also be used as a scientific reference for ecological-protection and land-use planning policies in order to realize sustainability and economic development in the Qinling ecological environment while mitigating the influence of climate change.
Supplementary Materials
Author Contributions
Funding
Data Availability Statement
Conflicts of Interest
References
- Zhang, J.H.; Zhu, L.Q.; Li, G.D.; Zhao, F.; Qin, J.T. Spatial pattern of SOC/TN content and its significance for determining the boundary between warm temperate zone and subtropical zone in Northern and Southern Transitional Zone of China. Acta Geogr. Sin. 2021, 76, 2269–2282. [Google Scholar]
- Li, J.H.; Tao, J.B.; Cheng, B. Altitude sensitivity of vegetation phenology in spring in Qinling Mountains. Chin. J. App. Ecol. 2021, 32, 2089–2097. [Google Scholar]
- Zheng, Z.Y.; Jin, L.Y.; Li, J.J.; Zhang, X.J.; Wang, Z.Q. Changes of average temperature in Shennongjia region recorded by tree rings since 1808. Quat. Sci. 2021, 41, 334–345. [Google Scholar]
- Qi, G.Z.; Bai, H.Y.; Zhao, T.; Meng, Q.; Zhang, S. Sensitivity and spatial difference of vegetation response to dry and wet changes on the north and south slopes of Shaanxi section of Qinling Mountains. Acta Geogr. Sin. 2021, 76, 44–56. [Google Scholar]
- Zhao, F.; Zhang, J.Y.; Liu, S.Y.; Wang, Z.Y.; Wang, L.H.; Gu, H.T.; Li, W.L. The multidimensional zonality of NPP and its response to climate change in Qinba Mountains and the warm temperate subtropical boundary. Chin. J. App. Ecol. 2021, 41, 57–68. [Google Scholar]
- Mao, M.C.; Cai, X.L.; Gao, M.S. Verification of annual precipitation zoning and Its Interannual Variation in Qinling Mountains based on vegetation zoning. GEOGR RES-AUST 2020, 39, 2833–2841. [Google Scholar]
- Li, S.S.; Wang, C.B.; Yan, J.P.; Liu, X.F. Temporal and spatial characteristics of extreme precipitation in the north and south of Qinling Mountains based on event process. Acta Geogr. Sin. 2020, 75, 989–1007. [Google Scholar]
- Yao, Y.; Yu, H.; Kou, Z. Spatial patterns of Pinus tabulaeformis and Pinus massoniana forests in Qinling-Daba Mountains and the boundary of subtropical and warm temperate zones. Acta Geogr. Sin. 2020, 30, 11–22. [Google Scholar] [CrossRef]
- Yin, C.; Yang, Y.; Yang, F.; Chen, X.; Xin, Y.; Luo, P. Diagnose the dominant climate factors and periods of spring phenology in Qinling Mountains, China. Ecol. Indic. 2021, 131, 108–211. [Google Scholar] [CrossRef]
- Zhao, T.; Bai, H.Y.; Yuan, Y.; Deng, C.; Qi, G.; Zhai, D. Spatio-temporal differentiation of climate warming(1959–2016) in the middle Qinling Mountains of China. J. Geogr. Sci. 2020, 30, 657–668. [Google Scholar] [CrossRef]
- Bai, H.Y.; Ma, X.P.; Gao, X.; Hou, Q.L. Changes of temperature and 0 °C isotherm in January in Qinling Mountains based on DEM. Acta Geogr. Sin. 2012, 67, 1441–1450. [Google Scholar]
- Deng, C.H.; Bai, H.Y.; Ma, X.P.; Huang, X.Y.; Zhao, T. Phenological change characteristics and North-South differences of vegetation in Qinling Mountains from 2000 to 2017. Chin. J. App. Ecol. 2021, 41, 1068–1080. [Google Scholar]
- Guo, J.; Liu, X.; Ge, W.; Ni, X.; Ma, W.; Lu, Q.; Xing, X. Specific Drivers and Responses to Land Surface Phenology of Different Vegetation Types in the Qinling mountains, Central China. Remote Sens. 2021, 13, 4538. [Google Scholar] [CrossRef]
- Zhang, X.; Zhang, B.; Yao, Y.; Wang, J.; Yu, F.; Liu, J.; Li, J. Dynamics and climatic drivers of evergreen vegetation in the Qinling-Daba mountains of China. Ecol. Indic. 2022, 136, 108–625. [Google Scholar] [CrossRef]
- Ma, X.P.; Bai, H.Y.; Deng, C.H.; Wu, T. Sensitivity of Vegetation on Alpine and Subalpine Timberline in Qinling Mountains to Temperature Change. Forests 2019, 10, 1105. [Google Scholar] [CrossRef]
- Yan, B.Q.; Jian, Y.; Liu, Q.J.; Wang, L.H.; Hu, L.L. Tree-ring response of Larix chinensis on regional climate and sea-surface temperature variations in alpine timberline in the Qinling mountains. J. For. Res. 2020, 31, 209–218. [Google Scholar] [CrossRef]
- Zhang, S.H.; Bai, Y.; Song, L.L.; Zhan, X.W.; Qu, Y.; Liang, J. Spatio-temporal evolution of accumulated temperature ≥10 °C and the boundary between subtropical and warm temperate zones in the Qinling Mountains in recent 60 years. J. Ecol. Rural. Environ. 2022, 38, 755–764. [Google Scholar]
- Huang, Z.; Cao, Y.X.; Xu, X.J.; Chen, S.; Feng, H.; Wang, Z.; Yu, Q.; He, J.Q. Water use efficiency of Qinling ecosystem based on multi-source GPP and ET products. J. Soil Water Conserv. 2022, 37, 1–15. [Google Scholar]
- Ji, Y.H.; Zhou, G.S.; Wang, S.T.; Wang, L.X.; Zhou, M.Z. Evolution characteristics and driving forces of vegetation ecological quality in Qinling mountains from 2000 to 2019. J. Plant Ecol. 2021, 45, 617–625. [Google Scholar] [CrossRef]
- Bai, Y.Y.; Han, Y.J.; Wang, K.K.; Liu, B. Response of conifer species to climate change in Qinling mountains. Chin. J. Appl. Ecol. 2021, 32, 3715–3723. [Google Scholar]
- Cui, G.Y.; Zhang, Y.; Chao, Y.; Zhao, Y.H.; Pan, B.H. Land use change and its ecological environment effect in Qinling Mountains in recent 40 years. Res. Soil Water Conversat. 2022, 33, 1–8. [Google Scholar]
- Qi, G.; Song, J.; Li, Q. Response of vegetation to multi-timescales drought in the Qinling mountains of China. Ecol. Indic. 2022, 135, 108–139. [Google Scholar] [CrossRef]
- Rani, S.; Sreekesh, S. Flow regime changes under future climate and land cover scenarios in the Upper Beas basin of Himalaya using SWAT model. Int. J. Env. Res. 2021, 78, 56–68. [Google Scholar] [CrossRef]
- Ali, A.; Hussain, M.; Ali, S.; Akhtar, K.; Muhammad, M.W.; Zamir, A.; Ali, A.; Nizami, S.M.; Ahmad, B.; Harrison, M.T.; et al. Ecological Stoichiometry in Pinus massoniana L. Plantation: Increasing Nutrient Limitation in a 48-Year Chronosequence. Forests 2022, 13, 469. [Google Scholar] [CrossRef]
- Serrao, E.; Silva, M.T.; Ferreira, T.R.; de Ataide, L.C.P.; dos Santos, C.A.; de Lima, A.M.M.; de Lima, A.M.M.; Sousa, F.; Gomes, D.J.C. Impacts of land use and land cover changes on hydrological processes and sediment yield determined using the SWAT model. Int. J. Sed. Res. 2022, 37, 54–69. [Google Scholar] [CrossRef]
- Zubaidai, M.B.L.; Shi, Q.D.; Pilati, M.H.T.; Zhang, R. Effects of land use and climate change on runoff in the upper reaches of Urumqi River based on SWAT model. Acta Ecol. Sin. 2018, 38, 5149–5157. [Google Scholar]
- Qin, W.J.; Wang, Y.Q.; Wang, B.; Yang, W.T.; Wang, Y.J. Effects of land use and climate change on runoff in wangjiaqiao small watershed. Hydrology 2019, 39, 49–54. [Google Scholar]
- Liang, Z.; Su, X.L.; Feng, K. Drought propagation and construction of a comprehensive drought index based on the Soil and Water Assessment Tool (SWAT) and empirical Kendall distribution function: A case study for the Jinta River basin in northwestern China. Nat. Hazards Earth Syst. Sci. 2021, 21, 66–78. [Google Scholar] [CrossRef]
- Ma, Y.X.; Xia, L.; Fan, Y.; Gao, Y.Y. Land use and climate change on the influence of the loess area typical river water and sediment changes. J. Soil Water Conserv. 2021, 35, 38–46. [Google Scholar]
- Natumanya, E.; Ribeiro, N.; Mwanjalolo, M.J.G.; Steinbruch, F. Using SWAT Model and Field Data to Determine Potential of NASA-POWER Data for Modelling Rainfall-Runoff in Incalaue River Basin. Comput. Water Energy Environ. Eng. 2022, 11, 19. [Google Scholar] [CrossRef]
- Bizuneh, B.B.; Moges, M.A.; Sinshaw, B.G.; Kerebih, M.S. SWAT and HBV models' response to streamflow estimation in the upper Blue Nile Basin, Ethiopia. Water Energy Nexus 2021, 4, 41–53. [Google Scholar] [CrossRef]
- Claggett, S.; Quinn, K.; Lazari, M.; Esterby, J.; Esterby, M.; van Dam, R.M. A new paradigm for programming and controlling automated radiosynthesizers. Soc. Nucl. Med. Annu. Meet. USA 2012, 53, 1471. [Google Scholar]
- Li, A.L.; Zhou, Y.; Tang, L.Y.; Niu, L.D.; Pan, M. Land use simulation and ecosystem service value assessment in Nujiang Prefecture: Multi-scenario analysis based on PLUS model. Agric. Resour. Reg. Plan. China 2022, 1–12. Available online: http://kns.cnki.net/kcms/detail/11.3513.S.20220415.1200.006.html (accessed on 21 January 2021).
- Lin, T.; Yang, M.Z.; Wu, D.F.; Liu, F.; Yang, J.H.; Wang, Y.J. Spatial correlation and prediction of carbon storage in Guangdong Province based on InVEST PLUS model. China Environ. Sci. 2022, 15, 1–17. [Google Scholar]
- Jiang, X.F.; Duan, H.C.; Liao, J.; Song, X.; Xue, X. Study on land use in Ganlinggao area of middle Reaches of Heihe River Basin based on PLUS-SD coupling model. JAL 2022, 13, 1–13. [Google Scholar]
- Hu, F.; Zhang, Y.; Guo, Y.; Zhang, P.P.; Lv, S.; Zhang, C.C. Spatial-temporal change and prediction of land use and habitat quality in weihe River Basin based on PLUS and InVEST model. JAL 2022, 4, 1–15. [Google Scholar]
- Liu, X.J.; Li, X.; Liang, X.; Shi, H.; Ou, J.P. Simulation of future land use change and its impact on carbon storage in China based on flus invest model. T Geogr. 2019, 39, 397–409. [Google Scholar]
- Qin, J.; Bai, H.; Zhao, P.; Fang, S.; Xiang, Y.; Huang, X. Dendrochronology-Based Normalized Difference Vegetation Index Reconstruction in the Qinling Mountains, North-Central China. Forests 2022, 13, 443. [Google Scholar] [CrossRef]
- Ma, X.; Li, J.; Zhao, K.; Wu, T.; Zhang, P. Simulation of Spatial Service Range and Value of Carbon Sink Based on Intelligent Urban Ecosystem Management System and Net Present Value Models—An Example from the Qinling Mountains. Forests 2022, 13, 407. [Google Scholar] [CrossRef]
- Yasir, M.; Hu, T.; Abdul, H.S. Impending Hydrological Regime of Lhasa River as Subjected to Hydraulic Interventions—A SWAT Model Manifestation. Remote Sens. Basel 2021, 13, 1382. [Google Scholar] [CrossRef]
- Wu, X.X.; Liu, X.P.; Liang, X.; Chen, G.L. Delimitation of urban growth boundary in the Pearl River Delta Based on multi scenario simulation of FLUS-UGB. J. Geo Inf. Sci. 2018, 20, 532–542. [Google Scholar]
- Ma, X.P.; Wu, T.; Yu, Y.Y. Study on runoff scenario prediction based on SWAT model in upper Hanjiang River Basin. RSLR 2021, 33, 174–182. [Google Scholar]
- Liao, Y.M. Research and Application of Chinese Weather Generator BCC/RCG-WG. Ph.D. Thesis, Beijing Normal University, Beijing, China, 2012. [Google Scholar]
- Liao, Y.M. Study on the variation of daily non-precipitation simulation parameters in China during 1951–1978 and 1979–2007. J. Geogr. Sci. 2013, 23, 579–594. [Google Scholar] [CrossRef]
- Liao, Y.M.; Liu, L.L.; Chen, D.L.; Xie, Y. Evaluation of the effects of weather generator simulation on non-precipitation variables in China. Acta Meteorol. Sin. 2011, 69, 310–319. [Google Scholar]
- Liao, Y.M.; Chen, D.L.; Xie, Y. Climate change characteristics of non-precipitation variable simulation parameters of BCC/RCG-WG Weather Generator. Acta Geogr. Sin. 2013, 68, 414–427. [Google Scholar]
- Zhang, D.H. Scale Effect Analysis of Hydrological Process Based on SWAT Model; Shaanxi Normal University: Xi’an, China, 2013; pp. 34–38. [Google Scholar]
- Tian, J.; Guo, S.L.; Liu, D.D.; Chen, Q.H.; Wang, Q.; Yin, J.B.; Wu, X.S.; He, S.K. Effects of climate and land use change on runoff in the han river basin. Acta Geogr. Sin. 2020, 75, 2307–2318. [Google Scholar]
- Yachongtou, B.; Liang, J.; Zeng, G.M.; Li, X.D.; Lei, M.Q.; Liu, Q. Study on the synergistic response of runoff to land use and climate change in Liuyang River Basin based on SWAT model. J. Wtr. Resour. Wtr. Eng. 2019, 30, 88–94. [Google Scholar]
- Rafiei-Sardooi, E.; Azareh, A.; Shooshtari, S.J.; Parteli, E.J.R. Long-term assessment of land-use and climate change on water scarcity in an arid basin in Iran. Ecol. Model. 2022, 467, 109–134. [Google Scholar] [CrossRef]
- Martínez-Retureta, R.; Aguayo, M.; Abreu, N.J.; Stehr, A.; Duran-Llacer, I.; Rodríguez-López, L.; Sauvage, S.; Sánchez-Pérez, J.-M. Estimation of the Climate Change Impact on the Hydrological Balance in Basins of South-Central Chile. Water 2021, 13, 794. [Google Scholar] [CrossRef]
- He, X.H.; Meng, J.L.; Guo, H.L.; Tian, Z.H. Impacts of land use and climate change on runoff in Luohe River Basin. Hydropower Energy Sci. 2021, 39, 31–34. [Google Scholar]
- Zeng, S.D.; Xia, J.; Du, H.; Zhang, L.P.; Chen, X.D.; Wang, R.C.; ADITYA, S. Effects of climate change, land use/cover change and elevated CO2 concentration on runoff in the Luanhe River Basin. Pro. Wtr. Sci. 2014, 25, 10–20. [Google Scholar]
- Umair, M.; Kim, D.; Choi, M. Impacts of land use/land cover on runoff and energy budgets in an East Asia ecosystem from remotely sensed data in a community land model. Sci. Total Environ. 2019, 684, 156–266. [Google Scholar] [CrossRef]
- Anache, J.A.A.; Flanagan, D.C.; Srivastava, A.; Wendland, E.C. Land use and climate change impacts on runoff and soil erosion at the hillslope scale in the Brazilian Cerrado. Sci. Total Environ. 2018, 622, 140–151. [Google Scholar] [CrossRef]
- Yang, Y.; Weng, B.; Man, Z.; Yu, Z.; Zhao, J. Analyzing the contributions of climate change and human activities on runoff in the Northeast Tibet Plateau. JOH 2020, 27, 100–139. [Google Scholar] [CrossRef]
- RS, N. A hydrological-modeling study of the impact of land use/land cover and climate change on runoff in a watershed in the western Brazilian Amazonia. Pediatr. Qual. Saf. 2016, 2, 256–268. [Google Scholar]
- Martínez-Retureta, R.; Aguayo, M.; Abreu, N.J.; Urrutia, R.; Echeverría, C.; Lagos, O.; Rodríguez-López, L.; Duran-Llacer, I.; Barra, R.O. Influence of Climate and Land Cov-er/Use Change on Water Balance: An Approach to Individual and Combined Effects. Water 2022, 14, 2304. [Google Scholar] [CrossRef]
- Sun, J.Q.; Hong, Y.L.; Wang, X.J.; Shahid, S. Water resources response and prediction under climate change in Tao’er River Basin, Northeast China. J. Mt. Sci. 2021, 18, 11. [Google Scholar] [CrossRef]
- Li, B.; Shi, X.; Lian, L.; Li, B.F.; Shi, X.; Lian, L.S.; Chen, Y.N.; Chen, Z.S.; Sun, X.Y. Quantifying the effects of climate variability, direct and indirect land use cover change, and human activities on runoff. J. Hydrol. 2020, 584, 124–184. [Google Scholar] [CrossRef]
- Chen, Q.H. Impacts of climate change and LULC change on runoff in the Jinsha River Basin. J. Geogr. Sci. 2020, 30, 86–103. [Google Scholar] [CrossRef]
- Arantes, L.T.; Carvalho, A.C.P.; Carvalho, A.P.P.; Lorandi, R.; Moschini, L.E.; Di Lollo, J.A. Surface runoff associated with climate change and land use and land cover in Southeast region of Brazil. Environ. Chall. 2021, 3, 100054. [Google Scholar] [CrossRef]
- Hildebrand, D.S. Meteorological Impacts on Streamflow: Analyzing Anthropogenic Climate Change’s Effect on Runoff and Streamflow Magnitudes in Virginia’s Chesapeake Bay Watershed. Master’s Thesis, Virginia Polytechnic Institute and State University, Blacksburg, VA, USA, 6 August 2020. [Google Scholar]
- Zhang, H.; Meng, C.; Wang, Y.; Wang, Y.; Li, M. Comprehensive evaluation of the effects of climate change and land use and land cover change variables on runoff and sediment discharge. Sci. Total Environ. 2020, 702, 1–16. [Google Scholar] [CrossRef] [PubMed]
- Liu, Z.T.; Chen, R.Z.; Wang, W. Assessment of cumulative impact of climate change and land use change on runoff change in the Source region of the Yellow River. People Pearl River 2022, 56, 1–10. [Google Scholar]
- Huo, J.J.; Yi, M.Q.; Wang, J.; Jiang, Y.J. Response analysis of runoff to land use and climate change in Lhasa River Basin. J. Yangtze River Sci. Res. Inst. 2021, 38, 33–39. [Google Scholar]
- Galleguillos, M.; Gimeno, F.; Puelma, C.; Zambra-no-Bigiarini, M.; Lara, A.; Rojas, M. Disentangling the effect of future land use strategies and climate change on streamflow in a Mediterranean catchment dominated by tree plantations. J. Hydrol. 2021, 595, 126047. [Google Scholar] [CrossRef]


| Climate Scenario | Land Use Scenario |
|---|---|
| Prediction of future climatic data based on BCC/RCG-WG weather generator | Natural development scenario (PLUS model) |
| Forestland growth scenario (forestland protection policy) |
| Data Type | Data Sources |
|---|---|
| Digital elevation model (DEM) Spatial resolution, 90 m | Geospatial data cloud platform (http://www.gscloud.cn/ (accessed on 15 February 2022)) |
| Soil type map, 1000 m | World Soil Database (HWSD) |
| Soil property database | Chinese soil database, SPAW software |
| 2010/2015/2020 LUCC (1000 m) | Data Center for Resources and Environmental Sciences, Chinese Academy of Sciences (http://www.dsac.cn/ (accessed on 15 February 2022)) |
| Daily meteorological data of temperature and precipitation | China Meteorological Data Sharing Center (http://data.cma.cn/ (accessed on 20 February 2022)). |
| Hydrological data | Shaanxi Meteorological Bureau |
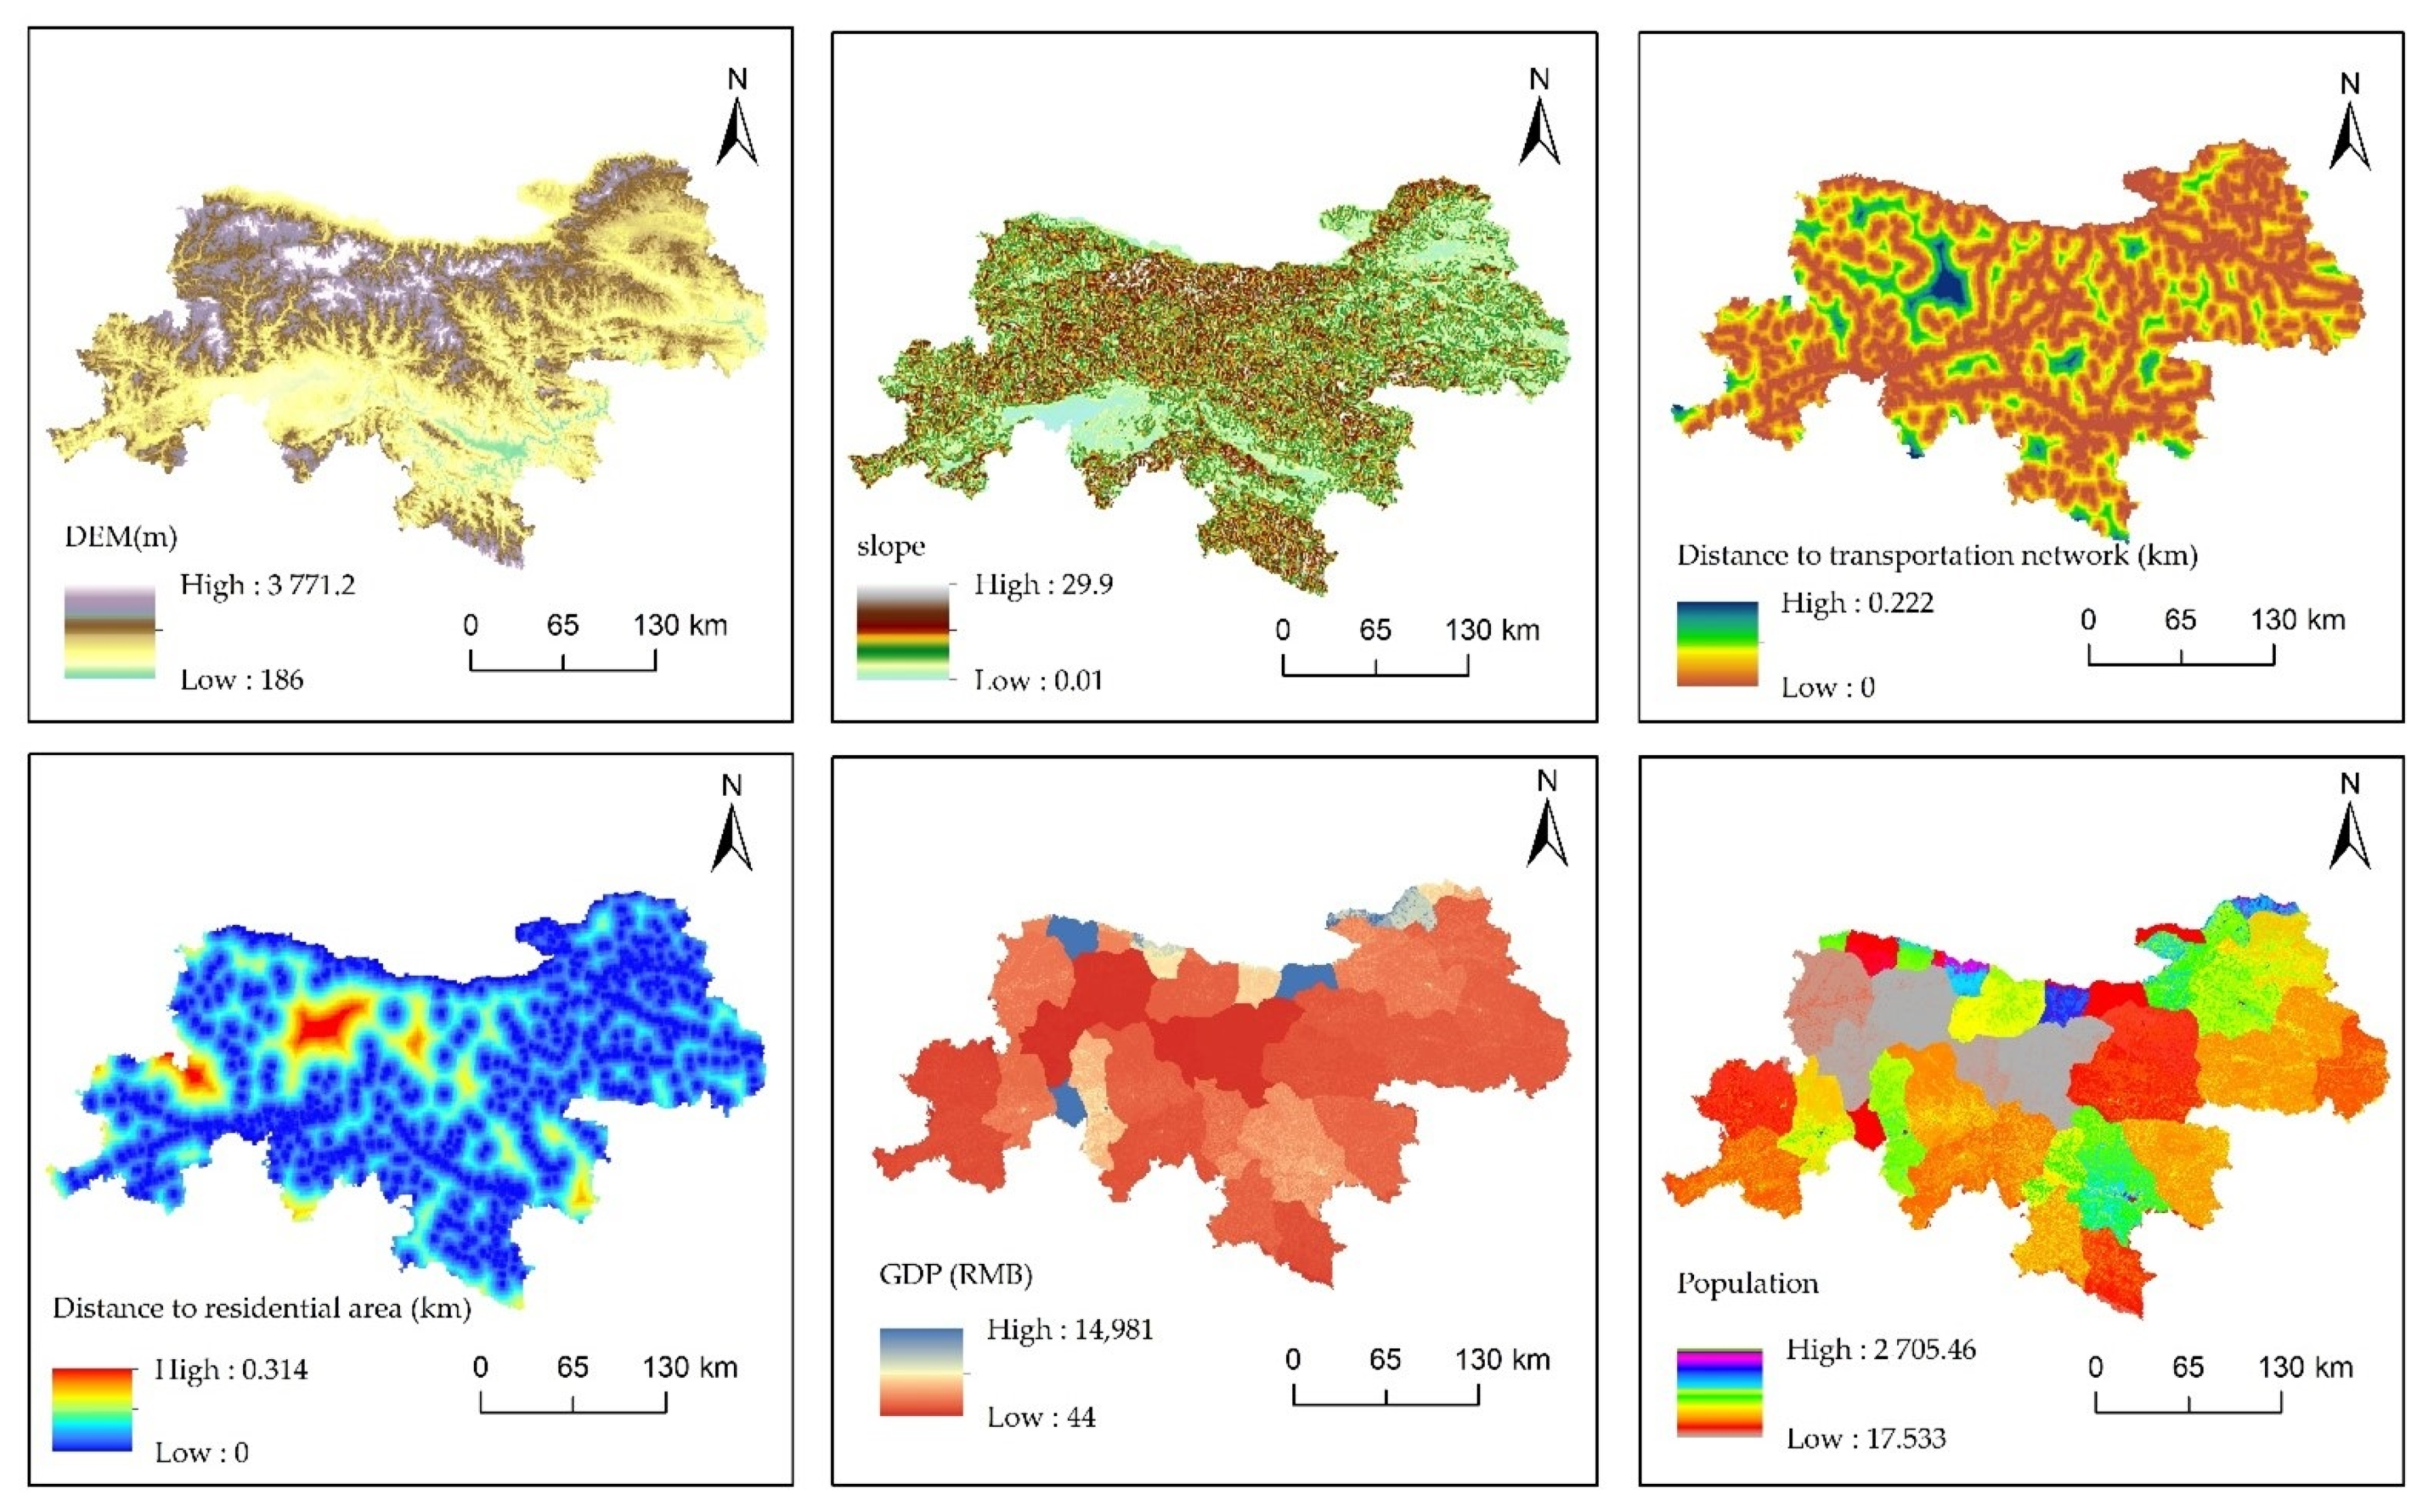
| Type | Data | Description |
|---|---|---|
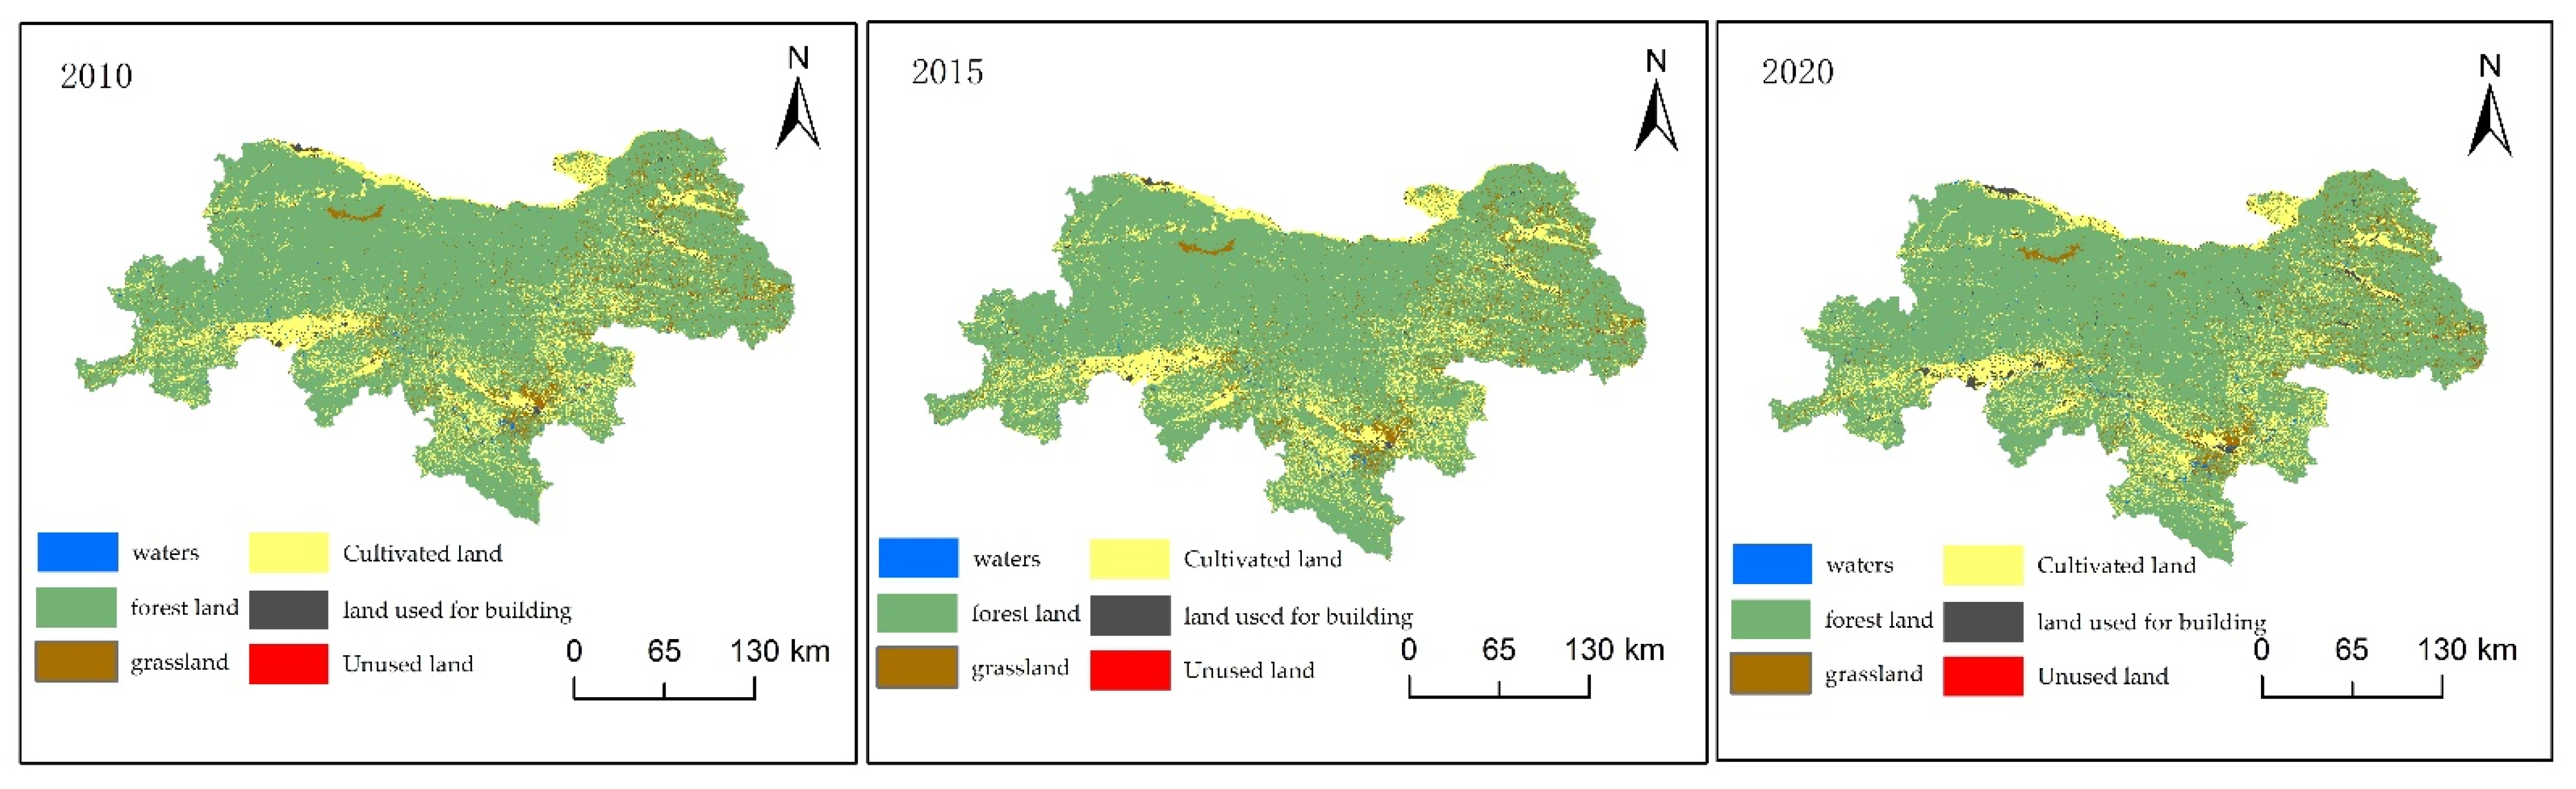
| Land-use data | Classification data of land use in Qinling Mountains in 2010 | (1) agricultural land, (2) forestland, (3) grassland, (4) water area, (5) construction land, (6) unused land. |
| Classification data of land use in Qinling Mountains in 2015 | ||
| Classification data of land use in Qinling Mountains in 2020 | ||
| Restricted conversion zone data | Constraints on land use | Water area (raster data) |
| Socioeconomic data | Population spatial data | http://www.geodoi.ac.cn/WebCn/Default.aspx/ (accessed on 21 January 2021) |
| Spatial GDP data | ||
| Distance to the transportation network | National basic geographic information database | |
| Distance from settlements | ||
| Environmental data | Elevationslope | Geospatial data cloud platform |
| Serial Number | Parameter Name | Parameter Definition | Minimal Value | Maximal Value | Rate Constant Value |
|---|---|---|---|---|---|
| 1 | r__CN2.mgt | Runoff curve | −0.2 | 0.2 | −0.08 |
| 2 | v__ALPHA_BF.gw | Base flow regression coefficient | 0.0 | 1.0 | 0.7 |
| 4 | v__GWQMN.gw | Threshold of base flow level | 0.0 | 2.0 | 1.0 |
| 5 | v__CH_N2.rte | Main channel Manning coefficient | 0.0 | 0.3 | 0.19 |
| 6 | v__CH_K2.rte | Effective water conductivity of main channel | 0 | 3500 | 2000 |
| 7 | SURLAG | Surface runoff lag coefficient the running time of soil flow | −0.8 | 0.8 | 0.5 |
| 8 | LAT_TTIME | Surface runoff lag coefficient the running time of soil flow | 0 | 100 | 5 |
| Agricultural Land | Forest Land | Grassland | Waters | Construction Land | Unused Land | |
|---|---|---|---|---|---|---|
| 2020 | 16,881 | 27,114 | 28,709 | 323 | 524 | 31 |
| 2025 | 11,928 | 57,158 | 3803 | 254 | 439 | 20 |
| 2030 | 11,405 | 57,149 | 3763 | 311 | 959 | 15 |
Publisher’s Note: MDPI stays neutral with regard to jurisdictional claims in published maps and institutional affiliations. |
© 2022 by the authors. Licensee MDPI, Basel, Switzerland. This article is an open access article distributed under the terms and conditions of the Creative Commons Attribution (CC BY) license (https://creativecommons.org/licenses/by/4.0/).
Share and Cite
Zhao, K.; Li, J.; Ma, X.; Deng, C. The Effects of Land-Use and Climatic Changes on the Hydrological Environment in the Qinling Mountains of Shaanxi Province. Forests 2022, 13, 1776. https://doi.org/10.3390/f13111776
Zhao K, Li J, Ma X, Deng C. The Effects of Land-Use and Climatic Changes on the Hydrological Environment in the Qinling Mountains of Shaanxi Province. Forests. 2022; 13(11):1776. https://doi.org/10.3390/f13111776
Chicago/Turabian StyleZhao, Kuifeng, Jing Li, Xinping Ma, and Chenhui Deng. 2022. "The Effects of Land-Use and Climatic Changes on the Hydrological Environment in the Qinling Mountains of Shaanxi Province" Forests 13, no. 11: 1776. https://doi.org/10.3390/f13111776
APA StyleZhao, K., Li, J., Ma, X., & Deng, C. (2022). The Effects of Land-Use and Climatic Changes on the Hydrological Environment in the Qinling Mountains of Shaanxi Province. Forests, 13(11), 1776. https://doi.org/10.3390/f13111776