Article

Integration of Profile Control and Thermal Recovery to Enhance Heavy Oil Recovery

1
State Key Laboratory for Efficient Development of Offshore Oil, Beijing 100028, China
2
Bohai Petroleum Research Institute, Tianjin Branch of CNOOC (China) Co., Ltd., Tianjin 300450, China
3
CNOOC Research Institute Co., Ltd., Beijing 100028, China
4
Hainan Branch of CNOOC (China) Co., Ltd., Haikou 570311, China
*
Author to whom correspondence should be addressed.
Energies 2022, 15(19), 7346; https://doi.org/10.3390/en15197346
Submission received: 1 September 2022 / Revised: 20 September 2022 / Accepted: 30 September 2022 / Published: 6 October 2022
(This article belongs to the Section H1: Petroleum Engineering)

Abstract

:
The proven reserves of heavy oil in the Bohai oilfield exceed 600 million tons. Heavy oil is highly viscous, temperature sensitive, and suitable for thermal extraction, but due to the strong inhomogeneity of the reservoir, the recovery rate of pure thermal extraction development is low, and there is an urgent need to conduct research on profile control + thermal extraction to guide the actual production. In this paper, we propose an integrated technology of profile control and thermal recovery to enhance heavy oil recovery. The heavy oil exhibited strong temperature dependence and nonlinear flow characteristics. An inorganic gel was selected for profile control to assist thermal recovery. Thermal recovery experiments were conducted in the laboratory using cores saturated by crude oil with different viscosities to simulate the oil in areas swept by thermal fluid. The 4% to 6% inorganic gel can seal up to 99% on 2000 × 10−3 μm2 cores. As the thermal recovery temperature increased from 55 to 200 °C, the efficiency of oil recovery increased from 10.8% to 42.9% in experiments with three-layer heterogeneous cores; it increased by 8.9–13.2% when profile control was implemented using the inorganic gel with a concentration of 4%. The injection parameters for thermal recovery were optimized with a thermal fluid swept area of 3/10 times the injector–producer distance, including three slugs of crude oil with different viscosities. According to the experiments involving an inverted nine-point well pattern, the integrated technology of profile control and thermal recovery enhances oil recovery by 1.4% compared to of profile control or thermal recovery alone.

1. Introduction

With the continuous improvement of exploration technology, some unconventional oil reservoirs have attracted more and more attention from the majority of petroleum workers. Among them, heavy oil reservoirs are attracting attention because of their wide distribution, large production and high utilizable value [1,2]. According to statistics, as of 2019, the world’s proven reserves of heavy oil are about 815 billion tons, accounting for 70% of the world’s remaining oil reserves [3], and China has now discovered more than seventy heavy oil fields in twelve basins with proven reserves of four billion tons [4]. Heavy oil is an important oil-replacement resource, therefore, methods to exploit heavy oil reservoirs and make them available reserves are urgently sought by the petroleum industry. Heavy oil is abundant in the Bohai Oilfield, which is an important oil production base in offshore China [5]. However, more than half of the oil is heavy oil with high viscosity and low flow mobility. Owing to the high heterogeneity and salinity of offshore heavy oil reservoirs, the effective development of heavy oil in the Bohai Oilfield is limited [6,7]. Unlike onshore oilfields, offshore oilfields are characterized by high exploration and development costs, limited space for offshore platforms, and short service lives [8]. Consequently, it is necessary to develop an effective technology to enhance heavy oil recovery. In recent years, field pilot tests of polymer flooding and polymer gel flooding have been performed in the Bohai Oilfield [9,10,11,12], and a certain amount of progress has been made. However, HPAM and gels, which are typically used for profile control, have low temperature tolerance (less than 93 °C). In addition, polymers degrade rapidly in highly saline conditions, and profile control using these agents is ineffective in enhancing the thermal recovery in the Bohai Oilfield [13,14]. Profile control based on foam materials has attracted significant research attention; however, the operating temperature of foaming agents is typically less than 120 °C, and the foam half-life decreases as the temperature increases, resulting in unsatisfactory profile control [15,16]. In comparison, inorganic gels exhibit high temperature tolerance, low cost, facile operating characteristics, and excellent deep migration performance [17,18,19,20]. As a mature and widely used technique, thermal fluid huff-and-puff technologies can facilitate the development of offshore heavy oil reservoirs [21,22,23]. At present, profile control and thermal recovery have been implemented separately, and the lack of a synergistic effect has limited the efficiency of oil recovery.
Considering these aspects, this thesis uses simulated oil saturated with different viscosities to simulate the change of crude oil viscosity during thermal recovery, thus avoiding the problem that it is difficult to simulate non-homogeneous reservoirs due to the large difference between the heavy-oil-mixed-with-quartz-sand model (or glass beads mixed with oil and water) and the actual reservoir, the high temperature of indoor thermal recovery and the poor temperature resistance of traditional epoxy resin cemented cores [24,25,26]. The research was carried out on the microstructure and plugging performance of the profile control agent, the reservoir temperature, the timing of profile control, the scope and intensity of the thermal fluid action, and the impact of the integrated implementation of “profile control + thermal recovery” on non-homogeneous reservoirs, which is of great significance for the development of heavy oil in the Bohai oilfield.

2. Experimental Section

2.1. Materials

The main and auxiliary agents for profile control were sodium silicate and calcium chloride, respectively. The model oil used in the experiment was a mixture of kerosene and degassed crude oil from Oilfield N in Bohai, and different mixtures were prepared to simulate oil with different viscosities: 590, 175, 57.0, 36.8, 19.9, and 10.8 mPa·s at 55 °C. Water was prepared to simulate the injected water from Bohai Oilfield N, with a salinity of 2152 mg/L with the following composition: 656 mg/L K+ and Na+, 6 mg/L Mg2+, 35 mg/L Ca2+, 364 mg/L C1, 13 mg/L SO42−, 1027 mg/L HCO3, and 50 mg/L CO32−. An artificial core, cemented by quartz sand and epoxy resin was used [27,28]. Three types of cores were prepared: (1) Homogeneous rectangular core (sized 4.5 cm × 4.5 cm × 30 cm) to characterize the seepage with a gas permeability of 2000 × 10−3 μm2; (2) Multilayer heterogeneous cores (sized 4.5 cm × 4.5 cm × 30 cm) for oil displacement experiment; (3) Well pattern model sized 4.5 cm × 30 cm × 30 cm. The multilayer heterogeneous core and well pattern model contained three layers with high, medium and low permeability. Threshold pressure testing was performed using a sand-filled pipe with a radius of 3.8 cm and length of 30 cm, and the gas permeability was 2000 × 10−3 μm2.

2.2. Instruments

Viscosity

The viscosity was measured using a DV-II Brookfield viscometer (Brookfield Engineering Laboratories Inc., Middleboro, MA, USA) at a rotational speed of 6 r/min. The microstructure of the profile control agent was tested using a Quanta 450 field emission environmental scanning electron microscope (SEM, FEI Company, Hillsboro, OR, USA). The setup for the profile control experiment included an advection pump, a pressure sensor, a core holder, a hand pump, and an intermediate container (Hai’an Petroleum Technology Co., Ltd., Hai’an, Jiangsu, China). Except for the advection and hand pumps, the instruments were placed in an oven at 55 °C. Procedures of the profile control experiments have been described elsewhere [29,30].

2.3. Experimental Procedures

2.3.1. Heavy Oil Threshold Pressure Tests

Threshold pressure tests were conducted for the heavy oil, involving the following steps: (1) The pipe was filled with sand and the gas permeability was measured. The sand pipe was evacuated and saturated by water and model oil and allowed to age at a reservoir temperature of 55 °C. Subsequently, the model oil was injected into the sand pipe at flow rates of 1, 3, 5, 7, and 9 mL/min until the injection pressure became constant at the given flow rate. (2) Step (1) was repeated with reservoir temperatures 65, 75, and 85 °C. The correlation between the flow rate and injection pressure at different reservoir temperatures was obtained.

2.3.2. Inorganic Gel Plugging Experiments

Inorganic gel plugging experiments were conducted using the homogeneous rectangular cores, with the following schemes: (1) The cores were evacuated and saturated by water. (2) The main agent solution, 0.1 pore volume (PV) gel, was injected with concentrations of 0.25%, 0.5%, 1%, 2%, 4%, and 6%. This injection was followed by the injection of water (0.02 PV) and auxiliary agent (0.1 PV) with the same concentration as that of the main agent, and water (0.02 PV). (3) Step (2) was repeated to perform five injection cycles. (4) After retaining this setup for 12 h, water was injected until the pressure became constant, the pressure at each measurement point was recorded, and the relationships between the pressure and injection PV at different time instants were obtained.

2.3.3. Simulation of Thermal Recovery

The thermal recovery process was conducted in the laboratory using cores saturated by crude oil with different viscosities to simulate the oil in areas swept by a thermal fluid. Several inlets and outlets were installed along the core, as shown in Figure 1. Oil in increasing order of viscosities was injected from the outlet end to saturate the core, and production was allowed to occur between the adjacent points.

2.3.4. Oil Displacement Experiments

Oil displacement experiments were conducted to investigate the performances of water flooding, profile control, thermal recovery assisted by water flooding, and thermal recovery assisted by profile control. The three-layer heterogeneous core and simulation model core models were used, and the following schemes were implemented: (1) Water flooding: Water was injected to a water cut of 98%. (2) Profile control: Water was injected to a water cut of 98%, followed by the injection of profile control agents, namely, the main agents (0.05 PV), water (0.02 PV), and auxiliary agents (0.05 PV). Subsequently, water was again injected to a water cut of 98%. (3) Thermal recovery assisted by water flooding: The core was saturated by crude oil with different viscosities to simulate thermal recovery and water was injected from the inlet to a water cut of 98%. (4) Thermal recovery assisted by profile control: The core was saturated by crude oil with different viscosities to simulate thermal recovery and water was injected from the inlet to a water cut of 40% and 98%. Subsequently, water was injected to a water cut of 98%.

3. Results and Discussions

3.1. Relationship between Heavy Oil Viscosity and Temperature

The viscosity of the heavy oil in Oilfield N was tested at different temperatures; the results are summarized in Table 1.
When the temperature increased from 50 to 200 °C, the heavy oil viscosity decreased by 98.8% from 925 to 10.8 mPa·s, which indicated that the viscosity of heavy oil in Oilfield N depended significantly on the temperature, and the oil recovery could be enhanced by thermal recovery.

3.2. Heavy Oil Threshold Pressure

The flow threshold pressure of the heavy oil in Oilfield N was tested at different temperatures; the results are shown in Figure 2.
The relationship between the heavy oil flow rate and injection pressure was nonlinear at low injection pressure. The flow threshold pressure at 55 °C was 0.02 MPa/m and decreased as the temperature increased from 55 to 85 °C. In other words, the temperature considerably influenced the heavy oil seepage flow. At low-pressure gradients, heavy oil flowed at an extremely low velocity, and the flow velocity was nonlinearly related to the pressure gradient. Moreover, the heavy oil flow exhibited non-Darcy characteristics. Under high-pressure gradients, the network structure formed by the asphaltene association of heavy oil is disrupted and the flow takes on a Darcy character. When the temperature is high or the pressure gradient is high, the asphaltene association of heavy oil forms a network structure that is disrupted and exhibits the characteristics of a Newtonian fluid, satisfying the Darcy permeability characteristic, with a displacement proportional to the pressure. In general, heavy oil contains a large amount of resin, asphaltene, and wax, which can form a three-dimensional stable network structure with a high stiffness that protects it from damage at low temperature. These components typically exhibit high threshold pressures with strong interaction forces on the pore surface. As the temperature increases, the network structure of these components is gradually destroyed, and the stiffness and interaction force on the pore surface decrease, resulting in lower flow threshold pressure [31,32,33,34].

3.3. Properties of Profile Control Agents

3.3.1. Microstructure of Profile Control Agents

The microstructure of the inorganic gel was tested by obtaining SEM images after the mixture of the main agents (0.5% Na2O-SiO2) and auxiliary agents (0.5% CaCl2) was allowed to age 0 and 5 d at 55 and 140 °C. The SEM images are shown in Figure 3.
At a temperature of 55 °C, the inorganic gel appeared as an irregular flocculent aggregate. When the temperature increased to 140 °C, the structure of the inorganic gel was similar to a porous sheet-like network with clear stratification and volume shrinkage. Moreover, the density of the inorganic gel increased, consistent with previously reported findings [34,35,36]. In addition, the volume of the inorganic gels slightly decreased and the density increased over time, indicating that the inorganic gels were resistant to temperature.
SEM images were also obtained for polymer gels with a polymer concentration of 2000 mg/L and a mass ratio of polymer and Cr3+ of 180:1. The SEM images obtained after 0 and 5 d at 55 and 140 °C are shown in Figure 4.
In the initial stage, the polymer gel exhibited a sparse network structure with no obvious cross-linking reaction at 55 °C. In contrast, a network structure with slight agglomeration was observed at 140 °C, indicating cross-linking [37,38]. After 5 d, the polymer gel aggregates exhibited a sheet-net structure at 55 °C, indicating strong cross-linking [37,38]. The reaction intensified at 140 °C, but the structure underwent notable cracking, indicating the low temperature tolerance of the material and high degradation rate.

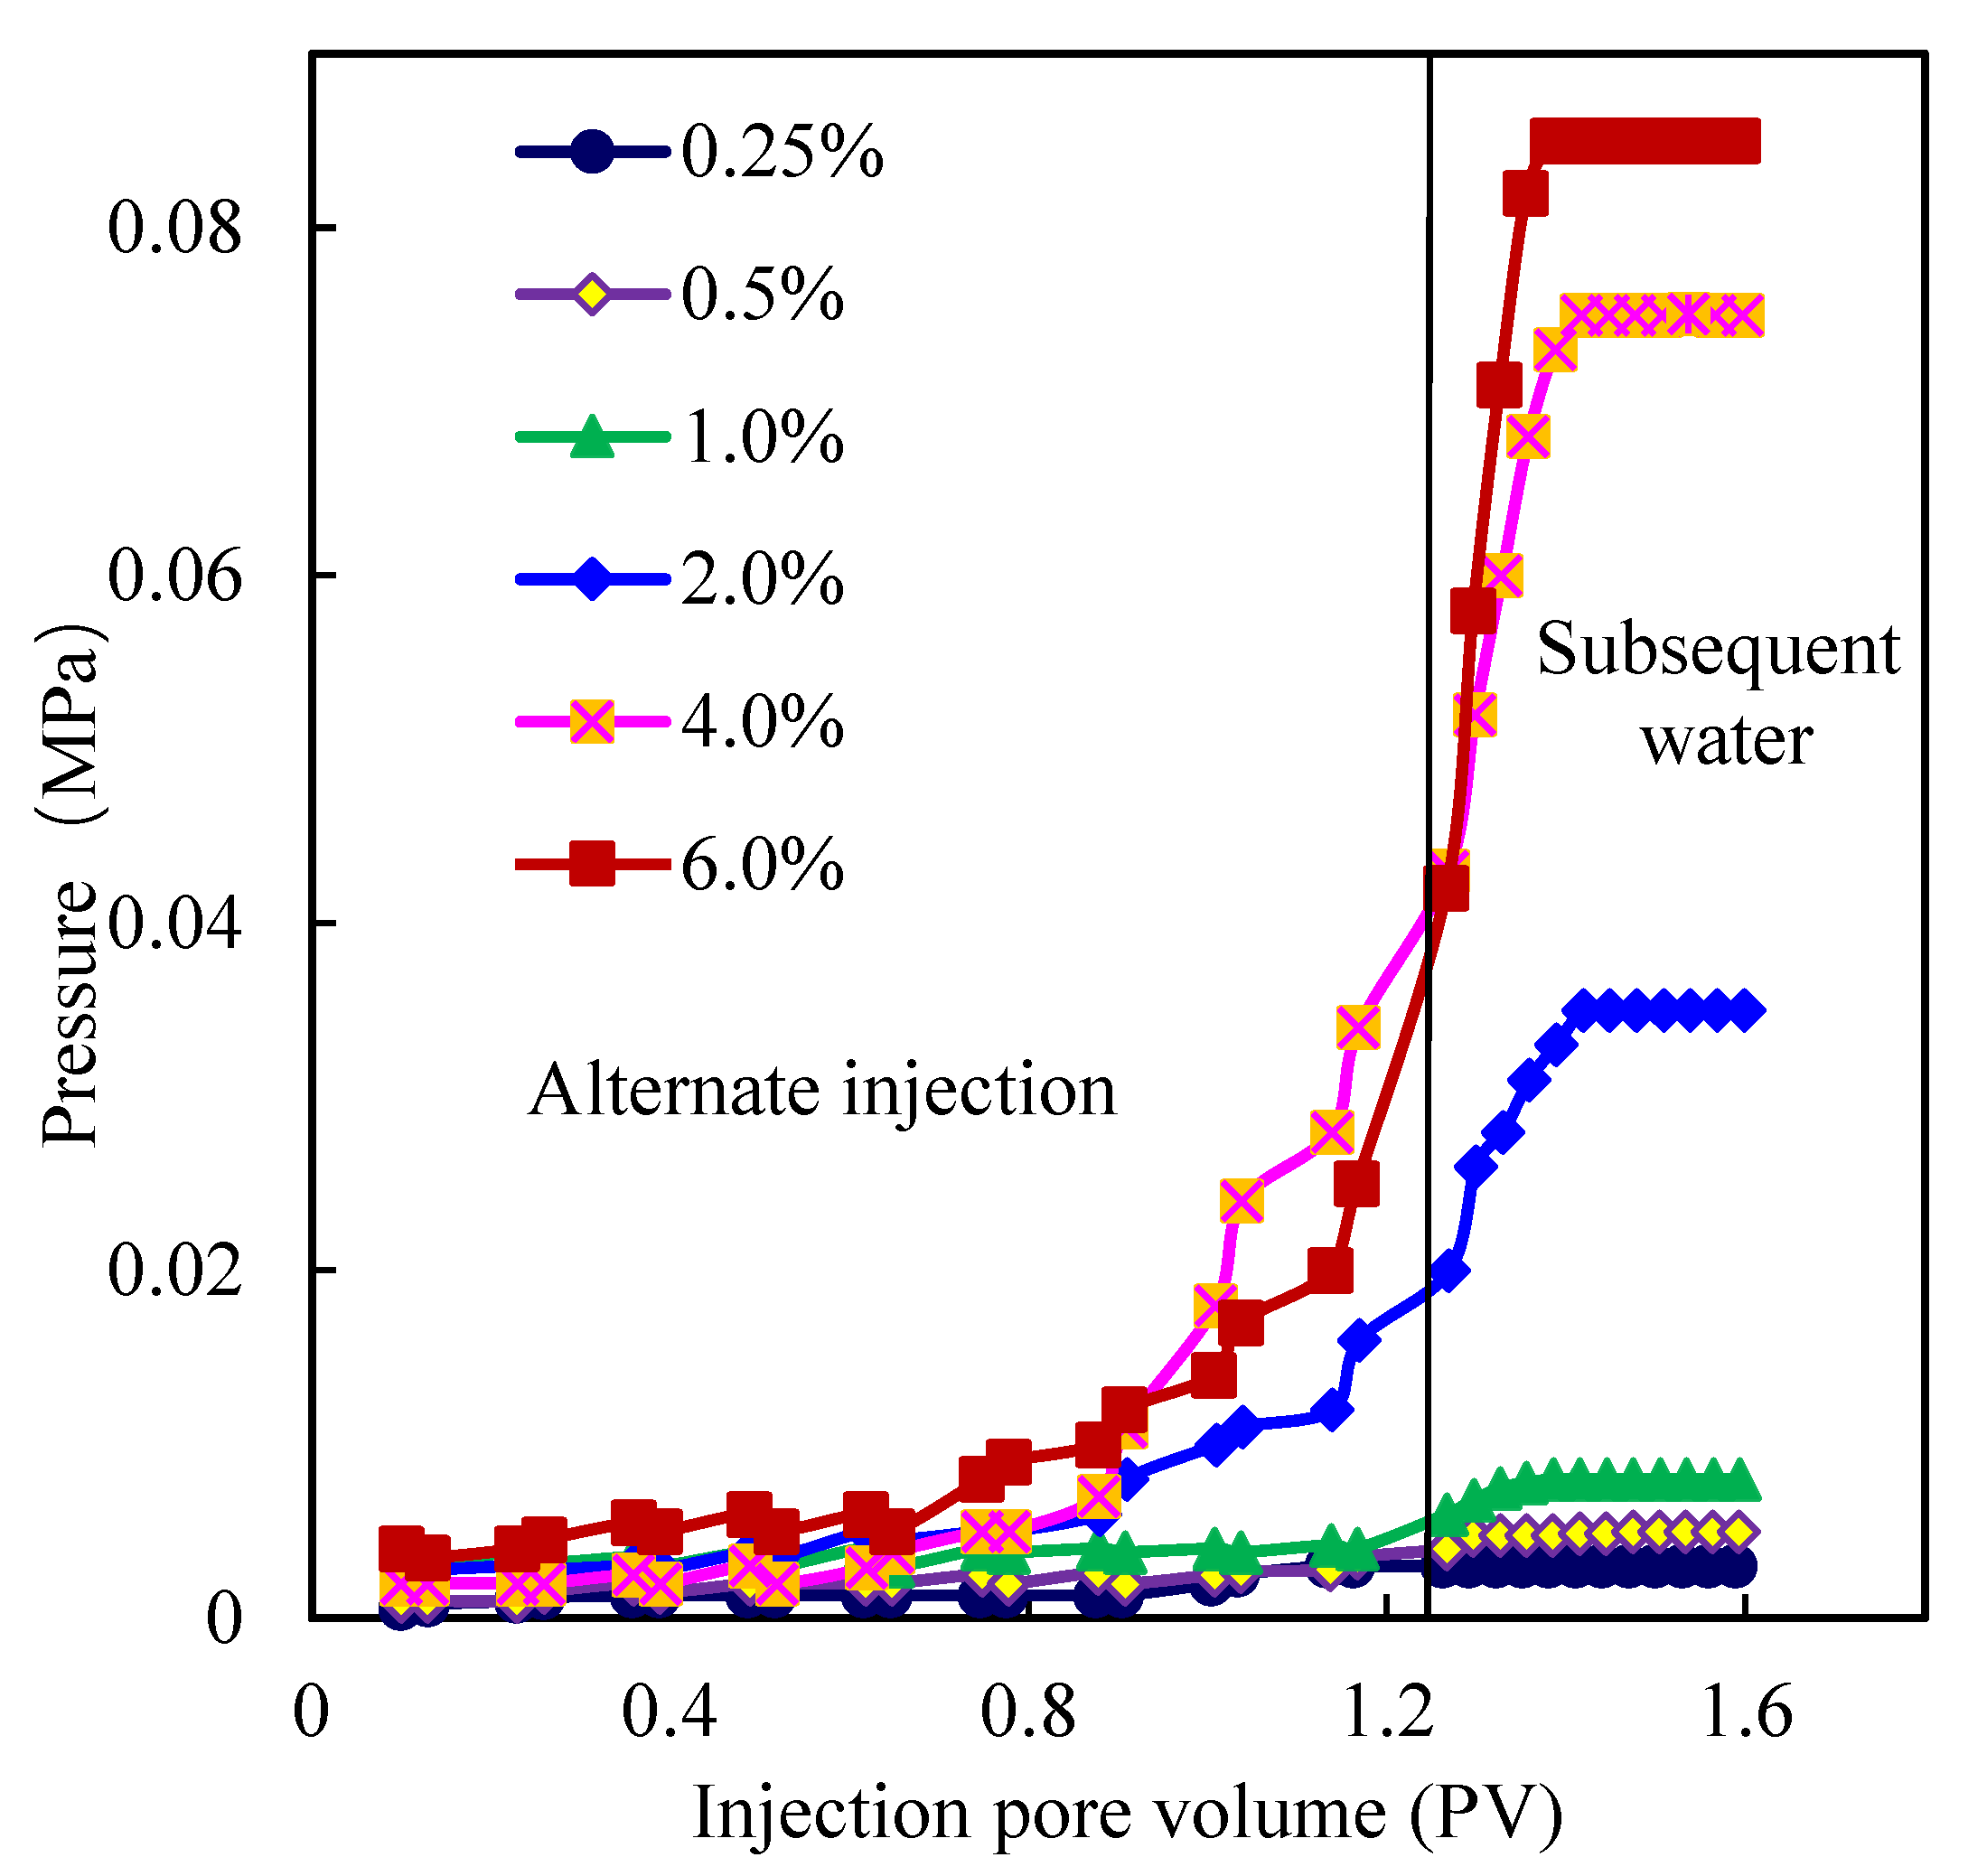
3.3.2. Plugging Performance of Profile Control Agents

The resistance factor, residual resistance factor, and plugging rate at different inorganic gel concentrations were determined, as summarized in Table 2.
The resistance factor, residual resistance factor, and plugging rate of the inorganic gel increased with the agent concentration. A higher concentration corresponded to better plugging performance. The aggregate size of the inorganic gel increased with the concentration, which enhanced the plugging performance with higher flow resistance owing to the presence of higher amount of gel and higher deposition in porous media.
The relationship between the injection pressure, main agent concentration, and injection PV during the alternative injection and subsequent water flooding processes is shown in Figure 5.
The injection pressure gradually increased with the agent concentration. When the concentration increased to more than 4%, the injection pressure increased slightly, indicating that a concentration of 4–6% was reasonable. The injection pressure increased with the injection PV and then stabilized, which indicated that the inorganic gel had a superior anti-scour ability.

3.4. Thermal Recovery Effects

3.4.1. Effects of Crude Oil Viscosity

The thermal recovery of the inhomogeneous cores with three layers (3000/2000/1000 × 10−3 μm2) was performed by saturating them using model oil with different viscosities. Water was injected to a water cut of 98%, followed by the profile control agents (main agents with 0.05 PV, water with 0.02 PV, and auxiliary agents with 0.05 PV). This was followed by water injection to a water cut of 98%. The experimental results are summarized in Table 3.
As the viscosity of the oil decreased, the oil recovery was enhanced owing to the lower mobility ratio of the displacing and displaced phases and the weakened fingering. When profile control was implemented at a water cut of 98%, the oil recovery associated with water flooding increased from 10.8% to 42.9% as the oil viscosity decreased from 590 from 10.1 mPa·s. The oil recovery after profile control increased from 8.9% to 13.2% compared to that after water flooding. When the profile control was implemented at a water cut of 40%, the oil recovery associated with water flooding increased from 3.5% to 23.4% as the oil viscosity decreased from 590 to 10.1 mPa·s, and the oil recovery after profile control increased from 12.5% to 18.3% compared with that of water flooding. The higher oil recovery at lower oil viscosity can be attributed to the higher sweep efficiency with low water–oil mobility ratio.
The relationships between the injection pressure, water cut, oil recovery, and injection PV are shown in Figure 6 and Figure 7.
As can be seen from Figure 6 and Figure 7, the water-oil flow ratio decreases significantly with the decrease of crude oil viscosity, the injection pressure decreases and the recovery from water drive and profiling increases during the water drive and profiling phases. It can be seen from the injection pressure that the inorganic gel has good flushing resistance.

3.4.2. Effects of Swept Areas on Thermal Recovery

(1)
Influence of swept areas
The influence of the swept areas on the thermal recovery was investigated by saturating the cores using oil with a low viscosity (57.0 mPa·s) to simulate the oil viscosity at 100 °C in the swept areas. The oil viscosity in the unswept areas was 590 mPa·s. The swept areas were set as 1/10, 2/10, 3/10, 4/10, and 5/10 of the injector–producer distance from the producer outlet. The oil recovery results are summarized in Table 4 and the experimental dynamic characteristics are shown in Figure 8.
Table 4 indicates that the swept areas increased as the injector–producer distance varied from 1/10 to 5/10; the incremental oil recovery increased from 1.2% to 7.5%; and the incremental oil recovery for every 1/10 of the injector–producer distance was 1.2%, 1.4%, 1.5%, 1.7%, and 1.7%. Thus, the oil recovery did not increase significantly when the swept area was more than 3/10 of the injector–producer distance.
Figure 8 shows that as the swept area of the thermal fluid increased, the flow resistance and injection pressure decreased and the water cut increased more gradually, resulting in higher oil recovery associated with water flooding.
(2)
Effects of oil viscosity gradient on the thermal recovery
In the thermal recovery process, the viscosity of the heavy oil near the end of the thermal fluid injection decreased as the temperature increased. Experiments for water flooding and thermal recovery were conducted by saturating the oil with different viscosities to simulate the distribution of the oil viscosity near the end of the thermal fluid injection within 3/10 of the injector–producer distance. The experimental results are summarized in Table 5 and the oil viscosity distributions in the cores are shown in Figure 9.
According to Table 5, when the oil viscosity was distributed to 1–4 slugs in the area swept by the thermal fluid, the oil recovery increased by 3.5%, 5.1%, 5.6%, and 5.8%, respectively. The oil recovery did not increase significantly after the 3-slug distribution; thus, this configuration was used for the subsequent experimental investigations.

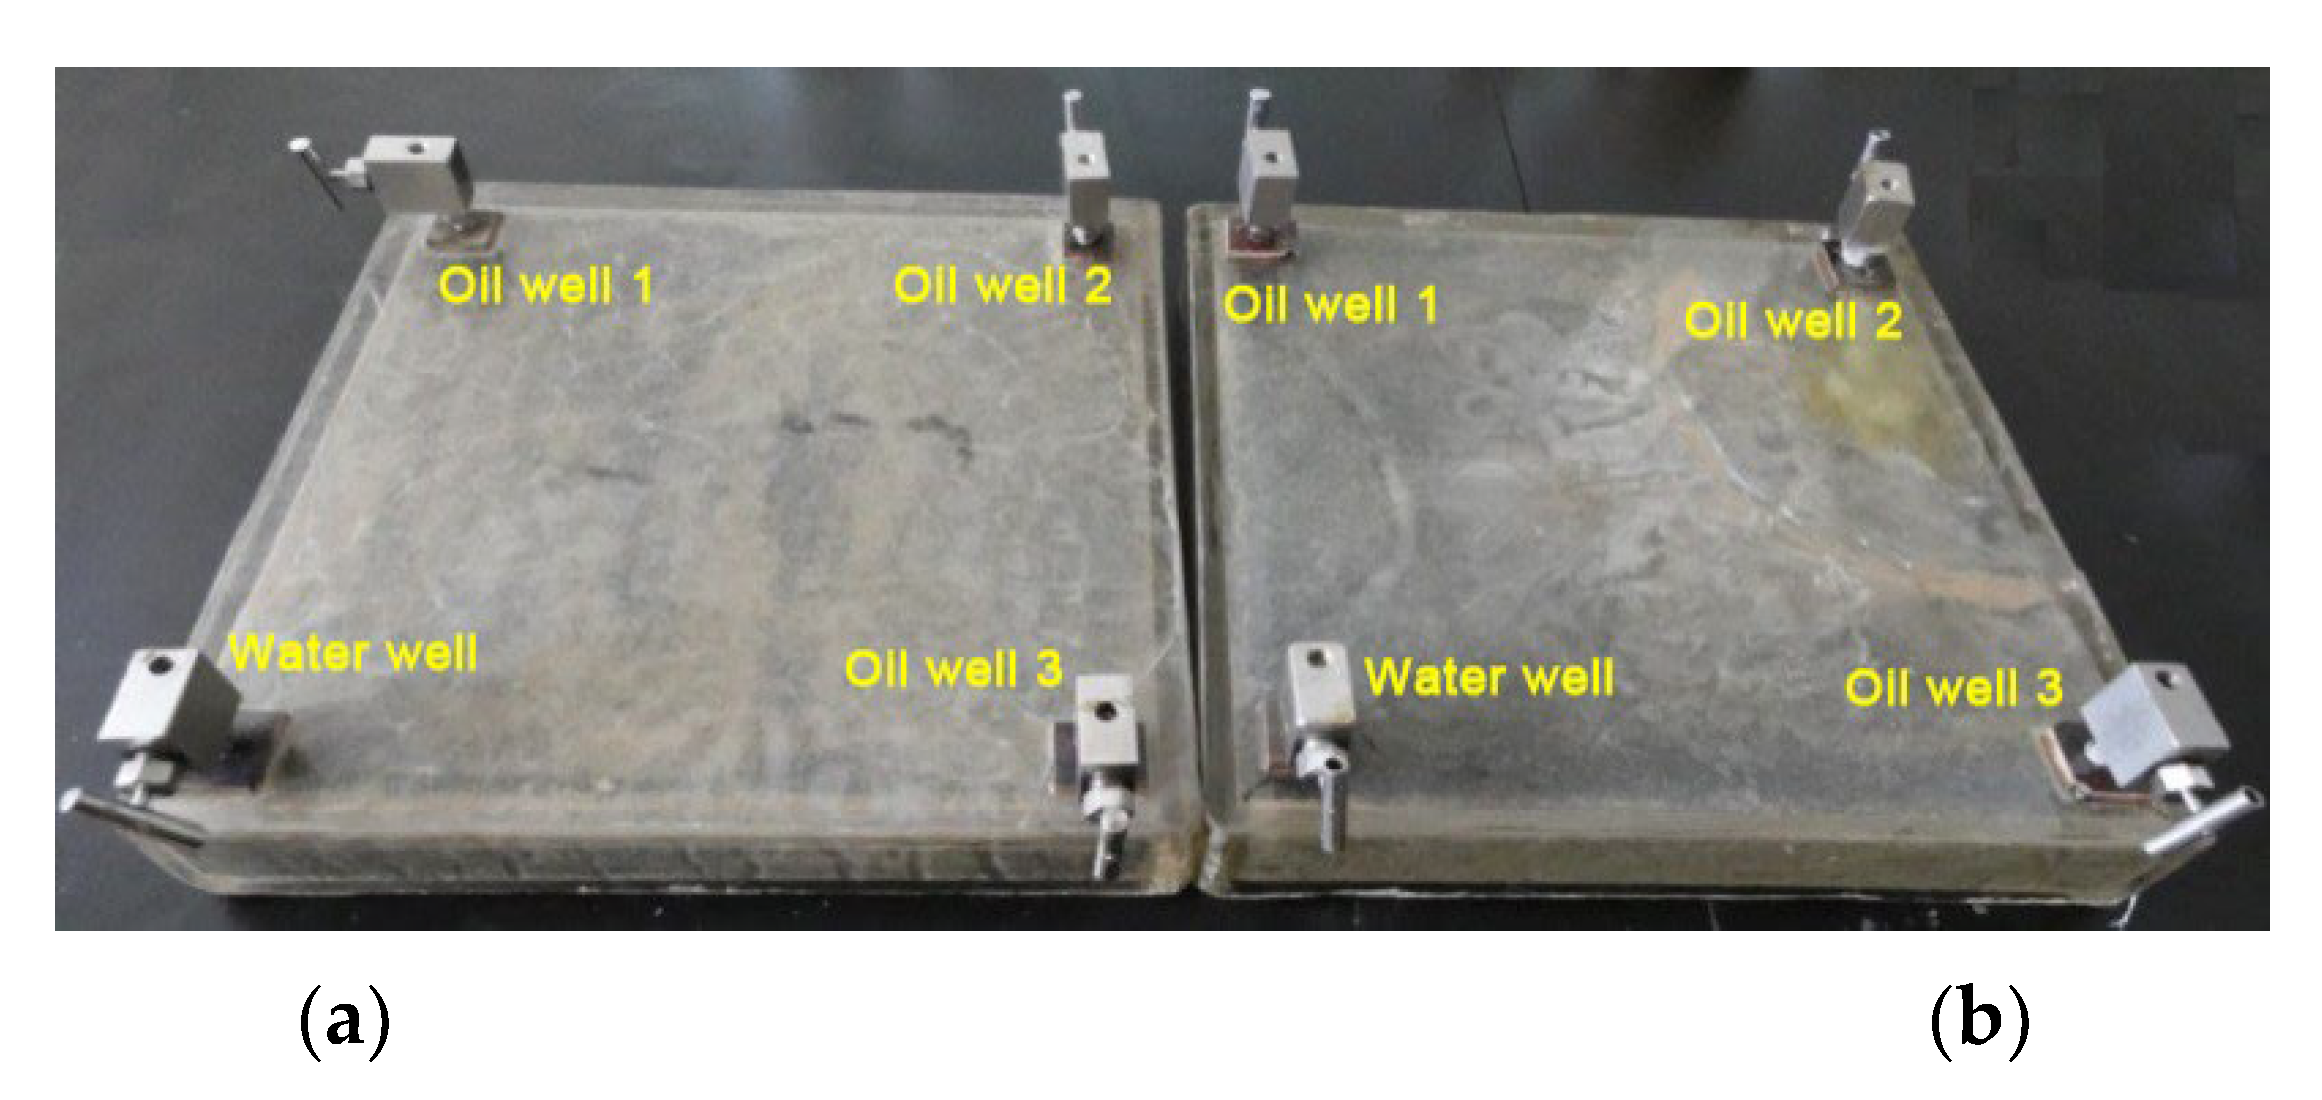
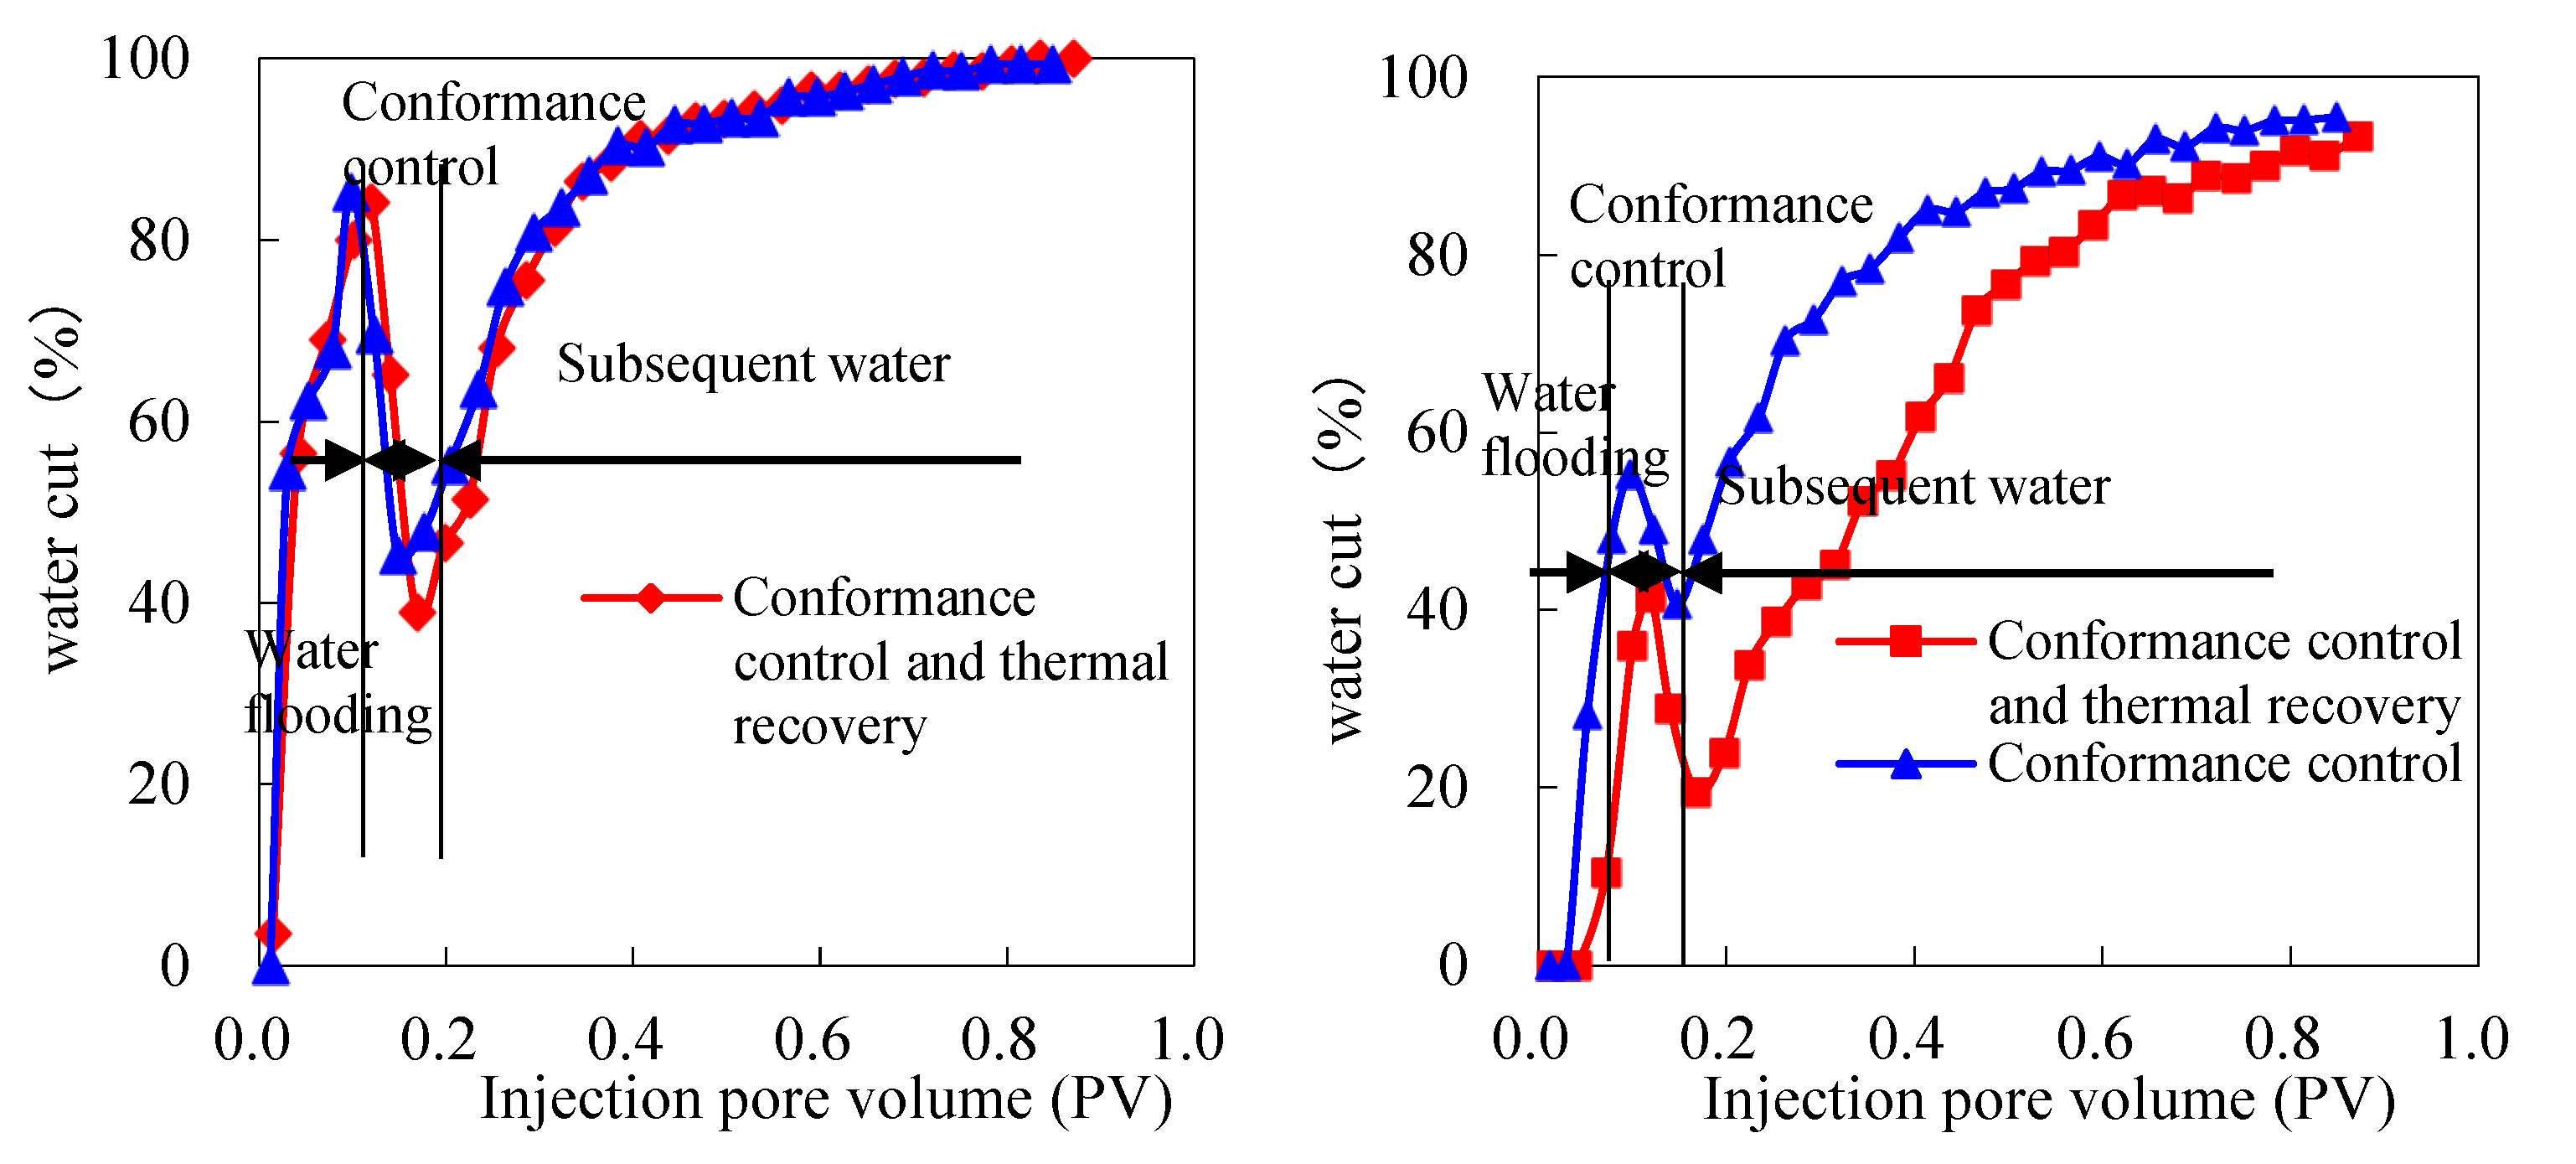
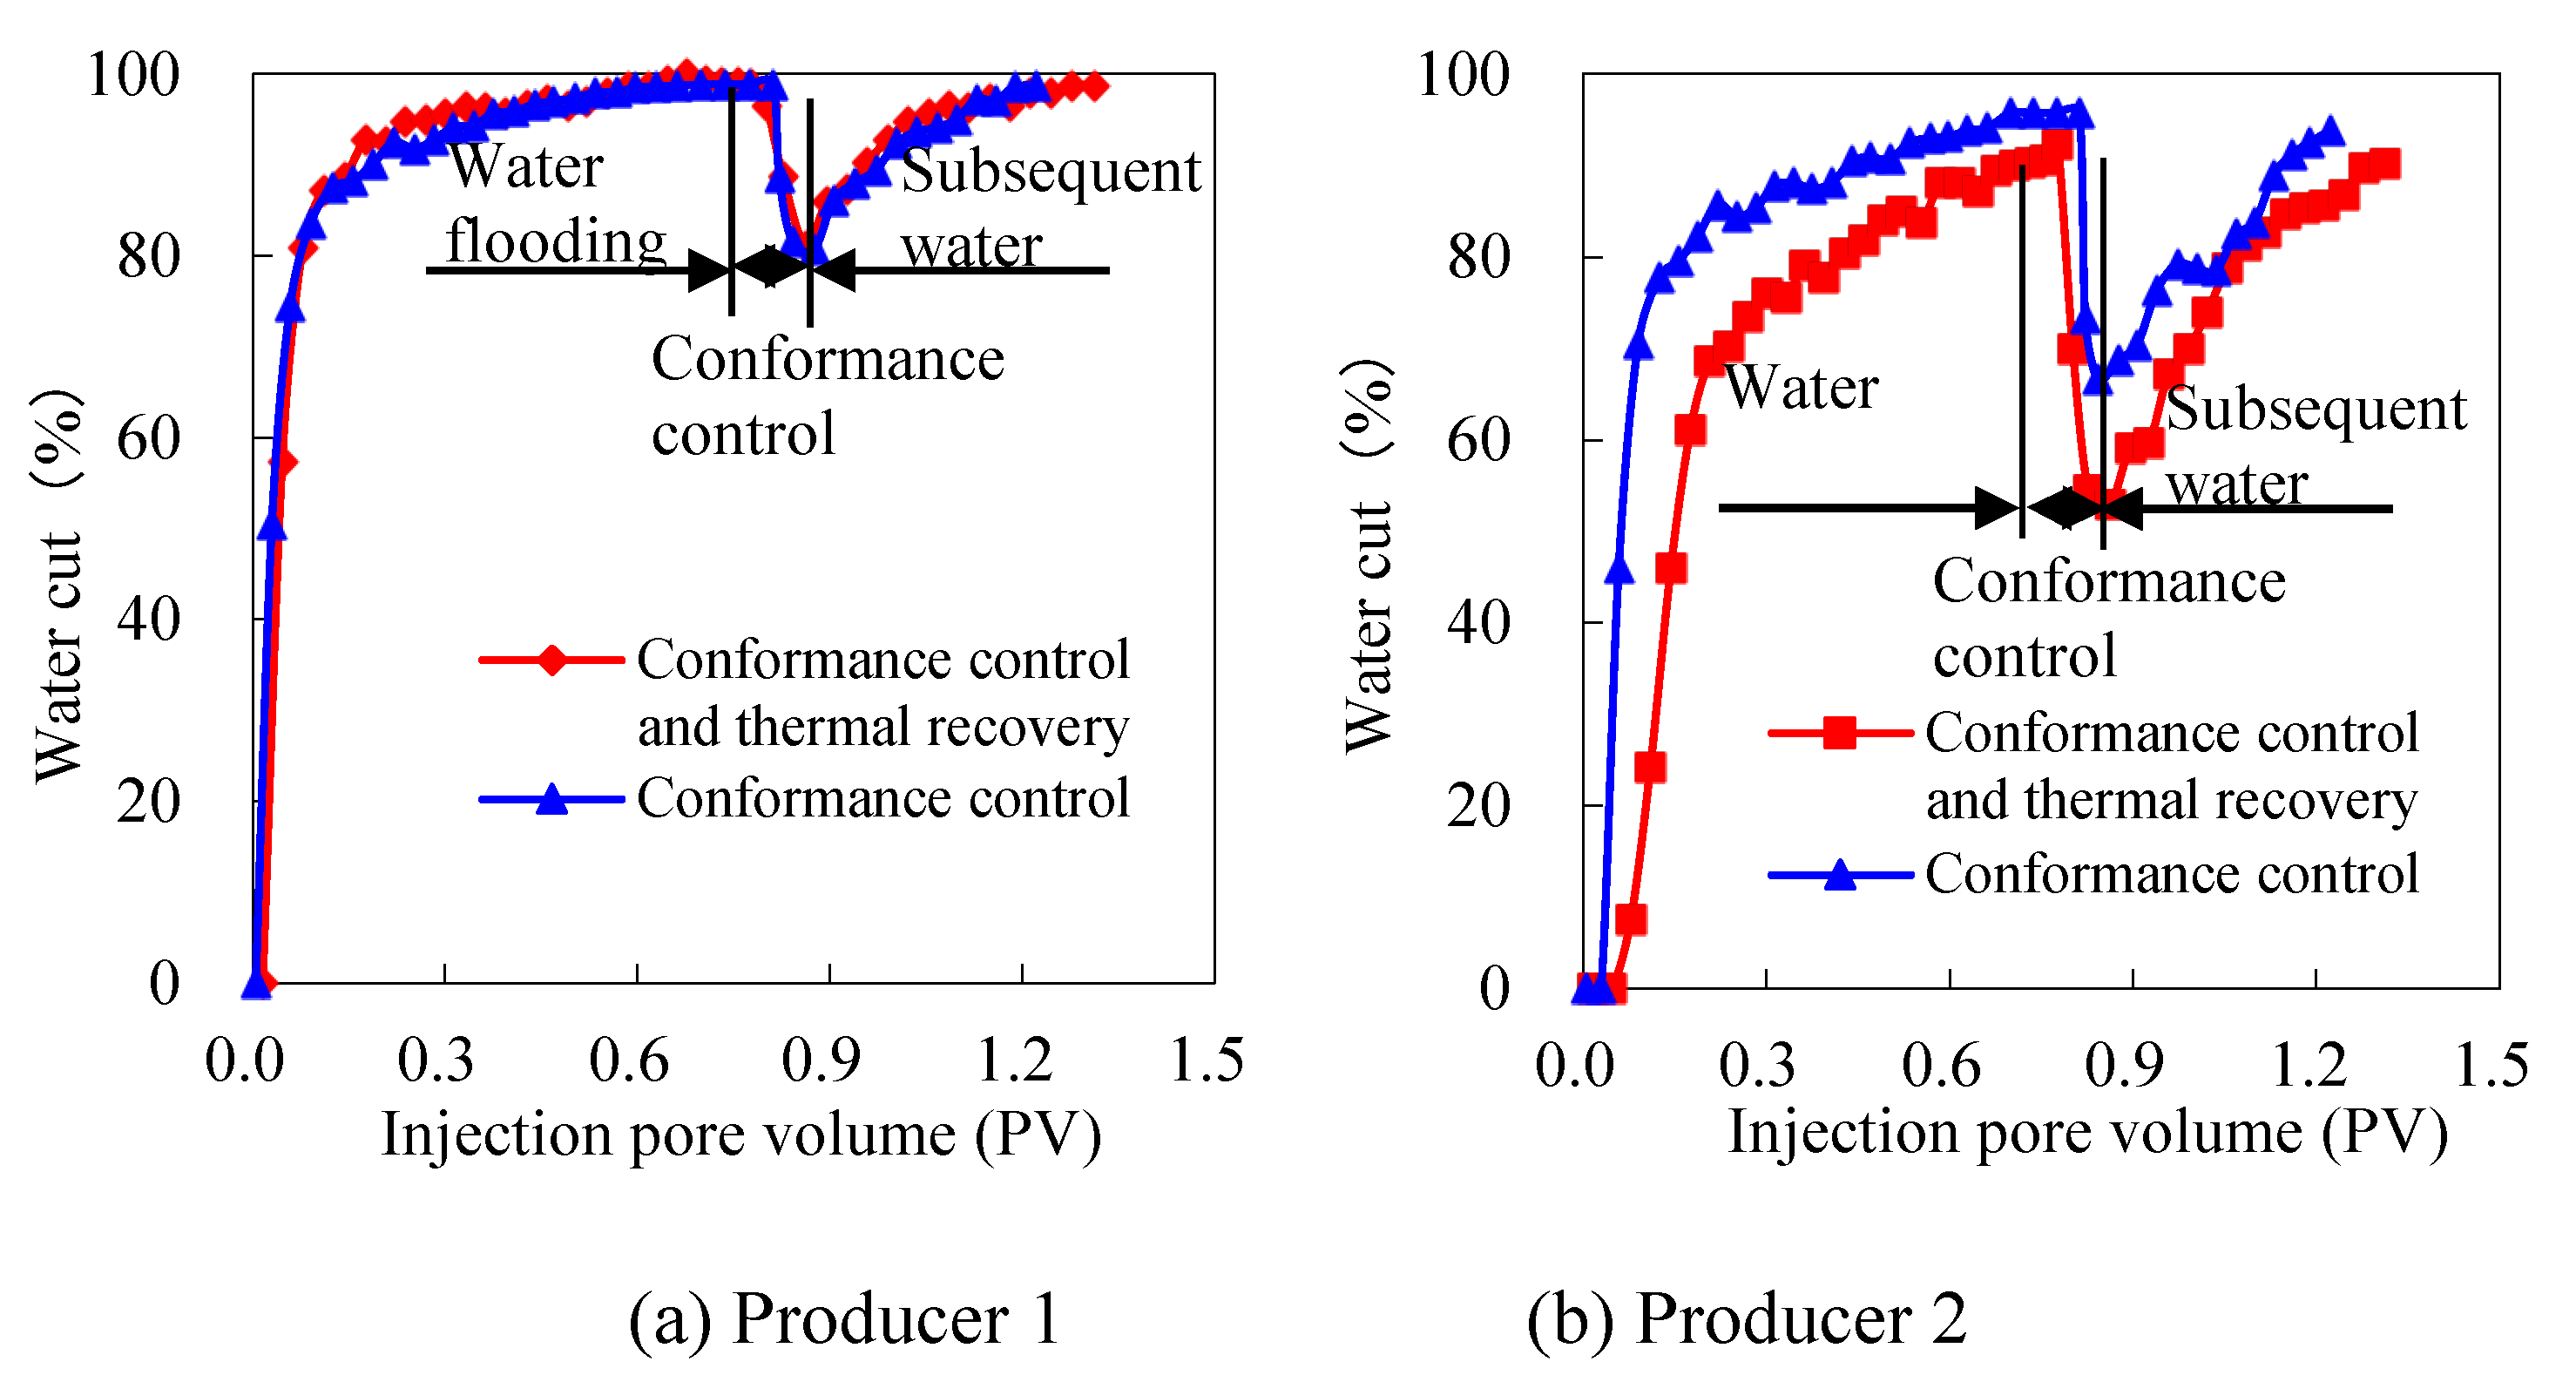
3.5. Oil Recovery through Proposed Integrated Technology in Inverted Nine-Point Well Pattern

Experiments involving water flooding, profile control, and thermal recovery were conducted using an inverted nine-point well pattern model. Figure 10 shows the schematic diagram of the models with and without thermal recovery. The oil viscosities near Producer 2 within 3/10 of the injector–producer distance were 19.9, 57.0, and 175 mPa·s. The oil recovery results are presented in Table 6.
The relationships between the injection pressure, water cut, oil recovery, and injection PV are shown in Figure 11, Figure 12, Figure 13 and Figure 14.
The relationships between the fractional flow rates of Producers 1 and 2 and injection PV are shown in Figure 15.
As can be seen in Table 6, compared with water flooding, the development effects of water flooding and thermal recovery as well as water flooding and profile control were superior, with incremental oil recoveries of 2.7% and 5.3%, respectively. Among the three development methods, the integrated implementation of profile control and thermal recovery resulted in a synergistic effect with a higher incremental oil recovery (9.4%) than the total oil recovery (8.0%) of both profile control (5.3%) and thermal recovery (2.7%). In addition, the implementation timing of profile control affected the oil recovery: The oil-increasing effect at the water cut of 40% was superior to that at a water cut of 98%. Figure 11 and Figure 12 show that the oil recoveries of profile control and thermal recovery were higher than that of profile control. In the water flooding stage, the productivity and water-cut rising speed of Producer 2 were lower than those of Producer 1. After profile control and thermal recovery, the fractional flow rate of Producer 2 increased, as shown in Figure 13, Figure 14 and Figure 15. The synergistic effect was attributable to the higher vertical and horizontal sweep efficiencies after profile control at lower oil viscosities with thermal recovery. The injected water primarily entered the high-permeability layer along with adjacent wells and Producers 1 and 3 (Figure 16a), resulting in a rapid increase of the water cut. After profile control was implemented, the inorganic gels plugged the preferential flow paths to the high-permeability layer and directions to Producers 1 and 3, as shown in Figure 16c. At low oil viscosities with thermal recovery, after profile control more injected water flowed into the lower-permeability layer near Producer 2, as shown in Figure 16b. Additionally, more injected water flowed toward Producer 2 than toward Producers 1 and 3. The increased swept volume in the area with lower oil viscosity ensured that the oil recovery was higher than the total oil recovery of profile control and thermal recovery [39].

4. Conclusions

  • The viscosity of heavy oil from Bohai Oilfield N was strongly temperature-dependent, and the heavy oil could be subjected to thermal recovery. Additionally, the flow threshold pressure of the oil decreased with the increase of the temperature.
  • Inorganic gels exhibited high temperature tolerance and plugging performance owing to their denser structures at high temperatures (55–140 °C). In contrast, polymer gels exhibited poor temperature tolerance at high temperatures. The molecular chains of polymer gels cracked after a treatment of 5 d at 140 °C. The plugging rate of inorganic gels with a concentration of 4–6% was 99% for the core with a permeability of 2000 × 10−3 μm2.
  • The thermal recovery process was implemented in the laboratory by suturing the core with crude oil with different viscosities to simulate the oil in areas swept by the thermal fluid. The oil recovery associated with the thermal recovery in the heterogeneous core increased from 10.8% at 55 °C to 42.9% at 200 °C. Moreover, the oil recovery associated with thermal recovery assisted by profile control increased from 8.9% to 13.2%. The areas swept by the thermal fluid were optimized at 3/10 of the injector–producer distance with three slugs of oils with different viscosities.
  • The integration of profile control and thermal recovery resulted in a synergistic effect that enhanced the oil recovery (9.4%) compared to the total oil recovery (8.0%) of profile control and thermal recovery in an inverted nine-point well pattern model. The synergistic effect can be attributed to the higher vertical and horizontal sweep efficiencies after profile control at lower oil viscosities with thermal recovery. The increased swept volume in the area with lower oil viscosity ensured that the oil recovery was higher than the total oil recovery of profile control and thermal recovery.
  • Although the inorganic gel dissector has good temperature resistance, there is still room to improve the profile control effect. Developing more efficient temperature resistant dissectors and combining profile control and autogenous heat is the next research development direction.

Author Contributions

Conceptualisation, Q.W. and W.Z.; methodology, J.L. and X.L.; formal analysis, W.Z. and J.L.; investigation, Q.W. and J.L.; resources, X.L.; data curation, J.H., K.Z., L.C., T.C. and H.S.; writing—original draft preparation, J.L. and J.H.; writing—review and editing, W.Z. and B.C.; supervision, X.L.; project administration, Q.W. and W.Z. All authors have read and agreed to the published version of the manuscript.

Funding

This work was supported by the fifth batch of open funds of the State Key Laboratory for efficient development of offshore oil “Study on Microstructure and rheological properties of crude oil from typical heavy oil reservoirs in Bohai Sea” (CCL2021RCPS0517KQN).

Institutional Review Board Statement

Not applicable.

Informed Consent Statement

Not applicable.

Data Availability Statement

Data are contained within the article.

Conflicts of Interest

The authors declare no conflict of interest.

References

  1. Xie, Z.; Feng, Q.; Zhang, J.; Shao, X.; Zhang, X.; Wang, Z. Prediction of Conformance Control Performance for Cyclic-Steam-Stimulated Horizontal Well Using the XG Boost: A Case Study in the Chunfeng Heavy Oil Reservoir. Energies 2021, 14, 8161. [Google Scholar] [CrossRef]
  2. Zhou, Z.; Slaný, M.; Kuzielová, E.; Zhang, W.; Ma, L.; Dong, S.; Zhang, J.; Chen, G. Influence of reservoir minerals and ethanol on catalytic aquathermolysis of heavy oil. Fuel 2022, 307, 121871. [Google Scholar] [CrossRef]
  3. Mukhamatdinov, I.I.; Salih Indad, S.S.; Khelkhal, M.A.; Vakhin, A.V. Application of Aromatic and Industrial Solvents for Enhancing Heavy Oil Recovery from the Ashalcha Field. Energy Fuels 2021, 35, 374–385. [Google Scholar] [CrossRef]
  4. Liu, H.; Dong, X. Current status and future trends of hybrid thermal EOR processes in heavy oil reservoirs. Pet. Sci. Bull. 2022, 7, 174–184. [Google Scholar]
  5. Zhou, S.; Li, Q.; Zhu, H.; Zhang, H.; Fu, Q.; Zhang, L. The Current State and Future of Offshore Energy Exploration and Development Technology. Strateg. Study CAE 2016, 18, 19–31. [Google Scholar]
  6. Jia, C. Challenges facing upstream development of China’s petroleum industry and future scientific and technological breakthroughs. Acta Pet. Sin. 2020, 41, 1445–1464. [Google Scholar]
  7. Tian, H.; Deng, J.; Meng, Y.; Zeng, X.; Sun, F. Laboratory simulation on sand production of heavy oil reservoir in Bohai area. Acta Pet. Sin. 2005, 26, 85–87. [Google Scholar]
  8. Shan, J.; Liu, Y.; Lu, X. Application of polymer flooding in Luda 10-1 oilfield in Bohai Sea. Offshore Oil 2009, 29, 47–53. [Google Scholar]
  9. Kang, X.; Zhang, J. Surfactant Polymer (SP) flooding Pilot Test on Offshore Heavy Oil Field in Bohai Bay, China; SPE 165224. 2013. Available online: https://chem.ckcest.cn/Proceeding/Details/323397 (accessed on 2 July 2013).
  10. Han, M.; Xiang, W.; Zhang, J.; Jiang, W.; Sun, F. Application of EOR Technology by Means of Polymer Flooding in Bohai Oilfields; SPE 104432. 2006. Available online: https://xueshu.baidu.com/usercenter/paper/show?paperid=150q0jr0x97d0jn0a71x04d0kg234591 (accessed on 1 December 2006).
  11. Song, S.; Wang, Y.; Zhou, J.; Meng, X. Early development of common heavy oil reservoir by water flooding controlled by movable gel. Pet. Explor. Dev. 2007, 34, 585–589. [Google Scholar]
  12. Guo, Y.; Zhang, J.; Liu, Y.; Liu, G.; Xue, X.; Luo, P.; Ye, Z.; Zhang, X.; Liang, Y. Successful Scale Application of Associative Polymer Flooding for Offshore Heavy Oilfield in Bohai Bay of China. In SPE/IATMI Asia Pacific Oil & Gas Conference and Exhibition, Bali, Indonesia, 29–31 October 2019; SPE 196467; OnePetro: Richardson, TX, USA, 2020; Available online: https://onepetro.org/SPEAPOG/proceedings/19APOG/1-19APOG/D012S003R010/217345 (accessed on 31 August 2022).
  13. Zhu, D.; Hou, J.; Chen, Y.; Wei, Q.; Zhao, S.; Bai, B. Evaluation of Terpolymer-Gel Systems Crosslinked by Polyethylenimine for Conformance Improvement in High-Temperature Reservoirs. SPE J. 2019, 24, 1726–1740. [Google Scholar]
  14. Liu, Y.; Dai, C.; Wang, K.; Zou, C.; Gao, M.; Fang, Y.; Zhao, M.; Wu, Y.; You, Q. Study on A Novel Cross-Linked Polymer Gel Strengthened with Silica Nanoparticles. Energy Fuel 2017, 31, 9152–9161. [Google Scholar] [CrossRef]
  15. Wang, F.; Li, Z.; Li, S.; Chen, H. Profile control mechanism experiment of autogenic thermal foam system. J. China Univ. Pet. Nat. Sci. 2017, 41, 116–123. [Google Scholar]
  16. Yang, H.; Pan, H.; Zhang, Y.; Zhong, X. Inhibition effect of oxygen reduction on downhole pipe string by air foam flooding and its limit of oxygen reduction. Acta Pet. Sin. 2019, 40, 99–107. [Google Scholar]
  17. Tang, X.; Yang, L.; Liu, Y.; Li, Z.; Chang, Z.; Li, Y.; Wei, F. New inorganic gel coating deep fluid transfer agent. Pet. Explor. Dev. 2012, 39, 76–81. [Google Scholar] [CrossRef]
  18. Pham, L.T.; Hatzignatiou, D.G. Rheological Evaluation of A Sodium Silicate Gel System for Water Management in Mature, Naturally-Fractured Oilfields. J. Petrol. Sci. Eng. 2016, 138, 218–233. [Google Scholar] [CrossRef]
  19. Zhao, J.; Zhang, J. Research and Advances of Silicate Plugging Agent in the Oilfields. J. Mater. Sci. Chem. Eng. 2019, 7, 1–10. [Google Scholar] [CrossRef] [Green Version]
  20. Hatzignatiou, D.G.; Askarinezhad, R.; Giske, N.H.; Stavland, A. Laboratory Testing of Environmentally Friendly Sodium Silicate Systems for Water Management Through Conformance Control. SPE Prod. Oper. 2016, 31, 337–350. [Google Scholar] [CrossRef]
  21. Sun, Y.; Li, Z.; Lin, T.; Sun, Y.; Liu, H.; Song, H.; Li, S. Experimental Research on the Control of Gas Channeling by Thermo-sensitive Gel on Offshore Heavy Oil. Oilfield Chem. 2020, 37, 266–272. [Google Scholar]
  22. Cheng, W.; Han, B. Wellbore heat transfer model of multiple thermal fluids based on actual gas state equation. Acta Pet. Sin. 2015, 36, 1402–1410. [Google Scholar]
  23. Yu, X.; Liu, X.; Chen, M.; Wu, G.; Li, X. Study on Influence of Heavy Oil Reservoir Damage Caused by Multi-Component Thermal Fluid Huff and Puff. Front. Energy Res. 2022, 821221. [Google Scholar] [CrossRef]
  24. Li, Z.; Sun, Y.; Lu, T.; Hou, D.; Li, B.; Li, S. Three-dimensional physical simulation of thermochemical flooding in offshore heavy oil. J. China Univ. Pet. Nat. Sci. 2020, 44, 85–90. [Google Scholar]
  25. Zhang, F.; Liao, H.; Yang, D.; Wu, T.; Ge, T.; Du, C.; Geng, Z. Experimental study on 3d physical simulation of SAGD development in offshore deep massive extra-heavy oil. Chem. Eng. Oil Gas 2019, 48, 90–94. [Google Scholar]
  26. Huang, C.; Huang, S.; Cheng, L.; Wei, S.; Liu, S. Two-Dimensional Physical Simulation Device for Thermal Recovery of Horizontal Wells in Heavy Oil Reservoirs. Beijing Patent CN204267010U, 15 April 2015. [Google Scholar]
  27. Xie, K.; Cao, B.; Lu, X.; Jiang, W.; Zhang, Y.; Li, Q.; Song, K.; Liu, J.; Wang, W.; Lv, J.; et al. Matching between the diameter of the aggregates of hydrophobically associating polymers and reservoir pore-throat size during polymer flooding in an offshore oilfield. J. Pet. Sci. Eng. 2019, 177, 558–569. [Google Scholar] [CrossRef]
  28. Xie, K.; Lu, X.; Pan, H.; Han, D.; Hu, G.; Zhang, J.; Zhang, B.; Cao, B. Analysis of dynamic imbibition effect of surfactant in micro cracks in reservoir with high temperature and low permeability. SPE Prod. Oper. 2018, 33, 596–606. [Google Scholar]
  29. Cao, W.; Xie, K.; Lu, X.; Ding, H.; Xiao, Z.; Cao, W.; Zhou, Y.; He, X.; Li, Y.; Li, H. The effect of profile-control oil-displacement agent on increasing oil recovery and its mechanism. Fuel 2019, 11, 51–1160. [Google Scholar] [CrossRef]
  30. Cao, B.; Lu, X.; Xie, K.; Ding, H.; Xiao, Z.; Cao, W.; Zhou, Y.; He, X.; Li, Y.; Li, H. The pore-scale mechanisms of surfactant-assisted spontaneous and forced imbibition in water-wet tight oil reservoirs. J. Pet. Sci. Eng. 2022, 213, 110371. [Google Scholar] [CrossRef]
  31. Cui, C.; Zheng, W.; Zhu, Y.; Yuan, F.; Xiao, X.; Wu, Z.; Teng, S. Method for determining limit well spacing of chemical flooding after reservoir steam soak in heavy oil reservoir. J. China Univ. Pet. Nat. Sci. 2022, 46, 97–103. [Google Scholar]
  32. Yang, J.; Li, X.; Chen, Z.; Tian, J.; Huang, L.; Liu, X. Steam stimulation productivity prediction model considering non-Newtonian properties of heavy oil. Acta Pet. Sin. 2017, 38, 84–90. [Google Scholar]
  33. Zheng, H. Rheological Properties of Non-Newtonian Crude oil Percolation and Its Application in Oilfield Development. J. Jianghan Pet. Inst. 2003, 25, 90–91. [Google Scholar]
  34. Wang, Y.; Zhao, Q.; Zhou, S. Effect of temperature on microstructure of hydrated calcium silicate synthesized by solution method. B Chin. Ceram. Soc. 2018, 37, 2817–2821. [Google Scholar]
  35. Lei, Y.; Han, T.; Wang, H.; Jin, X.; Yang, F.; Cao, H.; Cheng, F. Preparation and characterization of calcium silicate hydrate (C-S-H) by hydrothermal synthesis. B Chin. Ceram. Soc. 2014, 33, 465–469. [Google Scholar]
  36. Lothenbach, B.; Scrivener, K.; Hooton, R.D. Supplementary Cementitious Materials. Cem. Concr. Res. 2011, 41, 1244–1256. [Google Scholar] [CrossRef]
  37. Liu, J.; Lu, X.; Wang, R.; Liu, Y.; Zhang, S. Performance evaluation and oil displacement mechanism of special viscoelastic fluid at high salinity. J. China Univ. Pet. Nat. Sci. 2013, 37, 159–166. [Google Scholar]
  38. Liu, J.; Lu, X.; Zhang, Y.; Cao, W.; Xie, K.; Pan, H.; Zhao, J.; Li, G. Effect of Surfactants and bases on gelling effect of Cr~(3+) polyacrylamide gel and its mechanism. Acta Pet. Sin. Pet Process Sect. 2018, 34, 614–622. [Google Scholar]
  39. Cao, B.; Xie, K.; Lu, X.; Cao, W.; He, X.; Xiao, Z.; Zhang, Y.; Wang, X.; Su, C. Effect and mechanism of combined operation of profile modification and water shutoff with in-depth displacement in high-heterogeneity oil reservoirs. Colloid Surf. A 2021, 631, 127673. [Google Scholar] [CrossRef]
Figure 1. Core with inlets and outlets.
Energies 15 07346 g001
Figure 2. Relationship between the heavy oil flow rate and injection pressure at different temperatures.
Energies 15 07346 g002
Figure 3. SEM images of inorganic gel. (a) T = 55 °C (0 d); (b) T = 140 °C (0 d); (c) T = 55 °C (5 d); (d) T = 140 °C (5 d).
Energies 15 07346 g003
Figure 4. SEM images of polymer gel. (a) T = 55 °C (0 d); (b) T = 140 °C (0 d); (c) T = 55 °C (5 d); (d) T = 140 °C (5 d).
Energies 15 07346 g004
Figure 5. Relationships between injection pressure and injection pore volume.
Energies 15 07346 g005
Figure 6. Relationships between injection pressure, water cut, oil recovery, and injection pore volume when profile control was performed at a water cut of 40%.
Energies 15 07346 g006
Figure 7. Relationships between injection pressure, water cut, oil recovery, and injection PV when the profile control was performed at a water cut of 98%.
Energies 15 07346 g007
Figure 8. Relationships between injection pressure, water cut, oil recovery, and injection pore volume at different swept areas with the injector–producer distance.
Energies 15 07346 g008
Figure 9. Schematic of oil viscosity distributions in the cores.
Energies 15 07346 g009
Figure 10. Schematic of the inverted nine-point well pattern model. (a) Without thermal recovery; (b) With thermal recovery.
Energies 15 07346 g010
Figure 11. Relationships between the injection pressure, water cut, oil recovery, and injection pore volume when profile control was performed at a water cut of 40%.
Energies 15 07346 g011
Figure 12. Relationships between the injection pressure, water cut, oil recovery, and injection pore volume when profile control was performed at a water cut of 98%.
Energies 15 07346 g012
Figure 13. Relationships between the water cut of Producers 1 and 2 and injection pore volume when profile control was performed at a water cut of 40%.
Energies 15 07346 g013
Figure 14. Relationships between the water cut of Producers 1 and 2 and injection pore volume when profile control was performed at a water cut of 98%.
Energies 15 07346 g014
Figure 15. Relationships between fractional flow rates of Producers 1 and 2 and injection pore volume when profile control was performed at water cuts of 40% and 98%.
Energies 15 07346 g015
Figure 16. Schematic of (a) water flooding and thermal recovery, (b) profile control and thermal recovery, and (c) water flooding and profile control.
Energies 15 07346 g016
Table 1. Relationship between heavy oil viscosity and temperature.
Temperature (°C)505560708090100120140150160180200
Viscosity (mPa·s)925 ± 19590 ± 5.8470 ± 11.2297 ± 7.5175 ± 1.887 ± 1.757 ± 1.536.8 ± 0.625.6 ± 0.519.9 ± 0.215.8 ± 0.312.7 ± 0.210.8 ± 0.2
Table 2. Resistance factor, residual resistance factor, and plugging rate.
ParametersConcentration of Main and Auxiliary Agents (%)Permeability Kw(×10−3 μm2)Resistance factorResidual Resistance factorPlugging Rate (%)
Scheme Before Profile ControlAfter Profile Control
1-10.258551953.463.4677.2
1-20.59661676.266.5282.7
1-31.09451258.659.2386.8
1-42.08506036.5245.6593.0
1-54.0880965.0093.7599.0
1-66.0940966.9298.0899.1
Table 3. Effects of oil viscosity on oil recovery.
SchemeWater Cut at the Beginning of Agent Injection (%)Oil Viscosity
(mPa·s)
Oil Saturation (%)Oil Recovery (%)
Water FloodingAfter Water InjectionIncremental
2-14059079.53.523.312.5
2-29880.510.819.78.9
2-34057.078.811.041.014.0
2-49878.527.037.610.6
2-54019.977.114.849.817.4
2-69876.732.443.911.5
2-74010.873.323.461.218.3
2-89873.542.956.113.2
Note: The recovery incremental is the increase of the oil recovery between the final recovery and the recovery after the primary water flooding to water cut of 98%.
Table 4. Oil recoveries for different swept areas for thermal recovery.
Scheme No.Displacement MethodArea Swept by Thermal RecoveryOil Saturation
(%)
Oil Recovery (%)
Water FloodingIncrement
2-9Water flooding-80.510.8-
2-10Water flooding and thermal recovery1/1080.511.41.2
2-112/1080.112.82.6
2-123/1079.514.34.1
2-134/1079.316.05.8
2-145/1078.817.77.5
Table 5. Oil recoveries associated with water flooding and thermal recovery with different oil viscosity distributions.
Scheme No.Displacement ModeOil Viscosity
(mPa·s)
Oil Saturation
(%)
Oil Recovery
(%)
Water FloodingIncrement
2-9Water flooding59080.510.8-
2-15Water flooding and thermal recovery57.079.714.33.5
2-16175, 19.978.915.95.1
2-17175, 57.0, 19.979.516.45.6
2-18175, 57.0, 36.8, 19.979.115.65.8
Table 6. Oil recoveries in flooding experiments.
Scheme No.Displacement MethodWater Cut for Profile Control Injection
(%)
Oil Saturation
(%)
Oil Recovery (%)
Water FloodingFinalIncrement
3-1Water flooding-78.78.7--
3-2Water flooding and
thermal recovery
9878.011.5-2.7
3-3Profile control4078.52.819.610.9
3-4Profile control9878.78.714.05.3
3-5Profile control and thermal recovery4078.23.823.815.1
3-6Profile control and thermal recovery9878.011.518.19.4
Note: The incremental oil recovery was calculated based on the oil recovery of Scheme 3-1.
Publisher’s Note: MDPI stays neutral with regard to jurisdictional claims in published maps and institutional affiliations.

