
External Shading Devices: Should the Energy Standard Be Supplemented with a Production Stage?


1
Department of Civil Engineering, Ariel University, Ariel 4070000, Israel
2
Faculty of Architecture and Town Planning, Technion Israel Institute of Technology, Haifa 3200003, Israel
*
Author to whom correspondence should be addressed.
Sustainability 2022, 14(19), 12690; https://doi.org/10.3390/su141912690
Submission received: 4 September 2022
/
Revised: 30 September 2022
/
Accepted: 3 October 2022
/
Published: 6 October 2022
(This article belongs to the Special Issue Future Prospects in Life Cycle Assessment and Green Building)
Abstract
:The Israeli Standard SI5282 rates buildings according to the operational energy (OE) used to support their heating, cooling, and lighting needs. When it was proposed, OE was generally considered to be derived from fossil fuels, such as coal. However, at present, Israel is in the process of transitioning to cleaner energy sources, such as natural gas and renewables. In light of this change, the question that guided this study was as follows: should the production (P) stage of external shading devices be taken into account alongside the OE stage? In this study, we aimed to evaluate the P (environmental damage) and OE (environmental benefit) of five external shading devices with equivalently high energy rates that were installed in a typical office building using cleaner OE sources. We evaluated the environmental impacts using the ReCiPe2016 method. The results indicated that the P stage of the five shading devices led to significantly different degrees of environmental damage, thus reducing the environmental benefits related to the OE stage. Therefore, the five similarly rated shading devices could no longer be considered as equivalent sustainable alternatives. As such, we recommend that the energy rating be supplemented with a P stage environmental evaluation.
1. Introduction
At present, addressing environmental concerns about global climate change and resource depletion is a top priority of modern society. The construction sector is a significant consumer of natural resources and produces large amounts of emissions and construction waste [1]. Buildings influence the environment during each stage of their life cycle, including the production (P), operational energy (OE), and demolition (D) stages, which can be evaluated using life cycle assessment (LCA) methodologies. However, these stages have different influences on the overall environmental impacts: usually, the P and OE stages are much more influential than the D stage, and these two main stages are highly dependent on the local climate, building technologies utilized, and electricity sources for the OE needed to heat, cool, and light buildings [2].
There are four climatic zones in Israel: a hot Mediterranean climate, an arid climate, a mild Mediterranean climate, and a desert climate [3]. In all of these climatic zones, buildings should be thermally insulated accordingly [4]. It is common practice in Israel to design laminate facades that consist of light insulation materials such as polystyrene and a heavy thermal mass such as concrete [5]. In the past, Israel has primarily used fossil fuels for the electricity source needs in the OE, including coal and gas [6].
In 2011, the Standards Institution of Israel (SII)—taking into account these climate zones, building technologies, and electricity sources—released Standard SI5282 to rate the OE of buildings. The standard varies OE-influenced design variables, such as insulation, thermal mass, and external and internal shading devices, and evaluates the energy rating of buildings. To achieve the required OE rating, building practitioners can work according to the prescriptive/descriptive approach or the performance approach. The former allows for the use of prescribed sets as design variables, whereas the latter measures OE efficiency using a reference base case building. As a result, buildings can be rated using six ranks of OE performance, from level F (worst) to level A+ (best), ranging through D, C, B, and A [7].
This OE-oriented standardization was justified at the time, as highly polluting fossil fuels served as the main source for electricity production in Israel. In this context, one group of authors [8] carried out the LCAs of local Israeli wall technologies found in typical residential buildings, including concrete, regular concrete blocks, lightweight concrete blocks, and autoclaved aerated blocks, and reported that when non-renewable natural gas was used to fulfill the needs of the OE stage, the shares of environmental damage related to the P and OE stages were 15% and 85%, respectively. However, the authors also considered renewable solar energy (photovoltaic panels, PV) for the OE needs and observed opposite values for the P and OE stages, at 70% and 30%, respectively.
Pushkar and Yezioro [9] analyzed the energy rates of a typical office building located in Tel Aviv (hot Mediterranean climate) according to SI5282-2 alongside an LCA (P and OE stages). The design variables included different wall technologies with different sizes of windows. Two electricity sources that were more and less coal-dependent were applied for the OE needs. The authors showed that the P + OE results for these building technologies contradicted the SI5282-2’s energy ratings; this contradiction was especially prominent when less coal-dependent electricity sources were used in the OE stage. As a result, Pushkar and Yezioro [9] recommended that when evaluating wall technologies using the SI5282-2 energy rating, the P stage should not be neglected.
According to SI5282-2, the external shading device is the next design variable that must be assessed [7]. This is due to the high levels of solar radiation in Israel, which are observed in all four climatic zones almost year-round [10]. It should be noted that shading devices have mostly been studied as a means of reducing the cooling energy and protecting individuals from discomfort due to glare in the OE stage caused by high solar gains in buildings located in hot and dry, hot, mild, tropical, semiarid, humid subtropical, and continental climates [11,12,13,14,15]. In Israel, similar to many other areas around the world, the energy and daylighting performance (OE stage) of external shading devices are the main focus of the existing literature. For example, Perez and Capeluto [16], in their search for building design variables that had a significant influence on the energy needs of a typical school room, reported that the influence of the window shading variable was comparable to that of wall insulation. Grobman et al. [17] studied the influence of static and dynamic external shading devices on the daylighting performance of a typical office space in a Mediterranean climate and noted that, when compared with static shading, dynamic shading increased the adjusted useful daylight illuminances by up to 51%. Yezioro and Capeluto [18] proposed the ENERGYui model, which can evaluate energy according to the SI5282-2 standard by changing the design variables; external shading is considered to be among the important architectural geometric parameters.
However, the aforementioned studies focused only on OEs and neglected the other LCA-related stages, P and D. Very few of the studies used LCA to evaluate shading devices with a more holistic approach. Huang et al. [19] analyzed the life cycle energy assessments (LCEAs) of typhoon-resistant external overhang shading structures composed of aluminum and fiberglass in a university campus building in Hong Kong, and the authors reported that around 50 years of OE savings would be needed to offset their production, transportation, construction, and disposal energy. Stazi et al. [20] estimated the LCAs of aluminum and narrowly spaced horizontal wooden louvers in Italy, which has a typical Mediterranean climate. The narrow spacing increased the artificial light needed for the OE stage and increased the energy needed for the production, use, and end of life of these shading devices. Babaizadeh et al. [21] studied the LCAs of five external shading devices composed of different combinations of horizontal overhangs and vertical fins in residential buildings located in hot-humid (Miami), mixed-humid (Atlanta), marine (Seattle), cold (Chicago), and very cold (Duluth) climates in the US. Various materials, including aluminum, wood, and polyvinyl chloride (PVC), were analyzed. The authors [21] concluded from their results that the shares of the OE and P/D stages were approximately equal in terms of the acidification, eutrophication, damage to human health, and ecological toxicity impacts. Mifsud et al. [22] evaluated the LCEAs of three louvers and two meshed stainless steel and aluminum systems (22 configurations in total) in the Mediterranean region of Malta; they reported that only two mesh configurations displaced the offset of the OE stage in their production and transportation stages.
LCA-based studies have shown that the P stage associated with external shading devices can be significant and almost equal to their OE stage. However, these studies covered different shading configurations, materials, and climate zones. Therefore, the results of these studies are very difficult to compare and adapt to the office buildings in Israel’s Mediterranean climate, where concrete or aluminum external shading devices are commonly used due to the fact that most building materials commercially available in Israel are concrete based [23]. To address this gap, Pushkar [23] evaluated both the environmental damage (P stage) and environmental benefit (OE stage) of external shading devices for a standard building unit located in Tel Aviv, Israel. Different combinations of shading components, as suggested by the SI5282-2 standard, were analyzed for the south, west, and east directions. It was found that 65–100% of the building’s OE saving benefit was required to compensate for the environmental damage resulting from the P stage of the shading devices. However, the OE stage was only evaluated using a hypothetical 100% PV electricity fuel source, omitting the actual current fuel composition situation in Israel, which includes a mixture of different shares of fossil and renewable fuel sources. Moreover, the author considered only a typical building module and evaluated shading devices within three completely different energy rating groups.
Thus, an evaluation of the P and OE stages—taking into account the current mixing of fuels for electricity—of alternative shading devices installed in a typical office building located in Israel with similar SI5282 energy ratings has not yet been completed. We hypothesized that the concrete-based external shading devices and aluminum-based light shelf devices that are usually installed in concrete-heavy buildings in Israel might result in increased environmental damage in the P stage [23], while the transition from high-pollution fossil sources to low-pollution renewable sources—reflecting the current reality in Israel—might result in decreased environmental damage during the OE stage [9]. It should be noted that concrete and aluminum are the most commonly used materials in the construction sector for those purposes at present, especially for office buildings. The main reasons for their use are, for instance, their relatively easy maintenance and durability. Nevertheless, there are cases where other materials can be implemented, such as glass, fabrics, and wood. However, they are less commonly used for office buildings in Israel.
Thus, this study aimed to evaluate the environmental damage resulting from the P stage and the environmental benefit resulting from the OE stage of external shading devices with equivalently high energy ratings (B and A) installed in a typical office building in Tel Aviv under the current and future Israeli energy sources for OE needs. This research continues to develop the idea of the integration of P stage energy design variables into the energy standards, thereby improving building sustainability from an LCA point of view.
The joint consideration of the P and OE stages during a preliminary environmental analysis of the use of external shading devices in typical Israeli office buildings is a novelty of this study, particularly in the face of a rapid transition from fossil fuel energy use to renewable energy use to fill the OE demands. In light of recent authoritative studies such as [24] which discusses the “unsustainable direction of green building codes”, the originality and topicality of this study are realized through the application of an LCA as a mandatory procedure for the further improvement of Israeli Standards.
2. Materials and Methods
2.1. Research Framework
We focused on the LCAs of external shading devices applied to a representative office building placed in the hot Mediterranean climate of Israel. As depicted in Figure 1, the studied building was 52 × 23 × 18.5 m, with a standard office depth of 8.2 m.
We studied the southwest (SW) façade as this direction is typically exposed to high solar radiation in Israel [25]. The evaluated shading devices were designed with different combinations of horizontal overhang (H), vertical (V) fins, and light shelves (L), with two basic depths: 0.8 m for small (s) and 1.2 m for large (l) components. Figure 2 shows the base case (without shading) and the five shading devices adopted from Israeli Standard SI5282-2 [7] for the energy rating of buildings: large horizontal overhang (Hl), large light shelf (Ll), small horizontal overhang with a small light shelf (Hs-Ls), large horizontal overhang with small vertical fins (Hl-Vs), and small vertical fins with a small light shelf (Vs-Ls). According to local Israeli technologies, concrete was selected for the horizontal overhang and vertical fin components, while aluminum was selected for the light shelf [23].
We evaluated the P and OE stages of the five shading devices using a two-step procedure. Firstly, OE stage evaluations were conducted using the ENERGYui model [18]. In this step, we determined the difference between the OEs (heating, cooling, ventilation, and lighting) of the SW-facing offices shaded using each of the five studied shading alternatives, as well as that of the offices without shading (the base case). Secondly, we conducted evaluations of the environmental damage (P stage) and environmental benefit (OE stage) of the SW-facing shading alternatives using the midpoint and endpoint single-score results from the ReCiPe 2016 method [26]. See Section 2.2 and Section 2.3 for the detailed explanations of these steps.
2.2. Energy Assessment
We used the SI5282-2 guidelines to design the building [7]. The building was oriented in the southwest–northeast (SW–NE) direction (Table 1). For the construction of the building components, we considered local building technologies based on concrete (Table 2) [9]. The areas of the windows were set as follows: 83 m2 for the NE and SW windows; and 28 m2 for the SE and NW windows. For the southwest façade, we used Hl, Ll, Hs-Ls, Hl-Vs, or Vs-Ls shading devices, while for the other façades, we used Hl shading devices.
We first estimated the OE (kilowatt hour/meters2 per year) and SI5282-2 energy rate of the SW-facing offices without shading devices (base case) and with each of the applied shading devices (five shading alternatives) using the ENERGYui model, which was developed for determining building energy ratings in Israel [18]. The ENERGYui model contains a local materials library and is based on the EnergyPlus simulation model designed by the U.S. Department of Energy [27]. Afterwards, we evaluated the difference between the OEs of the SW-facing offices under each of the five shading alternatives, as well as that of in the base case. The calculations were performed for each of the five floors.
2.3. Environmental Damage (P Stage) and Environmental Benefit (OE Stage)
In the second step, we evaluated the P and OE stages according to the LCA methodology. The end of life stages (i.e., demolition and waste treatment) were excluded from the LCA framework in the present study due to their negligible contribution to the whole LCA [28]. Thus, according to the International Organization for Standardization [29], the LCA of the P and OE stages included: (i) the goal and scope (definition of a functional unit (FU) and system boundaries); (ii) the life cycle inventory (LCI); (iii) the life cycle impact assessment (LCIA); and (iv) the interpretation.
2.3.1. Goal and Scope
Our goal was to compare the environmental evaluations of the Hl, Ll, Hs-Ls, Vl-Vs, and Vs-Ls shading devices with respect to their P (damage) and OE (benefit) stages. To evaluate both the P and OE stages, we defined a functional unit (FU) as a typical intermediate floor and its associated OE was 50 years. The P stage included the production of the concrete and aluminum shading components and their transportation to the building site. The construction of building shading components was excluded from the P stage due to the negligible amount of energy needed for the construction of the horizontal overhang and vertical fin components (e.g., for concrete placing and vibrating in place [30]); we also assumed that the light shelf component was manually installed. The OE was assumed to be produced from 31% coal, 56% natural gas, and 13% PV (2020) or from 8% coal, 57% natural gas, and 35% PV (2025) [31], as denoted below by OE2020 and OE2025, respectively.
2.3.2. Life Cycle Inventory (LCI)
For the P stage of the shading components, we evaluated the total quantities of cement, gravel, sand, water, and aluminum as well as the transportation distances. The material quantities were calculated based on the two relevant basic depths (0.8 m for small and 1.2 m for large shading components) and thicknesses (0.05 and 0.005 m for concrete and aluminum components, respectively). For the transportation of gravel and sand from aggregate quarries and cement from a cement plant to a concrete batching plant, we assumed distances of 50 and 100 km, respectively. For the transportation of ready-mixed concrete from batching plants to the building site, we assumed a distance of 20 km [32]. Finally, for the transportation of aluminum light shelves from distributors to the building site, we assumed a distance of 100 km [23].
The LCI of the materials used and their transportation (P stage) and electricity production were modeled based on the ecoinvent v3.2 database using the SimaPro platform [33]. Table 3 details the adopted ecoinvent v3.2 database.
The cement and energy database was modified according to the local cement composition (P stage) and electricity fuel composition in the OE2020 and OE2025 values reported for Israel. These data were considered appropriate for the comparative evaluation of the shading alternatives, which were produced using the same composite materials (i.e., concrete and aluminum), while the OE was produced from the same fuels (i.e., from OE2020 and OE2025).
2.3.3. Life Cycle Impact Assessment
The difference between the midpoint and endpoint single-score methods is the degree of uncertainty [26]. Midpoint results have a relatively small uncertainty, while endpoint results have a relatively large uncertainty. However, the midpoint results include 22 variables, and these variables can have a different tenancy, which makes the interpretation of results difficult; endpoint results have only six variables, and they can be easily interpreted. In the present study, we used both methods to exploit the strengths of each.
For the LCIA of the shading devices, we used ReCiPe2016 midpoint and endpoint evaluations. At the midpoint level of the evaluation, the four representative midpoint impacts were global warming potential, ionizing radiation, terrestrial ecotoxicity, and human non-carcinogenic toxicity. These impacts were selected due to their high relevance to cement and aluminum production, transportation, and fossil fuel-based electricity [33]. These factors were evaluated using a hierarchist (H) perspective in consideration of the environmental problems.
The hierarchist perspective is one of three perspectives suggested by ReCiPe2016; it evaluates emissions with lifetimes of 100 years. The other two perspectives, the individualist (I) and egalitarian (E), evaluate emissions with short lifetimes (20 years) and extensive lifetimes (1000 years), respectively. Thus, at the endpoint level of the evaluation, we decided to use all three perspectives for the evaluation of the environmental problems (i.e., I, H, and E). Each of these perspectives aims to analyze the damage to human health, ecosystem quality, and resources.
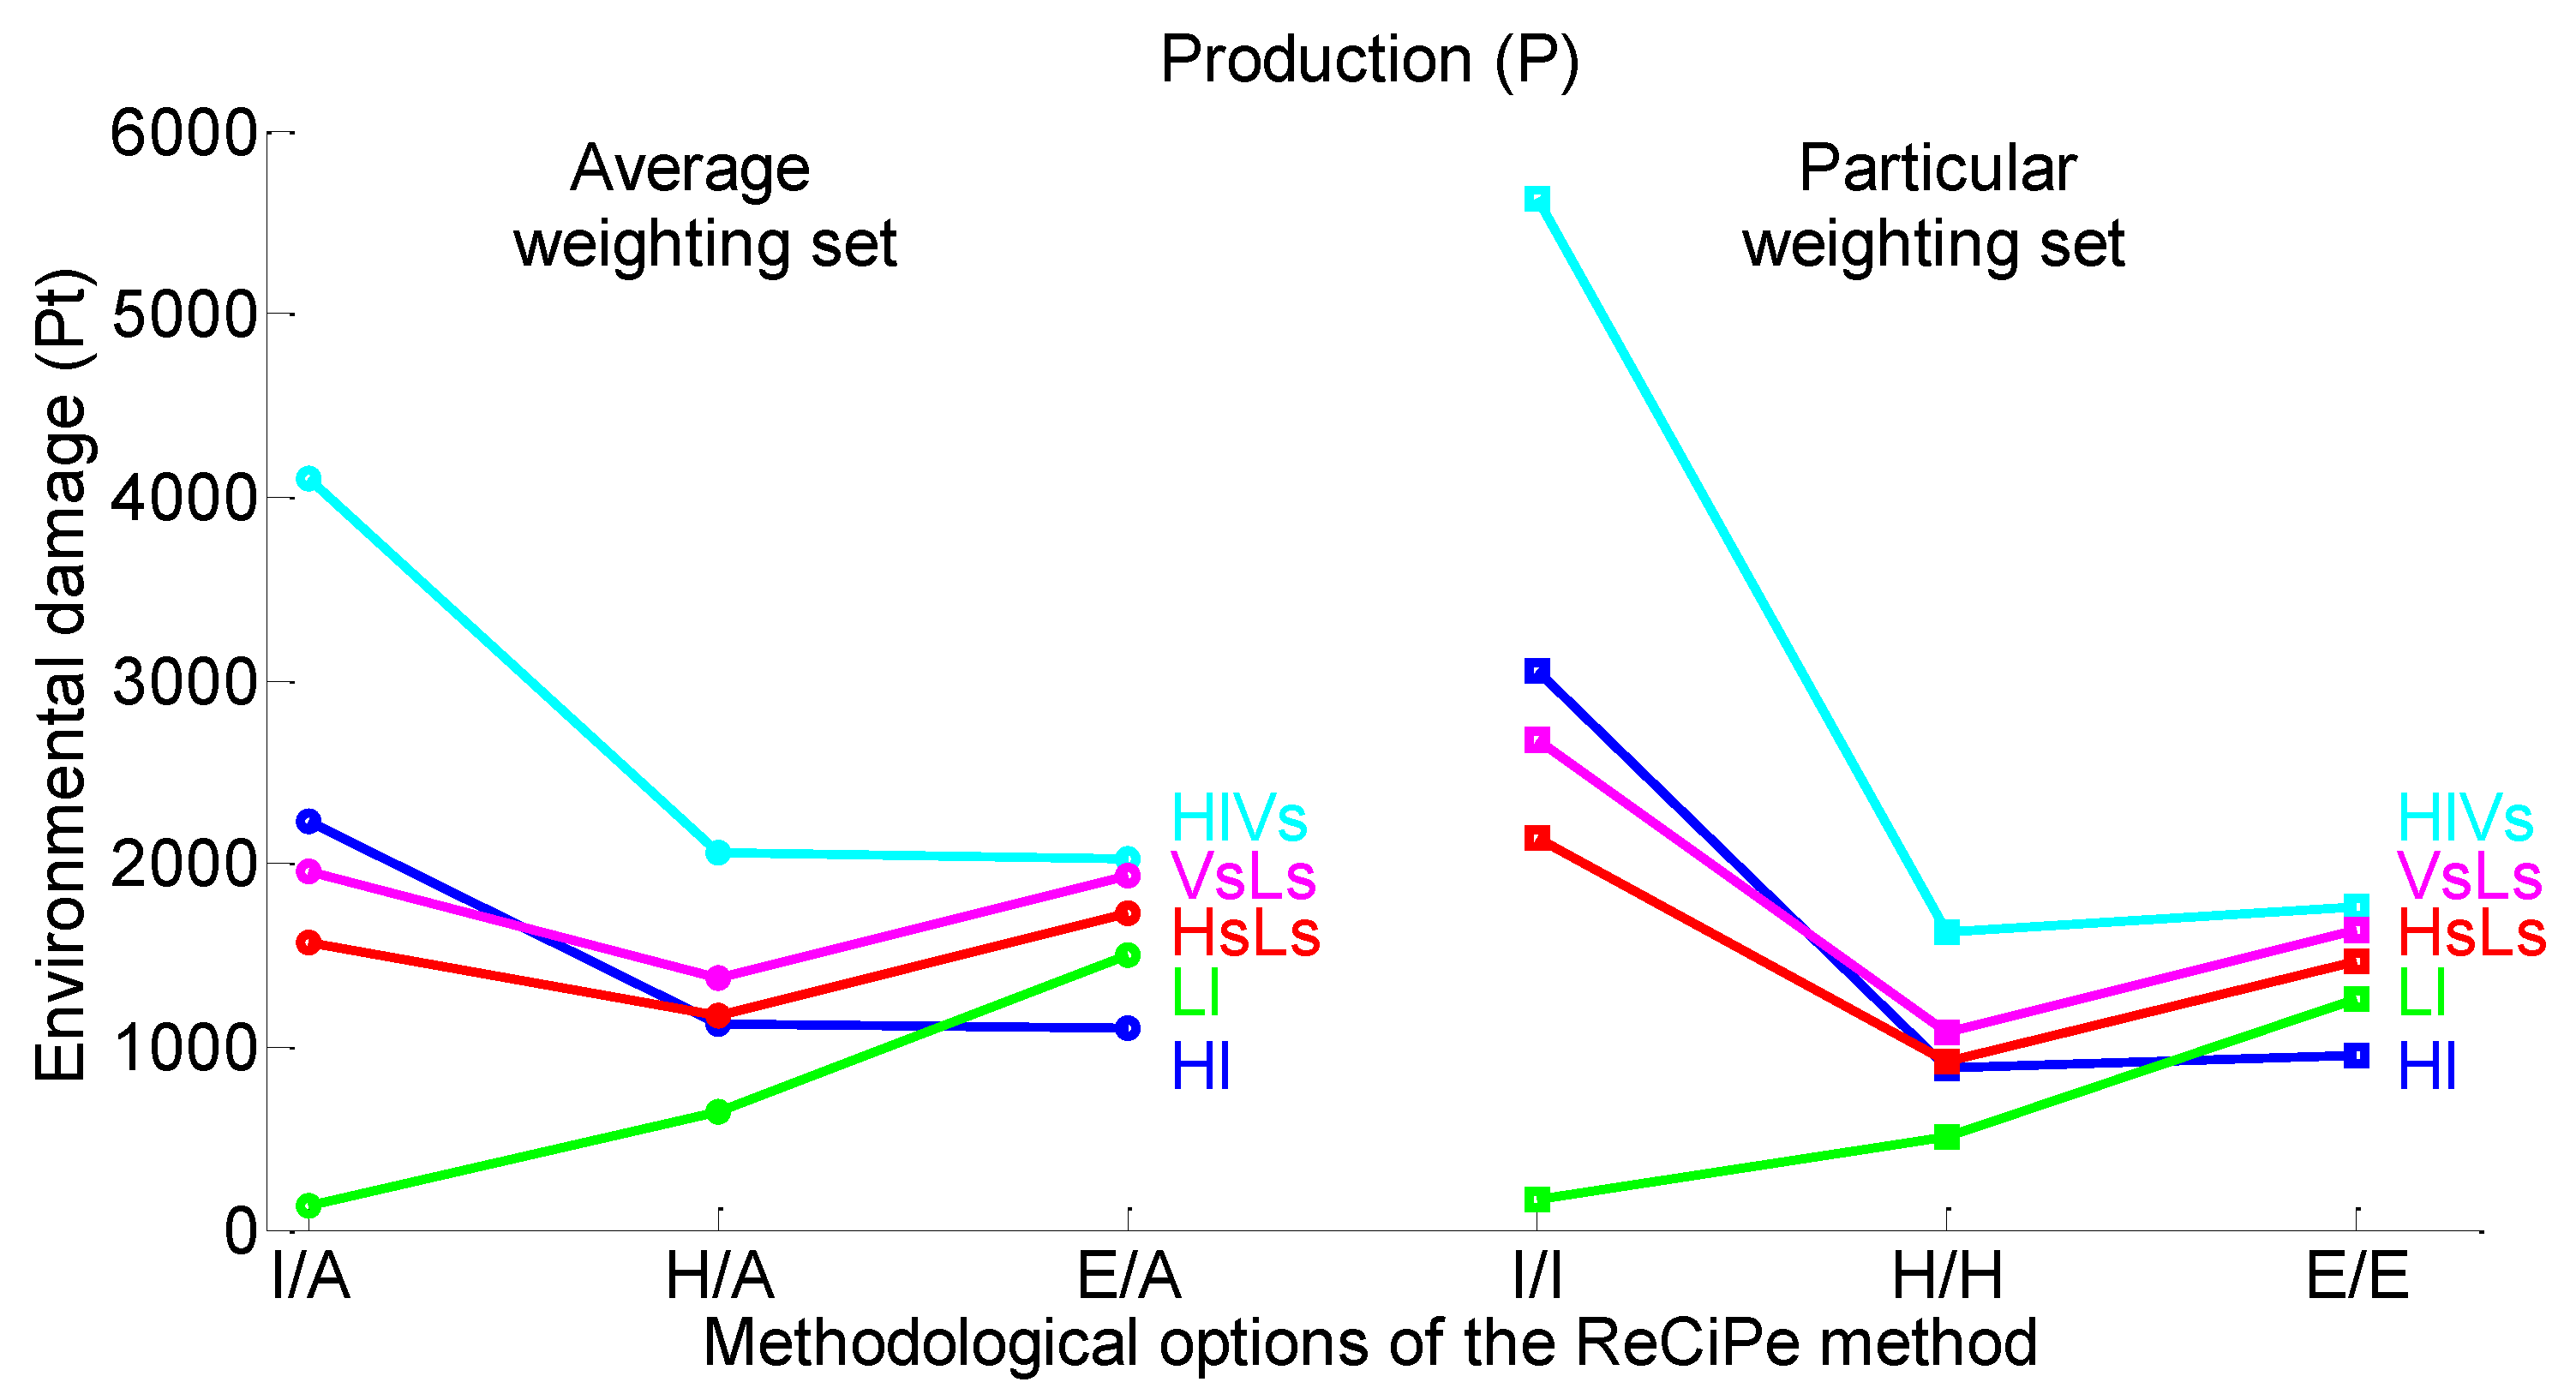
As a final step, ReCiPe2016 allowed us to obtain single-score evaluations by applying the average (A) and perspective-relevant I, H, and E weighting sets in order to assess the damages to human health, ecosystem quality, and resources [33]. Thus, for the endpoint single-score evaluations of the shaded devices, we used the individualist/average (I/A), hierarchist/average (H/A), egalitarian/average (E/A), individualist/individualist (I/I), hierarchist/hierarchist (H/H), and egalitarian/egalitarian (E/E) methodological options in the ReCiPe2016 method.
2.4. Research Design
2.4.1. Research Method
We used a two-stage nested mixed analysis of variance (ANOVA) model, as the ReCiPe2016 single-score results (i.e., the I/A, H/A, E/A, I/I, H/H, and E/E methodological options) had a two-stage nested design structure. This two-stage nested ANOVA model includes the following statistical objects: sampling frame, primary sampling unit, subunits, and individual subunits. The sampling frame is the collection of all elements (primary sampling units) that are available for sampling in the population of interest, where a primary sampling unit includes two or more subunits, and a subunit contains two or more individual subunits. Measurements were collected from the individual subunits [34]. Figure 3 shows the two primary sampling units: the ReCiPe2016 single-score results of alternative 1 and alternative 2. The primary sampling unit included two subunits—namely, the particular and average weighting sets—and each subunit included three individual subunits, giving a total of six methodological options. This design structure was recently used to evaluate a green building rating system [9].
2.4.2. p-Value Interpretation
We used neo-Fisherian significance assessments (NFSAs) instead of paleo–Fisherian and Neyman–Pearson paradigms to interpret the -value using a three-valued logic: “It seems to be positive” (i.e., there seems to be a difference between alternatives), “it seems to be negative” (i.e., there does not seem to be a difference between alternatives), and “judgment is suspended”, which was conducted with respect to the difference between the two alternatives [35]. This -value interpretation was recently used to evaluate a green building rating system [9].
3. Results
3.1. OE Stage Evaluations
It can be seen from Table 4 that the three intermediate floors (2–4) presented the same energy rate scores: F for the base case, A for the Hl and Ll devices, and B for the Hs-Ls, Hl-Vs, and Vs-Ls devices. Therefore, we selected floor 3 as a typical example for the following LCAs of the P and OE stages. It should be noted that, for this typical floor, the application of each of the five shading devices resulted in the highest (A and B) energy ratings.
3.2. Environmental Damage (P Stage) and Environmental Benefit (OE Stage) Evaluations
3.2.1. Preliminary Evaluations of Materials (P Stage) and Energy (OE Stage)
Table 5 shows the amount of materials used for the typical floor in the production of each of the five shading devices and their transportation data in the P stage (positive numbers indicate the potential environmental damage of the applied devices with respect to the base case); the table also features the energy used in the OE stage to fulfil the needs of the offices shaded with each of the five shading devices (negative numbers indicate the potential environmental benefit of the applied devices with respect to the base case).
Concrete mixture components were evaluated based on data presented by Pushkar and Verbitsky [36] (30 MPa 28-day compressive strength of normal concrete, CEM I: Portland cement 364 kg, gravel 1168 kg, sand 618 kg, and water 200 kg).
3.2.2. Environmental Impacts: ReCiPe2016 Midpoint Evaluations
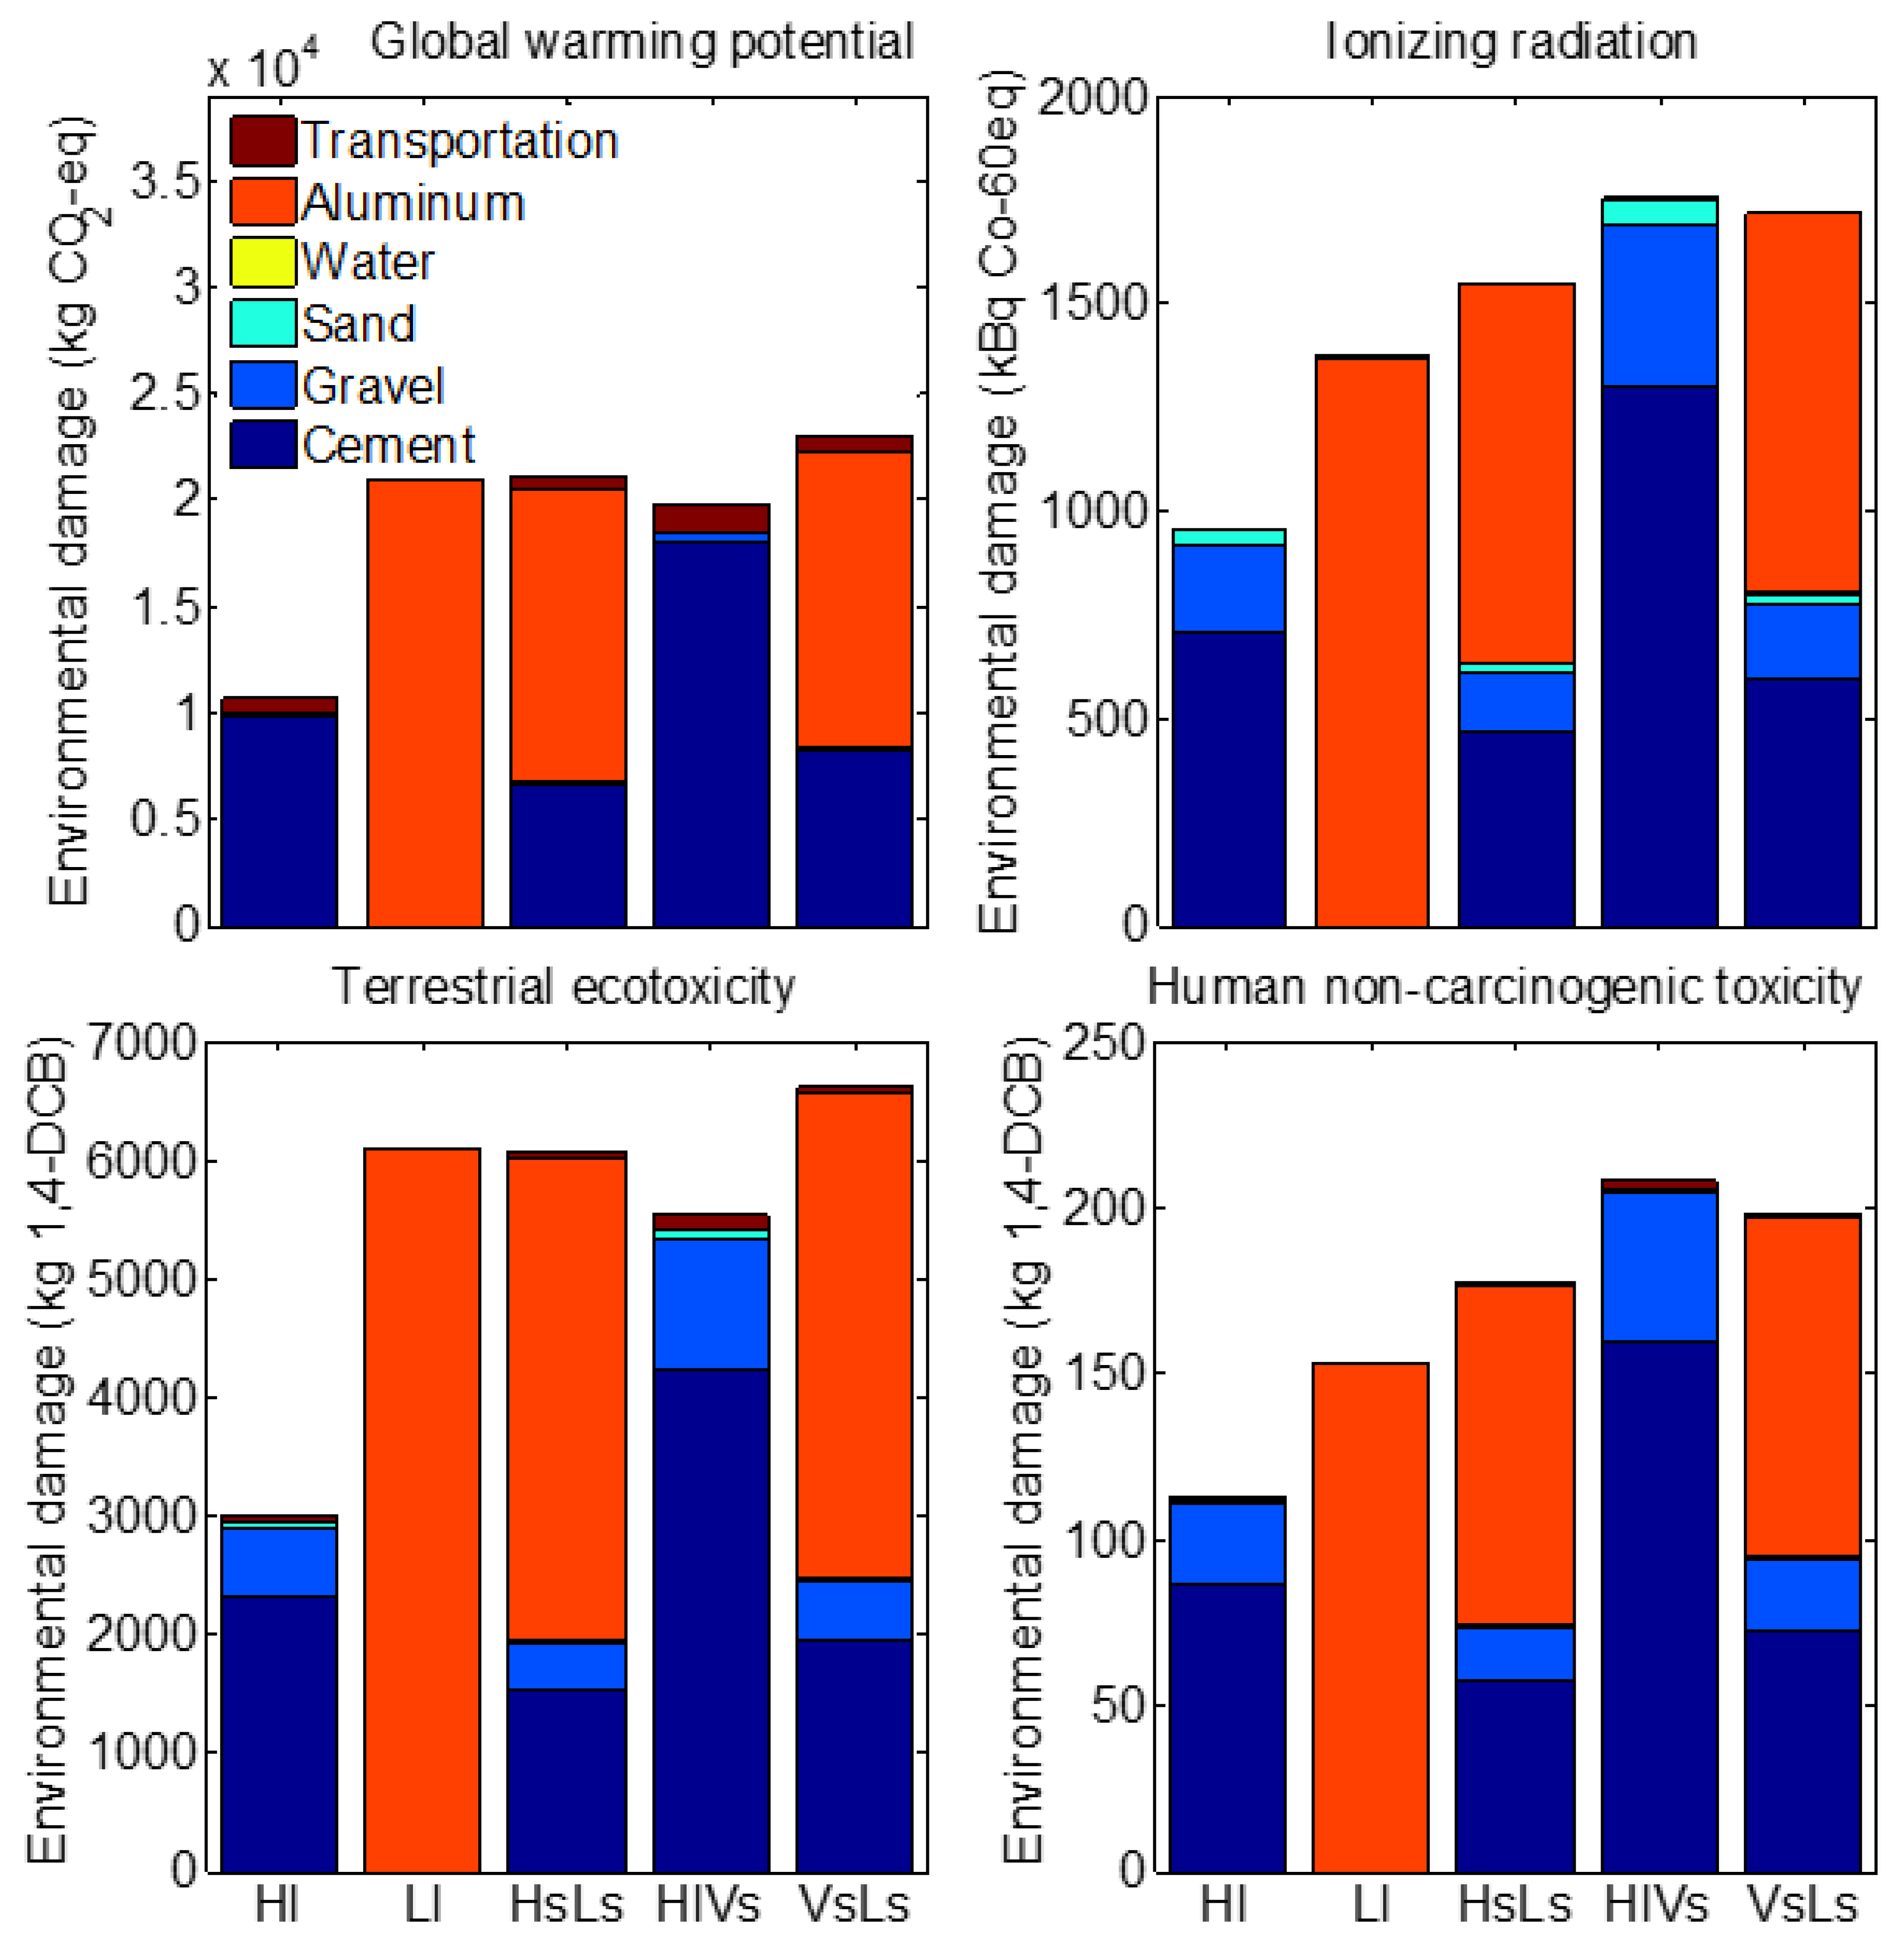
It can be seen from Figure 4 that, in terms of global warming potential and terrestrial ecotoxicity, the ranking (in ascending order) of the environmental damage associated with the shading devices was as follows: Hl, Hl-Vs, Ll and Hs-Ls, and Vs-Ls. However, when considering the ionizing radiation and human non-carcinogenic toxicity, the ascending ranking differed: Hl, Ll, Hs-Ls, Vs-Ls, and Hl-Vs. Thus, considering the different impacts led to different environmental rankings for the five shading devices.
When analyzing the contributions of the concrete components, aluminum, and transportation to the environmental impacts, aluminum was the most influential, followed by cement and gravel production; the impacts of transport, water, and sand were almost negligible. These contributions were as expected. It is well-known from the literature that aluminum production has a strong environmental impact [37]. Portland cement was also recognized as the component of concrete with the highest environmental impact [38].
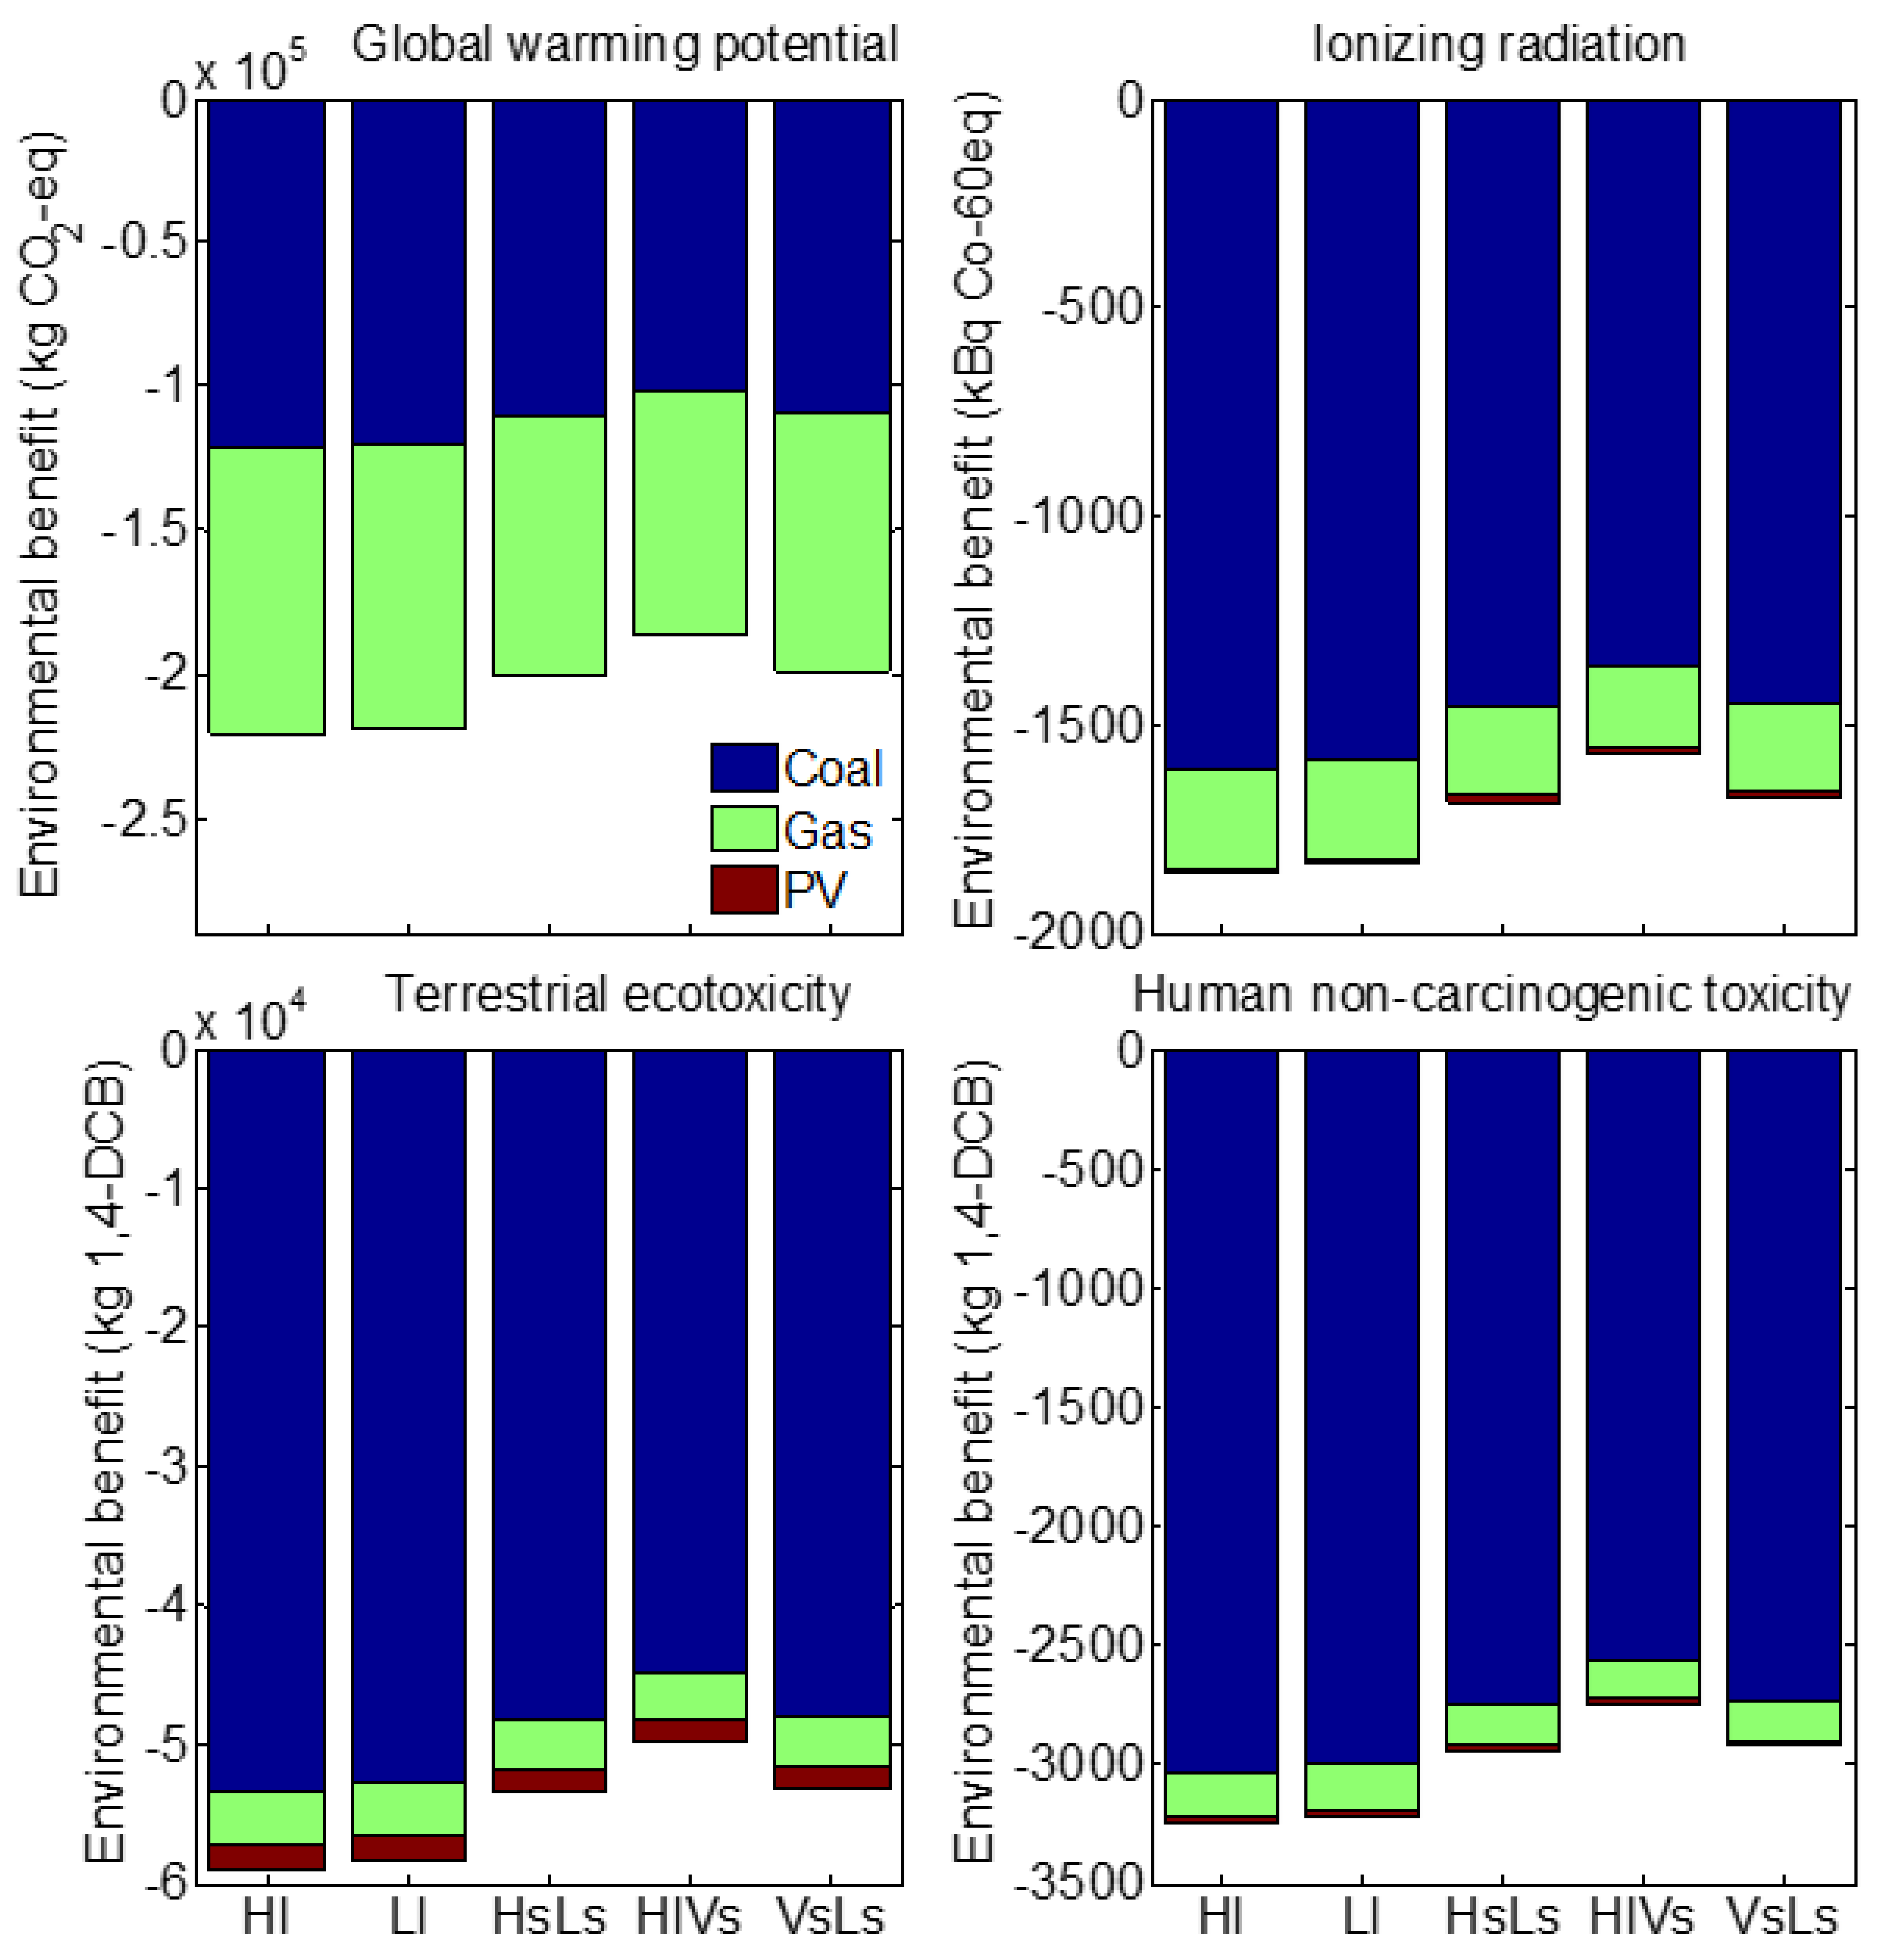
Figure 5 shows the four impacts of OE2020 associated with the application of each of the five shading devices with respect to the base case (without shading). For the global warming potential, ionizing radiation, terrestrial ecotoxicity, and human non-carcinogenic toxicity, the ranking was the same; for environmental benefit, the descending order was as follows: Hl, Ll, Hs-Ls, Vs-Ls, and Hl-Vs.
When considering the contribution of electricity fuel sources to the environmental impacts, coal was the most influential followed by natural gas, whereas PV was the lowest. These contributions were as expected. It is well-known from the literature that non-renewable fossil coal is the most environmentally harmful source of electricity production, followed by non-renewable fossil natural gas; in contrast, renewable PV is one of the most environmentally harmless electricity sources [39].
Figure 6 shows the global warming potential, ionizing radiation, terrestrial ecotoxicity, and human non-carcinogenic toxicity impacts resulting from the OE2025 needs associated in the application of each of the five shading devices with respect to the base case (without shading). According to the results, the ranking of the shading devices, in descending order of environmental benefit, was the same as in the case for an OE based on fuel sources in 2020: Hl, Ll, Hs-Ls, Vs-Ls, and Hl-Vs.
However, when compared with the case of OE2020 (Figure 5), the benefit obtained by using the shading devices was decreased in the case of OE2025 (Figure 6). This is because generating electricity from less-polluted sources leads to a decreased influence of the impact of the OE stage on the full LCA of the shading devices. Moreover, compared with the impacts of OE2020 (Figure 5), the impacts of OE2025 from coal decreased, while those related to natural gas and PV increased (Figure 6). This was due to the expected decrease in the share of coal (8%) by 2025, accompanied by increased shares of natural gas and PV (57% and 35%, respectively).
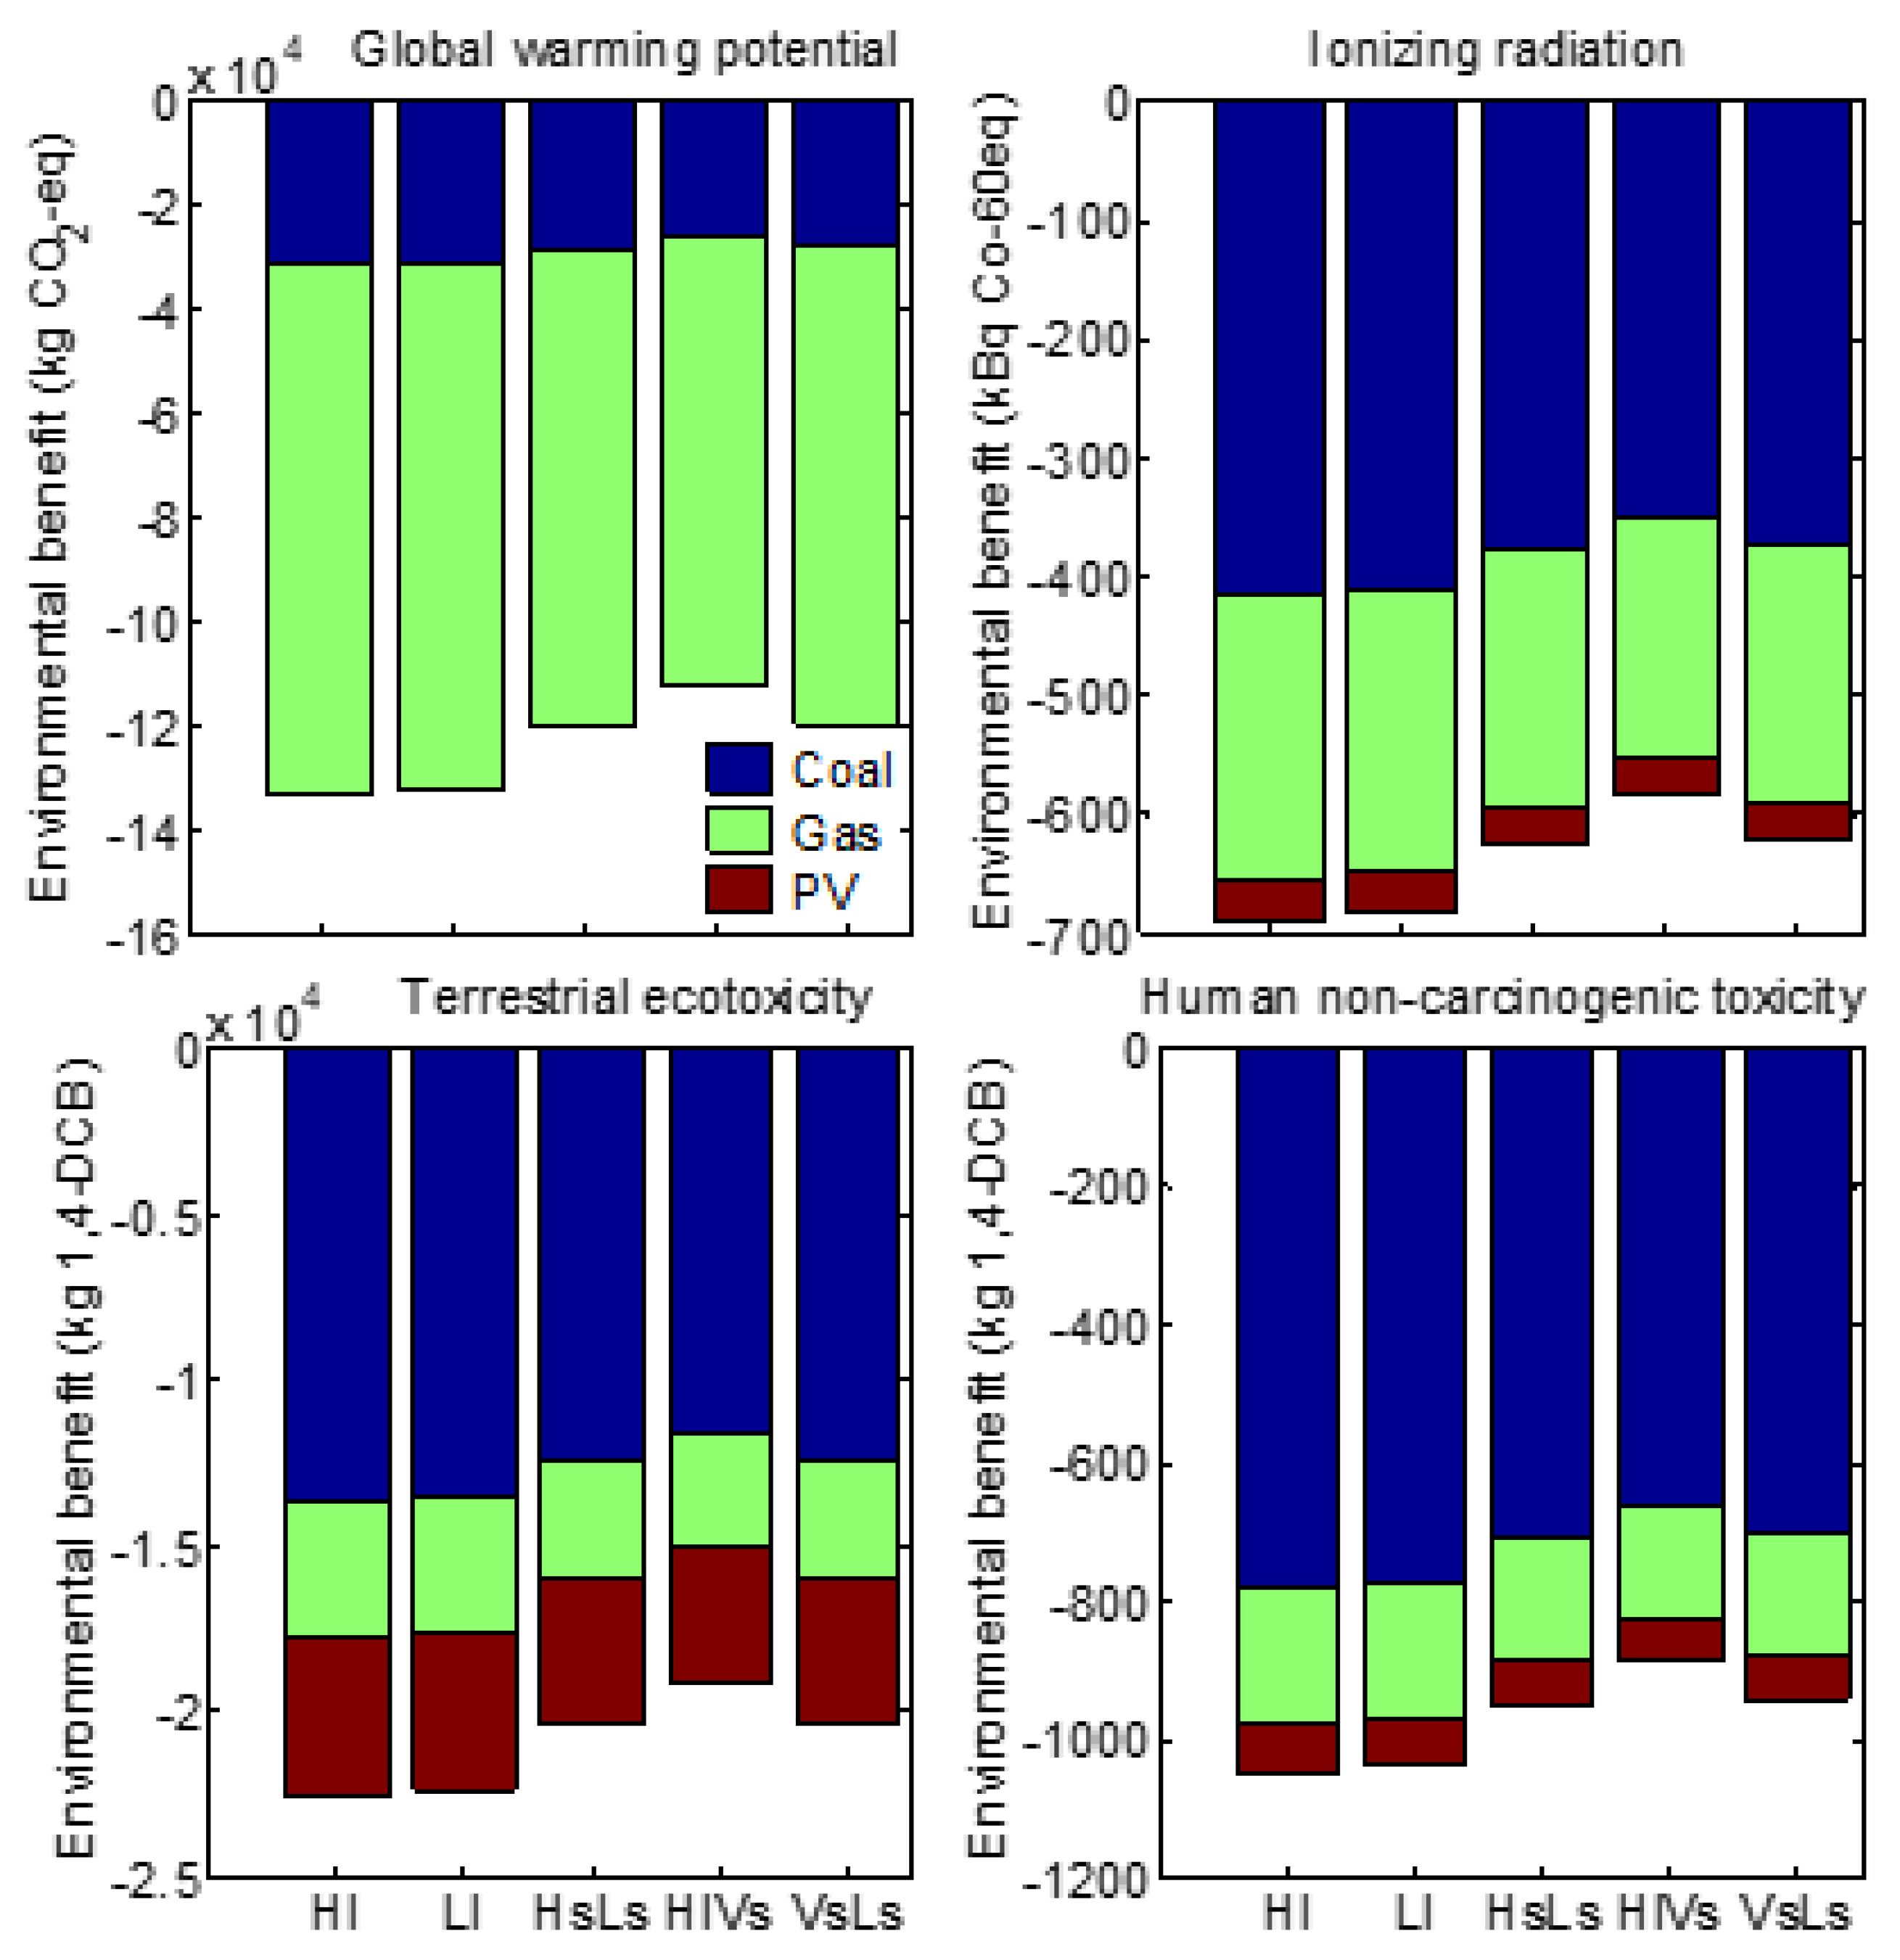
Figure 7 shows the four impacts of the P and OE (based OE2020) stages of the five shading devices, evaluated with respect to the base case (without shading). The application of the five shading devices resulted in environmental benefits in terms of global warming potential, terrestrial ecotoxicity, and human non-carcinogenic toxicity impacts. The ranking of the shading devices, in descending order of environmental benefit, was as follows: Hl, Ll, Hs-Ls, Vs-Ls, and Hl-Vs. This ranking followed the OE2020 ranking, indicating that the environmental benefit (OE stage) still took precedence over the environmental damage (P stage) caused by the analyzed shading devices.
In terms of ionizing radiation, the Hl, Hl, and Hs-Ls devices also showed environmental benefits, whereas the Hl-Vs and Vs-Ls devices resulted in environmental damage. The Hl-Vs device used a large quantity of cement, while the Vs-Ls device used large quantities of both cement and aluminum. As described earlier, the production of these two building materials is well-known to be an environment-polluting process [38,39]. Thus, the P stages of the Hl-Vs and Vs-Ls devices were revealed to dominate their OE stages.
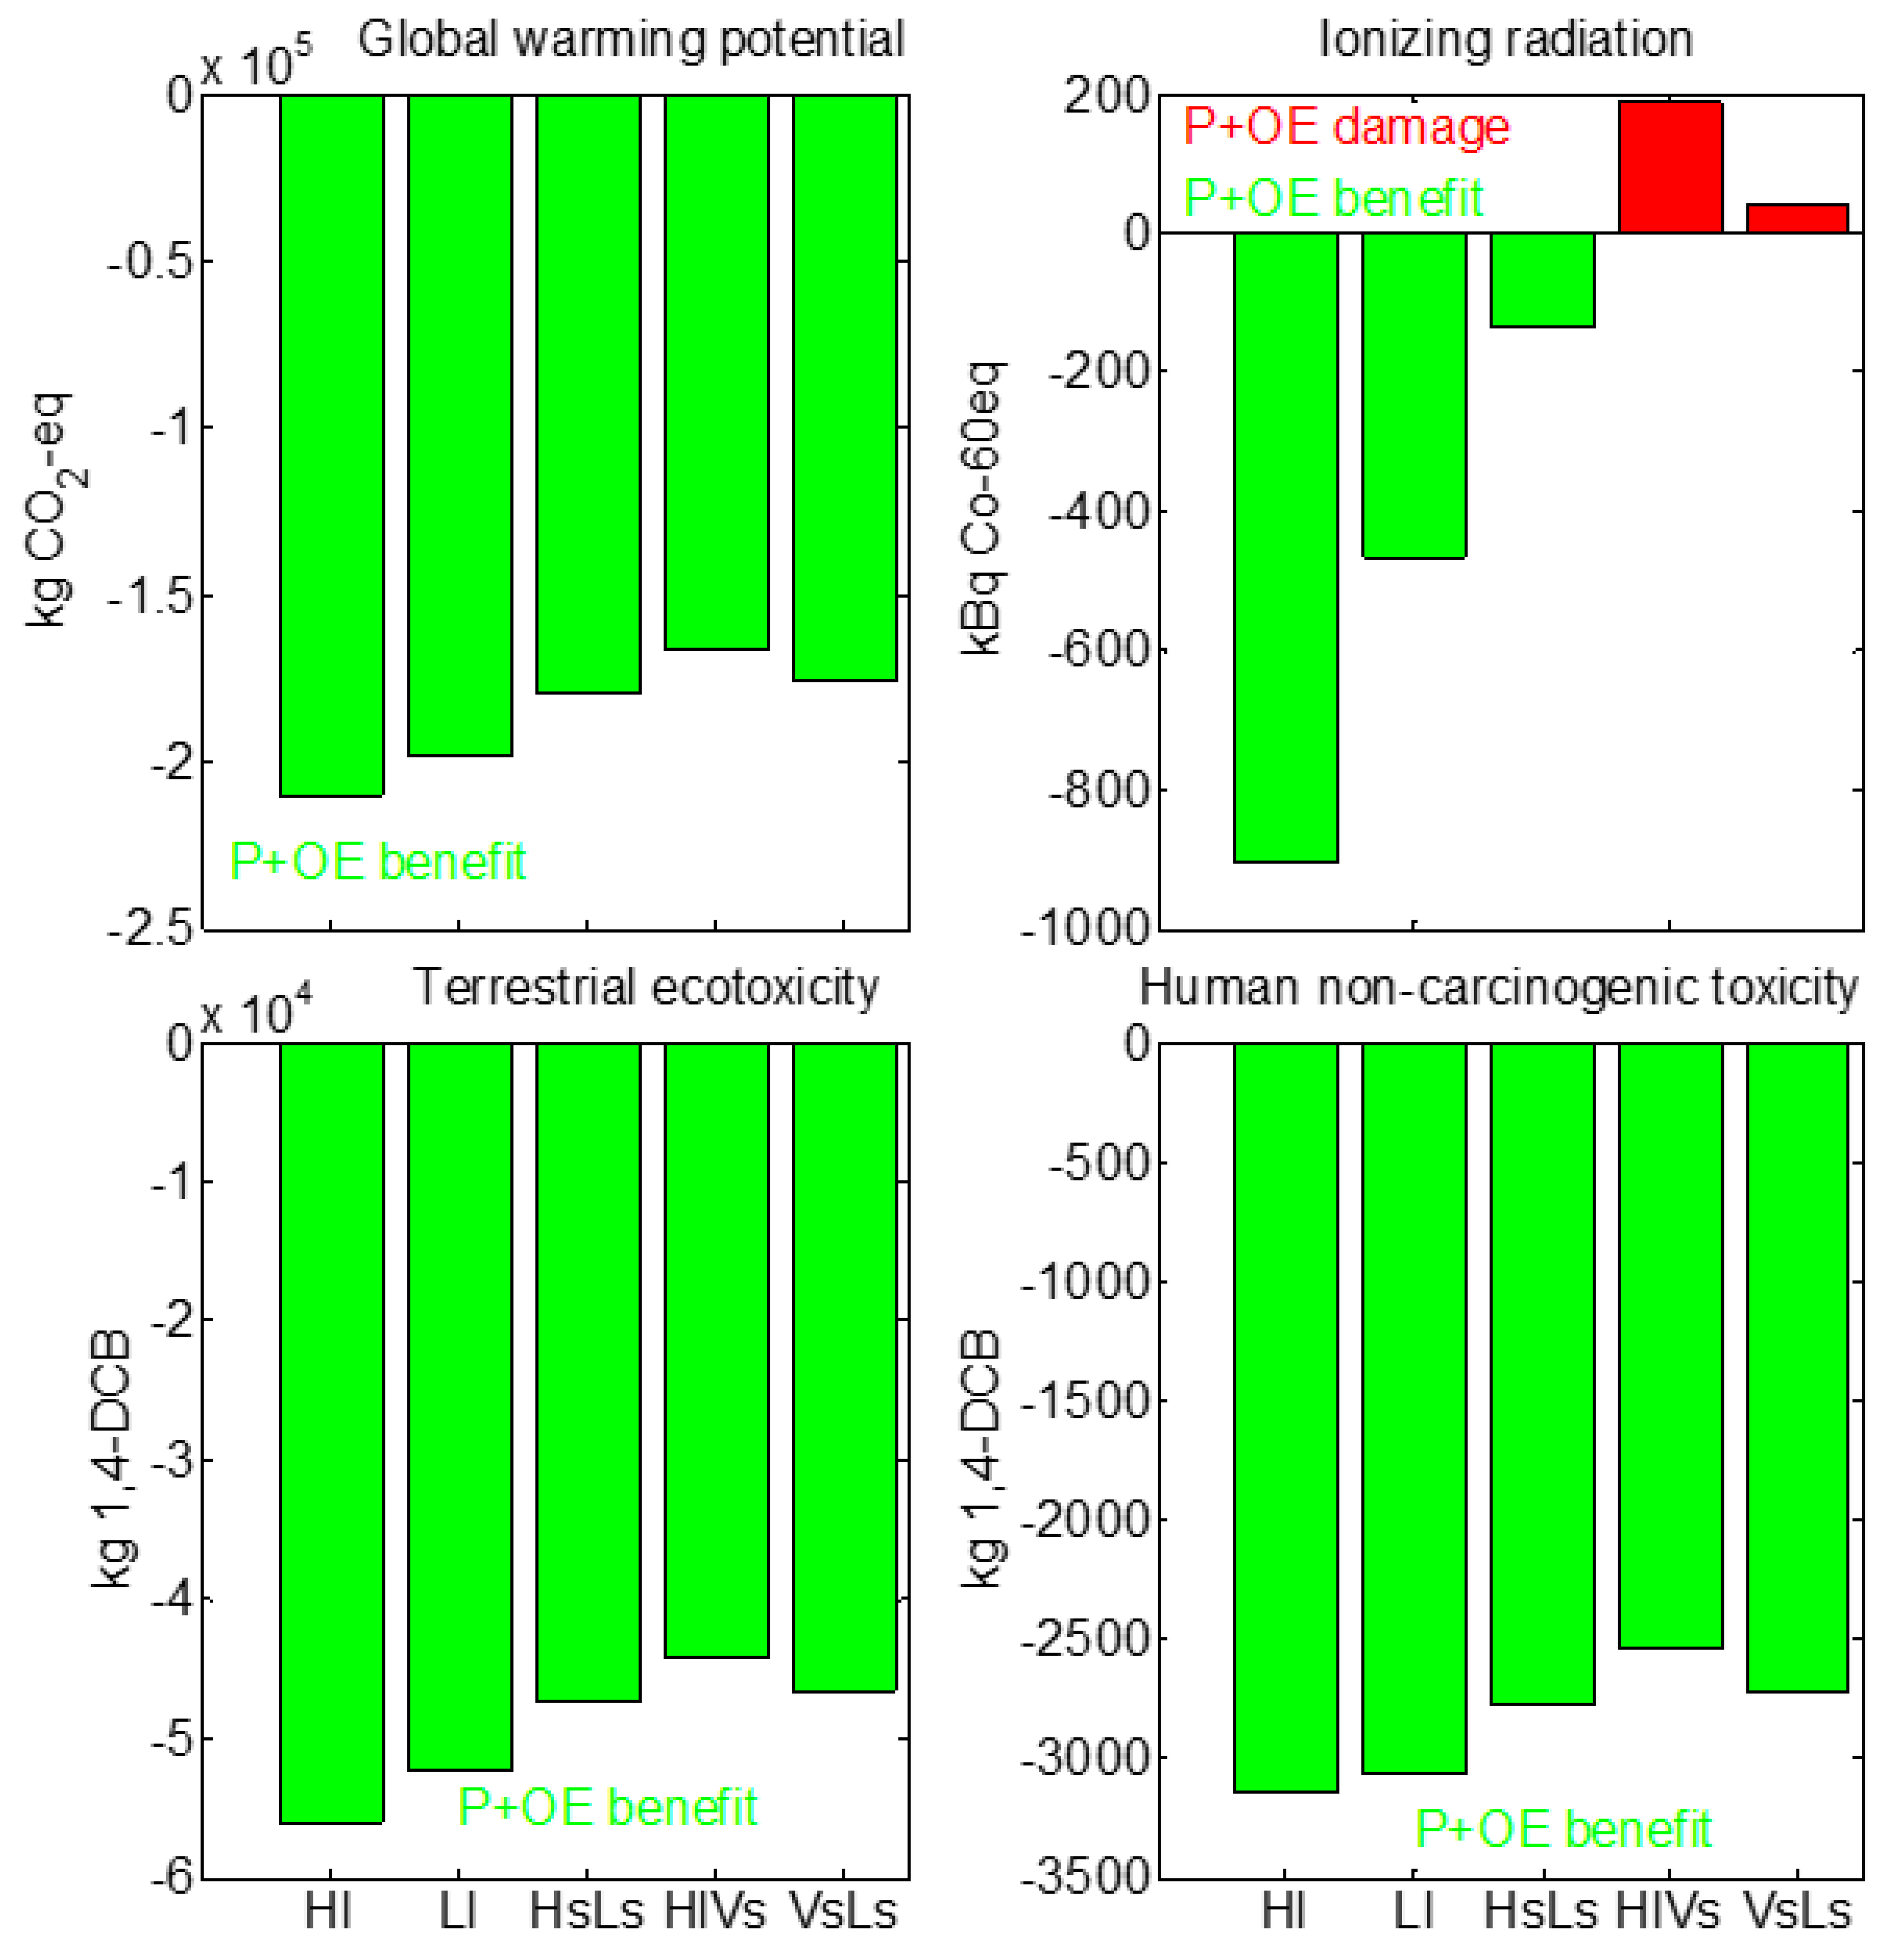
Figure 8 shows the P and OE (based on OE2025) impacts of the five applied shading devices evaluated with respect to the base case (without shading). Again, in terms of the global warming potential, terrestrial ecotoxicity, and human non-carcinogenic toxicity impacts, all five shading devices resulted in environmental benefits, with the same ranking as that noted in the case of P and OE (based on OE2020). However, in terms of the ionizing radiation, the application of all five shading devices resulted in environmental damage. This supports the fact that as power sources become less polluted, the influence of the P stage begins to take precedence over the OE stage.
3.2.3. Environmental Damage: Evaluation of the Six ReCiPe2016 Methodological Options
Figure 9 illustrates that the different methodological options led to different rankings with respect to the environmental damage cause by the shading devices. The overall ranking can be stated as follows: Ll, Hl/Hs-Ls, Vs-Ls, and Hl-Vs.
Taking into account the statistical results presented in Table 6, the ranking can be reorganized as follows: Ll, Hl and Hs-Ls, Vs-Ls, and Hl-Vs. The environmental damage resulting from the shading devices significantly differed from one device to another. This means that only the Hl and Hs-Ls devices can be viewed as leading to the same environmental damage.
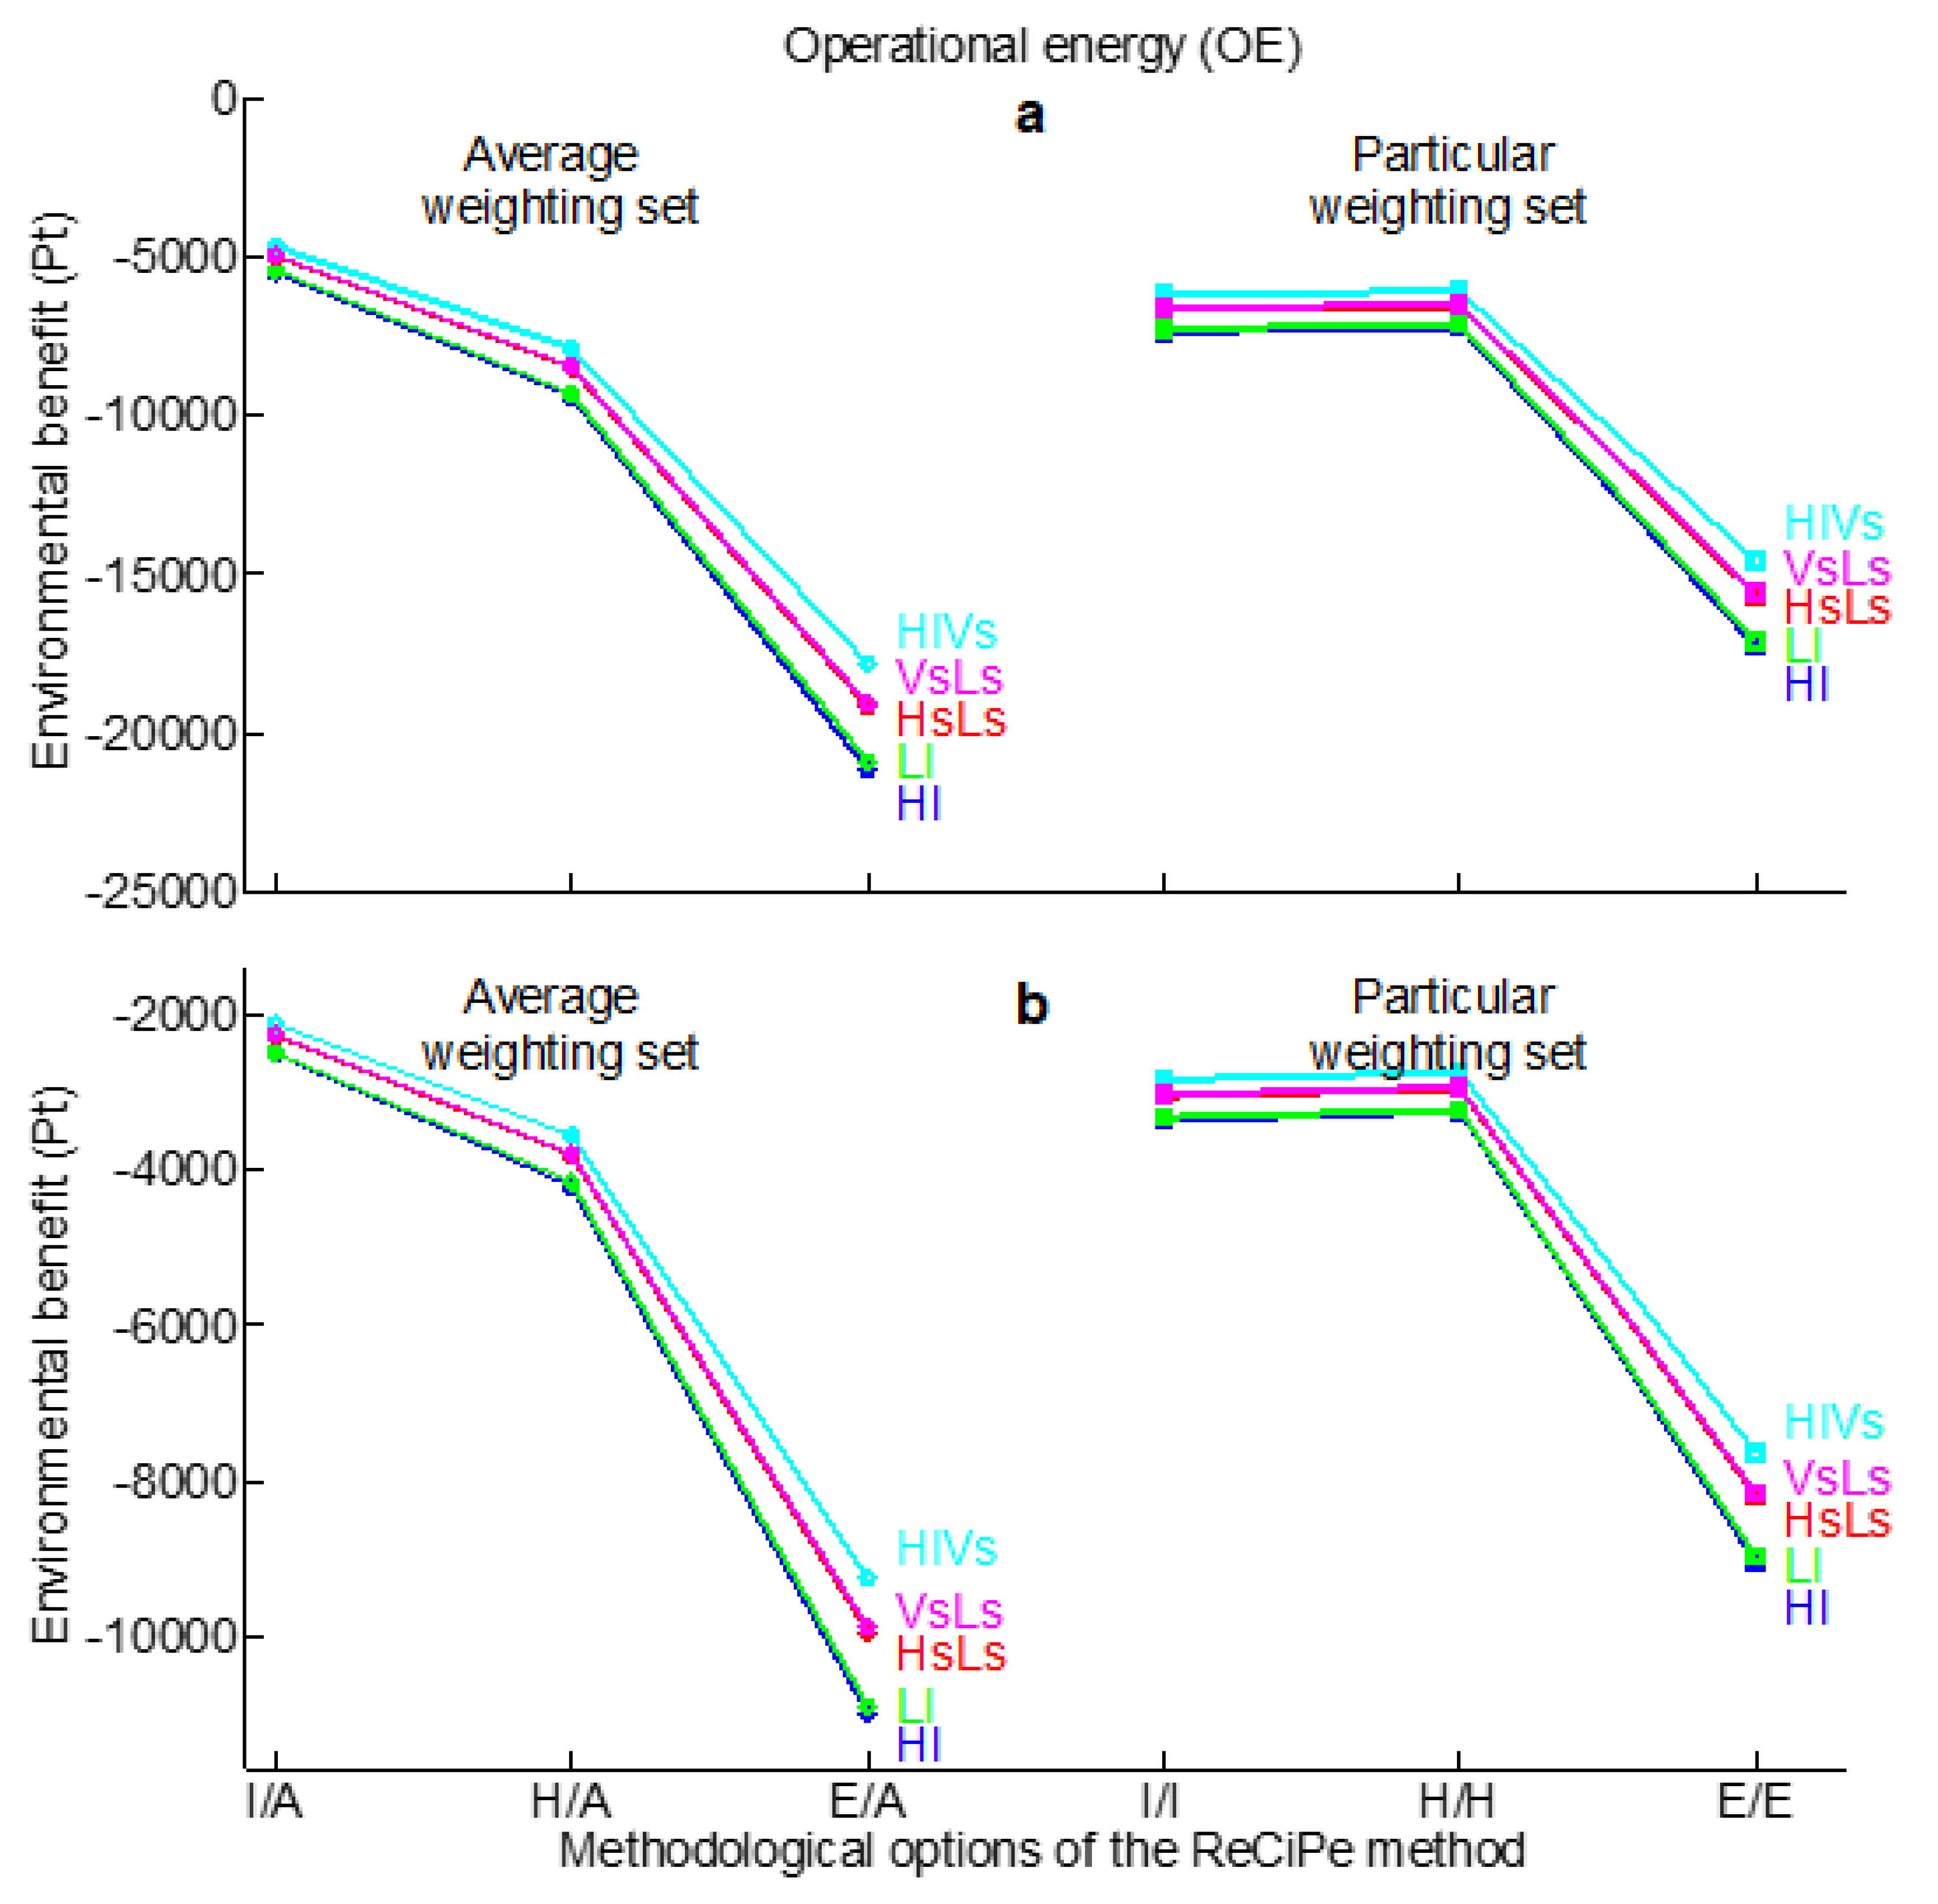
Figure 10 shows the environmental benefit of the shading devices resulting from the OE2020 and OE2025 cases. The ranking of the shading devices, in descending order of environmental benefit, was as follows: Hl, Ll, Hs-Ls, Vs-Ls, and Hl-Vs.
However, according to the statistical results presented in Table 7, there were no differences in the environmental benefits of the evaluated shading devices. This suggests that these five alternatives can be viewed as shading devices that cause the same environmental damage. This is because the Hl, Ll, Hs-Ls, Vs-Ls, and Hl-Vs shading devices were given the two highest SI5282-1 energy ratings (i.e., A or B; see Table 4).
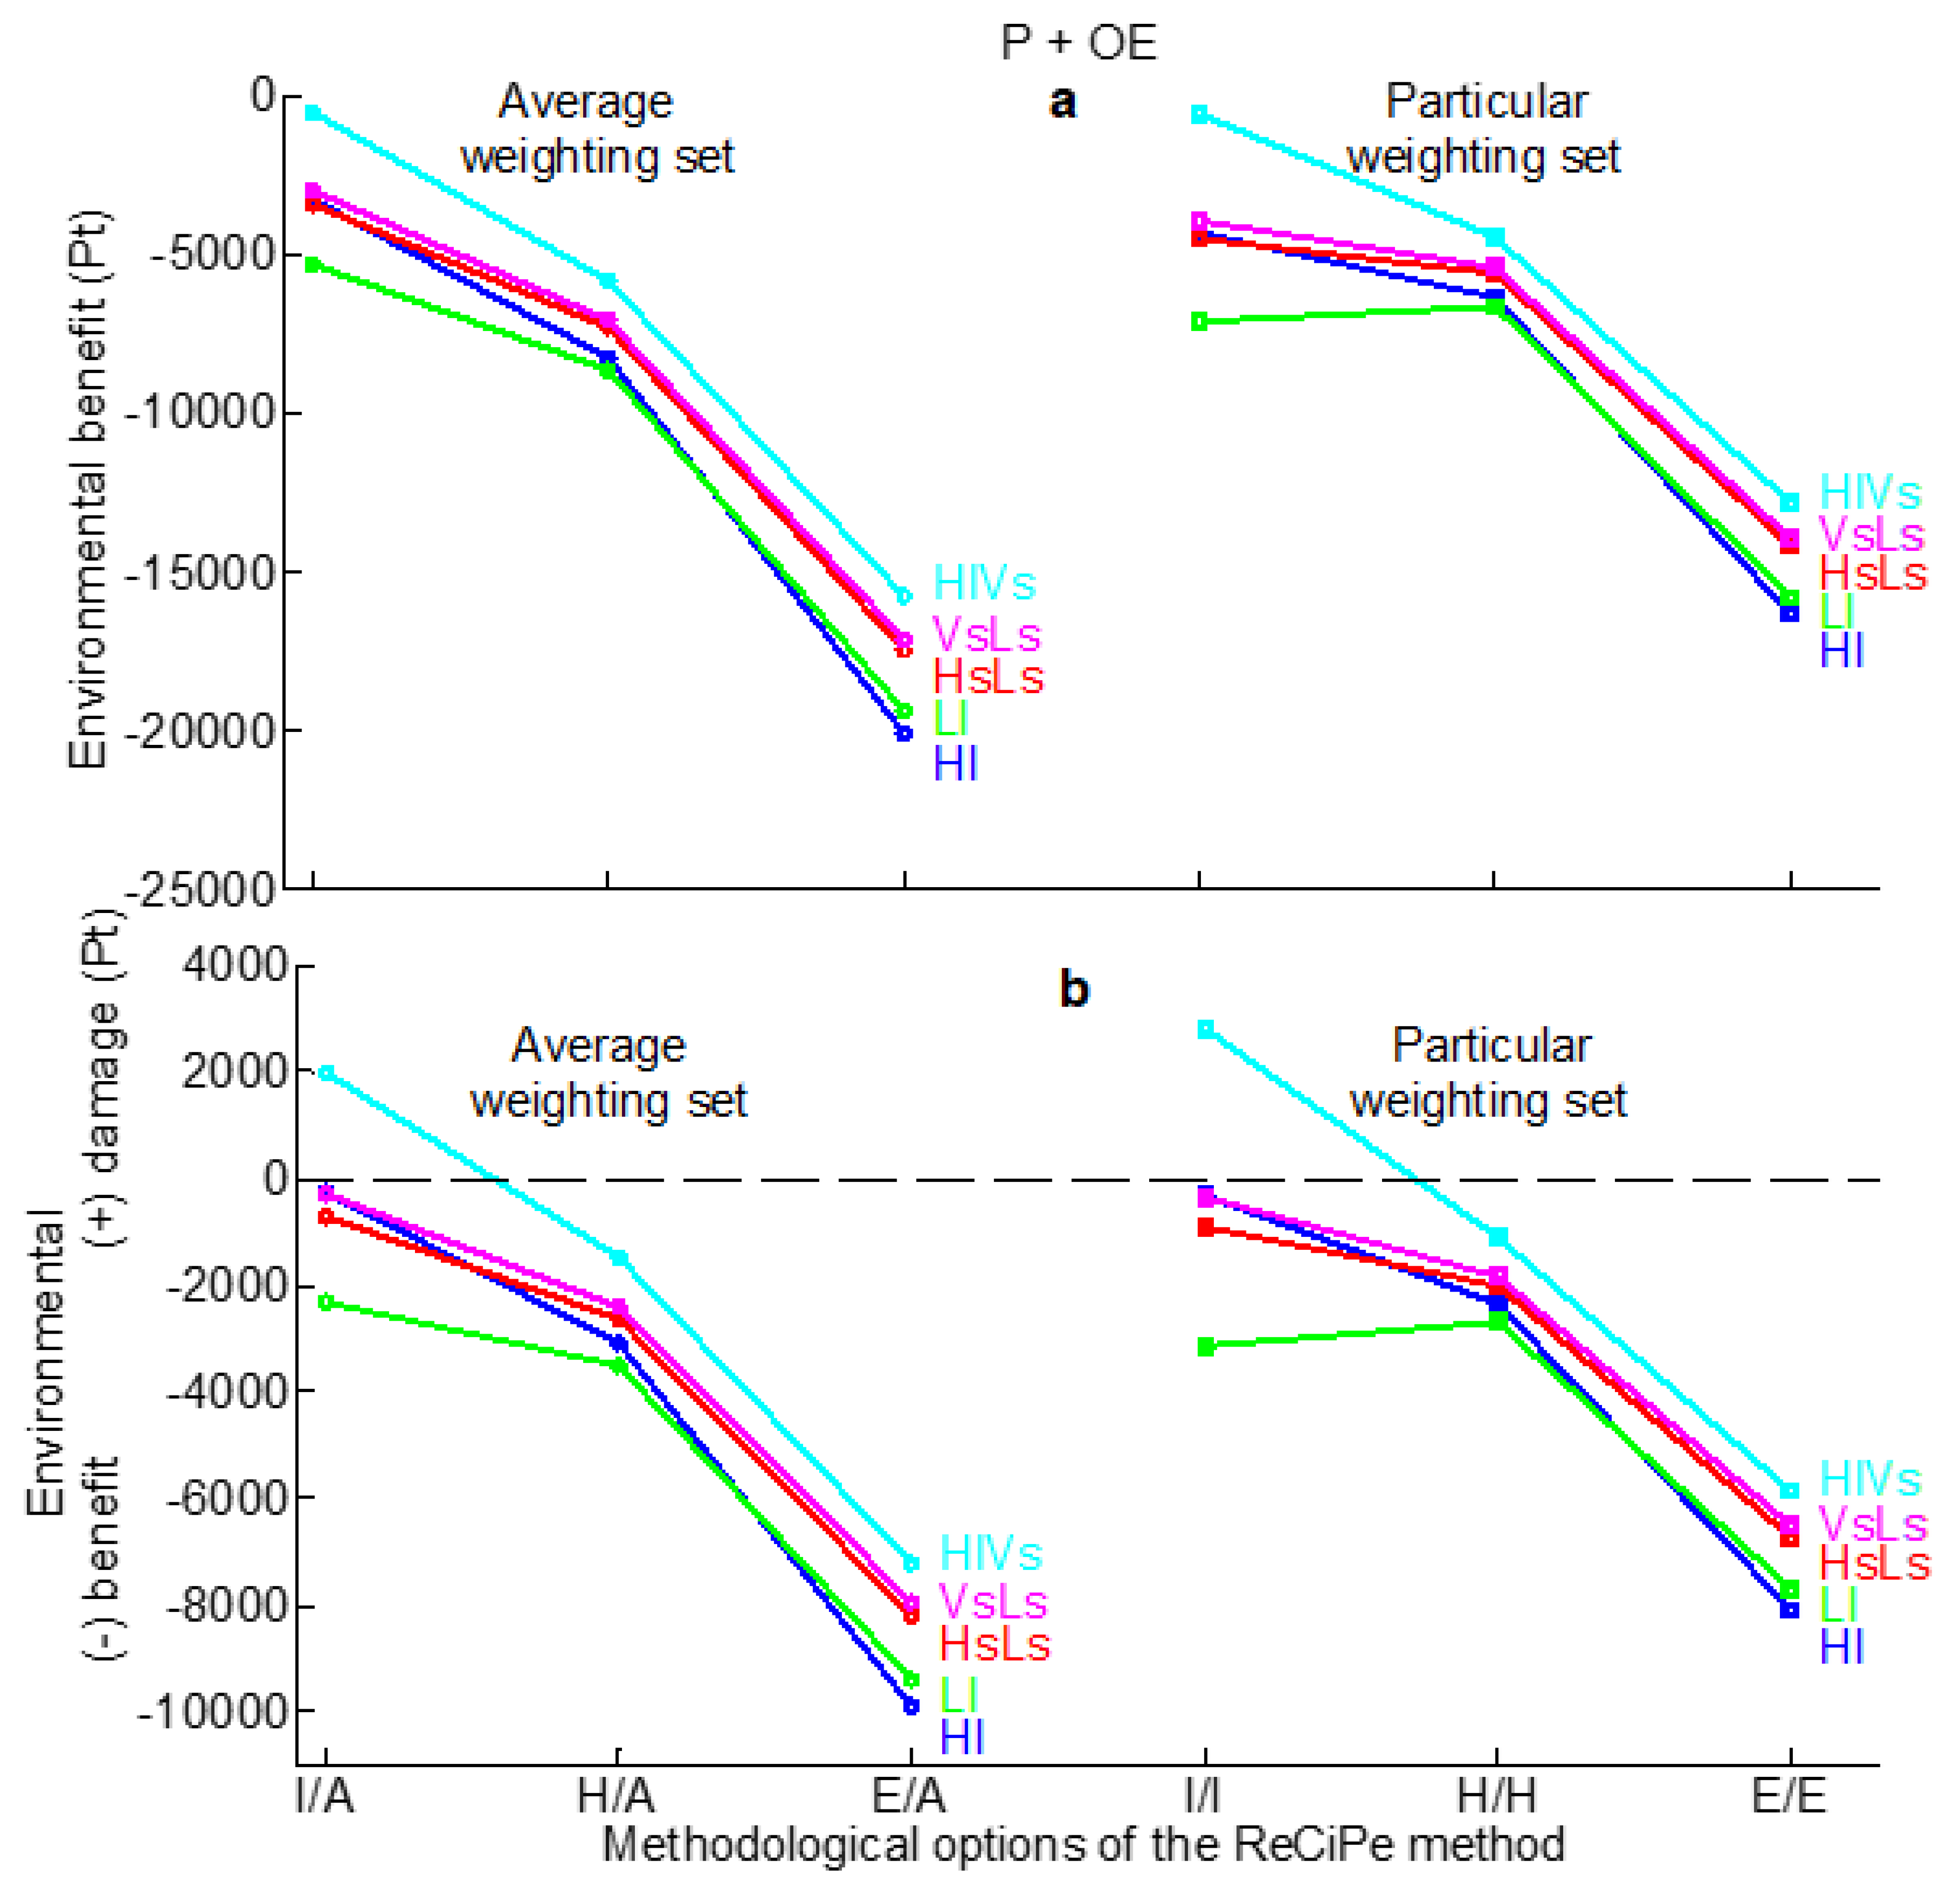
Figure 11 shows that the different methodological options led to different rankings for the environmental benefit of the shading devices. Nonetheless, in both the OE2020 and OE2025 cases, the ranking was as follows: Hl, Ll, Hs-Ls, Vs-Ls, and Hl-Vs.
Taking into consideration the statistical results presented in Table 8, the ranking was reorganized. In the case of OE based on OE2020, the shading devices could be ranked in descending order of environmental benefit as follows: Ll; Hl, Hs-Ls, and Vs-Ls; and Hl-Vs. In this case, according to the P and OE stages, only three of the five shading devices (Hl, Hs-Ls, and Vs-Ls) could be considered as having similar environmental benefits. The two other shading devices (Ll and Hl-Vs) had differing environmental benefits from each other; they also differed from the former three devices that shared the same environmental benefit.
For the case of OE2025, the shading devices can be ranked, in descending order of environmental benefit, as follows: Ll, Hs-Ls, Hl and Vs-Ls, and Hl-Vs. In this case, according to the P and OE stages, only two of the five shading devices (Hl and Vs-Ls) could be considered as having similar environmental benefits. The three other shading devices (Ll, Hs-Ls, and Hl-Vs) had varying environmental benefits, differing from each other and from the devices with similar environmental benefits.
These results contradict the SI5282 energy rate standard, which recommends that all five shading devices be considered as equal alternatives (Table 4). This contradiction is due to the P stage of the shading devices becoming more influential as the OE-related electricity sources shift towards less-polluting alternatives, thereby lessening the influence of the OE stage.
In addition, when comparing the impact of energy sources between 2020 and 2025 on the LCA results of office buildings in Israel, all five external shading devices showed that the OE stage dominated the P stage in absolute terms (Figure 9 and Figure 10). Thus, the results of the LCA verified the environmental benefits of using external shading devices (Figure 11). These results differ from previous studies on the LCA of external shading devices, such as those presented by Huang et al. [19] and Babaizadeh et al. [21], which concluded that the environmental influences were about the same in the OE and P stages. The present results considerably differ from the results presented by Mifsud et al. [22], who concluded that only two shading devices out of twenty-two configurations showed the predominance of the OE stage over the sum of the stages from their production and transportation. The reason for this discrepancy lies in the different external shading devices, different materials, and different climatic zones considered in this study and similar studies by other authors. This verifies the need for this study to be conducted in the Mediterranean climate of Israel, where typical office buildings use concrete or aluminum external shading.
4. Conclusions
This study aimed to evaluate the environmental damage related to the P stage and the environmental benefit of the OE stage for five alternative shading devices recommended by the Israeli Standard SI5282. The five selected shading devices (with A and B energy ratings), composed of different combinations of concrete-based horizontal overhangs and vertical fins and aluminum-based light shelves, were Hl, Ll, Hs-Ls, Hl-Vs, and Vs-Ls. For the OE needs, we considered the electricity sources relevant in 2020, as well as those planned for 2025. The results were evaluated based on a (i) ReCiPe2016 midpoint impact assessment and (ii) ReCiPe2016 endpoint single-score damage assessment. The following results were revealed:
- (i)
- In the ReCiPe2016 midpoint impact assessment, the P stage evaluation indicated that, in terms of global warming potential and terrestrial ecotoxicity, the ranking (in ascending order of environmental damage) of the five shading devices differed from their ranking when considering the ionizing radiation and human non-carcinogenic toxicity. The OE stage evaluation demonstrated that the ranking of the shading devices (in descending order of environmental benefit) had the same tenancy when considering the four aforementioned impacts. The results of the P and OE stage evaluations of the five shading devices showed environmental benefits in terms of global warming potential, terrestrial ecotoxicity, and human non-carcinogenic toxicity impacts and environmental damage in terms of ionizing radiation.
- (ii)
- In the ReCiPe2016 endpoint single-score damage assessment, the P stage evaluation showed that only two shading devices had the same environmental damage (Hl and Hs-Ls), while the other shading devices (Ll, Hl-Vs, and Vs-Ls) significantly differed from each other, as well as from Hl and Hs-Ls. The OE stage evaluation demonstrated that the five shading devices had the same environmental benefit; these results were confirmed for both electricity fuel source scenarios (i.e., OE2020 and OE2025). The P and OE stage evaluations of the five shading devices indicated that, under OE2020, only Hl, Hs-Ls, and Vs-Ls had similar environmental benefits, while under OE2025, only Hl and Vs-Ls had similar environmental benefits. The rest of the shading devices differed significantly from one another as well as from the group with similar benefits.
Thus, we concluded that the alternative shading devices recommended by Israeli Standard SI5282, as well as alternatives with similar energy rates, should be considered with caution, and their relevant P stage environmental assessments should be taken into account for correct P and OE stage evaluations. In particular, we recommend that the SI5282 energy rating be supplemented with P stage data for external shading devices made of concrete- and aluminum-based components. This way, the SI5282 energy rating standard may allow for more sustainable choices for this design variable. This issue becomes more critical when low-pollution electricity sources, such as natural gas and PV, are used to fulfill OE needs. For these assessments, we recommend using the ReCiPe2016 method with a two-stage nested mixed ANOVA analysis, as their conjugation allows for the simultaneous consideration of the six methodological options of ReCiPe2016, thus taking into account different perspectives on environmental issues.
5. Limitations
The current study has a limitation: there was no sensitive analysis of alternative materials that could be used as external shading devices with lower environmental damage aside from concrete or aluminum. In the future, as different and novel materials are implemented on buildings, we intend to evaluate such cases. Based on a recent study by Amiri et al. [40], further investigations should include an LCA featuring the partial or total replacement of concrete in a building with a timber structure.
Author Contributions
Conceptualization, S.P. and A.Y.; formal analysis, S.P. and A.Y.; investigation, S.P. and A.Y.; methodology, S.P. and A.Y.; project administration, S.P. and A.Y.; resources, S.P. and A.Y.; software, S.P. and A.Y.; validation, S.P. and A.Y.; visualization, S.P. and A.Y.; writing— original draft, S.P.; writing—review and editing, S.P. and A.Y. All authors have read and agreed to the published version of the manuscript.
Funding
This research received no external funding.
Data Availability Statement
The data presented in this study are available on request from the corresponding author. The data are not publicly available due to privacy issues.
Conflicts of Interest
The authors declare no conflict of interest.
References
- Bao, Z.; Lu, W.; Chi, B.; Hao, J. Construction waste management performance in green building: Contextualizing LEED in China. Detritus 2020, 12, 125–134. [Google Scholar] [CrossRef]
- Vourdoubas, J. Creation of Zero CO2 Emissions Residential Buildings due to Operating and Embodied Energy Use on the Island of Crete, Greece. Open J. Energy Effic. 2017, 6, 141–154. [Google Scholar] [CrossRef] [Green Version]
- SI1045-10; Thermal Insulation of Buildings: Classification of Settlements According to Climatological Regions. The Standards Institution of Israel: Tel Aviv, Israel, 2002.
- SI1045-3; Thermal Insulation of Buildings: Office Buildings. The Standards Institution of Israel: Tel Aviv, Israel, 2005.
- Friedman, C.; Becker, N.; Erell, E. Energy retrofit of residential building envelopes in Israel: A cost-benefit analysis. Energy 2014, 77, 183–193. [Google Scholar] [CrossRef]
- Israeli Ministry of Energy. Renewable Energy Sources. In Hebrew. Available online: http://energy.gov.il/English/Subjects/RenewableEnergy/Pages/GxmsMniRenewableEnergyAbout.aspx/ (accessed on 11 December 2021).
- SI5282-2; Energy rating of buildings: Office buildings. The Standards Institution of Israel: Tel Aviv, Israel, 2011.
- Pushkar, S.; Verbitsky, O. Environmental damage from wall technologies for residential buildings in Israel. J. Green Build. 2016, 11, 154–162. [Google Scholar] [CrossRef]
- Pushkar, S.; Yezioro, A. Life Cycle Assessment Meeting Energy Standard Performance: An Office Building Case Study. Buildings 2022, 12, 157. [Google Scholar] [CrossRef]
- Faiman, D.; Feuermann, D.; Ibbetson, P.; Zemel, A. Data Processing for the Negev Radiation Survey: Twelfth Year (2005); Research and Development Division, Ministry of National Infrastructures: Tel Aviv, Israel, 2006. [Google Scholar]
- Evola, G.; Gullo, F.; Marletta, L. The role of shading devices to improve thermal and visual comfort in existing glazed buildings. Energy Procedia 2017, 134, 346–355. [Google Scholar] [CrossRef]
- Ghosh, A.; Neogi, S. Effect of fenestration geometrical factors on building energy consumption and performance evaluation of a new external solar shading device in warm and humid climatic condition. Sol. Energy 2018, 169, 94–104. [Google Scholar] [CrossRef]
- Uribe, D.; Bustamante, W.; Vera, S. Potential of perforated exterior louvers to improve the comfort and energy performance of an office space in different climates. Build. Simul. 2018, 11, 695–708. [Google Scholar] [CrossRef]
- Elouadjeri, S.M.; Boussoualim, A.; Haddou, H.A. Evaluating the Effect of External Horizontal Fixed Shading Devices’ Geometry on Internal Air Temperature, Daylighting and Energy Demand in Hot Dry Climate. Case Study of Ghardaïa, Algeria. Buildings 2021, 11, 348. [Google Scholar] [CrossRef]
- Mohammed, A.; Tariq, M.A.U.R.; Ng, A.W.M.; Zaheer, Z.; Sadeq, S.; Mohammed, M.; Mehdizadeh-Rad, H. Reducing the Cooling Loads of Buildings Using Shading Devices: A Case Study in Darwin. Sustainability 2022, 14, 3775. [Google Scholar] [CrossRef]
- Perez, Y.V.; Capeluto, I.G. Climatic considerations in school building design in the hot–humid climate for reducing energy consumption. Appl. Energy 2009, 86, 340–348. [Google Scholar] [CrossRef]
- Grobman, Y.J.; Austern, G.; Hatiel, Y.; Capeluto, I.G. Evaluating the Influence of Varied External Shading Elements on Internal Daylight Illuminances. Buildings 2020, 10, 22. [Google Scholar] [CrossRef] [Green Version]
- Yezioro, A.; Capeluto, I.G. Energy Rating of Buildings to Promote Energy-Conscious Design in Israel. Buildings 2021, 11, 59. [Google Scholar] [CrossRef]
- Huang, Y.; Niu, J.L.; Chung, T.M. Energy and carbon emission payback analysis for energy-efficient retrofitting in buildings—Overhang shading option. Energy Build. 2012, 44, 94–103. [Google Scholar] [CrossRef]
- Stazi, F.; Marinelli, S.; Di Perna, C.; Munafò, P. Comparison on solar shadings: Monitoring of the thermo-physical behaviour, assessment of the energy saving, thermal comfort, natural lighting and environmental impact. Sol. Energy 2014, 105, 512–528. [Google Scholar] [CrossRef]
- Babaizadeh, H.; Haghighi, N.; Asadi, S.; Broun, R.; Riley, D. Life cycle assessment of exterior window shadings in residential buildings in different climate zones. Build. Environ. 2015, 90, 168–177. [Google Scholar] [CrossRef]
- Mifsud, L.; Pomponi, F.; Moncaster, A.M. Comparative life cycle analysis of façade passive systems in the Mediterranean: Comfort, energy, and carbon. Renew. Energy 2020, 149, 347–360. [Google Scholar] [CrossRef]
- Puskar, S. Environmental damage and saving benefit of external shading devices via photovoltaic (PV) energy generation. J. Green Build. 2016, 11, 95–109. [Google Scholar] [CrossRef]
- Capeluto, I.G. The Unsustainable Direction of Green Building Codes: A Critical Look at the Future of Green Architecture. Buildings 2022, 12, 773. [Google Scholar] [CrossRef]
- SI1045-0; Thermal Insulation of Buildings: General. The Standards Institution of Israel: Tel Aviv, Israel, 2019.
- Huijbregts, M.A.J.; Steinmann, Z.J.N.; Elshout, P.M.F.; Stam, G.; Verones, F.; Vieira, M.D.M.; Hollander, A.; Zijp, M.; van Zelm, R. ReCiPe2016: ReCiPe 2016 a Harmonized Life Cycle Impact Assessment Method at Midpoint and Endpoint Level Report I: Characterization. RIVM Report 2016-0104. 2017. Available online: https://www.rivm.nl/bibliotheek/rapporten/2016-0104.pdf (accessed on 3 July 2022).
- U.S. Department of Energy’s (DOE); Building Technologies Office (BTO). EnergyPlus. Available online: https://energyplus.net (accessed on 12 June 2022).
- Pushkar, S.; Becker, R.; Katz, A. A methodology for design of environmentally optimal buildings by variable grouping. Build. Environ. 2005, 40, 1126–1139. [Google Scholar] [CrossRef]
- BS EN ISO 14040:2006+A1:2020. Environmental Management. Life Cycle Assessment. Principles and Framework. Available online: https://www.en-standard.eu/bs-en-iso-14040-2006-a1-2020-environmental-management-life-cycle-assessment-principles-and-framework/ (accessed on 20 August 2022).
- Flower, D.J.M.; Sanjayan, J.G. Green House Gas Emissions due to Concrete Manufacture. Int. J. Life Cycle Assess. 2007, 12, 282–288. [Google Scholar] [CrossRef]
- Israel Electricity Authority. Electricity Status Report. In Hebrew. 2020. Available online: https://www.gov.il/BlobFolder/gen eralpage/dochmeshek/he/Files_Netunei_hashmal_doch_reshut_hasmal_2020_malle_n.xlsx.pdf (accessed on 15 December 2021).
- Pushkar, S.; Halperin, I.; Ribakov, Y. Combining an Intensive Green Roof with Seismic Retrofitting of Typical Reinforced Concrete Buildings in Israel. Materials 2022, 15, 889. [Google Scholar] [CrossRef] [PubMed]
- PRé Consultants. SimaPro, Version 9.1. 0.35; PRé Consultants: Amersfoort, The Netherlands, 2019. [Google Scholar]
- Picquelle, S.J.; Mier, K.L. A practical guide to statistical methods for comparing means from two-stage sampling. Fish. Res. 2011, 107, 1–13. [Google Scholar] [CrossRef]
- Hurlbert, S.H.; Lombardi, C.M. Lopsided reasoning on lopsided tests and multiple comparisons. Aust. N. Z. J. Stat. 2012, 54, 23–42. [Google Scholar] [CrossRef]
- Pushkar, S.; Verbitsky, O. Effects of different allocation approaches for modeling mineral additives in blended cements on environmental damage from five concrete mixtures in Israel. Mater. Struct. 2016, 49, 4401–4415. [Google Scholar] [CrossRef]
- Berge, B. The Ecology of Building Materials, 2nd ed.; Architectural Press: Oxford, UK; Elsevier: Amsterdam, The Netherlands, 2007; ISBN 978-1-85617-537-1. [Google Scholar]
- Liu, R.; Durham, S.A.; Rens, K.L.; Ramaswami, A. Optimization of Cementitious Material Content for Sustainable Concrete Mixtures. J. Mater. Civ. Eng. 2012, 24, 745–753. [Google Scholar] [CrossRef]
- Qadir, S.A.; Al-Motairi, H.; Tahir, F.; Al-Fagih, L. Incentives and strategies for financing the renewable energy transition: A review. Energy Rep. 2021, 7, 3590–3606. [Google Scholar] [CrossRef]
- Amiri, A.; Emami, N.; Ottelin, J.; Sorvari, J.; Marteinsson, B.; Heinonen, J.; Junnila, S. Embodied emissions of buildings—A forgotten factor in green building certificates. Energy Build. 2021, 241, 110962. [Google Scholar] [CrossRef]
Figure 1.
Representative office building in Israel: the building as a whole (left) and the building plan (right).
Figure 1.
Representative office building in Israel: the building as a whole (left) and the building plan (right).
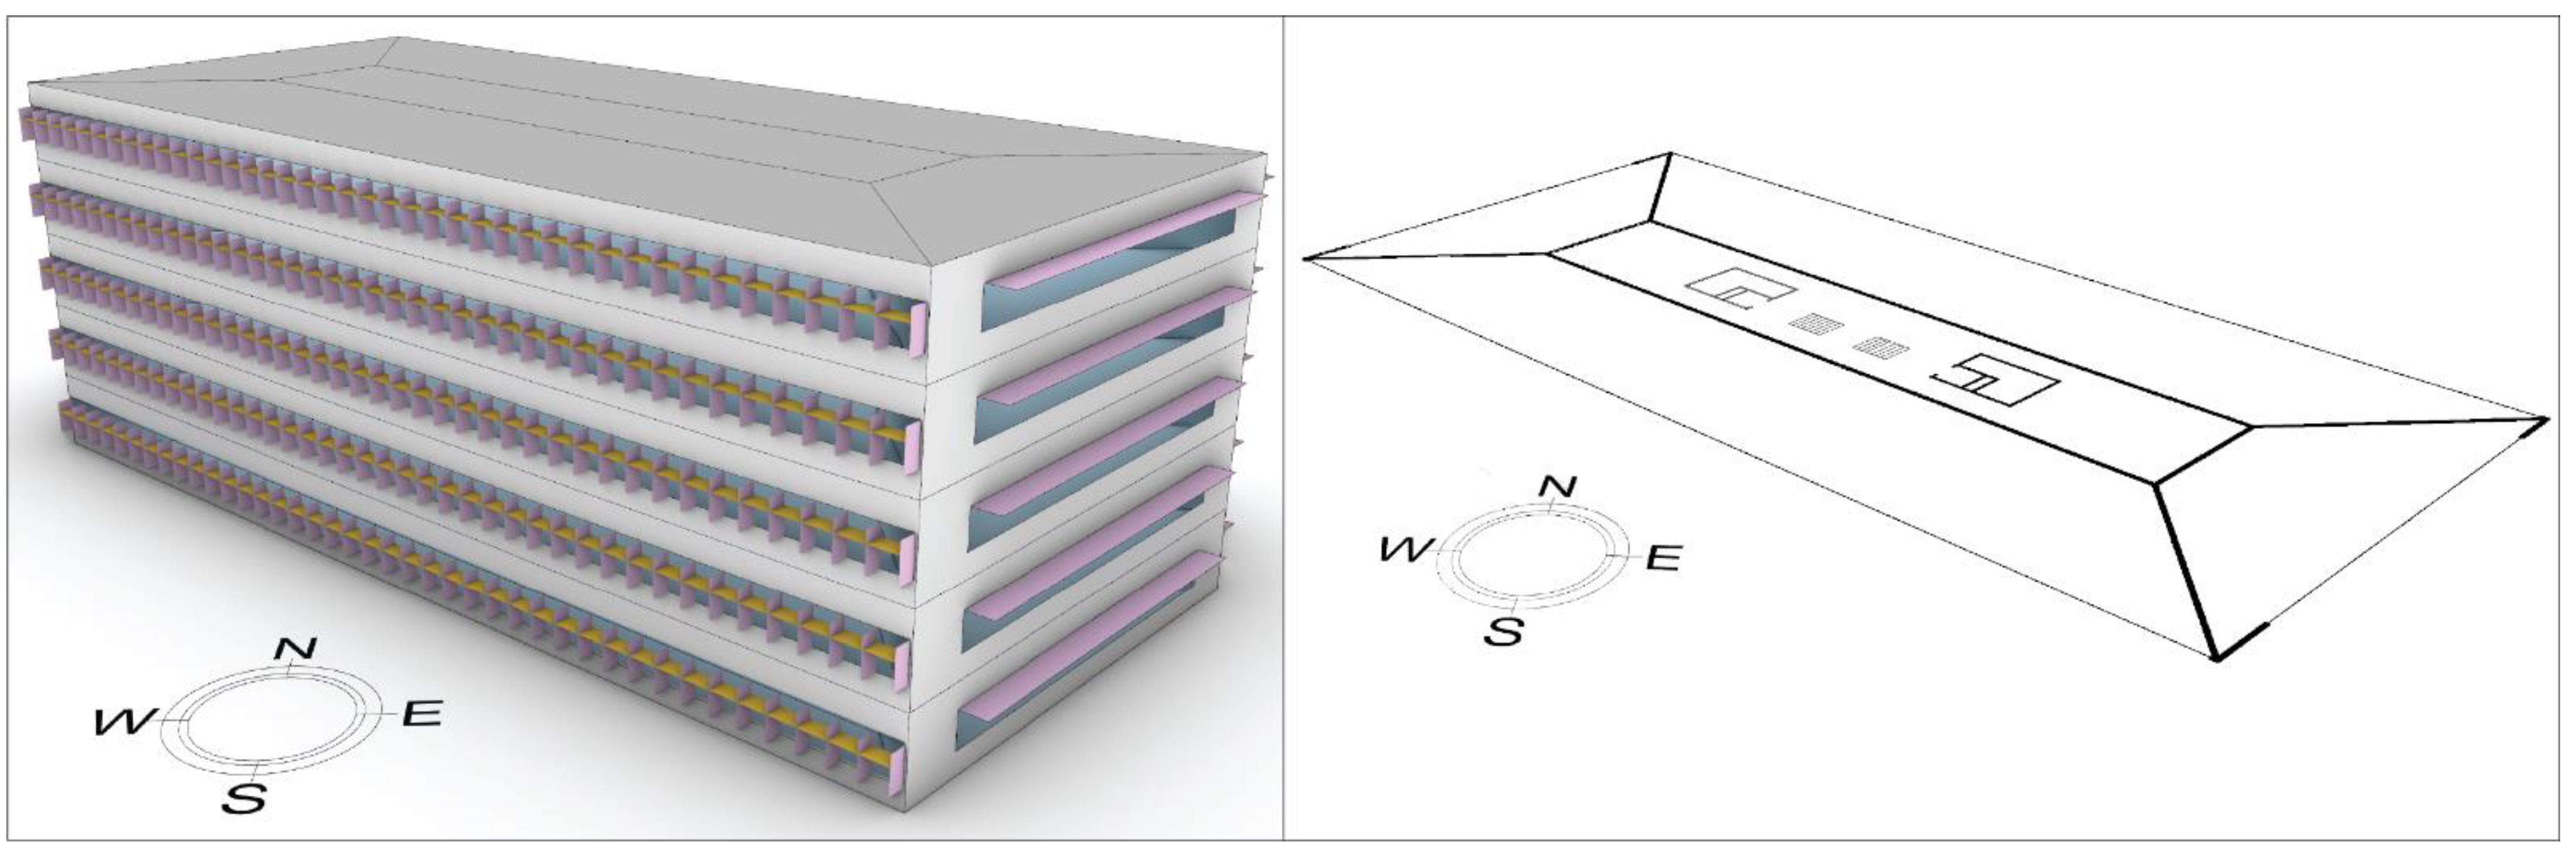
Figure 2.
The base case (without shading) and large horizontal overhang (Hl), large light shelf (Ll), small horizontal overhang with small light shelf (Hs-Ls), large horizontal overhang with small vertical fins (Hl-Vs), and small vertical fins with small light shelf (Vs-Ls) external shading devices.
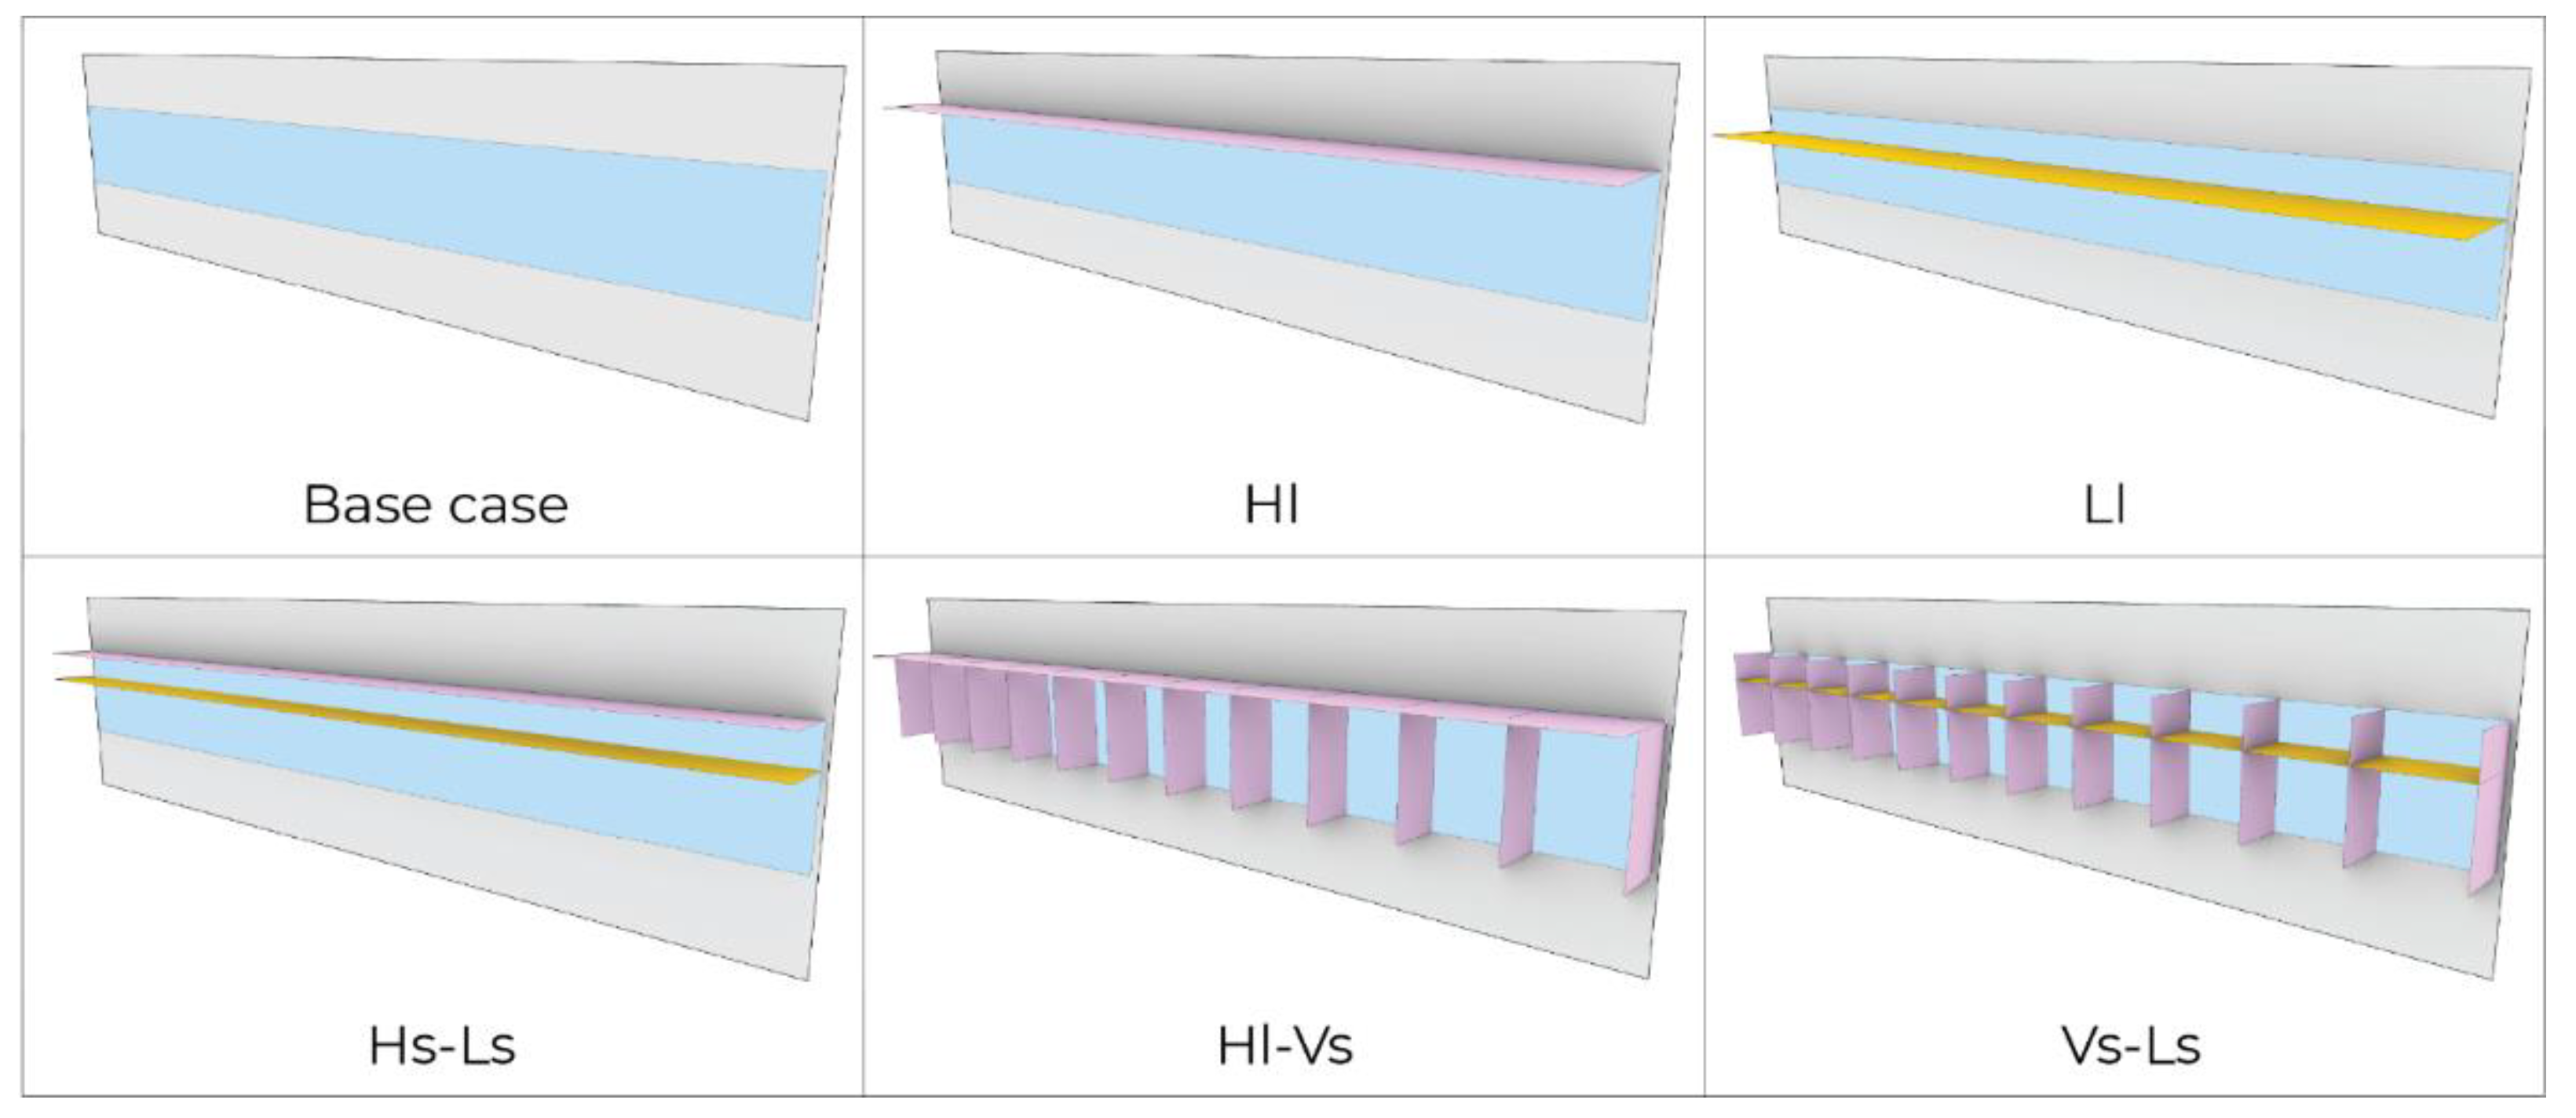
Figure 3.
Two-stage nested hierarchical model with the six methodological options using the ReCiPe2016 results.
Figure 3.
Two-stage nested hierarchical model with the six methodological options using the ReCiPe2016 results.
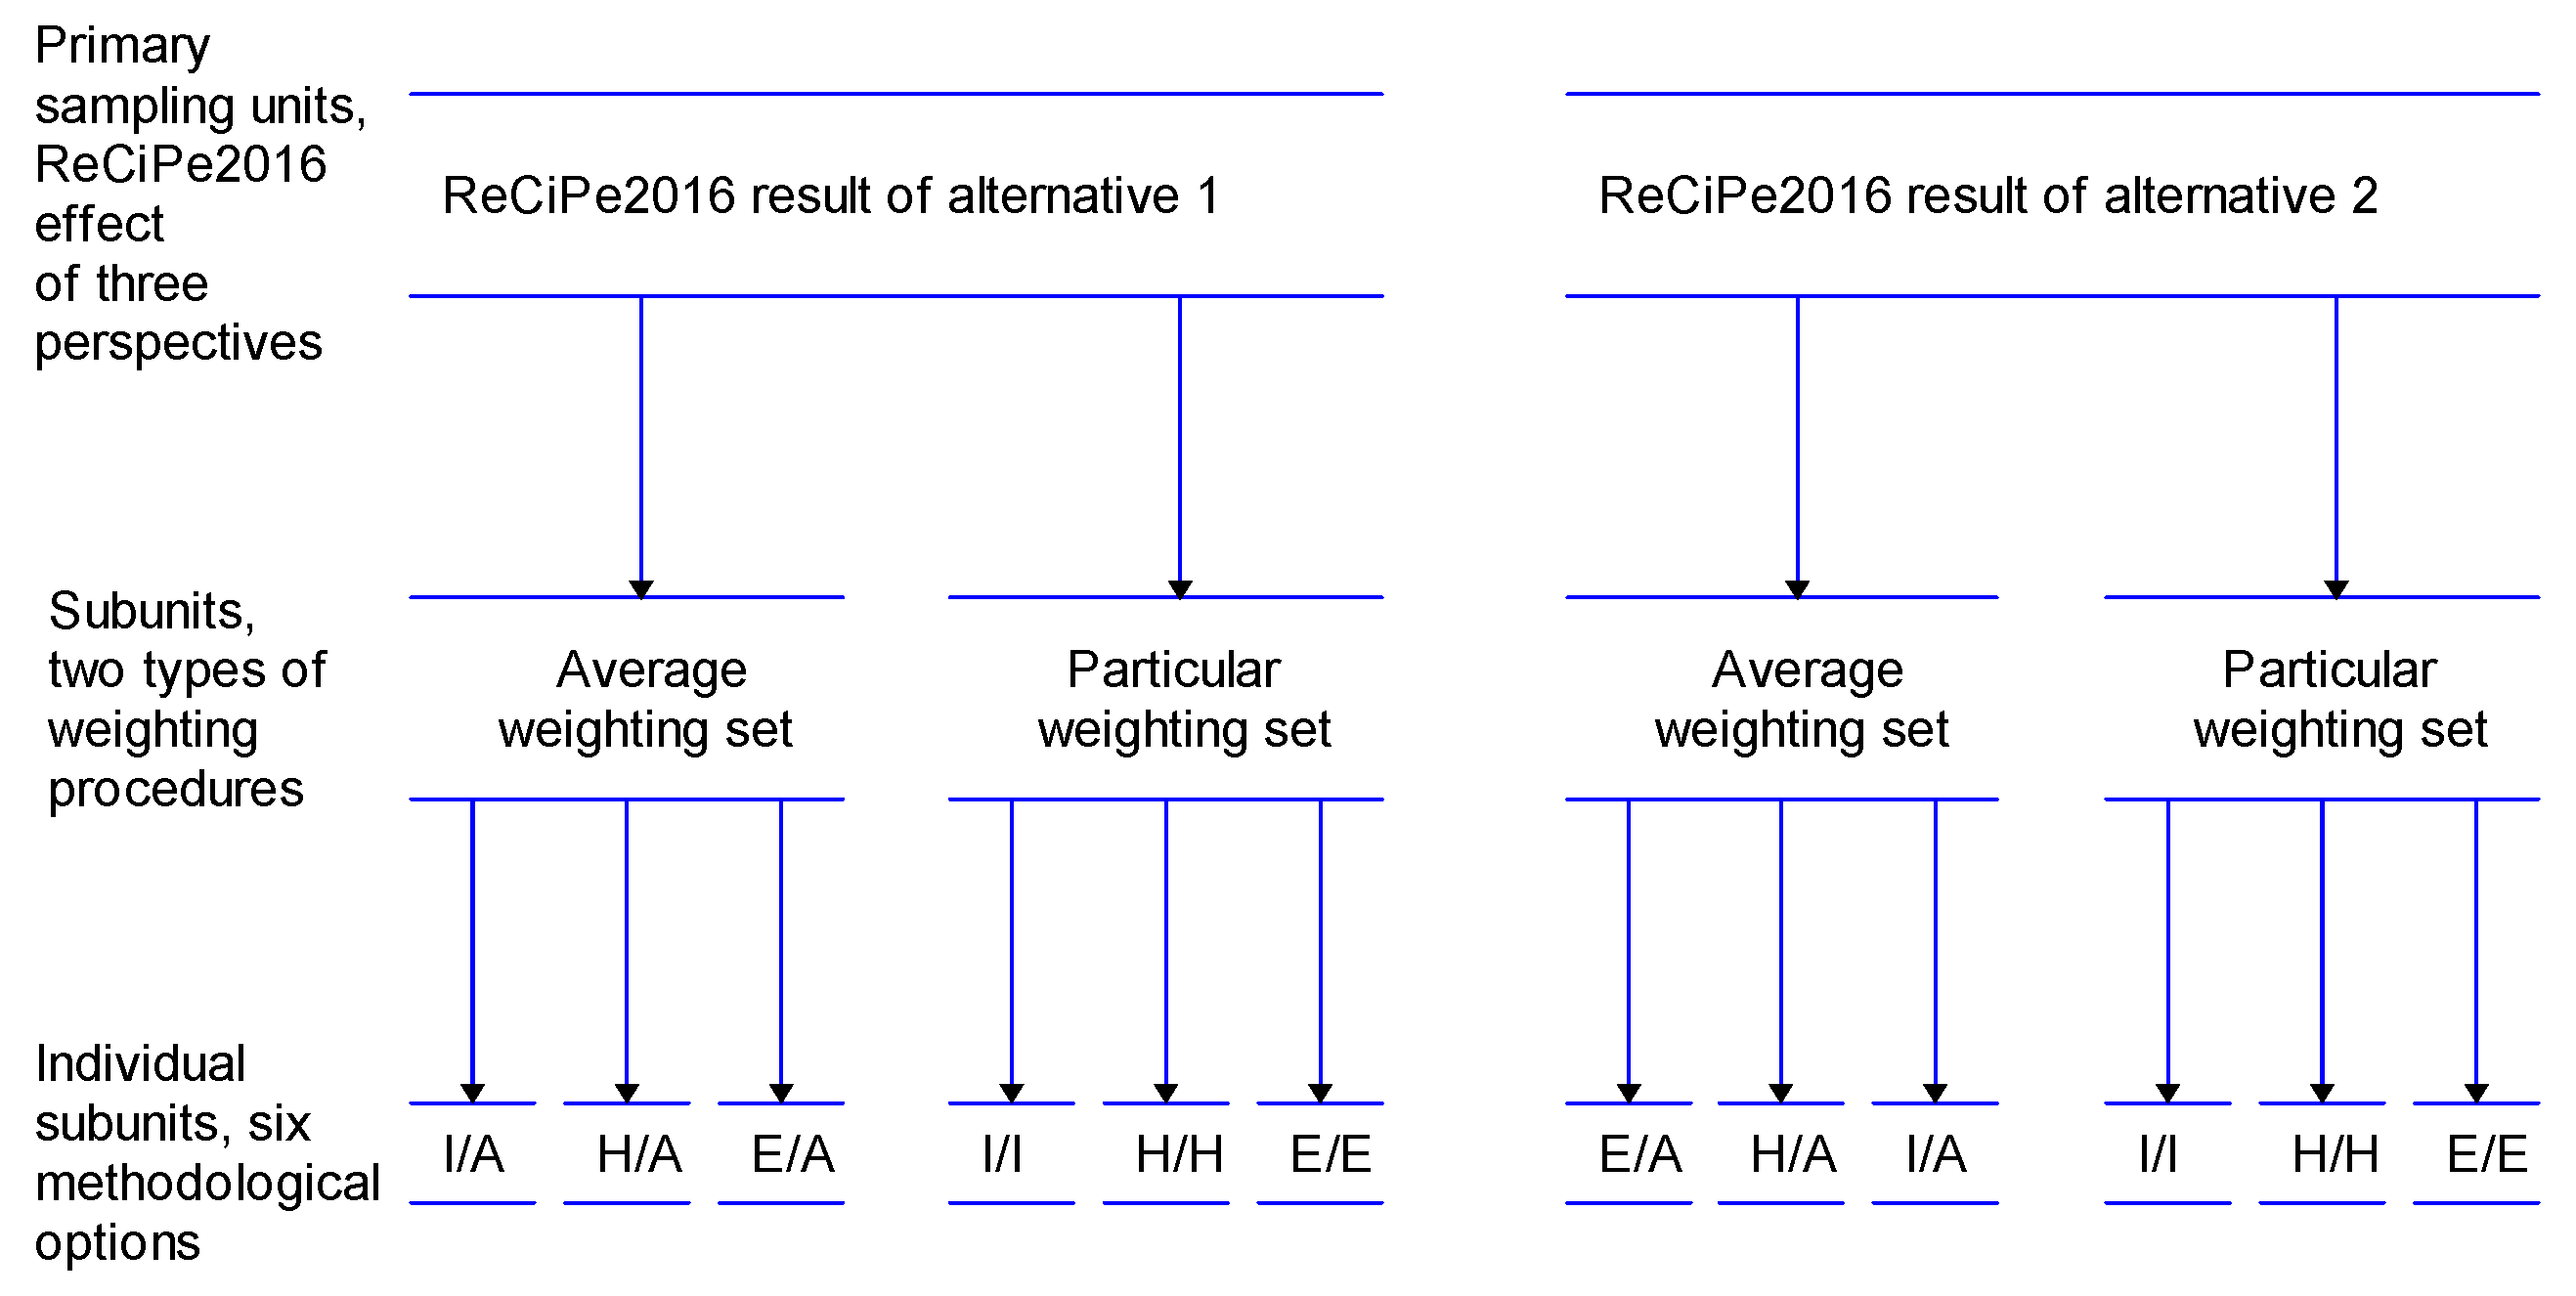
Figure 4.
Environmental impacts resulting from the production and transportation (P stage damage) of the large horizontal overhang (Hl), large light shelf (Ll), small horizontal overhang with small light shelf (Hs-Ls), large horizontal overhang with small vertical fins (Hl-Vs), and small vertical fins with small light shelf (Vs-Ls) external shading devices, evaluated using the ReCiPe2016 midpoint method and hierarchist (H) perspective.

Figure 5.
Environmental impacts resulting from the operational energy (OE stage benefit) of the large horizontal overhang (Hl), large light shelf (Ll), small horizontal overhang with small light shelf (Hs-Ls), large horizontal overhang with small vertical fins (Hl-Vs), and small vertical fins with small light shelf (Vs-Ls) external shading devices, evaluated using the ReCiPe2016 midpoint method and hierarchist (H) perspective (OE2020).

Figure 6.
Environmental impacts resulting from the operational energy (OE stage benefit) of the large horizontal overhang (Hl), large light shelf (Ll), small horizontal overhang with small light shelf (Hs-Ls), large horizontal overhang with small vertical fins (Hl-Vs), and small vertical fins with small light shelf (Vs-Ls) external shading devices, evaluated using the ReCiPe2016 midpoint method and hierarchist (H) perspective (OE 2025).

Figure 7.
Environmental impacts resulting from the production and transportation damage and operational energy benefit (P and OE stages) of the large horizontal overhang (Hl), large light shelf (Ll), small horizontal overhang with small light shelf (Hs-Ls), large horizontal overhang with small vertical fins (Hl-Vs), and small vertical fins with small light shelf (Vs-Ls) external shading devices, evaluated using the ReCiPe2016 midpoint method and hierarchist (H) perspective (OE2020).

Figure 8.
Environmental impacts resulting from the production and transportation damage and operational energy benefit (P and OE stages) of the large horizontal overhang (Hl), large light shelf (Ll), small horizontal overhang with small light shelf (Hs-Ls), large horizontal overhang with small vertical fins (Hl-Vs), and small vertical fins with small light shelf (Vs-Ls) external shading devices, evaluated using the ReCiPe2016 midpoint method and hierarchist (H) perspective (OE2025).
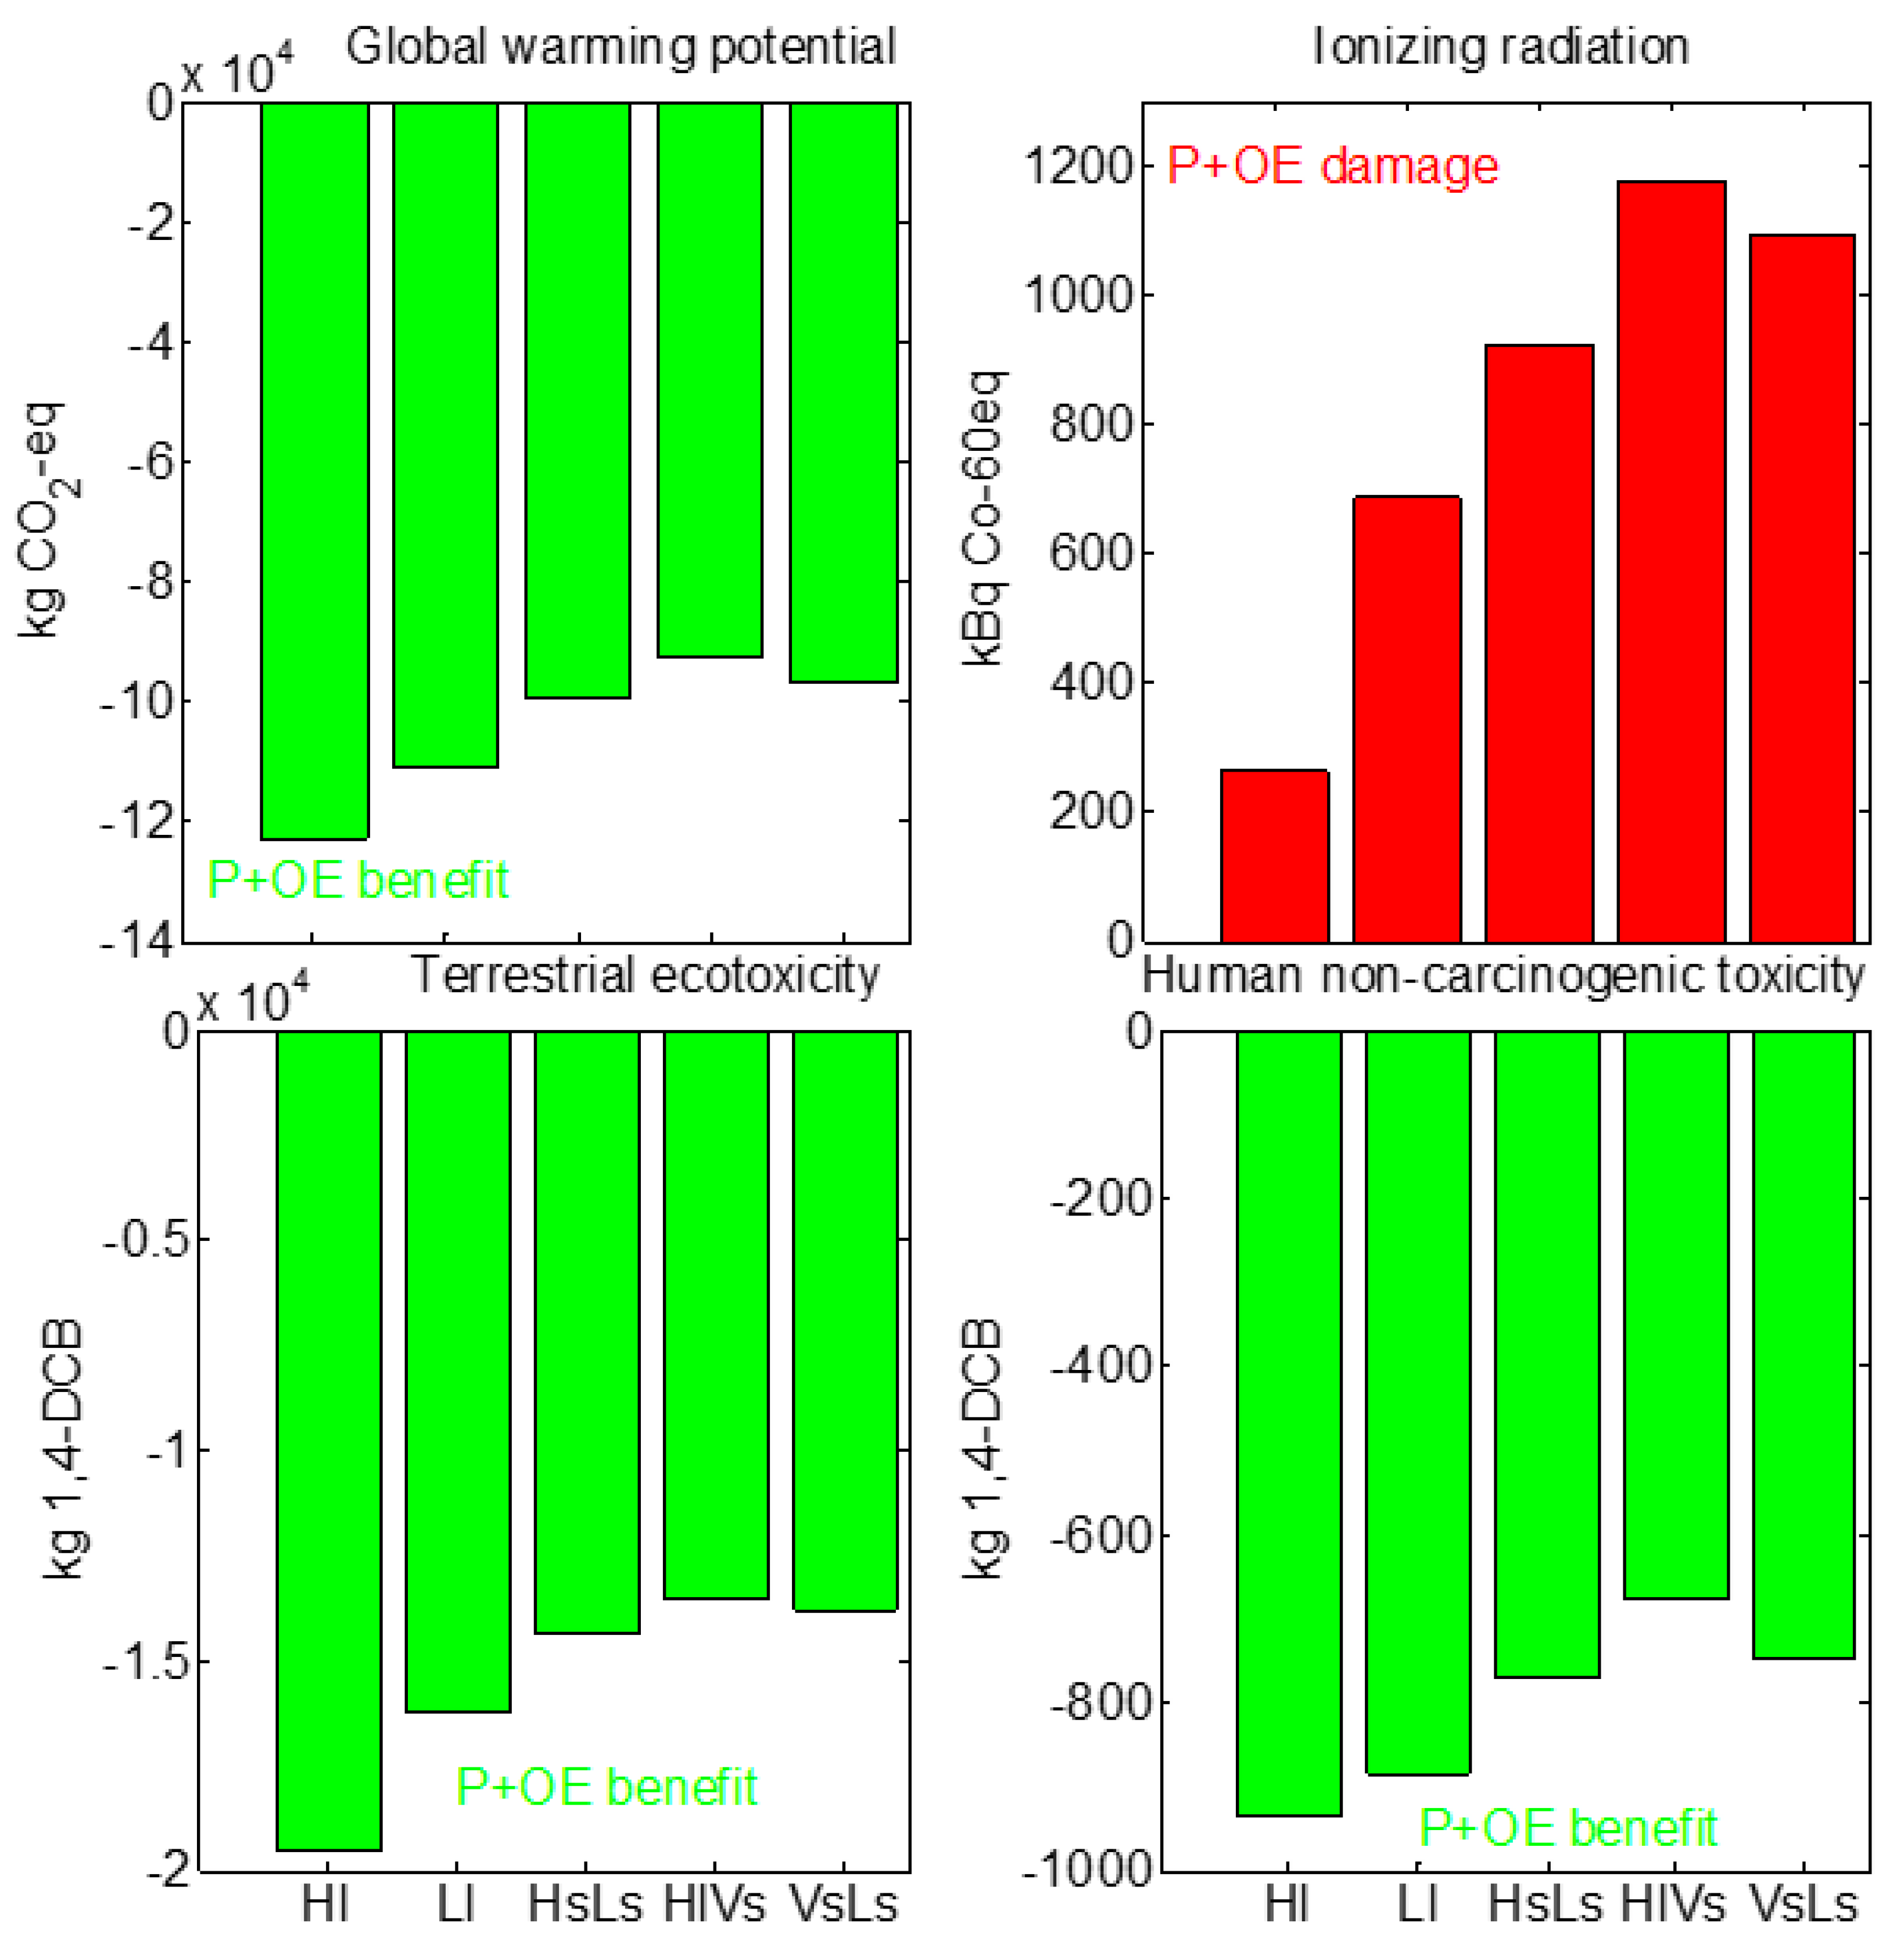
Figure 9.
Environmental damage resulting from the production and transportation (P stage damage) of the large horizontal overhang (Hl), large light shelf (Ll), small horizontal overhang with small light shelf (Hs-Ls), large horizontal overhang with small vertical fins (Hl-Vs), and small vertical fins with small light shelf (Vs-Ls) external shading devices.

Figure 10.
Environmental damage resulting from the operational energy (OE stage benefit) of the large horizontal overhang (Hl), large light shelf (Ll), small horizontal overhang with small light shelf (Hs-Ls), large horizontal overhang with small vertical fins (Hl-Vs), and small vertical fins with small light shelf (Vs-Ls) external shading devices. Analysis performed using the (a) OE2020 and (b) OE2025 cases.

Figure 11.
Environmental damage resulting from the production and transportation damage and operational energy benefit (P and OE stages) of the large horizontal overhang (Hl), large light shelf (Ll), small horizontal overhang with small light shelf (Hs-Ls), large horizontal overhang with small vertical fins (Hl-Vs), and small vertical fins with small light shelf (Vs-Ls) external shading devices. Analysis performed using the (a) OE2020 and (b) OE2025 cases.


Table 1.
Main parameter settings for the OE stage evaluations.
| Parameter | Setting |
|---|---|
| Location | Tel Aviv |
| Main façade orientation | Southwest–northeast (SW–NE) |
| Typical SW office floor | 360 m2 |
| People | 8 people/m2 |
| Constant load | 0.4 W/m2 |
| Non-constant load | 8 W/m2 |
| Lighting | 9 W/m2 |
| Mechanical system | Ideal system heating/cooling load calculation |
| Heating setpoint; cooling setpoint | 20.5 °C; 23.5 °C |
| Infiltration | 1 ach |
Table 2.
Building technologies for the OE stage evaluations.
| Component | Thermal Conductivity (W/m2 K) |
|---|---|
| Concrete-based roof | U = 0.60 |
| Concrete-based ground floor | U = 1.12 |
| Concrete-based internal floor | U = 3.53 |
| Concrete block-based interior walls | U = 2.60 |
| Concrete-based exterior walls | U = 0.54 |
| LowE glass, SHGC = 0.52, VT = 0.6 | U = 2.50 |
Table 3.
LCI data (ecoinvent v3.2 database [33]).
Table 3.
LCI data (ecoinvent v3.2 database [33]).
| Materials/Energy | Data Source |
|---|---|
| P Stage | |
| Cement | Portland calcareous cement, at plant/CH |
| Gravel | Gravel, crushed, at mine/CH |
| Sand | Sand, at mine/CH |
| Water | Tap water, at user/CH |
| Aluminum | Aluminum extrusion profile/RER |
| Transportation | Lorry transport; Euro 0, 1, 2, 3, 4 mix; 22 t total weight; 17.3 t |
| OE Stage | |
| Energy | Hard coal/ES |
| Natural gas/ES | |
| PV/CH |
Table 4.
Operational energy and SI5282-2 energy rate of the southwest-facing offices shaded with external shading devices.
Table 4.
Operational energy and SI5282-2 energy rate of the southwest-facing offices shaded with external shading devices.
| Alternative | Operational Energy, kWh/m2∙Year (SI5282-2 Energy Rate) | ||||
|---|---|---|---|---|---|
| 1st Floor | 2nd Floor | 3rd Floor | 4th Floor | 5th Floor | |
| Base case | 42.5 (F) | 43.1 (F) | 43.1 (F) | 43.1 (F) | 46.9 (F) |
| Hl | 25.2 (B) | 24.0 (A) | 24.0 (A) | 24.0 (A) | 28.3 (A) |
| Ll | 24.9 (B) | 24.2 (A) | 24.2 (A) | 24.2 (A) | 28.1 (A) |
| Hs-Ls | 27.2 (C) | 25.8 (B) | 25.8 (B) | 25.8 (B) | 29.8 (B) |
| Hl-Vs | 28.1 (C) | 27.0 (B) | 27.0 (B) | 27.0 (B) | 31.5 (C) |
| Vs-Ls | 26.0 (B) | 25.9 (B) | 25.9 (B) | 26.1 (B) | 29.7 (B) |
Italic font: Typical intermediate floor (floor 3) selected for the further P and OE stage evaluations according to the LCA.
Table 5.
Materials and transportation (P stage) and energy (OE stage) of the southwest-facing offices shaded with external shading devices (typical floor).
Table 5.
Materials and transportation (P stage) and energy (OE stage) of the southwest-facing offices shaded with external shading devices (typical floor).
| Materials/Energy | External Shading Devices | ||||
|---|---|---|---|---|---|
| Hl | Ll | Hs-Ls | Hl-Vs | Vs-Ls | |
| Production Stage | |||||
| Cement (kg) | 11,320 | – | 7535 | 20,857 | 9537 |
| Gravel (kg) | 36,325 | – | 24,178 | 66,926 | 30,602 |
| Sand (kg) | 19,220 | – | 12,793 | 35,411 | 16,192 |
| Water (kg) | 6220 | – | 4140 | 11,460 | 61,570 |
| Aluminum (kg) | – | 8392 | 5594 | – | 5594 |
| Transportation (tkm) | 10,742 | 1678 | 8270 | 19,792 | 10,168 |
| Operational Energy Stage | |||||
| Energy (kWh/360 m2∙50 year) | −343,800 | −340,200 | −311,400 | −289,800 | −309,600 |
Table 6.
-values: paired differences between the production stage of the large horizontal overhang (Hl), large light shelf (Ll), small horizontal overhang with small light shelf (Hs-Ls), large horizontal overhang with small vertical fins (Hl-Vs), and small vertical fins with small light shelf (Vs-Ls) external shading devices.
| External Shading Devices | External Shading Devices | ||||
|---|---|---|---|---|---|
| Hl | Ll | Hs-Ls | Hl-Vs | Vs-Ls | |
| Hl | X | 0.0013 | 0.1473 | 0.0007 | 0.0082 |
| Ll | X | 0.0012 | 0.0005 | 0.0009 | |
| Hs-Ls | X | 0.0011 | 0.0164 | ||
| Hl-Vs | X | 0.0021 | |||
| Vs-Ls | X | ||||
Note: Bold font: seems to be positive; regular font: seems to be negative.
Table 7.
-values: paired differences between the operational energy stage of the large horizontal overhang (Hl), large light shelf (Ll), small horizontal overhang with small light shelf (Hs-Ls), large horizontal overhang with small vertical fins (Hl-Vs), and small vertical fins with small light shelf (Vs-Ls) external shading devices.
| External Shading Devices | External Shading Devices | ||||
|---|---|---|---|---|---|
| OE2020 | Hl | Ll | Hs-Ls | Hl-Vs | Vs-Ls |
| Hl | X | 0.8023 | 0.1359 | 0.0515 | 0.1240 |
| Ll | X | 0.1636 | 0.0579 | 0.1482 | |
| Hs-Ls | X | 0.2157 | 0.9017 | ||
| Hl-Vs | X | 0.2412 | |||
| Vs-Ls | X | ||||
| OE2025 | Hl | Ll | Hs-Ls | Hl-Vs | Vs-Ls |
| Hl | X | 0.8002 | 0.1172 | 0.0446 | 0.1048 |
| Ll | X | 0.1400 | 0.0498 | 0.1240 | |
| Hs-Ls | X | 0.1916 | 0.8742 | ||
| Hl-Vs | X | 0.2191 | |||
| Vs-Ls | X | ||||
Note: Regular font: seems to be negative; italic font: judgment is suspended.
Table 8.
Production and transportation damage and operational energy benefit (P and OE stages): -values of paired differences between large horizontal overhang (Hl), large light shelf (Ll), small horizontal overhang with small light shelf (Hs-Ls), large horizontal overhang with small vertical fins (Hl-Vs), and small vertical fins with small light shelf (Vs-Ls) external shading devices.
| External Shading Devices | External Shading Devices | ||||
|---|---|---|---|---|---|
| P + OE2020 | Hl | Ll | Hs-Ls | Hl-Vs | Vs-Ls |
| Hl | X | 0.0808 | 0.2526 | 0.0086 | 0.1006 |
| Ll | X | 0.0303 | 0.0057 | 0.0202 | |
| Hs-Ls | X | 0.0102 | 0.3051 | ||
| Hl-Vs | X | 0.0122 | |||
| Vs-Ls | X | ||||
| P + OE2025 | Hl | Ll | Hs-Ls | Hl-Vs | Vs-Ls |
| Hl | X | 0.0061 | 0.0965 | 0.0108 | 0.2315 |
| Ll | X | 0.0063 | 0.0328 | 0.0041 | |
| Hs-Ls | X | 0.0148 | 0.0306 | ||
| Hl-Vs | X | 0.0066 | |||
| Vs-Ls | X | ||||
Note: Bold font: seems to be positive; regular font: seems to be negative.
Publisher’s Note: MDPI stays neutral with regard to jurisdictional claims in published maps and institutional affiliations. |
© 2022 by the authors. Licensee MDPI, Basel, Switzerland. This article is an open access article distributed under the terms and conditions of the Creative Commons Attribution (CC BY) license (https://creativecommons.org/licenses/by/4.0/).
Share and Cite
MDPI and ACS Style
Pushkar, S.; Yezioro, A. External Shading Devices: Should the Energy Standard Be Supplemented with a Production Stage? Sustainability 2022, 14, 12690. https://doi.org/10.3390/su141912690
AMA Style
Pushkar S, Yezioro A. External Shading Devices: Should the Energy Standard Be Supplemented with a Production Stage? Sustainability. 2022; 14(19):12690. https://doi.org/10.3390/su141912690
Chicago/Turabian StylePushkar, Svetlana, and Abraham Yezioro. 2022. "External Shading Devices: Should the Energy Standard Be Supplemented with a Production Stage?" Sustainability 14, no. 19: 12690. https://doi.org/10.3390/su141912690
Note that from the first issue of 2016, this journal uses article numbers instead of page numbers. See further details here.