Article

Assessment of Spray Drift with Various Adjuvants in a Wind Tunnel

1
Department of Agricultural Machinery and Technologies Engineering, Faculty of Agriculture, Cukurova University, Adana 01330, Turkey
2
Department of Field Crops, Faculty of Agriculture, Adıyaman 02040, Turkey
3
Çölemerik Vocational School, Department of Plant and Animal Production, Plant Protection Program, Hakkari University, Hakkari 30000, Turkey
4
Vocational School of Ceyhan, Department of Agricultural Machinery, Cukurova University, Adana 01950, Turkey
*
Author to whom correspondence should be addressed.
Agronomy 2022, 12(10), 2377; https://doi.org/10.3390/agronomy12102377
Submission received: 22 August 2022 / Revised: 20 September 2022 / Accepted: 23 September 2022 / Published: 1 October 2022
(This article belongs to the Special Issue Research on Field Spray Drift and Pesticide Application Technology)

Abstract

:
When pesticides are sprayed, a significant portion of the droplets drifts away from the target. Using an adjuvant in spray liquid is an easy option for reducing droplet drift because there is no need to make any changes to the sprayer. The objective of the study was to determine the effects of seven commercially available adjuvants (Surfeco plus, Starguar, Kantor, Sterling, Control, Control WM, and Control DUO) with varying active ingredients on droplet size, surface tension, and viscosity. Since these properties affect droplet formation, these adjuvants were evaluated in terms of their drift-reducing performance in a wind tunnel at various wind speeds (2.0, 3.5, and 5.0 m/s) and spray pressures (3, 4, and 5 bars). The ground and airborne components of drift were evaluated. With the use of a patternator, the potential for the ground drift of adjuvants was measured; for airborne drift, polyethylene lines that were stretched along the cross-section area of the wind tunnel at various heights were employed. The number of deposits of a tracer dye–adjuvant mixture that was sprayed on the polyethylene lines was measured via fluorometric methods for determining the airborne drift potential. The test results showed that the adjuvant Control Duo containing a polymer blend, which had the highest dynamic viscosity (4.27 mPa.s), increased the Dv0.5 droplet diameter up to 192 μm at 3 bar with nozzle XR11002. This adjuvant reduced the ground drift potential (Dc) by 60.53% compared to tap water. The maximum airborne drift potential reduction percentage (DPRP) was obtained as 85.76% with Surfeco plus containing organic silicone at a pressure of 3 bar and a wind velocity of 5 m/s. When considering the airborne drift-reduction potential of the adjuvants used, it was found that the adjuvants Control WM, Control, Starguar, and Surfeco plus significantly reduced the airborne droplet drift compared to spraying tap water.

1. Introduction

The use of pesticides is an integral part of modern agriculture and contributes to the productivity and quality of cultivated crops. It has been estimated that the use of agrochemicals prevents a loss of up to 45% of the world crop production [1]. It is critical to apply agricultural pesticides efficiently and without drift (off-target pesticide depositions), which is the movement of sprayed chemicals to untargeted areas caused by wind. Drift-prone droplets may settle out of the nominal spray pattern of a nozzle in the field or be carried away by the wind to an out-of-field location not targeted for droplet evaporation. As a result, pesticide drift has the potential to cause direct harm to people, sensitive flora, wildlife, and water resources, resulting in inefficient pest control [2,3,4,5]. With inadequate pesticide application due to drift problems, the pesticide penetrates the target plant insufficiently, resulting in yield loss because the plant is not protected from pests; on the other hand, excessive pesticide deposition on the plants can result in phytotoxicity.
The primary factors influencing drift are a pesticide’s physical and chemical properties, the spray equipment and application method used, the droplet size, and meteorological conditions. The smaller a spray droplet is, the longer it stays in the air and the more likely it will be carried away by a crosswind [6]
There are numerous methods for reducing pesticide drift. The known methods are to replace the spray nozzles with low-drift-potential air-induction nozzles [7,8], to carry the droplets to the target with an auxiliary airflow [9,10,11], to direct the droplets to the target by charging them electrostatically [12,13], and to use the shield on the boom [14,15,16]. In addition to these techniques, farmers favor pesticides with various formulae for insect control. Some of these are additives while others have direct disease and pest control as their goal.
The droplet size is a very important parameter in the airborne drift phenomenon. The most serious drift hazard is usually caused by droplets less than 150 μm in diameter [17]. Some physical properties of liquid such as viscosity and surface tension of the spray affect the size of the droplets formed by the spray nozzles. Larger droplets are usually produced by spraying fluids with a high viscosity and surface tension [18]. The amount of pesticide on the targets can remain within acceptable limits by using appropriate equipment and spraying techniques under suitable weather conditions by optimizing parameters such as the sprayed liquid viscosity and surface tension, evaporation level with drift-reducing additives, and increased operator experience.
Today, most plant protection products (PPPs) are produced to reduce pesticide drift and pest control. In general, the adjuvant producers state that as the viscosity of their products increases in comparison to water, the droplet size of their products also increases, resulting in a decrease in the drift potential [19]. It is also important in terms of parameters such as the adhesion of adjuvants with different formulations used in pesticide application after spraying on the target surface, their spread on these surfaces, and the provision of evenness of distribution.
There are various commercial additives on the market with different formulas that are recommended for use with herbicides. The chemicals that are produced as anti-drift properties are mostly organophosphorus, polymer-added, or oil-based compounds. It is important to recognize and compare the field and laboratory experiments conducted using these newly designed chemicals. Many studies have been carried out to assess glyphosate drift and to compare it with the drift of other chemicals [20,21,22]. Nevertheless, the number of recently produced PPPs and additive chemicals increases day by day on the market. The potential of a formulated product in reducing spray drift can be identified by measuring the spray’s droplet size spectra at relevant concentrations. Choosing the proper adjuvant can be one of the main practices adopted to reduce the negative effects of spray drift as well as to improve safety and efficacy in pesticide applications [23]. Despite the fact that drift-minimizing adjuvants enhance a spray’s liquid viscosity and droplet size, it is unknown to what extent these additions minimize direct wind drift when compared to other ingredients of PPP chemicals. In addition, the active ingredients in adjuvants and the nozzle–adjuvant relationship are also important essential parameters in droplet formation. According to [24], the adjuvant Dicamba®–XR nozzle modification performed best when compared to TT and AIXR nozzles, showing a drift reduction of around 70%.
Droplet spectra, the active ingredient, and airborne drift evaluations of several adjuvants on the PPP market have mostly been studied; however, ground drift, airborne drift, and the active ingredient in adjuvant interactions have not been investigated well. The authors of [25] preferred and used spray pattern displacement (SPD) as a ground drift indicator. The researchers in [26] used collector polyethylene lines and evaluated them to detect airborne drift, realizing a reduction of 91%. The quantitative analysis method, fluorescent dye, and fluorometric method were used to determine the amount of pesticide reaching the ground as well as the number of droplets carried by the wind in the measurements.
In this study, the ground and airborne drift-reduction potential of seven adjuvants with different ingredients were investigated in a wind tunnel using an XR11002 nozzle. The effects of adjuvants on droplet size, spray viscosity, and surface tension were examined in terms of reducing both drift components.

2. Materials and Methods

2.1. Adjuvants

Adjuvants with different properties and chemical contents and that are well known on the market were considered in the study. A total of seven adjuvants were selected. The trade names, ingredients, and concentrations recommended by the manufacturers of the selected adjuvants are given in Table 1. In the experiments, each spray mixture was prepared according to the recommended concentration and then the viscosity, surface tension, and droplet sizes were measured. The wind tunnel experiments were also carried out according to the recommended concentrations of the selected adjuvants. All of the adjuvants had different active ingredients. In addition, as explained in the catalogs of their respective manufacturers, the adjuvants Surfeco plus and Control Duo had surfactant properties.
The surface tension and viscosity of each adjuvant were measured to determine the effect of the adjuvant mixtures on the droplet size. A drop shape analyzer (KRUSS) was used to measure the dynamic surface tension of the adjuvant mixtures on a polyethylene surface (PCE RVI2). A digital rotational viscosimeter was used for the viscosity measurements.
Droplet diameter measurements were also required to determine how large a droplet was generated by different adjuvant mixtures from a reference nozzle. A laser droplet analyzer (Malvern STP5399, Malvern, UK) was used to measure the diameter of the droplets. The recommended concentrations of each adjuvant were sprayed for 60 s. The droplet size spectra characteristics (including Dv0.1, Dv0.5, and Dv0.9) and the percentages of drift-prone droplets with diameters smaller than 55 μm, 100 μm, and 158 μm were measured. An XR11002 nozzle was used to evaluate each adjuvant at spray pressures of 3, 4, and 5 bars. The results were compared to measurements of tap water droplets. The droplet size measurements were carried out using standard test protocols [11].
The RS (relative span) of the droplet spectrum was calculated by using the following equation [19,26]:
R S = D V 0.9 D V 0.1 D V 0.5

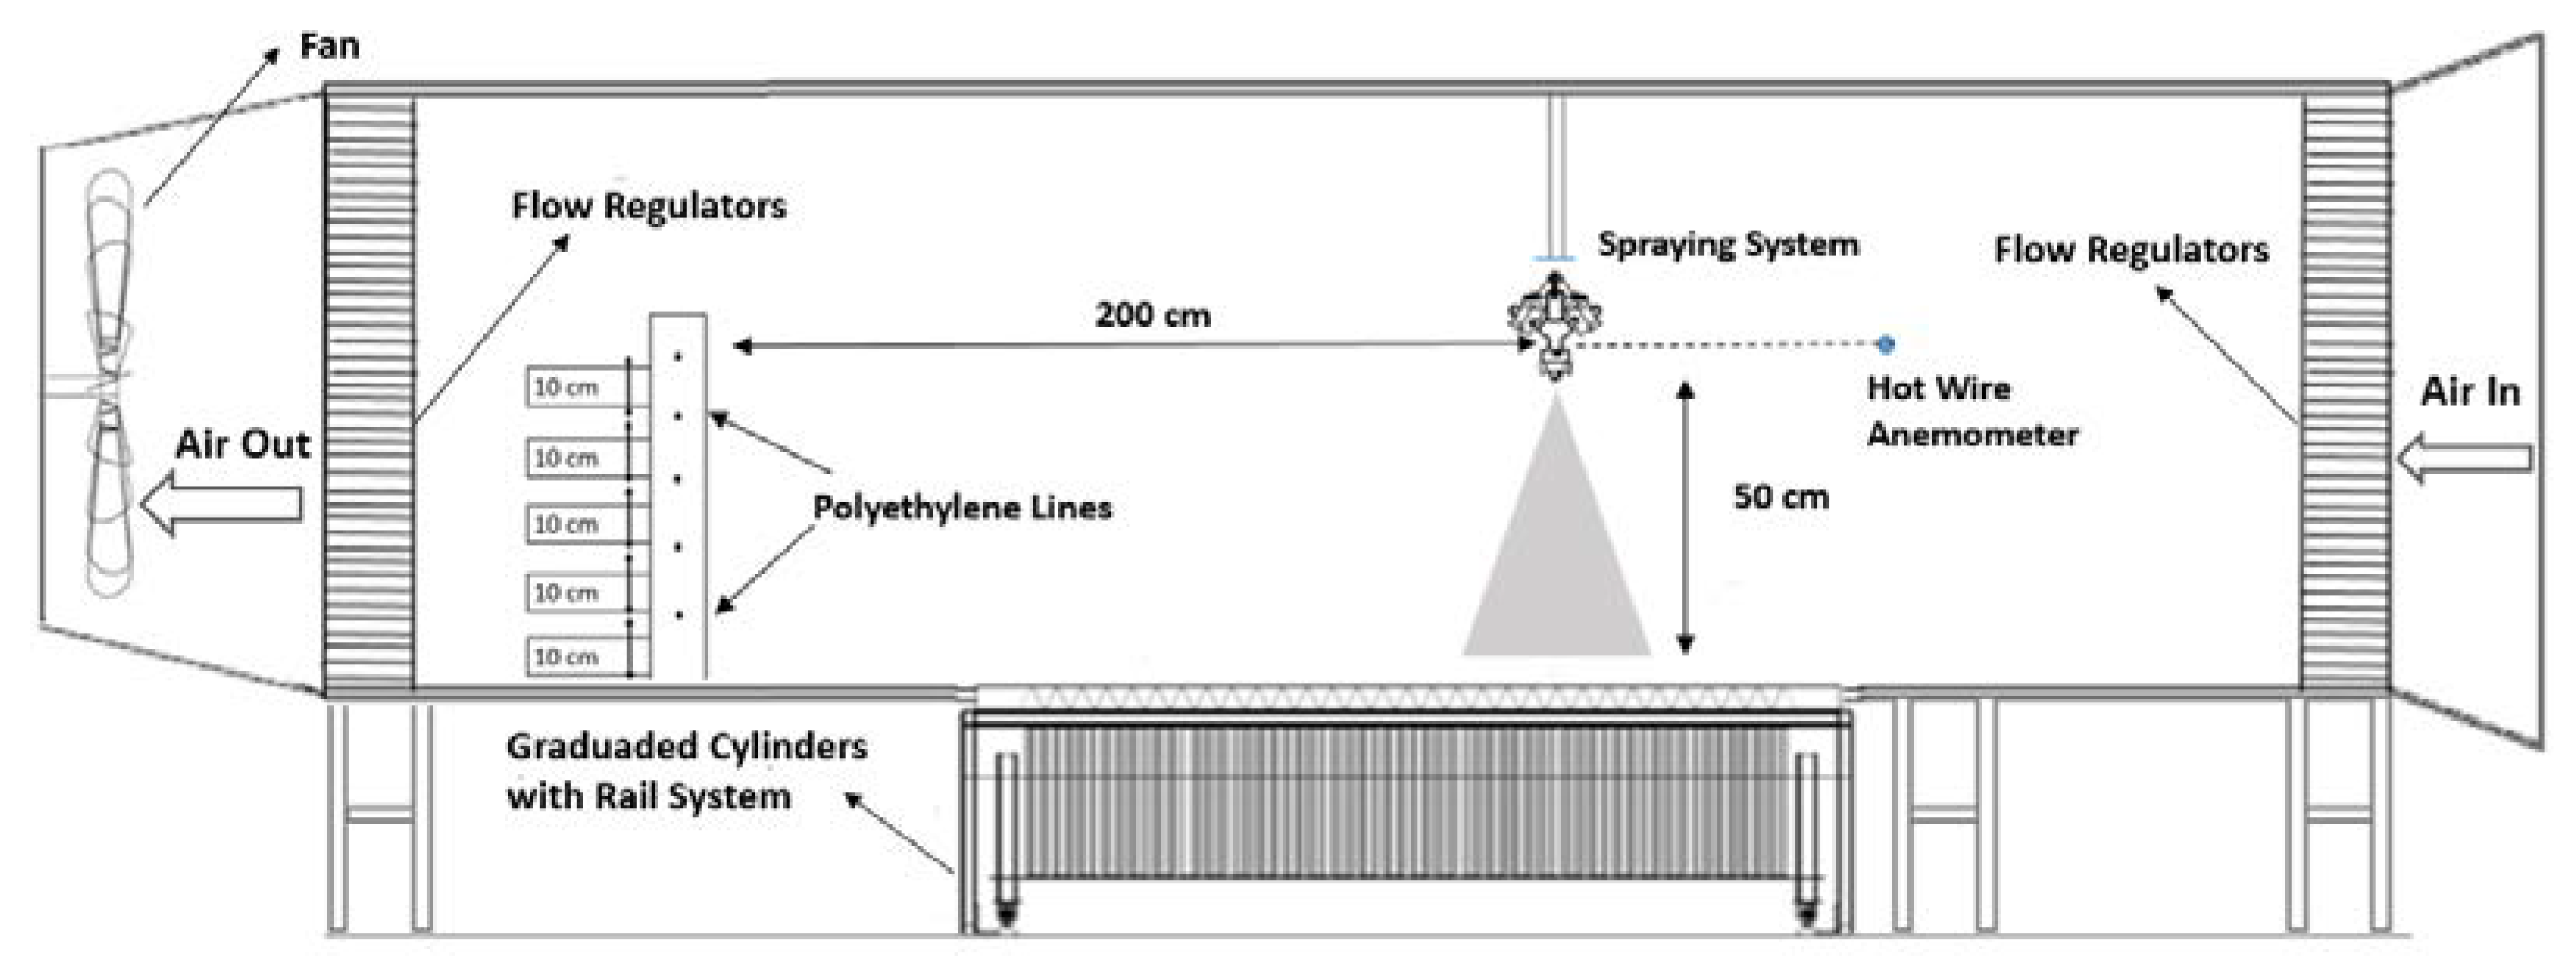
2.2. The Wind Tunnel

The tests were conducted in a wind tunnel under controlled conditions. The wind tunnel was constructed of plywood with dimensions of 1.3 m in width, 1.2 m in height, and 5.5 m in length (Figure 1). The spraying was carried out from a height of 50 cm. An axial fan on the tunnel’s exit side generated an artificial wind inside the tunnel (Figure 1). Flow regulators were located at the entrance and exit of the wind tunnel and the flow in the tunnel was laminar. The air that entered the tunnel was discharged from the tunnel’s outlet side. The wind speed in the wind tunnel was adjusted using an inverter, which electronically adjusted the engine speed on a panel located in the tunnel. An anemometer with a telescopic antenna (Thies Clima, Göttingen, Germany) was used for the wind-speed measurements in the wind tunnel. The spraying system comprised an air compressor that pressurized the spraying liquid, a premix tank with 2/3 of its volume filled with spraying liquid, a pressure control valve, a solenoid valve, and a spray nozzle. In all of the experiments, the XR11002 spray nozzle (TeeJeT Co., Springfield, IL, USA) was used. Each spraying process had a one-minute duration that was set via a time relay. The relative humidity throughout the trials was kept constant at 50–60% [27] (Reichard et al., 1992). To achieve this, the tunnel was ventilated for three minutes after each experiment.
A patternator (spray table) that collected the spray from the nozzle was used on the floor of the tunnel to determine the spray-pattern displacement (ground drift) of each spray liquid when operating at various spray pressures and wind velocities. The patternator used in the study was 1 m × 1.5 m in size and had 30 ‘V’-type grooves that were in 5 cm wide and 5 cm height. The patternator was placed 1 m away from the wind tunnel’s suction side. The platform with the graduated cylinders that was under the wind tunnel could be easily moved along a rail.
The droplets suspended in the air (airborne drift) are one of the major losses in drift. In this regard, it was also critical to measure the airborne drift. To detect the airborne drift potential, a tracer dye containing 0.1% brilliant sulfaflavine (BSF) was sprayed on polyethylene lines that were hung along the cross-section area of the wind tunnel at different heights, as shown in Figure 1. The amount of the tracer–adjuvant mixture’s deposition was measured using fluorometric methods. BSF tracers were deposited on polyethylene lines, which were 2 mm in diameter and 120 cm in length and placed at 10 cm intervals on the vertical plane of a specially designed aluminum frame (120 × 120 cm). These polyethylene lines were located at a distance of 2 m from the nozzle tip. Airborne drift measurements were taken at five different heights (H1 = 0.1 m; H2 = 0.2 m, H3 = 0.3 m, H4 = 0.4 m, and H5 = 0.5 m) in the wind direction. Thus, the effect of the additives on airborne drift was evaluated by measuring the amount of tracer material drifted by the wind.

2.3. Wind Tunnel Experiments

Experiments were conducted to determine how the adjuvants affected the amount of drift-prone droplets produced by the same nozzle. To measure the ground and airborne drift-reduction potentials of the adjuvants, the XR11002 nozzle was operated at 3, 4, and 5 bar spray pressures and wind speeds of 2.0, 3.5, and 5.0 m/s. For each wind speed and pressure level, each adjuvant was tested using three replications.
To determine the ground drift potential of the adjuvants, the spray pattern displacement (SPD) was calculated by using Equation (2) [25]. According this equation, smaller Dc values represent lower ground drift potential of any adjuvant due to less shifting in the spray pattern according to the nominal pattern of nozzle used.
D c = i = 1 i V i d i i = 1 i V i
where i denotes the sequence number of the graduated cylinder that collected liquid in each groove, Vi indicates the liquid volume in the relevant graduated cylinder, d i is the distance from the midpoint of the active patternator located under the nozzle when there was no wind speed and where the highest amount of liquid was collected in volume by the relevant groove; since the space between each groove was 5 cm, the d i value was expressed as 5 i –2.5 (cm).
According to this equation, higher Dc values imply greater displacements and consequently higher ground drift.
Before the airborne drift experiments, each adjuvant, tap water, and BSF mixture was prepared according to the recommended concentration and calibrated in a spectrophotofluorometer (Shimadzu AA6600, Kyoto, Japan) because each adjuvant mixture had a different fluorescence intensity. The excitation filter value for the adjuvants used in the experiments was 460 nm and the emission filter value was 500 nm. The calibration indicated how the adjuvants’ fluorescence qualities changed with concentration (Figure 2). Furthermore, via the calibrations, the fluorescence of each adjuvant was translated into mathematical formulae and curves, which were discovered to match the amount of substance in the spectrofluorometer with the light absorbed by each adjuvant.
To exhibit the magnitude of the airborne drift, the trace material depositions on the polyethylene lines were evaluated for each experiment. The mathematical curves for each adjuvant were used to determine the amount of tracer material deposited on the polyethylene lines. Each polyethylene line was properly placed in a separate glass jar. The distilled water containing a mixture with 100 mL of 30% methyl alcohol was poured into the jar and shaken by an oscillating shaker. The spectrophotofluorometer was used to determine the BSF concentration (μg/L) of the solution in the jars.
The airborne drift potential (DP) was calculated based on the first moment of the airborne spray profile measured at a distance of 2.0 m downwind of the nozzle. In [28], Grella et al. (2017) described the airborne effect via the following equation:
D P = n = 1 5 V i h i
where DP is the airborne drift potential based on a calculation of the first moment of the airborne deposit profile (μg m/mL); V i (μg/L) is the airborne deposit result at the collector polyethylene line; and h i is the height above the floor (0.10, 0.20, 0.30, 0.40, and 0.50 m for i values of 1, 2, 3, 4, and 5 (m), respectively).
DP values for the different other sprays (os) were compared with the equivalent results obtained from the reference spraying (rs) by calculating their airborne drift potential reduction percentage (DPRP, %). The DPRP of these other sprayings was expressed as the percentage reduction in their DP compared with the reference spraying and was calculated by using the following equation [29]:
D P R P = D P r s D P o s D P r s
where DPRP is the drift potential reduction percentage (%), D P r s is the drift potential of the reference spraying (μg/mL), and D P o s is the drift potential of one of the other sprayings (μg/mL).
In the experiments, the average data of the ground drift (Dc), airborne drift (DP) surface tension, viscosity, and Dv0.5 were analyzed using one-way ANOVA in the SPSS 20 program; the differences between the results were examined using the Tukey’s multiple-comparison test. Three replicates were carried out for each experiment. The data were separately analyzed to obtain descriptive statistics (mean and standard deviation). To determine the effects of pressure, adjuvant and pressure*adjuvant interaction on Dv0.5, a two-way ANOVA test was employed. In addition, a comparison of the ground spray drift with the effects of pressure, wind velocity and pressure x wind velocity interaction were also carried out using a two-way ANOVA test. After the analysis of variance, the least significant differences were calculated at a significance level of p = 0.05.

3. Results

3.1. Effects of Adjuvants on Viscosity and Surface Tension of Spray

The adjuvants used in the study increased the viscosity and decreased the surface tension (Table 2). The surface tension was lowest in the Control Duo and Surfeco plus adjuvants, which contained a polymer blend and organic silicone, respectively. These two adjuvants increased the viscosity to a greater degree than other adjuvants in the suggested concentration by their manufacturers due to their surfactant properties.

3.2. Effects of Adjuvants on the Droplet Diameter of Spray

The droplets produced by the XR11002 nozzle using each adjuvant were found to be larger than the droplets produced using tap water in the study (Table 3). For the droplet size measurements, 60 treatments were carried out for each experimental condition. The maximum percentages of the droplets that were smaller than 55 μm were obtained as 2.56% at a 3 bar spraying pressure, 3.99% at a 4 bar spraying pressure, and 4.95% at a 5 bar spraying pressure compared to the reference test liquid (water). Similarly, the maximum percentage of the droplets that were smaller than 158 μm were 51.67%, 53.33%, and 57.11% obtained at 3, 4, and 5 bar pressure, respectively, compared to tap water. The relative span values of the Control Duo and Kantor were high, which implied a wide droplet spectrum.
A statistical comparison of the droplet sizes of various adjuvants and the effects of pressure, adjuvant, and pressure x adjuvant interaction is presented in Table 4. As a result, compared to other liquids, tap water produced statistically smaller droplet sizes with the XR11002 nozzle. The adjuvants Starguar and Surfeco plus produced droplet sizes that were larger at each spray pressure. As expected, an increase in the spray pressure resulted in a decrease in the droplet sizes for all adjuvants selected.

3.3. Effects of Adjuvants in Reducing the Potential for Ground Spray Drift

In the wind tunnel experiments, the Dc values were calculated using data collected in the graduated cylinders. As shown in Table 5, pressure, wind velocity, and presure x wind velocity interaction were statistically significant. All adjuvants showed less drift than the reference test liquid of tap water. The drift was observed to increase particularly at a high spray pressure and at high wind speeds. It was found that the Dc values of the Control Duo were the lowest except for 3 bar at 2 m/s and 3 bar at 3.5 m/s. In addition, Control Duo was statistically different from the other mixtures in its Dc value except for Starguar and Control WM. The adjuvant Surfeco plus was also statistically different from the tap water, but the Dc value of this adjuvant was mostly the highest compared to other adjuvants.
The percentages of reduction in the Dc caused by the adjuvants in comparison to the reference test liquid (tap water mixture) are shown in Table 6. As a result, we determined that the Control Duo adjuvant reduced the ground drift by up to 60.53% and that this adjuvant had mostly the highest ground drift reduction. The lowest ground drift reduction compared to tap water was obtained as 25.06% at 3 bar and 3.5 m/s with Sterling. The adjuvant Surfeco plus had the lowest ground drift reduction compared to the other adjuvants.

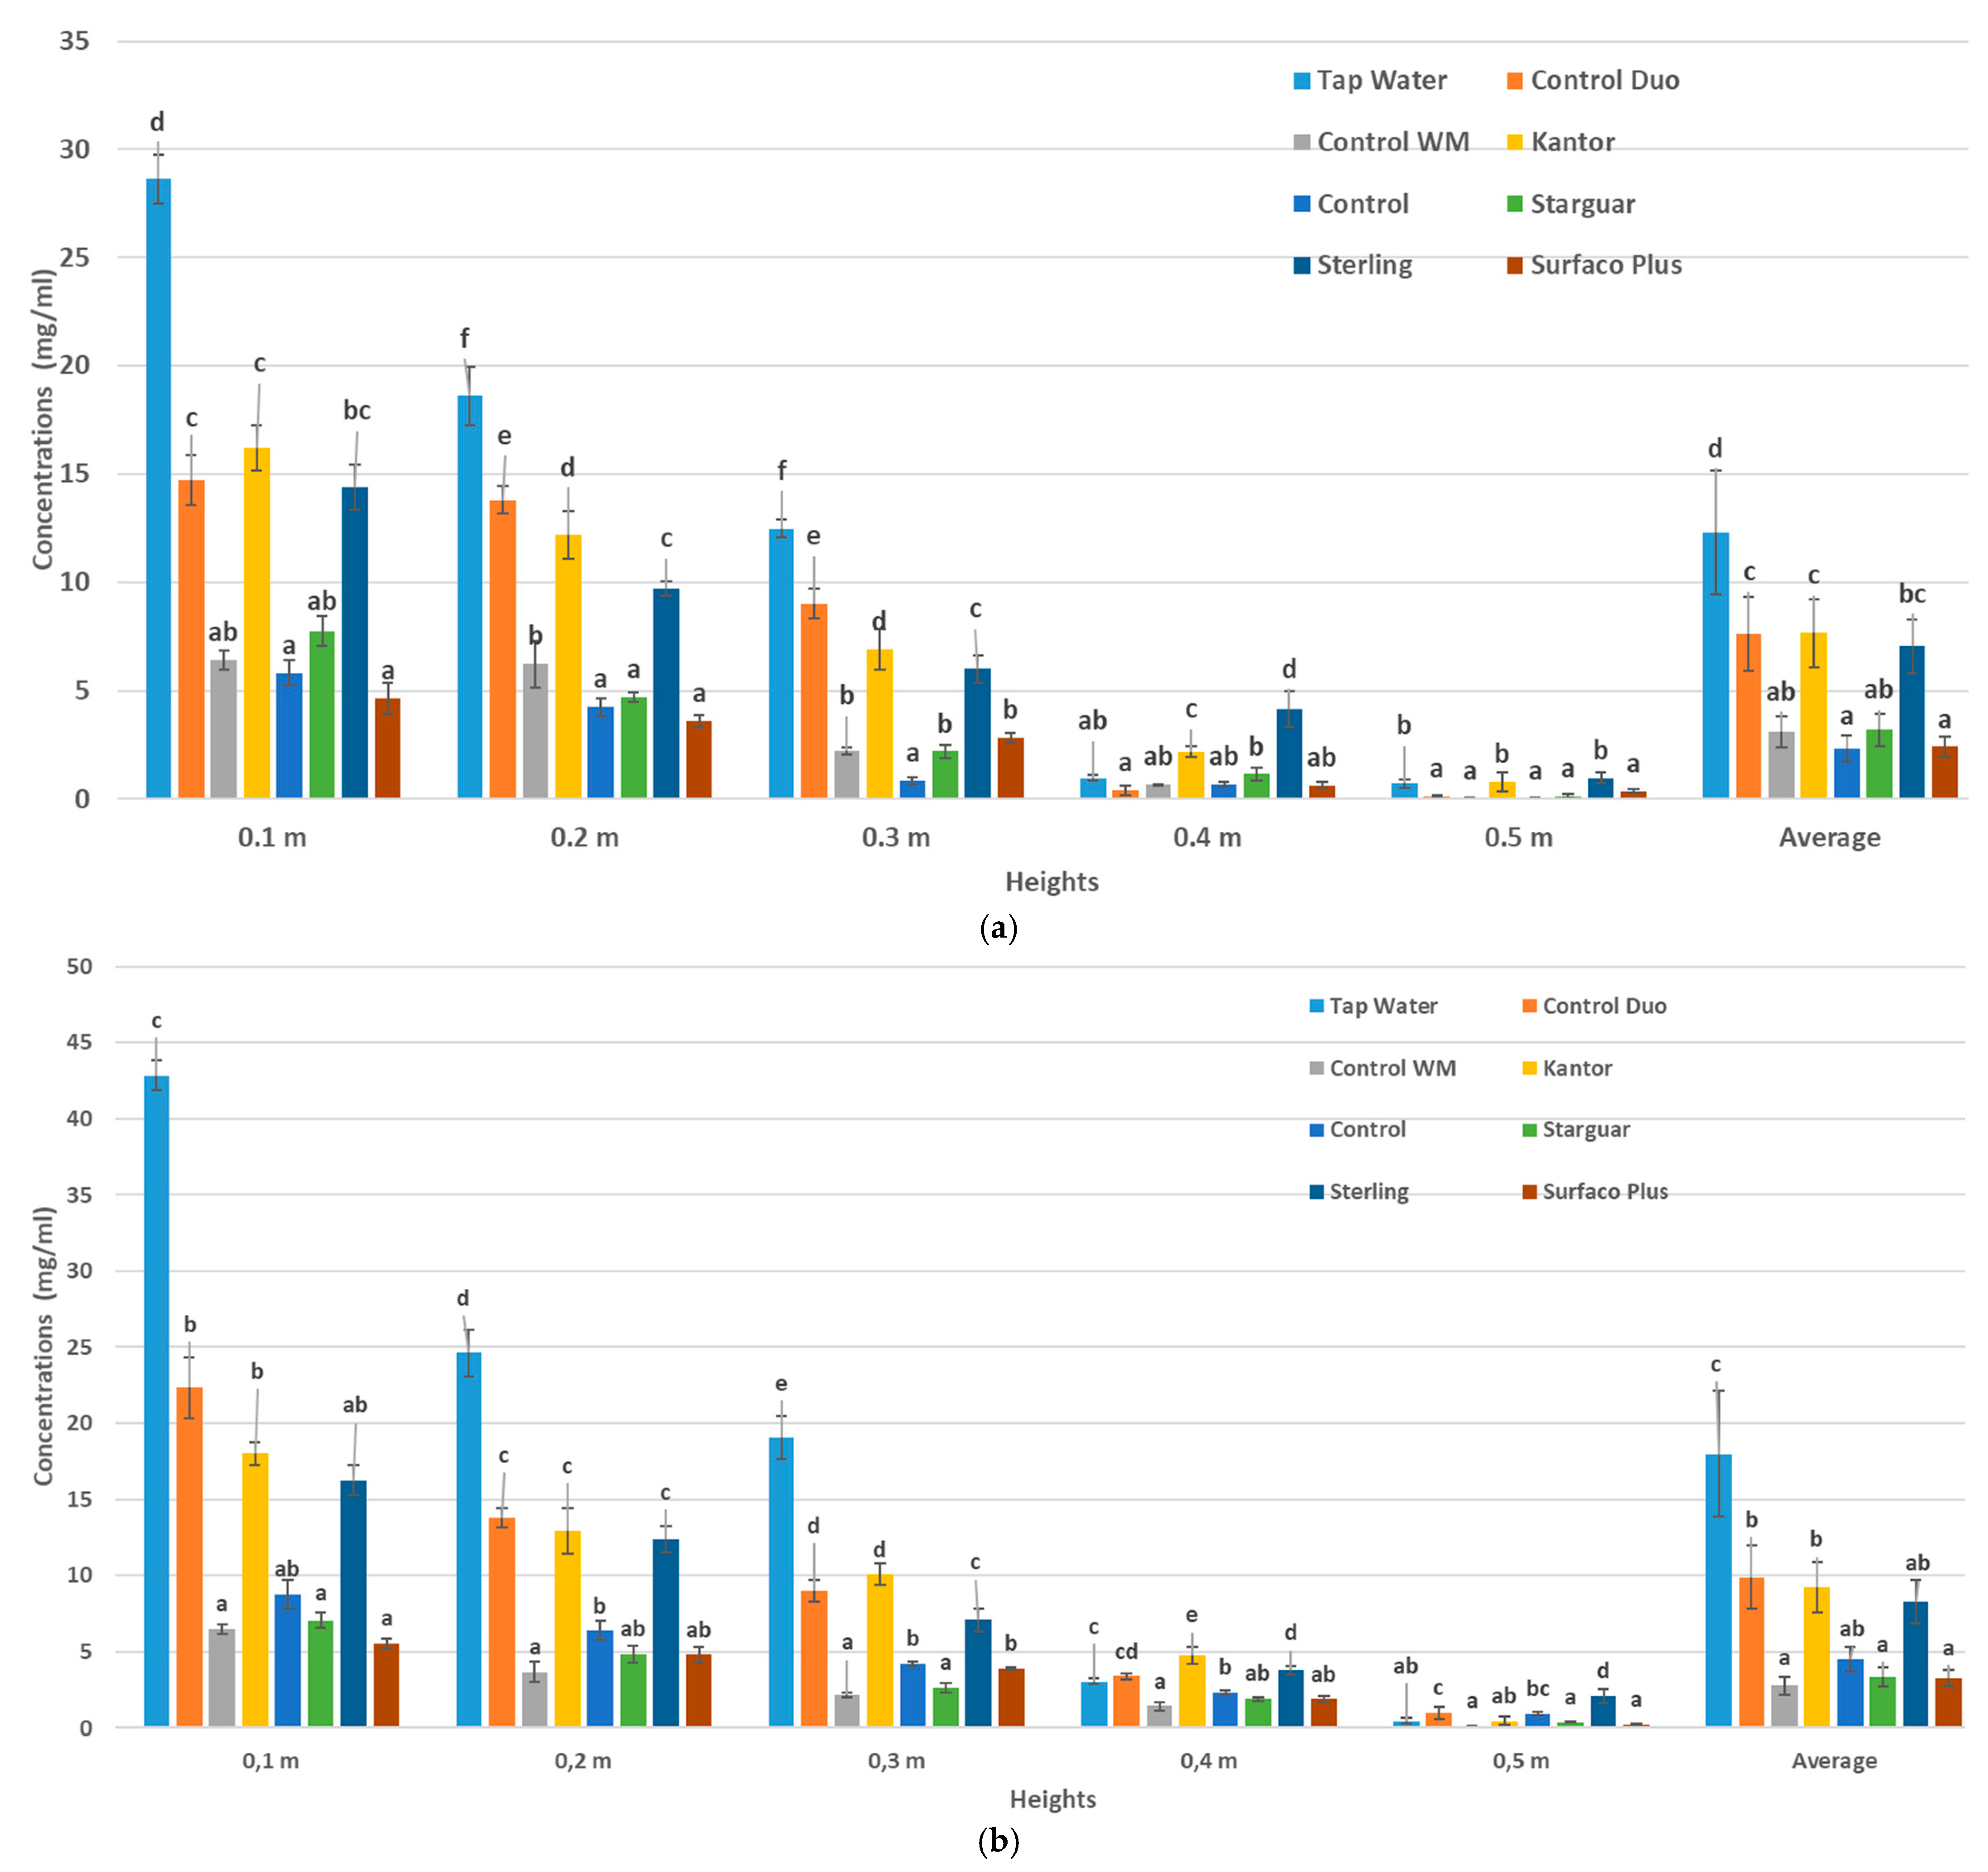
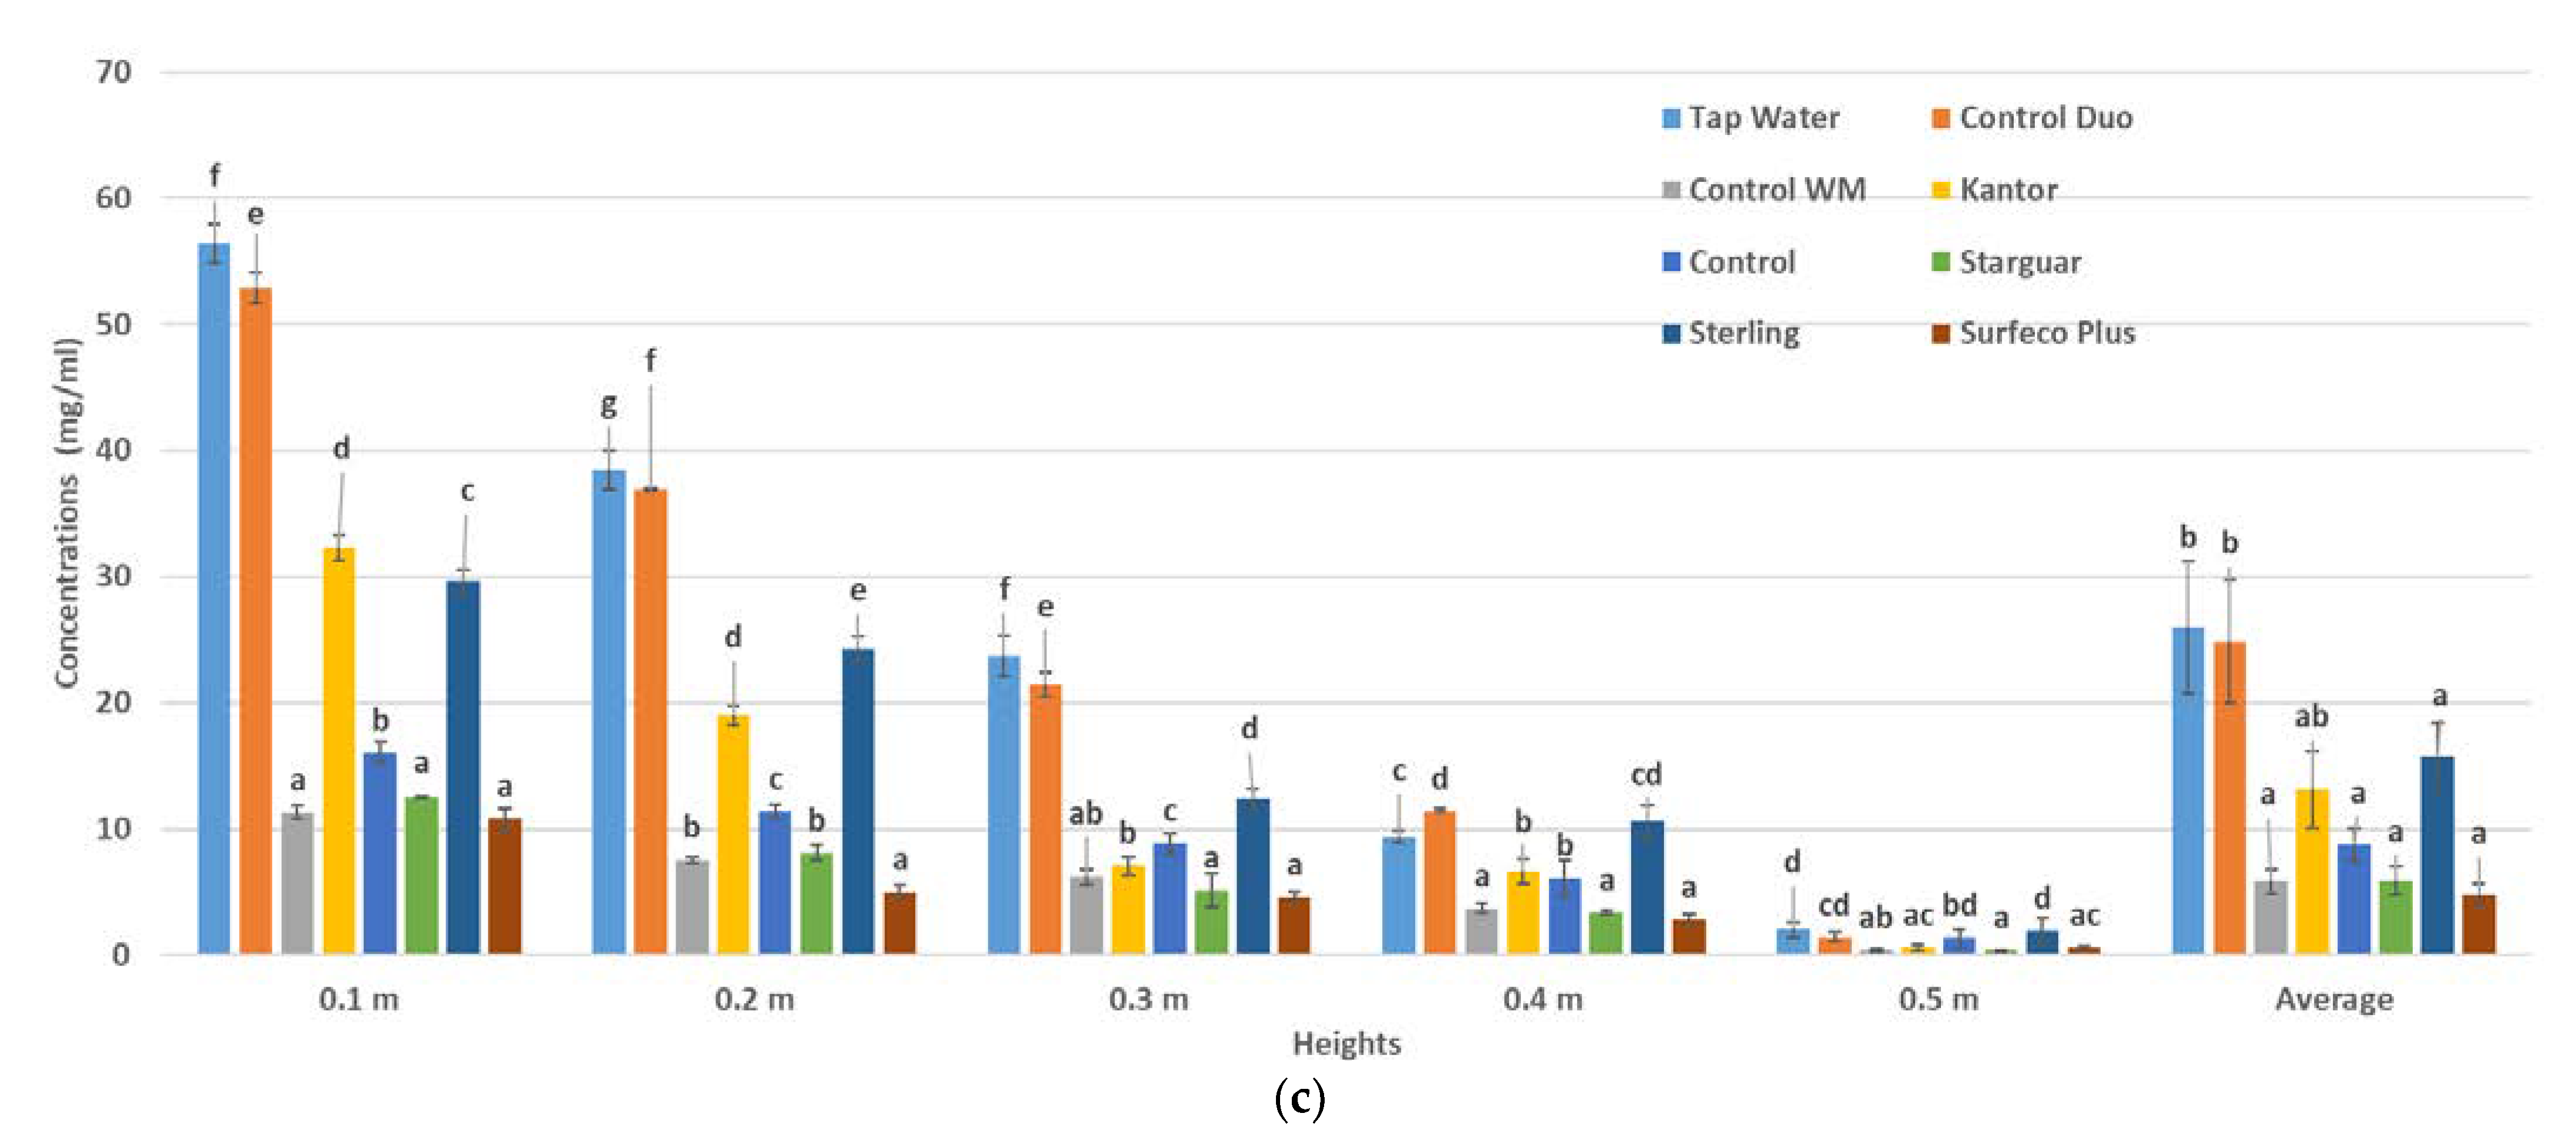
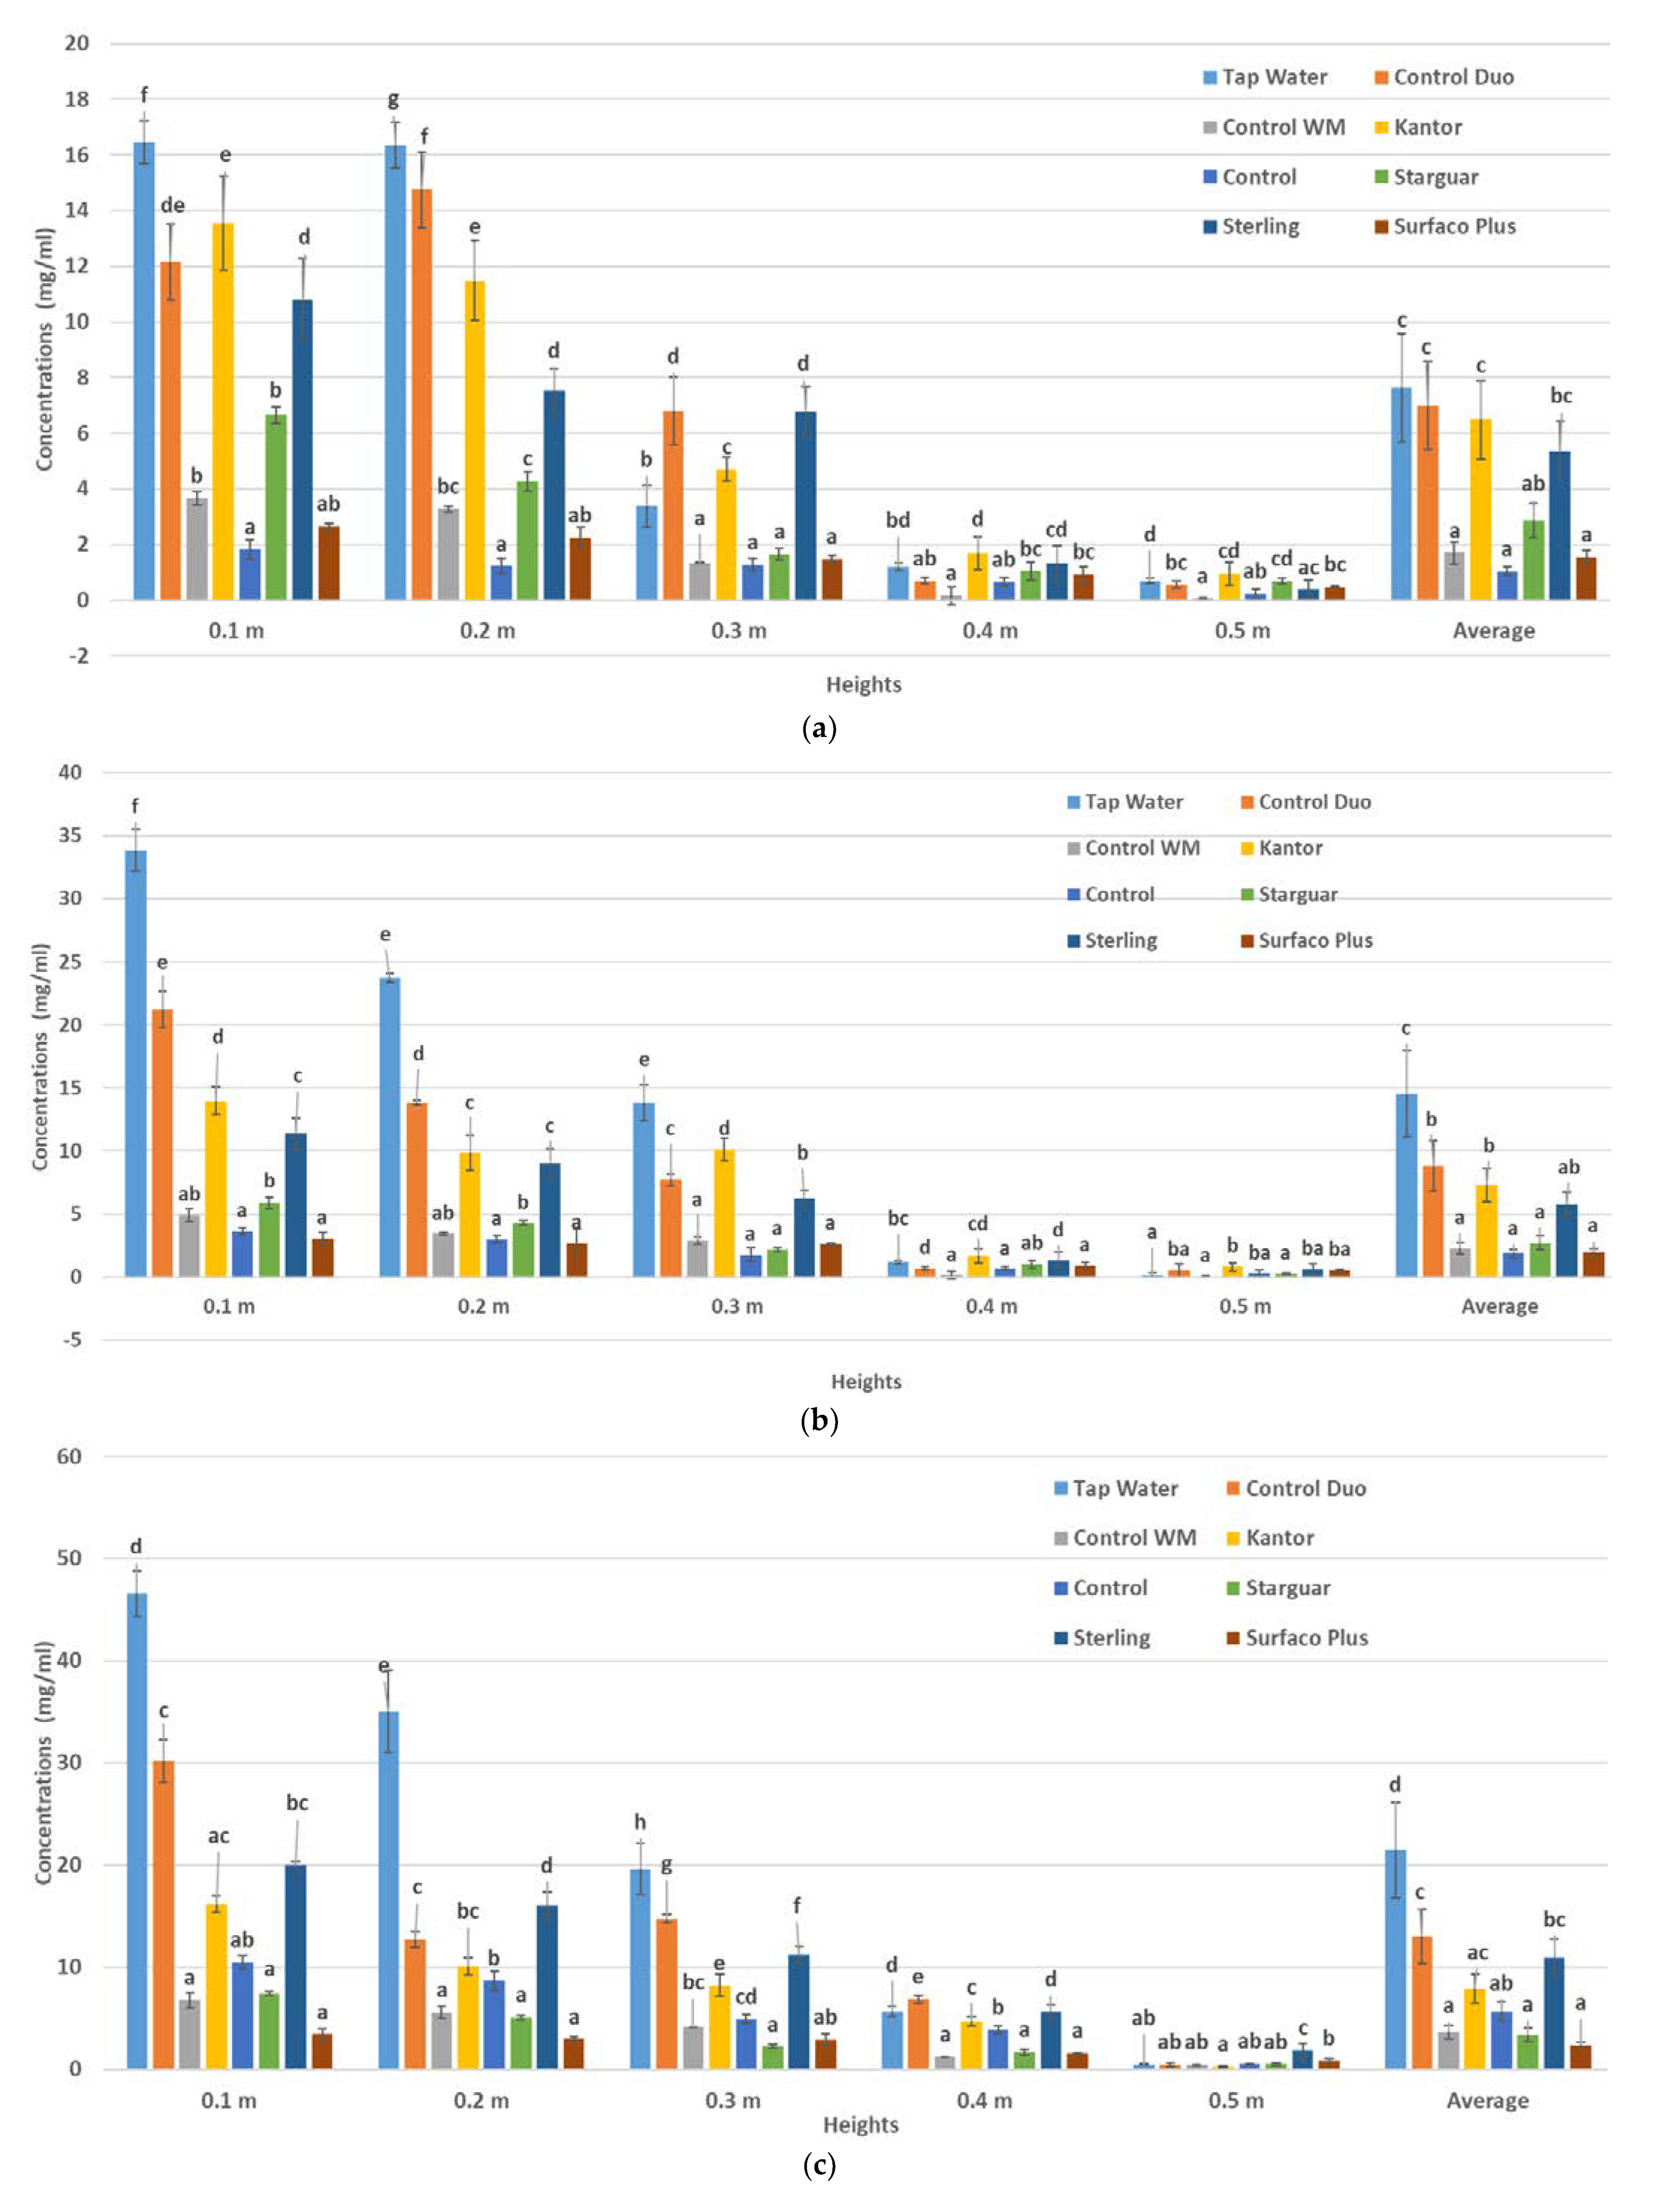
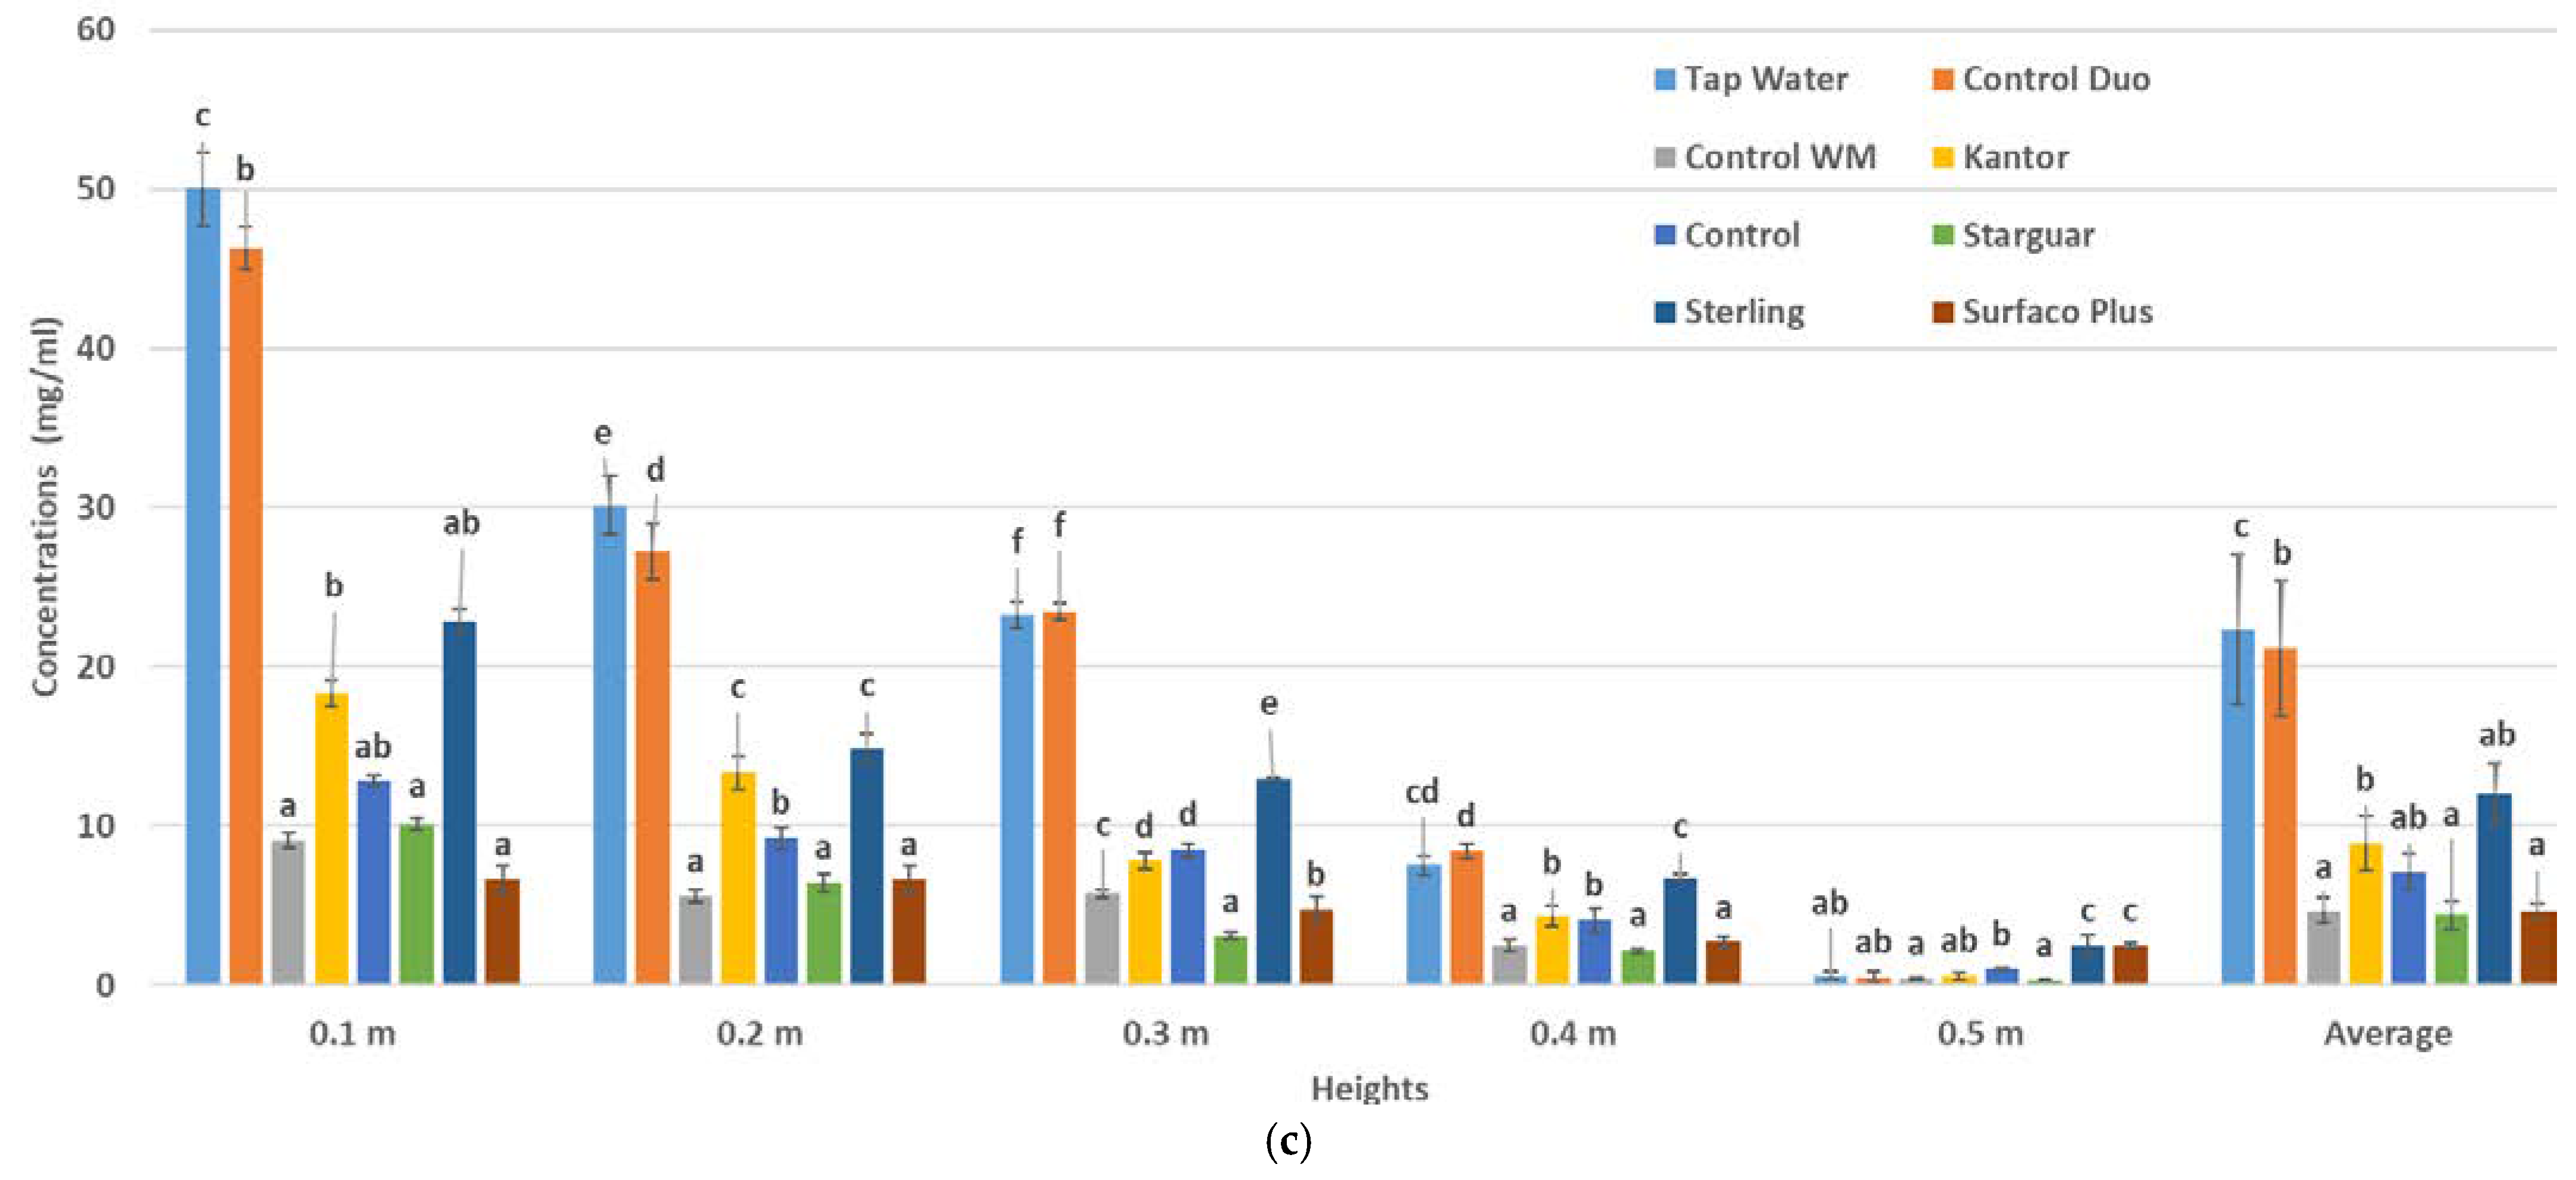
3.4. Effects of the Adjuvants on the Reduction of Airborne Drift Potential of Spray

We determined the airborne drift deposition as an amount of BSF in the solution at 3 bar pressure; the results are given for 2 m/s in Figure 3a, 3.5 m/s in Figure 3b, and 5 m/s in Figure 3c. Considering the graphs of the adjuvants deposited at different heights, the Control treatment was deposited in a lower amount than other adjuvants at the 0.0–0.3 m height at 3 bar and 2 m/s. At the heights of H1 and H2, the Control Duo and Kantor adjuvants were more effective than tap water and resulted in fewer airborne deposits. We calculated the average of the data from the five heights and found no statistical difference between Control Duo, Kantor, and tap water. The Control WM, Control, and Surfeco plus adjuvants had the lowest airborne drift. In the experimental conditions of nozzle pressure at 3 bar and wind velocity at 3.5 m/s, the droplets that were deposited at different heights were observed to increase. Based on an average of the five heights (H1, H2, H3, H4, and H5), the Control WM, Control, Starguar, and Surfeco plus adjuvants were more effective. In particular, the Control WM, Control, and Surfeco plus adjuvants drifted less than other adjuvants, particularly in the H1 to H3 range. Furthermore, it was clear that each adjuvant reduced drift and yielded a statistical difference compared to tap water. After the wind speed was increased to 5 m/s under a constant spraying pressure, the number of droplets deposited on the polyethylene lines increased further (Figure 3c). Despite the increase in wind speed, the Control WM, Starguar, and Surfeco plus adjuvants caused less drift at H1. Based on the average of the five heights, Control WM, Starguar, and Surfeco were also statistically different. Furthermore, it was discovered that each adjuvant caused less drift than tap water. As the wind velocity increased at a constant nozzle pressure of 3 bar, the deposition of the spraying liquid at each height was also increased.
In the experiments, when the nozzle pressure was increased from 3 bar to 4 bar, the droplet sizes for each liquid decreased and the exit velocity of the droplets from the nozzle increased. When the drifts in the 4 bar and 2 m/s and 3 bar and 2 m/s experimental conditions were compared, we found that the drift increased significantly due to the decrease in the droplet diameter (Figure 4a). The amount of the trace material that was deposited at different heights increased. In the operating conditions of 4 bar pressure and 2 m/s wind velocity, the effectiveness of the Control and Surfeco plus adjuvants was better both at the H1 and in the average of all heights. The drift increased after the wind speed in the tunnel was increased to 3.5 m/s compared to the 2 m/s test condition (Figure 4b). In this case, less drift was observed for each adjuvant compared to the tap water. At H1 and H2, the Control WM, Starguar, and Surfeco plus adjuvants were deposited in lower amounts than the other adjuvants. The drift rise was higher when the air velocity in the wind tunnel was 5 m/s and the spray pressure was 4 bar (Figure 4c). The efficiency of Control Duo decreased especially at the initial H1, and even at certain heights, it exhibited qualities comparable to those of tap water. However, this adjuvant showed statistically less drift than tap water on average. Consequently, it was statistically observed that the Control WM, Starguar, and Surfeco plus adjuvants significantly decreased the drift on average.
When the results of the test conditions of a spray pressure of 5 bar and wind speed of 2 m/s and a spray pressure of 4 bar and wind speed of 2 m/s were compared, we found that the airborne drift increased at all heights and that the Control Duo adjuvant was deposited more than tap water at a height of 0.2 m above the ground (Figure 5a). The Control WM, Control, Starguar, Sterling, and Surfeco plus adjuvants reduced the drift on average for the five heights. The droplet sizes deposited at various heights increased after the test conditions were altered to 5 bar and 3.5 m/s. At the heights of H1, H2, H3, and H4, Control Duo was inadequate to reduce drift. The efficacy of the Control WM adjuvant was decreased, as shown in Figure 5b. In addition, Surfeco plus was more resistant to drift at the heights of H1, H2, and H3. The efficacy of the Control WM adjuvant was decreased at 0.0–0.3 m, but this adjuvant was better on average. The Control WM, Control, Starguar, and Surfeco plus adjuvants were statistically significant and their drifts were reduced on average compared to other adjuvants. When the wind speed was increased to 5 m/s and the spray pressure was kept constant at 5 bar in the wind tunnel, the number of droplets deposited on all the polyethylene lines increased (Figure 5c). We discovered that on average, there was no difference between the tap water (reference fluid) and the Control Duo adjuvant. In this scenario, Surfeco plus was stable and resisted drift well; the minimum airborne drift was obtained by this adjuvant. The Control WM, Control, Starguar, and Surfeco plus adjuvants, on the other hand, had statistically higher efficiencies and decreased the drift.
We used the drift potential (DP) and drift potential reduction percentage (DPRP) (compared to the reference liquid of tap water) as other evaluation parameters. As shown in Table 7, the wind velocity and pressure increase affected the airborne drift potential directly for each adjuvant. The Control, Control WM, Starguar, and Surfeco plus adjuvants had lower airborne drift potentials. In some experiments, the DP of the Control Duo was worse than that of tap water. Hence, the DPRP value of the Control Duo had a negative (-) sign. The maximum DPRP value was obtained as 85.76% with the Surfeco plus adjuvant at a 3 bar pressure and 5 m/s wind velocity. The increase in nozzle pressure or wind velocity resulted in the higher DP value.

4. Discussions

Viscosity and surface tension are the main parameters that affect droplet generation [30]. The viscosities of the adjuvants were higher than that of tap water and the surface tension of each adjuvant was lower than that of tap water. We found that the adjuvants used in our research reduced the surface tension. Due to this, coarser droplets were produced because the surface tension of the adjuvant spray decreased. The Control Duo and Surfeco plus adjuvants are regarded as drift guards but were also designed as surfactants. These adjuvants’ surface tension values were lower than others. We detected that surface tension reducers generally decreased the surface tension of pure water by 30 to 50 mN/m [31,32]. The Control Duo, Control WM, and Surfeco plus adjuvants had the highest viscosities. Coarser droplets also occurred when the viscosity increased. The authors of [33] measured the droplet sizes produced by spraying 33 drift-reducing additives in various combinations using a Teejet XR8003 nozzle at a 200 kPa pressure. They found that the viscosity had a significant impact on the droplet formation. As a result, the adjuvants could reduce the spray’s airborne and ground drift potential by increasing the droplet sizes.
The present study measured the droplet sizes produced using the XR11002 nozzle and each adjuvant. The drift-prone droplet percentage of the tap water was mostly the highest. According to the ASABE S572.1 Droplet Size Classification standard, each droplet size was ‘’Fine’’ in spray quality. It can be easily seen that the droplet size measurements showed that each adjuvant made the droplets coarser statistically.
The ground drift of the spray pattern for each adjuvant was calculated in the current study as the Dc value, which was compared with that of the reference liquid (tap water). Generally, the Control Duo, Control WM, and Starguar adjuvants were effective in reducing the spray pattern displacement (SPD). Even though the wind velocity remained constant, increasing the spray pressure resulted in a rise in both spray drift potentials because the higher pressure reduced the droplet sizes in the spray pattern as expected. On the other hand, the increases in wind velocity also increased the drift. The researchers in [34] reduced the drift by 39% in a wind tunnel by using spreaders and adhesives. In the present work, the maximum drift reduction of 60.53% was obtained using the Control Duo adjuvant, which had the maximum drift reduction potential in all experiments.
As the droplet diameters decreased depending on the increase in pressure in the present study, the number of droplets deposited on the airborne drift sampling polyethylene lines increased. Similarly, when the wind speed at the same pressure increased, so did the amount of deposits on the polyethylene line targets. Depositions of all of the experiment liquids were the maximum at H1; as the height of the polyethylene line increased, the deposition of the mixture on the polyethylene lines decreased. As result, the deposition on each polyethylene line and the average of the five polyethylene lines were statistically compared. According to these comparisons, all adjuvants were statistically different from the reference tap water. However, the Control WM, Control, Starguar, Sterling, and Surfeco plus adjuvants were also more remarkable.
The spray pattern displacement (Dc) and airborne drift values of these adjuvants could differ according to the nozzle type. The drift-prone droplets that were produced using Control Duo were maximized at 5 bar and 53.97% of the droplets were smaller than 158 μm. Control Duo reduced the spray pattern displacement (Dc) by 60.53%, but it was discovered that this adjuvant was ineffective in airborne drift. However, the Sterling and Control WM adjuvants, which were in harmony with the XR11002 nozzle, were effective both in airborne and spray pattern displacement (SPD). The nozzle geometry–adjuvant relationship was another parameter that affected the droplet generation [30]. The authors of [18] emphasized that using a formulation to influence spray drift exists only in combination with the nozzle design. The drift-prone droplet amount decreased with the adjuvant usage in the present study. The relative span values of the Control Duo and Kantor adjuvants were high, which implied a wide droplet spectrum. Even though Control Duo increased the droplet sizes, this adjuvant also lowered the spray pattern displacement. A wide droplet spectrum signaled variability in the droplet sizes, and this increased the airborne drift.
The DP value that was calculated to compare the drift potential of the adjuvants was an indicator of the airborne drift in the present study. As the nozzle pressure and the wind velocity were increased, the DP values also increased for each adjuvant. According to [35], an adjuvant with an organic silicone ingredient was the best for creating a larger droplet size. The Sterling adjuvant with an organic silicone ingredient was also less drift-prone. Similarly, in the present study, the maximum DPRP value was obtained as 85.76% with the Surfeco plus adjuvant containing organic silicone at a 3 bar pressure and 5 m/s wind velocity in the airborne drift evaluation. The researchers in [35] also found that a methylated oil-based adjuvant that decreased the surface tension produced a coarser droplet. The authors of [36] found that nonionic and polyvinyl polymer-added drift-reducing additives reduced the droplet drift compared to water spraying. In the present study, the Starguar adjuvant was methylated and oil-based while the Control adjuvant contained a polyvinyl polymer. The Control and Starguar adjuvants did not have a DPRP value as high as that of the Control WM adjuvant, which is based on glyphosate. The Surfeco plus adjuvant, which decreased the surface tension and increased the droplet size, also reduced the drift.

5. Conclusions

The major conclusions of this research can be summarized as follows:
(1)
As predicted, drift-guard adjuvants lowered the surface tension and increased the viscosity. It was possible to produce coarser droplets under the same conditions by using adjuvants.
(2)
Drift-prone droplets (<100 μm) were decreased by using an adjuvant compared to using tap water due to coarsening of the droplets.
(3)
The ground spray drift was decreased by using adjuvants. As the pressure and the wind velocity increased, the Dc value also increased. The Control Duo adjuvant reduced the ground drift by up to 60.53%.
(4)
As the height of the polyethylene lines increased, the deposition on those lines decreased. Increases in the pressure and wind velocity caused deposition increases for each height. The maximum DPRP value was obtained as 85.76% with the Surfeco plus adjuvant containing organic silicone.

Author Contributions

In this study, the conceptualization was conducted by A.B. (Ali Bayat). Methodology was developed by A.B. (Ali Bayat) and A.B. (Ali Bolat). The experiments and validation were carried out by M.İ., A.S., and M.C.T. The steps of writing and visualization were conducted by A.B. (Ali Bayat) and M.İ. The original draft was prepared by M.C.T. The supervision was conducted by A.S. and A.B. (Ali Bolat). All authors have read and agreed to the published version of the manuscript.

Funding

This project was funded by the Cukurova University Office of Scientific Research Projects under the project code FBA-2019-1049910499.

Conflicts of Interest

The authors declare no conflict of interest.

References

  1. Oerke, E.C. Crop losses to pests. J. Agric. Sci. 2006, 144, 31–43. [Google Scholar] [CrossRef]
  2. Hewitt, A.J. Spray drift: Impact of requirements to protect the environment. Crop Prot. 2000, 19, 623–627. [Google Scholar] [CrossRef]
  3. De Schampheleire, M.; Spanoghe, P.; Brusselman, E.; Snock, S. Risk assessment of pesticide spray drift damage in Belgium. Crop Prot. 2007, 26, 602–611. [Google Scholar] [CrossRef]
  4. Nuyttens, D.; De Schampheleire, M.; Baetens, K.; Sonck, B. The influence of operator controlled variables on spray drift from field crop sprayers. Trans. ASABE 2007, 50, 1129–1140. [Google Scholar] [CrossRef]
  5. De Schampheleire, M.; Nuyttens, D.; Baetens, K.; Cornelis, W.; Gabriels, D.; Spanoghe, P. Effects on pesticide spray drift of the physicochemical properties of the spray liquid. Precis. Agric. 2009, 10, 409–420. [Google Scholar] [CrossRef]
  6. De Ruiter, H.; Holterman, H.J.; Kempenaar, C.; Mol, H.G.J.; de Vlieger, J.J.; van de Zande, J. Influence of Adjuvants and Formulations on the Emission of Pesticides to the Atmosphere. In A Literature Study for the Dutch Research Programme Pesticides and the Environment (DWK) Theme C-2; Report 59; Plant Research International B.V.: Wageningen, The Netherlands, 2003. [Google Scholar]
  7. Butler-Ellis, M.C.; Swan, T.; Miller, P.C.H.; Waddelow, S.; Bradley, A.; Tuck, C.R. Design factors affecting spray characteristics and drift performance of air induction nozzles. Biosyst. Eng. 2002, 82, 289–296. [Google Scholar]
  8. Vallet, A.; Tinet, C. Characteristics of droplets from single and twin jet air induction nozzles: A preliminary investigation. Crop Prot. 2013, 48, 63–68. [Google Scholar] [CrossRef]
  9. Western, N.M.; Hislop, E.C. Drift of charged and uncharged spray droplets from an experimental air-assisted sprayer. In: Air-Assisted in Crop Protection. BCPC Monogr. 1991, 46, 69–76. [Google Scholar]
  10. Hislop, E.C.; Western, N.M.; Cooke, B.K.; Butler, R. Experimental air-assisted spraying of young cereal plants under controlled conditions. Crop Prot. 1993, 12, 193–200. [Google Scholar] [CrossRef]
  11. Bayat, A.; Ozkan, H.E.; Derksen, R.C.; Fox, R.D.; Brazee, R.D. Wind tunnel evaluation of air-assist sprayer operating parameters. ASAE Meet. Present. 1999, 18–22. [Google Scholar] [CrossRef]
  12. Patel, M.K. Technological improvements in electrostatic spraying and its impact on agriculture during the last decade and future research perspectives: A review. Eng. Agric. Environ. Food 2016, 9, 92–100. [Google Scholar] [CrossRef]
  13. Martin, D.E.; Lateef, M.A. Aerial Electrostatic spray deposition and canopy penetration in cotton. J. Electrost. 2017, 90, 38–44. [Google Scholar] [CrossRef]
  14. Ozkan, H.E.; Miralles, A.; Sinfort, C.; Zhu, H.; Fox, R.D. Shields to reduce spray drift. J. Agric. Eng. Res. 1997, 67, 311–322. [Google Scholar] [CrossRef]
  15. Tsay, J.; Ozkan, H.E.; Brazee, R.D.; Fox, R.D. CFD simulation of moving spray shields. Trans. ASAE 2002, 45, 21–26. [Google Scholar]
  16. Sidahmed, M.M.; Awadalla, H.H.; Haidar, M. Symmetrical multi-foil shields for reducing spray drift. Biosyst. Eng. 2004, 88, 305–312. [Google Scholar] [CrossRef]
  17. Zhu, H.; Dexter, R.W.; Fox, R.D.; Reichard, D.L.; Brazee, R.D.; Ozkan, H.E. Effects of polymer composition and viscosity on droplet size of recirculated spray solutions. J. Agric. Eng. Res. 1997, 67, 35–45. [Google Scholar] [CrossRef]
  18. Hilz, E.; Vermeer, A.W.P. Spray drift review: The extent to which a formulation can contribute to spray drift reduction. Crop Prot. 2013, 44, 75–83. [Google Scholar] [CrossRef]
  19. Wang, S.; Li, X.; Zeng, A.; Song, J.; Xu, T.; Lv, X.; He, X. Effects of Adjuvants on Spraying Characteristics and Control Efficacy in Unmanned Aerial Application. Agriculture 2022, 12, 138. [Google Scholar] [CrossRef]
  20. Ellis, J.M.; Griffin, J.L. Soybean (Glycine max) and Cotton (Gossypium hirsutum) response to simulated drift of glyphosate and glufosinate. Weed Technol. 2002, 16, 580–586. [Google Scholar] [CrossRef]
  21. Koger, C.H.; Shaner, D.L.; Krutz, L.J.; Walker, T.W.; Buehring, N.; Henry, W.B.; Thomas, W.E.; Wilcut, J.W. Rice (Oriza sativa) response to drift rates of glyphosate. Pest Manag. Sci. 2005, 61, 1161–1167. [Google Scholar] [CrossRef]
  22. Schrübbers, L.; Valverde, B.E.; Sørensen, J.C.; Cedergreen, N. Glyphosate spray drift in Coffea arabica—sensitivity of coffee plants and possible use of shikimic acid as a biomarker for glyphosate exposure. Pest. Biochem. Physiol. 2014, 115, 15–22. [Google Scholar] [CrossRef] [PubMed]
  23. Lan, Y.; Hoffmann, W.C.; Fritz, B.K.; Martin, D.E.; Lopez, J.D. Spray drift mitigation with spray mix adjuvants. Appl. Eng. Agric. 2008, 24, 5–10. [Google Scholar] [CrossRef]
  24. Alves, G.S.; Kruger, G.R.; da Cunha, J.P.A.R.C.; Vieira, B.C.; Henry, R.S.; Obradovic, A.; Grujic, M. Spray Drift from Dicamba and Glyphosate Applications in a Wind Tunnel. Weed Technol. 2017, 31, 387–395. [Google Scholar] [CrossRef]
  25. Bayat, A.; Bozdogan, N.Y. An air-assisted spinning disc nozzle and its performance on spray deposition and reduction of drift potential. Crop Prot. 2005, 24, 951–960. [Google Scholar] [CrossRef]
  26. Nuyttens, D.; Taylor, W.A.; Schampheleire, M.; Verbhoven, P.; Dekeyser, D. Influence of nozzle type and size on drift potential by means of different wind tunnel evaluation methods. Biosyst. Eng. 2009, 103, 271–280. [Google Scholar] [CrossRef]
  27. Reichard, L.; Zhu, H.; Fox, R.D.; Brazee, R.D. Computer Simulation of Varıables That Influence Spray Drıft. Trans. ASAE 1992, 35, 1401–1407. [Google Scholar] [CrossRef]
  28. Grella, M.; Gil, E.; Balsari, P.; Marucco, P.; Gallart, M. Advances in developing a new test method to assess spray drift potential from air blast sprayers. Span. J. Agric. Res. 2017, 15, 16. [Google Scholar] [CrossRef] [Green Version]
  29. Nuyttens, D.; Zwertvaegher, I.K.A.; Dekeyser, D. Spray drift assessment of different application techniques using a drift test bench and comparison with other assessment methods. Biosyst. Eng. 2017, 154, 14–24. [Google Scholar] [CrossRef]
  30. Spanoghe, P.; De Schampheleire, M.; Van der Meeren, P.; Steurbaut, W. Review Influence of agricultural adjuvants on droplet spectra. Pest. Manag. Sci. 2007, 63, 4–16. [Google Scholar] [CrossRef]
  31. Curran, W.S.; Mcglamery, M.D.; Liebl, R.A.A.; Lingenfelter, D.D. Adjuvants for Enhancing Herbicide Performance; Agronomy Facts 37; Penn State College of Agricultural Sciences: University Park, PA, USA, 1999. [Google Scholar]
  32. Silicone Spectator. Available online: http://www.scientificspectator.com/documents/silicone%20spectator/Silicone_Spectator_July_2009.pdf (accessed on 21 May 2021).
  33. De Oliveira, R.B.; Antuniassi, U.R.; Gandolfo, M.A. Spray Adjuvant Characteristics Affecting Agricultural Spraying Drift. Eng. Agríc. 2015, 35, 109–116. [Google Scholar] [CrossRef] [Green Version]
  34. Griesang, F.; Decaro, R.A.; Santos, C.A.M.; Santos, E.S.; Roque, N.H.L.; Ferreira, M.C. How much do adjuvant and nozzles models reduce the spraying drift? Drift in agricultural spraying. Am. J. Plant Sci. 2017, 8, 2785–2794. [Google Scholar] [CrossRef] [Green Version]
  35. Butler-Ellis, M.C.; Tuck, C.R.; Miller, P.C.H. The effect of some adjuvants on sprays produced by agricultural flat fan nozzles. Crop Prot. 1997, 16, 41–50. [Google Scholar] [CrossRef]
  36. Guler, H.; Zhu, H.; Ozkan, E.; Derksen, R.; and Krause, C. Wind Tunnel Evaluation of Drift Reduction Potential and Spray Characteristics with Drift Retardants at High Operating Pressure. J. ASTM Int. 2006, 3, 1–9. [Google Scholar] [CrossRef] [Green Version]
Figure 1. Representation of the sampling methods in the wind tunnel for ground and airborne drift measurement tests.
Agronomy 12 02377 g001
Figure 2. Spectrophotofluorometer calibration curves for each adjuvant used.
Agronomy 12 02377 g002
Figure 3. Comparison of adjuvant spray droplets captured at 3 bar from different heights in 2 m/s (a), 3.5 m/s (b), and 5 m/s (c) wind velocity test conditions. Different letters in the same columns indicate significant differences at the p < 0.05 level.
Agronomy 12 02377 g003
Figure 4. Comparison of adjuvant spray droplets captured at 4 bar from different heights in 2 m/s (a), 3.5 m/s (b), and 5 m/s (c) wind velocity test conditions. Different letters in the same columns indicate significant differences at the p < 0.05 level.
Agronomy 12 02377 g004aAgronomy 12 02377 g004b
Figure 5. Comparison of adjuvant spray droplets captured at 5 bar from different heights in 2 m/s (a), 3.5 m/s (b), and 5 m/s (c) wind velocity test conditions. Different letters in the same columns indicate significant differences at the p < 0.05 level.
Agronomy 12 02377 g005aAgronomy 12 02377 g005b
Table 1. The seven adjuvants with their active ingredients and recommended concentrations used in the study.
Commercial
Name
Producing
Company
Active
Ingredient
PropertyRecommended
Concentration
(mL/L)
Surfeco plusMomentive (New York, NY, USA)Organic siliconeDrift guard0.15
StarguarSolvay (Lyon, France)Methylated oil-basedDrift guard0.25
Kantorİnteragro (London, UK)Alkoxylated triglyceridesDrift guard0.15
Sterlingİnteragro (London, UK)TriglyceridesDrift guard0.25
ControlGarrco (Indiana, IN, USA)Polyvinyl polymerDrift guard0.25
Control WMGarrco (Indiana, IN, USA)MAX glyphosateDrift guard0.25
Control DUOGarrco (Indiana, IN, USA)Polymer blendDrift guard0.25
Table 2. Surface tensions and viscosities of adjuvants that were measured at the recommended concentration with water.
Tap
Water
Control DuoControl WMKantorControlStarguarSterlingSurfeco Plus
Surface Tension (mN/m)75.23 ± 0.1 a21.94 ± 0.07 b40.57 ± 0.3 c45.49 ± 0.11 c47.19 ± 0.09 c34.81 ± 0.04 bc44.37 ± 0.14 c21.71 ± 0.06 b
Viscosity (mPa.s)1.00 ± 0.13 a4.27 ± 0.11 b2.74 ± 0.14 c1.52 ± 0.07 d1.42 ± 0.16 d1.63 ± 0.17 d1.38 ± 0.08 d3.24 ± 0.06 cd
Different letters in the same rows indicate significant differences at the p < 0.05 level.
Table 3. Comparison of droplet diameters of adjuvants and tap water obtained with XR11002 nozzle at different pressures and percentages of drift-prone droplets.
MixturePressure
(bar)
Dv0.5 (μm)<55 μm (%)<100 μm (%)<158 μm (%)Relative
Span
Tap Water31562.5619.9851.671.32
41493.9920.8153.331.34
51444.9524.8257.111.31
Control31921.239.0134.851.32
41661.7316.0845.181.33
51532.1421.3548.871.33
Control WM31831.5022.0838.741.36
41692.6422.2046.351.33
51562.9723.8051.791.34
Control Duo31851.5316.5537.031.63
41682.9222.6045.481.68
51473.1127.0253.971.64
Surfeco plus31911.4414.3333.991.29
41792.9222.6144.931.34
51593.0727.2849.821.31
Sterling31921.6317.6033.561.26
41783.0123.3641.711.32
51652.622.7847.331.31
Kantor31881.2713.2441.391.63
41823.4722.4844.521.63
51602.9021.9149.411.66
Starguar31911.1214.3233.821.42
41752.7622.2043.531.41
51663.3323.2046.971.43
Table 4. Effects of adjuvants on droplet diameter Dv0.5 and interactions.
Pressure (Bar)Tap WaterControlControl WMControl DuoSurfeco PlusSterlingKantorStarguar
Dv0.5
(μm)
Dv0.5
(μm)
Dv0.5
(μm)
Dv0.5
(μm)
Dv0.5
(μm)
Dv0.5
(μm)
Dv0.5
(μm)
Dv0.5
(μm)
3156 ± 0.2 a192 ± 0.1 c183 ± 0.3 b185 ± 0.1 b191 ± 0.2 c192 ± 0.4 c188 ± 0.4 bc191 ± 0.2 c
4149 ± 0.3 a166 ± 0.2 b169 ± 0.3 b168 ± 0.2 b179 ± 0.4 c178 ± 0.3 c182 ± 0.2 c175 ± 0.1 c
5144 ± 0.4 a153 ± 0.4 bc156 ± 0.1 c147 ± 0.1 ab159 ± 0.3 c165 ± 0.1 d160 ± 0.3 c166 ± 0.3 d
InteractionsFdFp
Pressure *16.5220.00
Adjuvant *3.6370.03
Pressure × Adjuvant *1.55140.00
Different letters in the same rows indicate significant differences at the p < 0.05 level. F values and significance level; * p < 0.05 significance.
Table 5. Statistical comparison of the calculated spray pattern displacement values and interactions.
Pressure (Bar)Wind Velocity (M/S)Tap WaterControl DuoControl WMKantorControlStarguarSterlingSurfeco Plus
Dc (cm)Dc (cm)Dc (cm)Dc (cm)Dc (cm)Dc (cm)Dc (cm)Dc (cm)
3224.28 a13.21 b12.01 b14.76 b12.34 b13.08 b16.20 c16.01 c
33.527.84 a14.63 b12.48 b15.26 b17.07 bc13.46 b20.86 c18.20 c
3529.35 a15.87 b18.25 c19.75 c19.75 c16.74 b18.38 c20.20 c
4228.19 a13.23 b13.33 b15.31 b14.68 b13.21 b15.53 b14.85 b
43.532.23 a13.87 b14.63 b16.29 bc16.86 bc16.66 bc16.55 bc18.09 c
4533.85 a15.06 b17.69 b18.76 bc20.87 c15.64 b17.58 b21.39 c
5231.25 a13.36 b14.52 b14.05 b14.64 b14.09 b14.53 b17.66 b
53.533.37 a13.17 b13.71 b15.94 b18.48 bc15.11 b14.81 b19.92 c
5534.05 a14.95 b16.36 b17.71 b17.14 b17.42 b16.94 b23.21 c
InteractionsFdfp
Pressure *0.3620.03
Wind Velocity *9.7420.01
Pressure × Wind Velocity *0.1540.03
Different letters in the same rows indicate significant differences at the p < 0.05 level. F values and significance level; * p < 0.05 significant.
Table 6. Ground drift reduction percentages (%) of adjuvants compared to the reference water spray.
Pressure (Bar)Wind
Velocity (M/S)
Control Duo (%)Control WM (%)Kantor
(%)
Control (%)Starguar (%)Sterling
(%)
Surfeco Plus (%)
3245.5750.5339.2049.1846.1233.2734.04
33.547.4655.1645.1738.6851.6525.0634.63
3545.9537.8332.7232.7042.9737.3831.17
4253.0552.7245.6747.9153.1444.9047.31
43.556.9754.6249.4447.7048.3248.6443.86
4555.5047.7544.5738.3553.7948.0636.82
5257.2653.5555.0453.1754.9253.5143.48
53.560.5358.9352.2244.6354.7255.6140.31
5556.0951.9548.0049.6548.8650.2531.84
Table 7. The drift potential (DP) and drift potential reduction percentage (DPRP) values for each adjuvant.
Control DuoControl WMKantorControlStarguarSterlingSurfeco Plus
Pressure (bar)Wind Velocity (m/s)DPDPRP (%)DPDPRP (%)DPDPRP (%)DPDPRP (%)DPDPRP (%)DPDPRP (%)DPDPRP (%)
326.76−0.021.5277.556.217.991.1882.582.7759.025.3420.901.7773.82
33.57.7439.622.1483.307.4941.621.9185.132.6379.465.6855.722.2582.45
3512.9535.543.7581.338.1359.556.0669.843.3783.2511.7341.602.8685.76
427.1635.392.8474.367.4033.211.9882.092.9173.747.3333.842.4877.66
43.59.5341.742.6483.869.5441.674.7970.713.4079.228.7846.363.5478.37
4520.752.824.9776.728.8958.377.8463.274.2680.0413.1138.605.7972.88
5214.58−15.292.9876.438.9429.353.7670.293.3473.575.2258.743.3573.56
53.522.93−26.836.1965.7812.3831.516.4064.625.0971.839.4048.043.9678.11
5524.393.056.1675.5112.1051.929.6461.695.9276.4616.7233.524.8980.55
Publisher’s Note: MDPI stays neutral with regard to jurisdictional claims in published maps and institutional affiliations.

