Article

Land Use Land Cover Change Analysis for Urban Growth Prediction Using Landsat Satellite Data and Markov Chain Model for Al Baha Region Saudi Arabia

by
Mohammad Alsharif
1,
Abdulrhman Ali Alzandi
2,
Raid Shrahily
1,* and
Babikir Mobarak
3
1
Department of Architecture, College of Engineering, Al-Baha University, Prince Mohammad Bin Saud Road, Al-Baha 65527, Saudi Arabia
2
Biology Department, Faculty of Arts and Science in Qilwah, Al-Baha University, Qilwah 65779, Saudi Arabia
3
Department of Civil Engineering, College of Engineering, Al-Baha University, Prince Mohammad Bin Saud Road, Al-Baha 65527, Saudi Arabia
*
Author to whom correspondence should be addressed.
Forests 2022, 13(10), 1530; https://doi.org/10.3390/f13101530
Submission received: 17 August 2022 / Revised: 15 September 2022 / Accepted: 16 September 2022 / Published: 20 September 2022

Abstract

:
Land Use Land Cover Change (LULCC) and urban growth prediction and analysis are two of the best methods that can help decision-makers for better sustainable management and planning of socioeconomic development in the countries. In the present paper, the growth of urban land use was analyzed and predicted in all districts of the El Baha region (Kingdom of Saudi Arabia) based on high-resolution Landsat, 5, 7, and 8 satellite imagery during the period of study between 1985–2021. Using remote sensing techniques, the LULCC were obtained based on the maximum likelihood classification (MLC), where the geographic information system (GIS) had been used for mapping LULCC classes. Furthermore, Markov cellular automata (MCA) in Idrisi TerrSet was applied for assessing the future growth of urban land use between 2021–2047. The findings of the LULCC analysis based on the MLC indicate great socioeconomic development during the study period and that the urban expansion was at the expense of rangeland, forest and shrubland, and barren land and sand areas, with the contribution of each in the built-up area estimated to be around 9.1% (179.7 km2), 33.4% (656.3 km2) and 57.5% (1131.5 km2), respectively. The simulation of the future LULCC period 2021–2047 revealed a loss in rangeland, forest and shrubland, and barren land and sand by 565, 144 and 105 km2, respectively, where rangeland is the most influenced, its land cover will decrease from 4002 to 3437 km2. From the obtained results based on MCA, urban growth is predicted to be large and it is estimated at around 2607 km2 until the year 2047 with a net increase of 811 km2. The results obtained from this study may provide information to help decision-makers to implement efficient practices for future planning and management of the growth of urban land use, especially Saudi vision 2030.

1. Introduction

Land Use Land Cover Change (LULCC) is the modification of the Earth’s surface by humans. Work to find the solution to the negative effects of such changes is ongoing despite humans being the root of the problems caused. LULCC is one of the primary contributors of greenhouse gas stocks resulting from direct human use of lands for commercial uses, settlements, and forestry activities [1,2]. This means that any change in the Earth’s cover will have effects on the global carbon cycle, whether by increasing or decreasing the amount of carbon dioxide (CO2) in the atmosphere, especially as CO2 is a factor influencing global warming because it is a warming gas that has an important effect on the Earth’s surface temperature [3]. Over the past 40 years, Gatti et al. [4] found that in the eastern part of Amazonia the total carbon emissions are greater than in the western part, and this explained that eastern Amazonia has been exposed to more moisture stress, warming, and deforestation than the western Amazonia part, particularly in the dry season.
The areas of the Earth’s surface that have good conditions for life are limited, while the population is growing rapidly, needing more residential and agricultural land to produce food. Some of the positive effects of urbanization include job creation, technological and infrastructure advancement, improved transportation and communication, higher quality educational and medical facilities, and improved quality of living. This leads to the emergence of wealth in cities, making urbanization the key to economic development. However, urbanization may cause air and water pollution, waste disposal problems, high energy consumption, land degradation, and biodiversity loss [5]. The relationship between maternal health care and urban advantage has been examined in Developing Countries by [6]. The results indicated that despite the proximity of poor urban areas to various services, they do not necessarily have better access to such services, which means that different strategies are required to achieve full coverage for the health protection of women and their babies. Dynamics among urbanization, economic growth, and environmental sustainability in the thirty International Energy Agency (IEA) countries were analyzed by [7] focusing on the role of industry value-added. The findings revealed that capital formation and industrial value-added improved environmental sustainability. Nevertheless, in the long run, urbanization, population growth, economic growth, and biocapacity damage environmental sustainability. This is why, policy and decision-makers in the countries of the IEA are encouraged to establish policies that raise ecological awareness, sustained lifestyles, clean technological innovations, consumption measures, efficient production and enlargement of cities to reduce and limit the negative effects of urbanization = on environmental sustainability. Liang and Yang [8] analyzed the relationship between economic growth, urbanization, and environmental pollution in China during 2006–2015. The findings revealed that urbanization boosts economic growth through human capital, knowledge capital, and accumulation of physical capital and that the link between urbanization and economic growth is a benign interaction, while urbanization can be negatively affected by environmental pollution. Furthermore, the dynamic linkage between urbanization, natural resources, economic growth, human capital, and ecological footprint in China has been analyzed by [9]. The study shows that urbanization and natural resources increase the ecological footprint, whereas human capital decreases environmental degradation. The interaction between human capital and urbanization also reduces environmental deterioration. For ASEAN countries, an empirical study was used for assessing the relationship between economic growth and urbanization [10]. The results indicate a causal relationship between economic growth and urbanization, and this is in a positively non-linear manner estimated at around 69.99 and 67.94 percent for the static and dynamic models respectively. From the evidence of Asian and African emerging economies, the nonlinear impact of technology, economic growth, urbanization and trade on the environment was assessed [11]. The study displays a reversed u-shape relationship that occurs between urbanization and environmental degradation, economic growth, technology and degradation, and trade openness. Ref. [12] used an empirical method for urbanization impacts analysis on carbon emissions from the Organization for Economic Co-operation and Development (OECD) countries. The influence is relatively weak, with all participant countries having succeeded in the decoupling of carbon emissions and urbanization. Urbanization’s impact on agriculture in China and India has been studied by [13]. The report indicates that there is a decline in agricultural land because of orientation toward cash crops, with the investigation documenting that the problem is due to poor urban management not as a result of urbanization itself. Urbanization impacts trends in the production of key staple crops in China (rice), Nigeria (maize), and Indonesia (rice) [14]. The results revealed that 30–40% of more productive cropland has been converted by urbanization compared to new cropland, where this cropland loss may influence future projections of food production potential.
Based on the scientometric analysis in CiteSpace [15], several studies have been published on LULCC, sustainable urbanization, and urban growth analysis [16,17,18,19,20]. The simulation of dynamics of urban land use and cover of Addis Ababa and the surrounding area was conducted using MCA approach by [21]. The results revealed the rapid growth of built-up areas, around 3.7, 5.7 and 7.0% in 2005, 2011 and 2015, respectively. This rapid expansion of built-up areas reduced and destroyed other LULCC classes such as forests, water bodies and cultivated land. In the megacity of Mumbai, India, the spatial and temporal urbanization processes were analyzed using MCA based on remote sensing (RS) databases collected between 1973–2010 and 2020–2030 [22]. The multi-temporal change detection results revealed that between 1973 and 1990 there was an increase in urban growth rates of 142%. In contrast, a decrease occurred between the periods of 1990–2001 and 2001–2010 from 40 to 38%, respectively. Compared to the year 2010, growths in built-up areas of 26 and 12% may be observed by 2020 and 2030, respectively. LULCC dynamics and modeling of urban land expansion in the cities of the Kathmandu valley and their surroundings were analyzed by [23] using Landsat databases, MCA and GIS during 1988–2016 and 2016–2032. The results illustrate a significant expansion in urban cover at the expense of cultivated land estimated to be around 40.53 km2 in 1988, which augmented to 144.35 km2 in 2016 with an overall increase of 346.85%. The urban area is predicted to increase to 200 and 238 km2 and cultivated land will reduce to 587 and 555 km2 by 2024 and 2032 respectively. In the city of Rajshahi, Bangladesh, geospatial modelling of LULCC dynamics was analyzed between 2000–2020 and 2020–2040 by [24] using a combination of multi-layer perceptron (MLP) and Markov chain (MC) modelling. The results indicate more than 85% overall accuracy, with 30% urban expansion observed in the north, northeast and northwest directions, where the green cover may reduce in the future (2030) by 17%. Ref. [25] simulated the spatial and temporal future urban growth trends using MCA in Seremban (Malaysia) from 1984 to 2010. The simulation revealed an increase in urban areas by 177 km2 in 2020 and predicted a potential increase to 195.5 km2 by 2030. In the city of El Jadida, Morocco, LULCC between 1999–2018 and urban growth for 2010–2040 using MCA were studied [26]. The results revealed an increase in built-up areas of19.8 km2, with 12.8 km2 of this growth being at the expense of bare soil, followed by vegetation cover of 7.1 km2. The future simulation indicates that the built-up area may reach 43.8 km2 by 2040.
Saudi Vision 2030 is a development plan started by the Saudi government in 2016 which aims to bring the country out of its historical oil rent by diversifying its economy and resorting to various privatizations [27]. This plan was developed to respond to the budgetary difficulties encountered by the Kingdom of Saudi Arabia following the sharp drop in oil prices in 2014 [28,29]. Despite this, there have only been a few studies focused on the kingdom of Saudi Arabia in the framework of current and future LULCC and urban planning [30,31,32,33,34,35] compared to its area, geographic position and natural resources. In the city of Jeddah, Saudi Arabia, spatial-temporal changes in transportation and urban growth using RS databases and GIS were analyzed [36]. The results show that the city of Jeddah has experienced rapid population growth and expanding transportation infrastructure with rapidly changing land use, where population growth has caused spatial expansion and travel demand to rise. Using Landsat databases of 1985, 2000 and 2014, an evaluation of urbanization impact and LULCC in three cities of Saudi Arabian: Riyadh, Makkah and Jeddah was conducted [37]. The findings revealed that built-up areas had the most converted land cover, with the greatest change to bare soil, and the seasonal change in vegetation cover was linked to climate conditions. In addition, agricultural lands were considerably decreased and changed in bare soil areas because of declining groundwater resources between 1985 and 2014. Ref. [38] used the Markov cellular automata (MCA) in geospatial analysis for investigating and predicting urban growth in the city of Arriyadh (Saudi Arabia) during the periods of 1987–2017 and 2017–2047. The findings show a rise in urban areas by 82.9% based on the maps of 1987 and 2017, where the future simulation of urban growth also indicates an increase of 38.2%.
The Al-Baha region is considered the smallest region in the Kingdom of Saudi Arabia, with an area of 10,362 km2. The area is characterized by its topography, parks and forests, which contain a variety of natural vegetation. According to a review of the current literature, there are no sufficient and comprehensive studies that deeply discussed LULCC and the urban growth of the Al Baha region that can help decision-makers to improve their planning for good practices, especially considering the aims of Saudi vision 2030. In this paper, a combination of remote sensing datasets and CA-Markov chain models were used to understand LULCC changes during 1985 to 2021 at five-year intervals. Furthermore, the model was employed for urban prediction in the El Baha region during 2047.

2. Study Area

The Al-Baha region is one of the thirteen administrative regions that make up the Kingdom of Saudi Arabia, the most important of which are al-Mandaq, e Buljurshi, al-Qara, alAqiq, al-Makhwah, Qelwah and al-Baha City (Figure 1). It is located in the southwestern part of the Arabian Peninsula, on the Hijaz mountain range, near the Red Sea. It is located between the longitudes 41/42 east and between the latitudes 19/20 north (Figure 1), with an area of approximately 11,000 km2. Figure 1 shows the Al Baha region and its districts. It is considered one of the best regions of the Kingdom regarding tourismThe Al-Baha region borders the Makkah region to the north, west and south, and the Asir region to the east.
The Al-Baha region is considered the smallest region in the Kingdom of Saudi Arabia. Its population is distributed over about 1200 villages. Nine districts belong to the Al-Baha region (Al-Baha City, al-Mandaq, Buljurshi, al-Qara, alAqiq, al-Makhwah, Al-Hajra, Qelwah and Beni Hassan), with a population size of approximately 487,108 people.
In general, the climate of the Al-Baha region is considered to be arid, but the climate is moderately cold in the winter, and good throughout the rest of the seasons. The humidity in the region ranges between 52% and 67%. The average temperature is 23 °C and the minimum is 12 °C, with the average rainfall in the Hijaz mountains ranging from 229 mm to 581 mm. Within the scale of the study area, there are more than 17 water reservoir dams located at Madhas and Beedah that have a capacity of 3,000,000 m3, with 86% of this water storage utilized for irrigation [39]. According to [40] more than 14 dams were constructed between 2008–2012 in the El Baha region. This explains the great efforts made by the kingdom of Saudi Arabia in the framework of sustainable water resources management.
The topography of the region is mostly mountains known as the Hijaz Mountains, and the mountainous areas are covered almost entirely by local coniferous juniper trees, in addition to many types of fruit trees, bushes, small shrubs, forests and flowers such as candi, basil, jasmine, Hijazi rose (Aqsh, raspberry) and Arfaj. Spreading on its slopes are terraces and agricultural terraces in which the residents grow the plants of the region that they rely on for food, such as sorghum, barley, wheat, millet, sesame, lentils, and local vegetables such as pumpkin, potatoes, carrots, tomatoes, peppers, and others. Figure 2a–f shows maps of the slope, aspect, hill shades, contours, distance from the road and distance from the river. These maps will be used as inputs in TerrSat software to improve the accuracy of LULCC and urban growth prediction.

3. Materials and Methods

3.1. Remote Sensing Databases

In this study, the normalized difference vegetation index (NDVI) was applied to various Landsat imagery between 1985–2021 in order to assess LULCC in the framework of urban sprawl or urban growth. The different Landsat imagery: Thematic Mapper (TM), Enhanced Thematic Mapper (ETM) and Operational Land Imager (OLI) used in this analysis are represented in Table 1. The downloaded imagery between 2004 to 2013 is poor in terms of quality, this is why the years 1985, 1990, 1995, 2000, 2015 and 2021 have been selected for the analysis.
High spatial resolution satellite imagery (Landsat, SPOT, Ikonos, Quickbird, etc.) is used in many applications relating to the study of the Earth’s biosphere. Seven Landsat satellites have been launched since 23 July 1972. The last, Landsat 8, was launched in 2013. Instruments on board Landsat satellites have acquired several million images. They are unique resources for studying climate change, land use, mapping, and habitat management; as well as for many other applications in the fields of agriculture, geology, forestry, and education, for example, Landsat 8 is a collaboration between the United States Geological Survey (USGS) and NASA. NASA’s Goddard Space Flight Center in Greenbelt, Maryland is providing development, mission systems engineering, and launch vehicle acquisition, while the USGS provides ground systems development and continues mission operations.
The Landsat 8 satellite includes two types of sensors: OLI (Operational Earth Imager) and TIRS (Thermal Infrared Sensor). OLI includes all ETM+ domains. In order to avoid some characteristics of atmospheric absorption, OLI reset the bands, with relatively large modifications. The databases of LANSAT databases used in this analysis were obtained from [41].

3.2. The Normalized Difference Vegetation Index

The Normalized difference vegetation index (NDVI) is a standard indicator that allows for the creation of an image that displays greenness or relative biomass. This indicator benefits from the strong absorption by chlorophyll in the red band and the high reflectance from plant materials in the near-infrared (NIR) band [42], where reflectance is the ratio of solar energy reflected from the surface to incident energy, also called albedo.
This index defines values from −1.0 to 1.0, and represents mainly the vegetation, negative values are formed mainly from clouds, water and snow, and values close to zero are formed mainly by rocks and bare soil. Very small values (0.1 or less) correspond to empty areas of rock, sand, or snow. Medium values (from 0.2 to 0.3) represent shrubs and meadows. Values from 0.3 to 0.6 explain moderate vegetation, while large values (from 0.6 to 0.8) indicate temperate and tropical forests [43].

3.3. The Maximum Likelihood Classification

The maximum likelihood classification (MLC) is one of the most frequently used supervised classifications, which states that every spectral class can be defined by a multivariate normal distribution and is founded on Bayes’ theorem [44]. It consists of comparing the spectral signature of each pixel in the selected bands (in our case: NDVI, blue, green, red and near-infrared) with that of the Regions of Interest, then assigning each pixel to the class to which the spectral signature is closest. The comparison between the values of each pixel and the spectral signatures of the different classes will determine the probability of the pixel belonging to each of the classes. The class presenting the maximum probability will be assigned to the pixel being considered [45]. According to Richards [46], ENVI (Environment for Visualizing Images software) implements MLC by computing for each pixel in the image the subsequent discriminant functions as follows:
g i x = l n p ω i 1 2   l n i 1 2   x m i T i 1 x m i                                                            
i: is the class
x: n is the number of bands
p ω i : is the probability that class ω i occurs in the image and is assumed the same for all classes
i : is a factor of the covariance matrix related to the data in ω i
Σi−1: is the reverse matrix
mi is the mean vector
Further details regarding the theoretical and mathematical implementation of MLC are provided in [47,48,49].

3.4. The Cellular Automata Markov Chain Model

A Markov chain (MC) is a term in mathematics that took the name of its Russian innovator, Andrea Markov. It is a stochastic process with a Markovian property. In such a process, the future is predicted from the present and does not need to know the past. A Markov chain follows a conditional probability distribution called the probability transition by-step in the process. The probability of transition in two, three or more steps is obtained from the probability of transition in one step [50]. In geography, According to Ferchichi [51], the Markov process controls the temporal dynamics between occupation types through the use of transition probabilities. The spatial dynamics are controlled by local rules through a cellular automata (CA) mechanism by considering either the neighborhood configuration or the transition probabilities. The Cellular Automata Markov Chain (CA-MC) model was first reported in 1980. It is included in Land Change Modeler which is an innovative tool proposed by Clark Labs University as TerrSet software for land planning. It is a decision support tool that simplifies and analyses the complexities of future land change scenarios for better habitat assessment and resource management. The computation of land use prediction is obtained according to the following equation:
S   t ,   t + 1 = P i j + S t
where, S t and S t + 1 are the status of the system at the time t and t + 1 , respectively and P i j is the matrix of transition probability in a state, it is given as follows [52]:
|| P i j || = P 1 , 1 P 1 , 2   P 1 ,   N P 2 , 1 P 2 , 2   P 2 N         P N , 2 P N , 2   P N , N
Pij: explains the probability of changing from the present state i to the next time state j. e. The low and high transition have a probability close to ‘0 and 1’, respectively [52,53]. In the case of this paper, the probability matrix was computed for the period 1985–2021 to elaborate the probability matrix for land cover change for the year 2047. This prediction was calculated based on the cross tabulation of the two land use maps. After this the CA has been applied using the following equation [52]:
S   t ,   t + 1 = f   S   t ,   N
where, S t + 1 is the status of the system at the time t + 1 , operated by the state probability at all times.
In the first stage of elaborating the model, land-use maps of 1985, 1990, 1995, 2000, 2015 and 2021 were extracted from the Landsat satellite imagery. LULCC maps of 1985 and 2021, have been taken (Figure 3) as input into the model, to assess conversion area matrices and conversion probabilities (CP using MC analysis. According to Sarkar and Chouhan [54], in the second stage, a set of conditional probability images (CPI) were obtained using the transition matrix. The CPI generally gives the suitability of cell change for specific land classes [54]. In the last stage, the land-use map of 2021 is used as a base map, the conditional probability images of 1984–2021, matrix conversion probabilities, digital elevation par, distance from the road map, and distance from the river map (Figure 1 and Figure 2) were used as input to simulate and predict the LULCC map of 2047 using multilayer perceptron with default parameters including 7 hidden layers.
Figure 3 illustrates the flowchart using LULCC analysis and urban growth, where the various stages are described as follows:
  • The first stage was the download of the Landsat databases and SRTM imageries from the USGS site.
  • Imported Landsat databases to the ENVI 5.1 software and opened radiometric calibration for atmospheric correction of satellite imageries using Fast Line-of-sight Atmospheric Analysis of Spectral Hypercubes (Flaash), which is a tool in ENVI 5.1 that corrects wavelengths in the visible through to near-infrared and shortwave infrared areas.
  • After atmospheric correction, the maximum likelihood classification method was applied to produce LULCC results and mapping (net change, gain, loss and, persistence).
  • The obtained results from ENVI 5.1 of LULCC were exported to Arcgis to improve the mapping observation and to improve the results management.
  • Produced DEM, slope, aspect, hill shades, contours, distance from the road and distance from river maps using Arcgis based on SRTM imagery and used them as input in the prediction process.
  • Opened land change modeler of TerrSet software, imported and inserted the LULCC maps of the years 1985 and 2021 and maps that were produced from STRM imagery
  • Finally, transition potential and change prediction tools were run for the year 2047 to obtain a future LULCC map.

4. Results

The results of LULCC obtained from MLC of the years 1985, 1990, 1995, 2000, 2015 and 2021 are represented in Figure 4. The MLC gives five classes as follows: water bodies, rangeland, barren land and sand, forest and shrubland and urban area. In this case the urban area or built-up area include houses, roads, banks, shops, airports, administration, and military buildings.
The LULCC map of the year 1985 (Figure 4) indicates that there are no water bodies in the study area, which indicates that there was an insufficient number of water storage dams in the ElBaha region during this period, e although the Beedah and Madhas dams existed, their capacity did not exceed 3 million m3 [38]. In addition, according to [39], in the Kingdom of Saudi Arabia, there are no natural surface water resources. The LULCC map analysis based on the Landsat imagery of the year 1990 indicates that the water bodies area which was approximately 1 km2 (Figure 4 and Figure 5), decreased to 0.32 km2. This could be explained by the temporal effects of the areas climate conditions and the dry season, as in the year 2000, the water bodies returned to their original area of 1 km2 (Figure 5). The LULCC maps for the years 2015 and 2021 show the great increase observed in water bodies’ area by 3.52 km2 and 3.47 km2, respectively explaining 0.03% of the total area of land cover (Figure 4 and Figure 5). This increase can be explained by the great efforts of the Kingdom of Saudi Arabia in the framework of sustainable development of water resources, with the Al-Baha area containing 34 dams according to the latest statistics. Between the years 2008–2012, it is reported that 14 dams had been constructed in the El-Baha province [39], with three of those dams having a capacity between 8–68 million m3, these were Tharad concrete dam (2008), Alahseba earth filled dam (2011) and Wadi Arda concrete dam (2012). However, the lack of surface water, which is represented by the running rivers, prevent the possibility of utilizing the dams to provide electrical energy. As the dams in the study area depend entirely on rainwater, the establishment of seawater desalination and wastewater treatment using high technology is one of the current solutions, especially with the climate change and long-term drought. For this reason, the Kingdom must find other alternative sources to produce water and energy through the Saudi Vision 2030.
The LULCC map analysis of the year 1985 revealed that the rangeland area was estimated to be around 5082 km2 (47.55%). This area has increased by 689 km2 to an area of 5772 km2 (Figure 4 and Figure 5). Conversely, the LULCC maps of the years 1990, 1995, 2000, 2015 and 2021 illustrate that the rangeland areas have decreased from 5772 km2 to 4002 km2 explaining a change from 51% to 36% of a reducing area by 15% during 1990–2021 (Figure 4 and Figure 5). In this framework, the Kingdom of Saudi Arabia decided to stop the cultivation of green fodder in the country, in response to a government decision published in 2015, which demanded to permanently stop the cultivation of alfalfa in areas exceeding 50 hectares, due to its high cost and depletion of scarce water resources. In general, the loss of the rangeland area may be explained by the agricultural expansion and desert encroachment, as well as the continuous deterioration in its productivity for reasons related to environmental conditions such as frequent droughts, fluctuation in rain rates and irrational exploitation of this natural resource. Saudi Arabia is attempting to achieve its food security by purchasing agricultural land in several regions of the world, especially in Africa, Argentina, and even the United States, in order to produce wheat, barley, rice, corn and animal feed and ship it to the country instead of importing it from international producers. In the sections below, the causes of rangeland loss will explain in detail.
According to Figure 4 and Figure 5, the barren land and sand area had high temporal variability during the study period and was estimated to be around 608, 614, 263, 1199, 1240 and 639 km2 for the years 1985, 1990, 1995, 2000, 2015, and 2021, respectively. The barren land and sand area decreased from 1990 to 1995 by 351 km2. This decrease can be linked to the climate conditions during this period. Furthermore, a significant increase was observed in the barren land and sand area to 1240 km2 between the period 2000–2015 explaining 2.37 to 11% of the total area of the El Baha region (Figure 4 and Figure 5), this suggests that the rangelands area and deterioration of forests were converted to barren land and sand and built-up areas during this period. The Kingdom of Saudi Arabia is one of the countries that suffers greatly from the phenomena of desertification and drought, as the various regions of the Kingdom have a dry climate characterized by lack and irregularity of rainfall, high temperatures and frequent droughts. The situation becomes more complicated with the encroachment of sand and the spread of desertification which has led to land degradation and low productivity [55]. Between the years 2015 and 2021, the barren land and sand area was reduced from 1240 to 639 km2 (Figure 4 and Figure 5), this is due to the positive results of the Saudi vision 2030 launched by the Kingdom of Saudi Arabia in 2016 to combat climate change and desertification and to protect the environment, reduce carbon emissions and plant billions of trees inside the Kingdom and in the Middle East in the coming decades. The “Green Saudi Initiative” and the “Green Middle East Initiative”, which will be launched soon, will chart the direction of the Kingdom and the region in protecting the land and nature. These initiatives will provide clear and ambitious objectives and will contribute strongly to achieving global goals [56,57,58].
The forest and shrubland area maps analysis illustrated high temporal variability in this class during the study period which had been estimated to be 5399 (48%), 4672 (42%), 5163 (45%), 5103 (46%), 4342 (39%), 4477 km2 (40%) in the years 1985, 1990, 1995, 2000, 2015, 2021, with the greatest decrease observed in the last decade (Figure 4 and Figure 5). The results revealed that the forest and shrubland area has lost approximately 8% (from 5399 to 4477 km2) from its contribution to the cover land area (classes) of the El Baha region (Figure 4 and Figure 5). This is because the topography of the region is most difficult to live in, and some agricultural and forest areas have been seized due to the poor coordination between the executive sectors specialized in monitoring these natural resources. According, to [59], the forests in the city of Al-Baha were affected by urban sprawl, while the southern parts of Raghadan Forest and Shahba Forest were affected by modern projects and buildings, and the northern parts were affected by the expansion of Bani Saad neighborhoods. Finally, forests were affected by excessive logging where trees were cut down for cooking and trade or as an indicator of the social well-being of families. In addition, many forests have been damaged by human threats such as fires. The results obtained in the next section support these interpretations.
One of the specific aims of the present study was to analyze and assess the built-up area or the urban area at the scale of each district of the study (Qelwah, Elmelkhwah, Elmandaq, ELBahah, Baljurish, Alatawlah and Alaqiq). Further to the results of Figure 4 and Figure 5, Figure 6, Figure 7, Figure 8 and Figure 9 explain in depth the development and expansion of the built-up area in km2 and the percentage (%) at the expense of other lands cover each year for each district of the El Baha region. The LULCC map revealed that the built-up area between the years 1985 and 2000 does not exceed 296 km2 (2.67%), whereas it was estimated in the year 1985 to be 15 km2 (0.13%). The findings obtained from LULCC for the years 2015 and 2021 show a great increase and large expansion of the built-up area of approximately 1089 (9.8%) and 1982 km2 (17.85%), respectively (Figure 6). This latter observation was observed at all scales of El Baha districts (Figure 6, Figure 7 and Figure 8), with the most built-up developments exceeding 60% have been observed during the last decade (Figure 6, Figure 7 and Figure 8). For example, the total area of Alaqiq is 3100 km2 (Figure 1), with the built-up area in 2021 estimated to be at around 661 km2, it is considered the most urbanized district, followed by Baljurish with a total built-up area of 491 km2. The district of El Bahah is the capital of the study area, it has had significant urban growth and economic development since 2010 (Figure 6, Figure 7 and Figure 8) compared to its surrounding area (Figure 1). This growth led to the development of the road sector in the Al-Baha region and the improvement of its quality index, as the Ministry has implemented many road projects in the region with a total length of up to 600 km, whose cost exceeds 2 billion riyals [60]. This urban and economic development is the result of decision-makers considering the Al-Baha region as one of the most important tourist areas in the Kingdom, as it has many attractive tourist components due to the beauty of nature and the moderate climate that made it the focus of the attention of Saudi, Gulf and Arab tourists.
The results of Figure 9a,b indicates that urban expansion was at the expense of rangeland, forest and shrubland, and barren land and sand, with the contribution of each one in the built-up area estimated to be around 9.1% (179.7 km2), 33.4% (656.3 km2) and 57.5% (1131.5 km2), respectively. This may agree with the aforementioned interpretation to explain that the loss in the rangeland area may be due to agricultural expansion and desert encroachment. Despite the loss in forest and shrubland (2580 km2), the analysis revealed that the land cover regained (1658 km2) a lot of its area as a result of the awareness campaigns and the initiatives mentioned previously (Figure 9c). The change and persistence maps of three classes (rangeland, forest and shrubland, and barren land and sand) that converted to the built-up area have been illustrated in Figure 10 and Figure 11. The analysis shows that the most influenced land cover is the forest and shrubland area of ElBahah, Alaqiq, Baljurish and the southern part of Alatawlah districts (Figure 10).
The analysis of losses and gains areas in the barren land and sand class revealed that Alaqiq and the northern part of Baljurish have the greatest loss of this type of land cover (Figure 11). Conversely, barren land and sand areas have been observed in the southern part of Qelwah and Elmelkhwah districts (Figure 11). The comparison between losses and gains of rangeland and forest and shrubland areas indicates that there is a conversion relationship between them (Figure 11), where large areas of forest and shrubland have been lost in all districts of the El Baha region, especially the northern part of Alaqiq (Figure 11). Conversely, a gain in rangeland was observed in the other parts of the El Baha region. On the other hand, the forest and shrubland areas presented great gains which were mostly observed in the northern part of Alatawlah and Baljurish and the southern areas of Alaqiq, at the expense of the rangeland class (Figure 11). According to [61], persistence explains the areas where no change (no transition) occurred or the areas that indicate change a in LULCC classes, this is represented by a cross-classification map (Figure 11). Based on the analysis, more than 60% of the total area of the El Baha region has changed during the period study 1985–2021.
Cellular Automata–Markov Chain (CA-MC) is the most used model for LULCC and urban growth prediction for better sustainable management and planning of socioeconomic development [37,53,62,63,64,65]. In this section, the spatial urban land-use growth was predicted and assessed using TerrSet software based on the CA-MC model for the next period of 25 years between 2021–2047. The simulation of LULCC of the various classes: water bodies, rangeland, barren land and sand, forest and shrubland and built-up area during 1985–2021 indicated a high increase of built-up area at the expense of barren land and sand, especially rangeland, forest and shrubland. The results obtained from LULCC prediction during the period 2021–2047 are represented in Figure 12, Figure 13, Figure 14 and Figure 15 and Table 2.
The simulation of the future LULCC period 2021–2047 indicates a good accuracy rate of 82%, the MLP running parameters and simulation results from TerrSet are given in Table 2. Furthermore, the analysis revealed a loss in rangeland, forest and shrubland, and barren land and sand by 565, 144 and 105 km2, respectively (Figure 13 and Figure 14). The rangeland is the most influenced, where its land cover will decrease from 4002 to 3437 km2, while the forest and shrubland, and barren land and sand area will not decrease significantly compared to rangeland area and have a predicted loss that does not exceed 144 km2 (Figure 13 and Figure 14). From the results, it seems that urban growth will be extensive at the expense of other land cover, and it is estimated using the CA-MC model to be around 2607 km2 until the year 2047 with a net increase of 811 km2 (Figure 13 and Figure 14) compared to the year 2021.
Figure 15 explains in detail the future growth of urban land use at the scale of each district of the El Baha region. The findings of the future simulation show that the Alaqiq district will have a great increase in the built-up area by 471 km2 from 661 and 1132 km2, followed by Baljurish, Qelwah and Elmandaq with a relatively non-significant increase of 77, 24, and 14 km2, respectively (Figure 15). On the other hand, the simulation of future urban growth of Elmelkhwah and ELBahah indicates that there is no increase in the built-up area. Thus, the results obtained from the prediction seem very realistic. Firstly, urban growth has been noticed in the northern parts (districts) of the study area explaining an urban growth toward the north (Alaqiq, Baljurish and Alatawlah). Secondly, the southern part of El Baha includes large areas of barren land which does not have good conditions for life. According to [66], the population of the Al-Baha region is unequally distributed, with the distribution of institution services and commercialization on one side, and the elevated nature of the area on the other, as it includes the Sarawat Mountains which account for two-thirds of the region’s population, with the rest in the Sahelian Tiyama. Major role transportation routes influence the distribution of the residents of Al-Baha region, with most of the population settled on the main road that passes through the cities of Taif, Al Baha and Abia (north-south). This road includes more than 50% of the population of the Sarawat Mountains, and the rest is distributed on the eastern road between Al-Baha and Alaqiq. This is consistent with the goals of the Kingdom, to link all the regions of Al-Baha with the northern part of the kingdom via the Taif region through a new transportation network. This will achieve the objectives of the national strategy for transport and logistics services which is a major and important factor in the programs of the Saudi Vision 2030.

5. Discussion

The Kingdom of Saudi Arabia has divided the urban planning process into three main stages. The first stage is the policy formulation and planning stage which was determined between the years (2001–2005), most of the discussions that took place during this time period were related to the general perception of the project and its planning aspects. The second phase is the design phase where the technical aspects and design elements were to be determined in this time period (2005–2007). The third stage is the implementation stage, which was determined after 2007 [67]. According to ‘’The New Urban Agenda” resulting from “The United Nations Human Settlements Program” in 2017, The Sustainable Development Goals (SDGs), which represent an action plan for the global commitment towards 2030, set 17 goals that it seeks to achieve, including the eleventh goal “sustainable cities and communities”. More interest and commitment are expressed in the New Urban Agenda, which was adopted in 2016 as a global vision for a better future, as it urges authorities and societies to reconsider current urban development practices and shift to more sustainable approaches and strategies [68,69]. According to the results obtained from this study and current studies, the kingdom of Saudi Arabia has had a great increase in built-up areas. For example, urban growth in Arriyadh city (Saudi Arabia) was analyzed and predicted [38]. The results show an increase in built-up areas by 82.9% during the period of study between 1987–2017, with the future urban growth simulation revealing a similar rise of 38.2%. Ref. [33], studied LULCC in Al-Taif and Makkah (Saudi Arabian). The analysis indicates an increase in built-up areas between the period of 1986–2013 of around 174% in Makkah and 113% in Al-Taif. Ref. [70] observed in the Al-Khobar region (Saudi Arabia) using Landsat databases that built-up areas increased by 117% and 43.51% between 1990–2001 and 2001–2013 respectively. In the city of Dammam (Saudi Arabia), the relationship between land surface temperatures (LST) LULCC changes has been analyzed by [35] using RS techniques and databases. The findings display an increase in built-up areas by 28.9% between 1990–2014, when the built-up areas had the maximum LST. From this research, it is recommended to direct urban expansion in the future to areas that are not suitable for agriculture and to develop policies related to land management and use.
In addition, During the period 1961–2017, global emission increases were governed by the three highest-emitting areas (sub-Saharan Africa, Latin America, and Southeast Asia) resulting from land-use change and by the extensive and rapid increase in agricultural production [71]. CO2 emissions linked with mangrove deforestation in Indonesia were analyzed by Arifanti et al. [72]. The alarming report indicates that if mangrove damage continues, significant quantities of greenhouse gases will be released into the air and will negatively influence biodiversity. Recently, the new results documented by the Intergovernmental Panel on Climate Change (IPCC) [73] revealed that deforestation is not only a significant contributor to the current greenhouse gas, but it is also estimated at around 13% of total human-caused CO2 emissions. Moreover, the changes in forest cover may significantly affect the local climate of neighboring areas more than global effects. Thus, the forests themselves are affected by climate change. In Far East Asian countries, Anwar et al. [74] assessed the CO2 emission from 1980–2017 based on urbanization and economic growth impact. The study indicates that economic, urbanization growth (the chemical and heavy industries) and trade openness significantly being key contributors to CO2 emissions. The report recommends planning more energy protection policies to reduce CO2 emissions. In the South Asian Association for Regional Cooperation (SAARC) countries, the impact of population size, urbanization and economic growth on housing carbon emissions were analyzed for the period 1994–2013 by Anser et al. [75]. The results indicate that the residential carbon emissions at first reduce with growth in urbanization, and then reach a turning point at 25.33% of the U-shaped relationship before rising with urbanization. Thus, decision-makers must pay more attention to future CO2 emissions for the protection of populations by powering economies with clean energy, replacing polluting coal- gas- and oil-fired power stations.

6. Conclusions

In this paper, Landsat satellite imagery of the El Baha region has been used during the periods of 1985–2021 and 2021–2047 for LULCC analysis and urban growth prediction. The obtained results have been summarized in the following points:
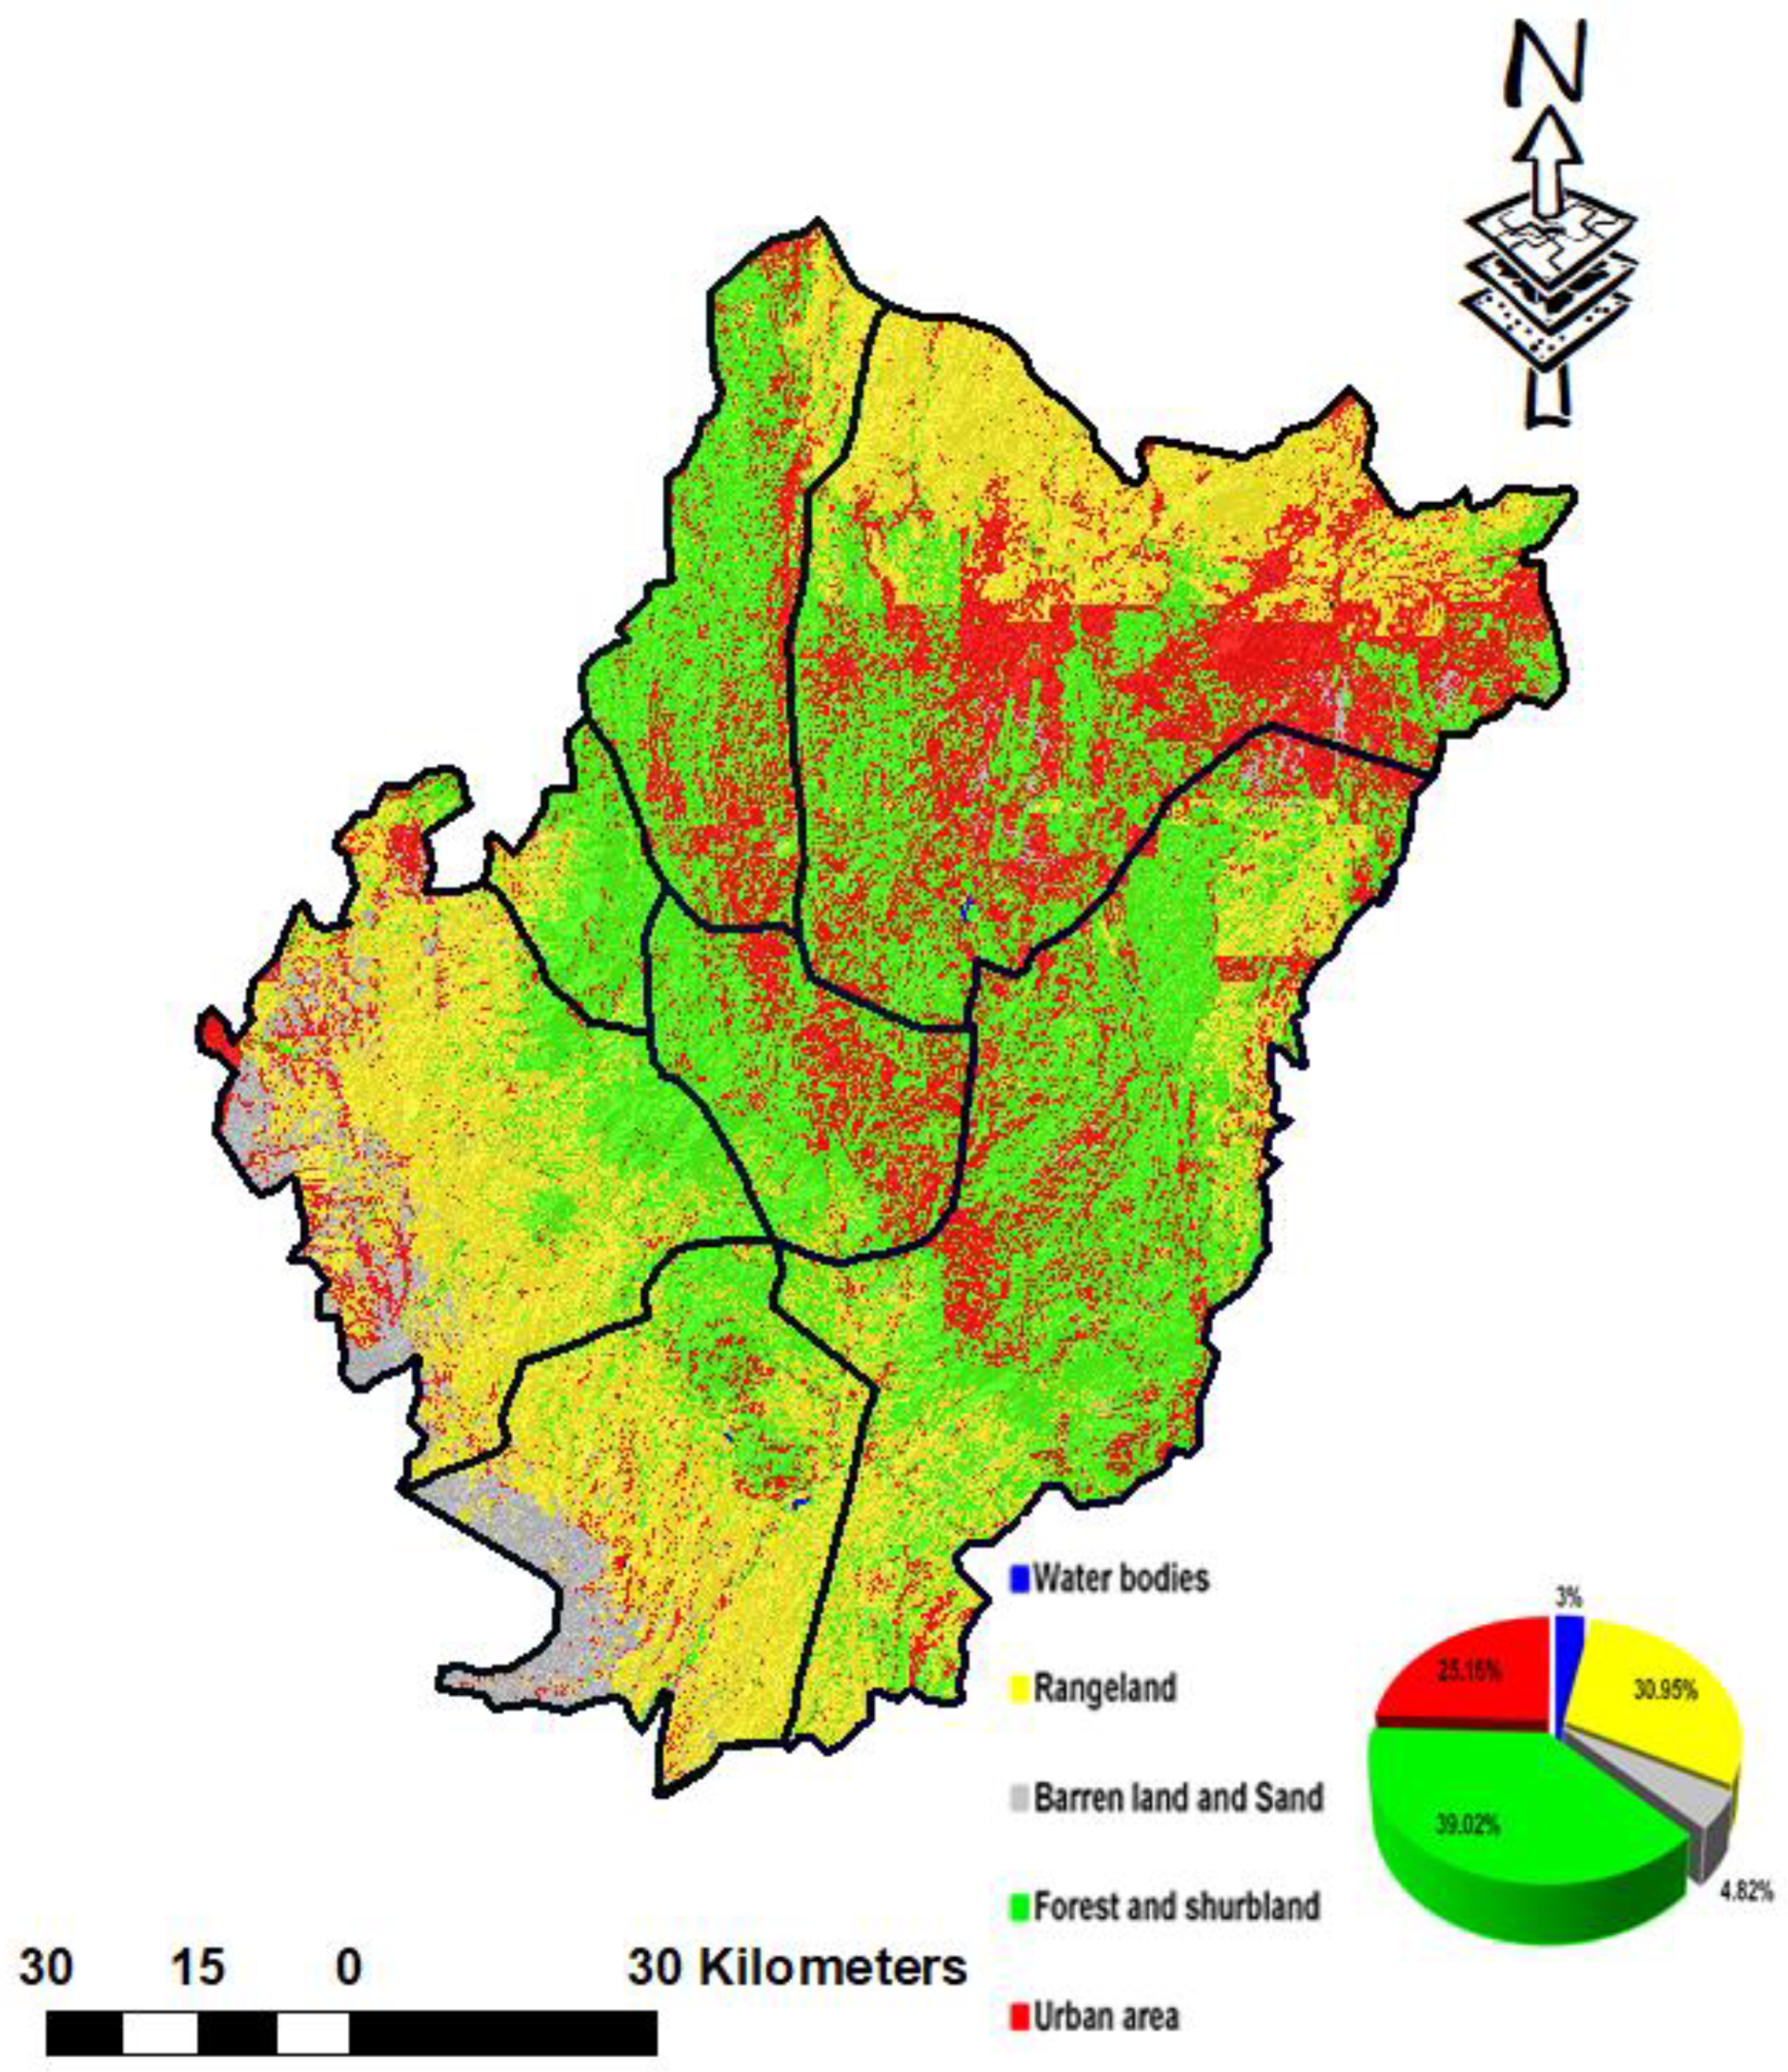
  • The results revealed a great socioeconomic development. The urban expansion was at the expense of rangeland, forest and shrubland, and barren land and sand areas, where the contribution of each one in the built-up areas was estimated at around 9.1% (179.7 km2), 33.4% (656.3 km2) and 57.5% (1131.5 km2), respectively.
  • The simulation of the future LULCC period 2021–2047 revealed a loss in rangeland, forest and shrubland, and barren land and sand by 565, 144 and 105 km2, respectively.
  • The rangeland cover land is the most influenced, it will decrease from 4002 to 3437 km2.
  • Based on MCA, it seems that urban growth will be extensive, it is estimated at around 2607 km2 until the year 2047 with a net increase of 811 km2.
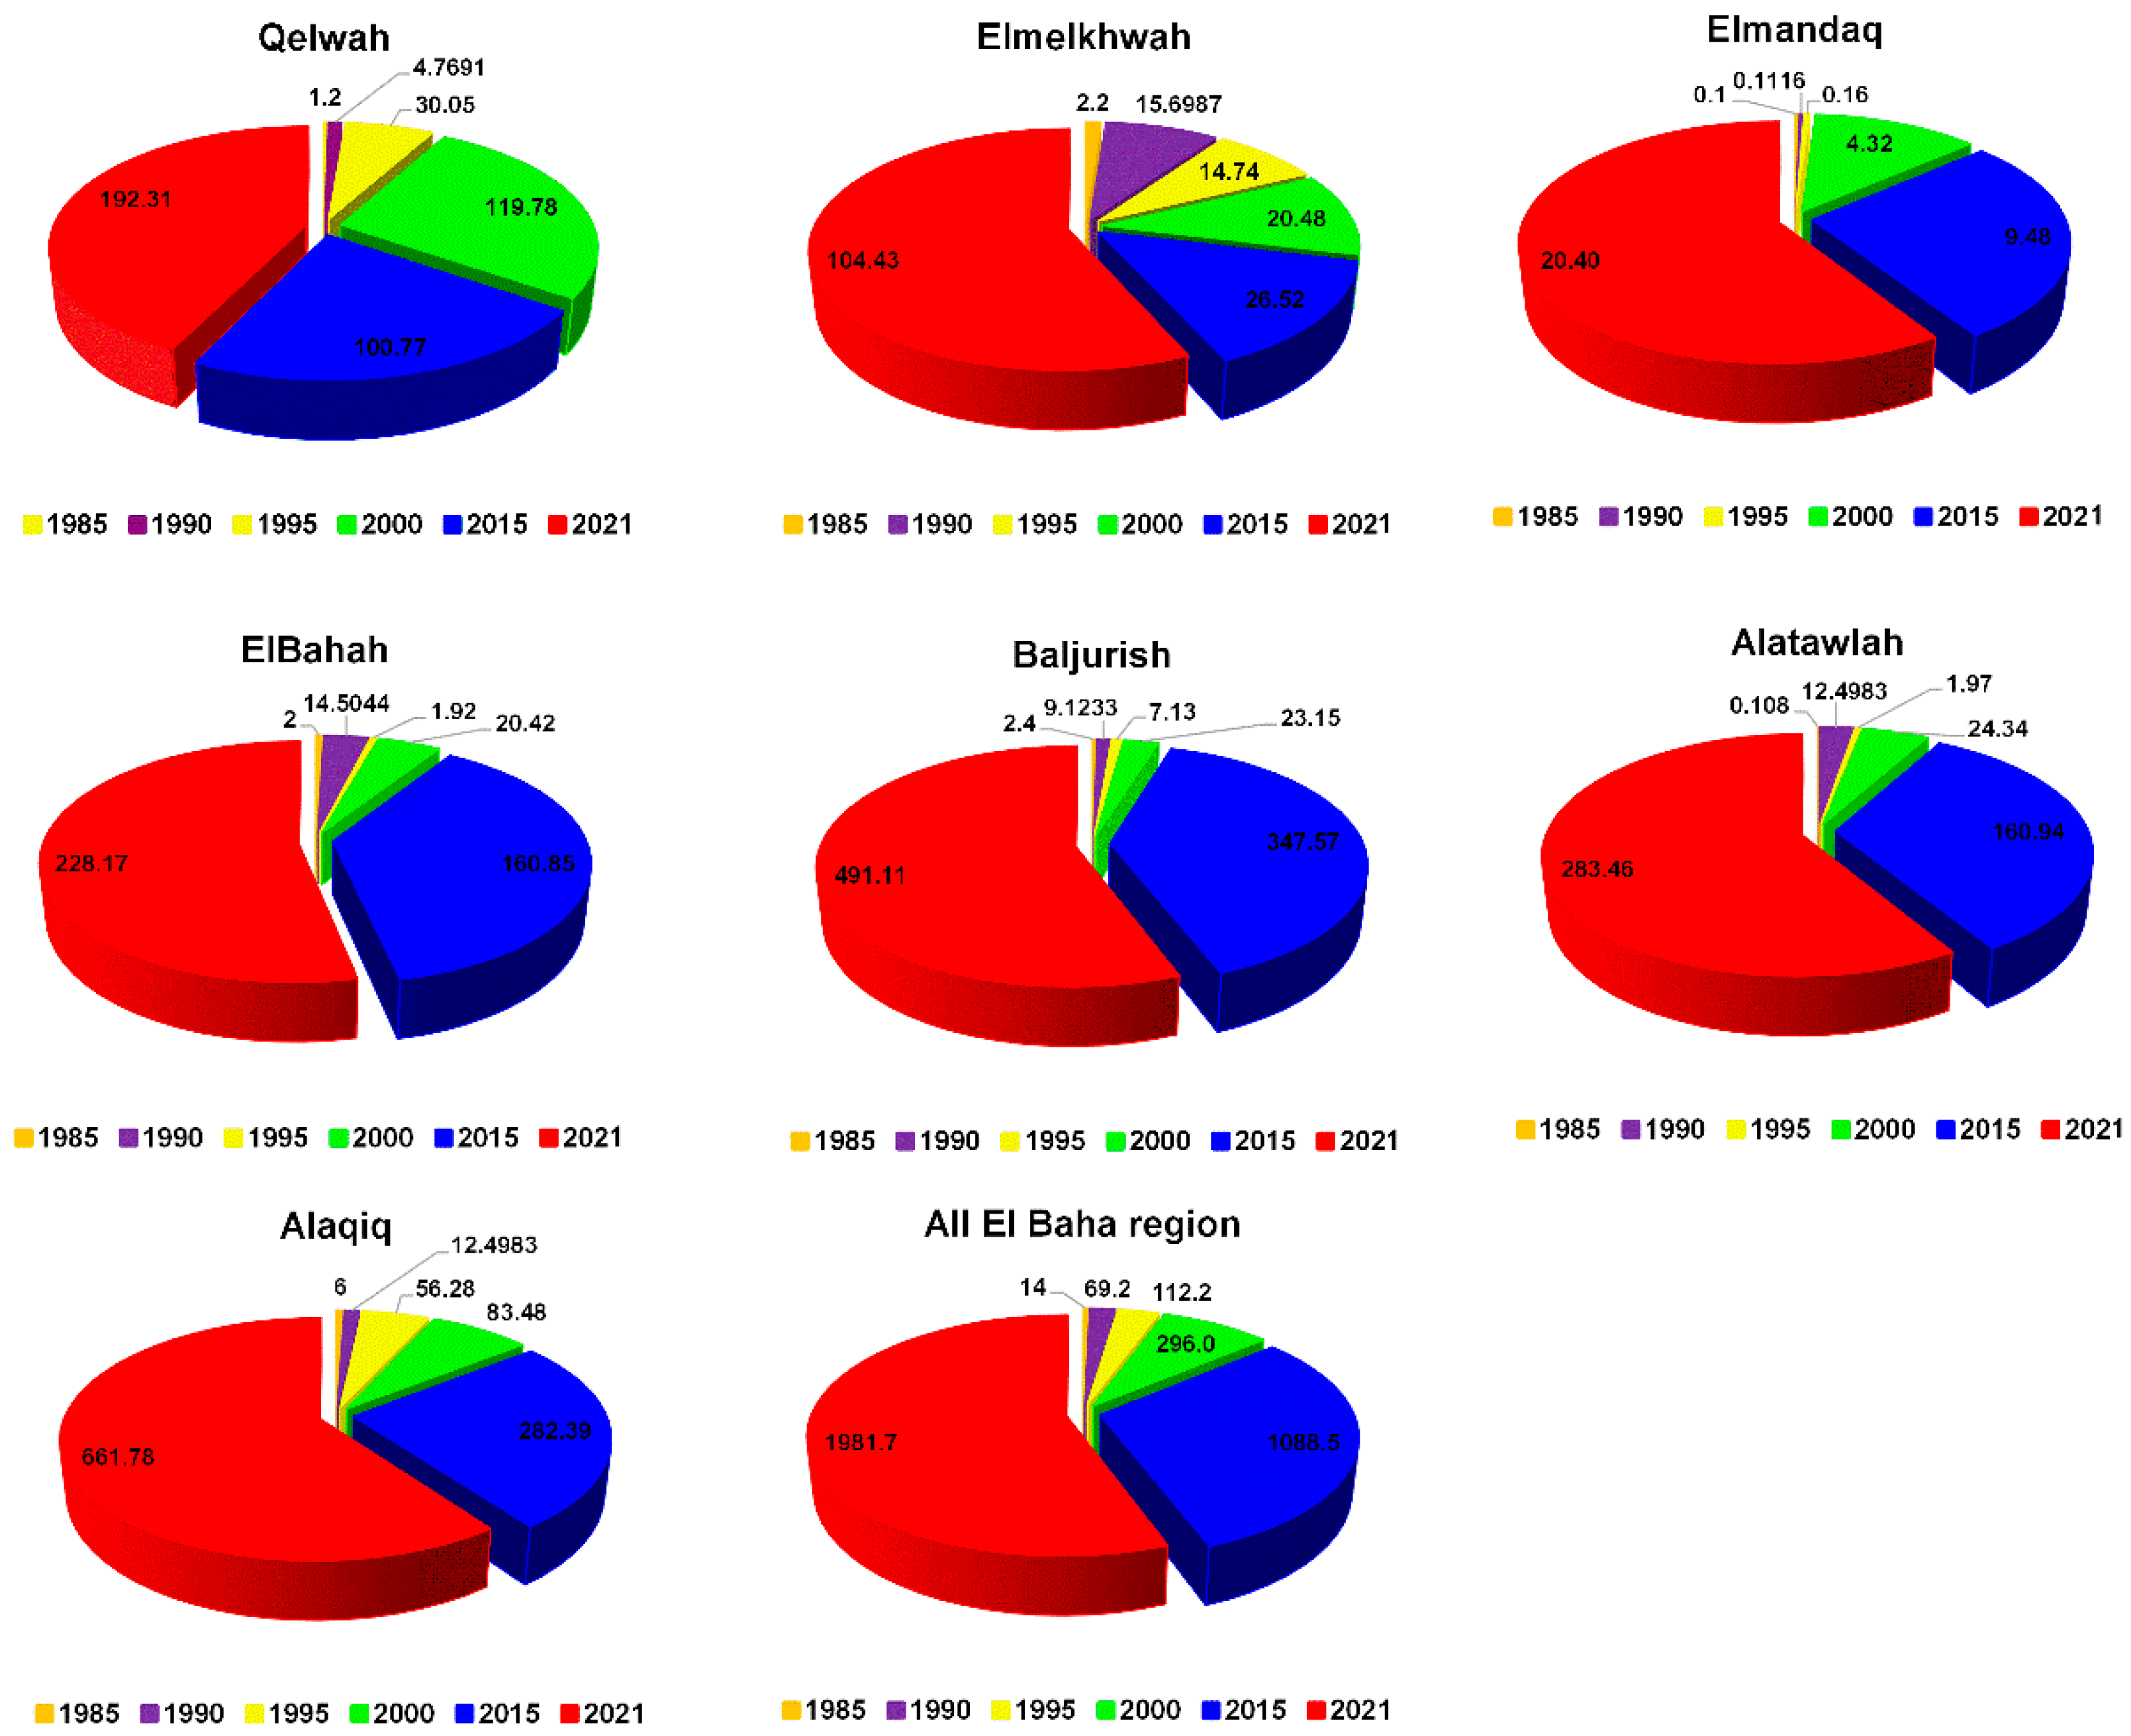
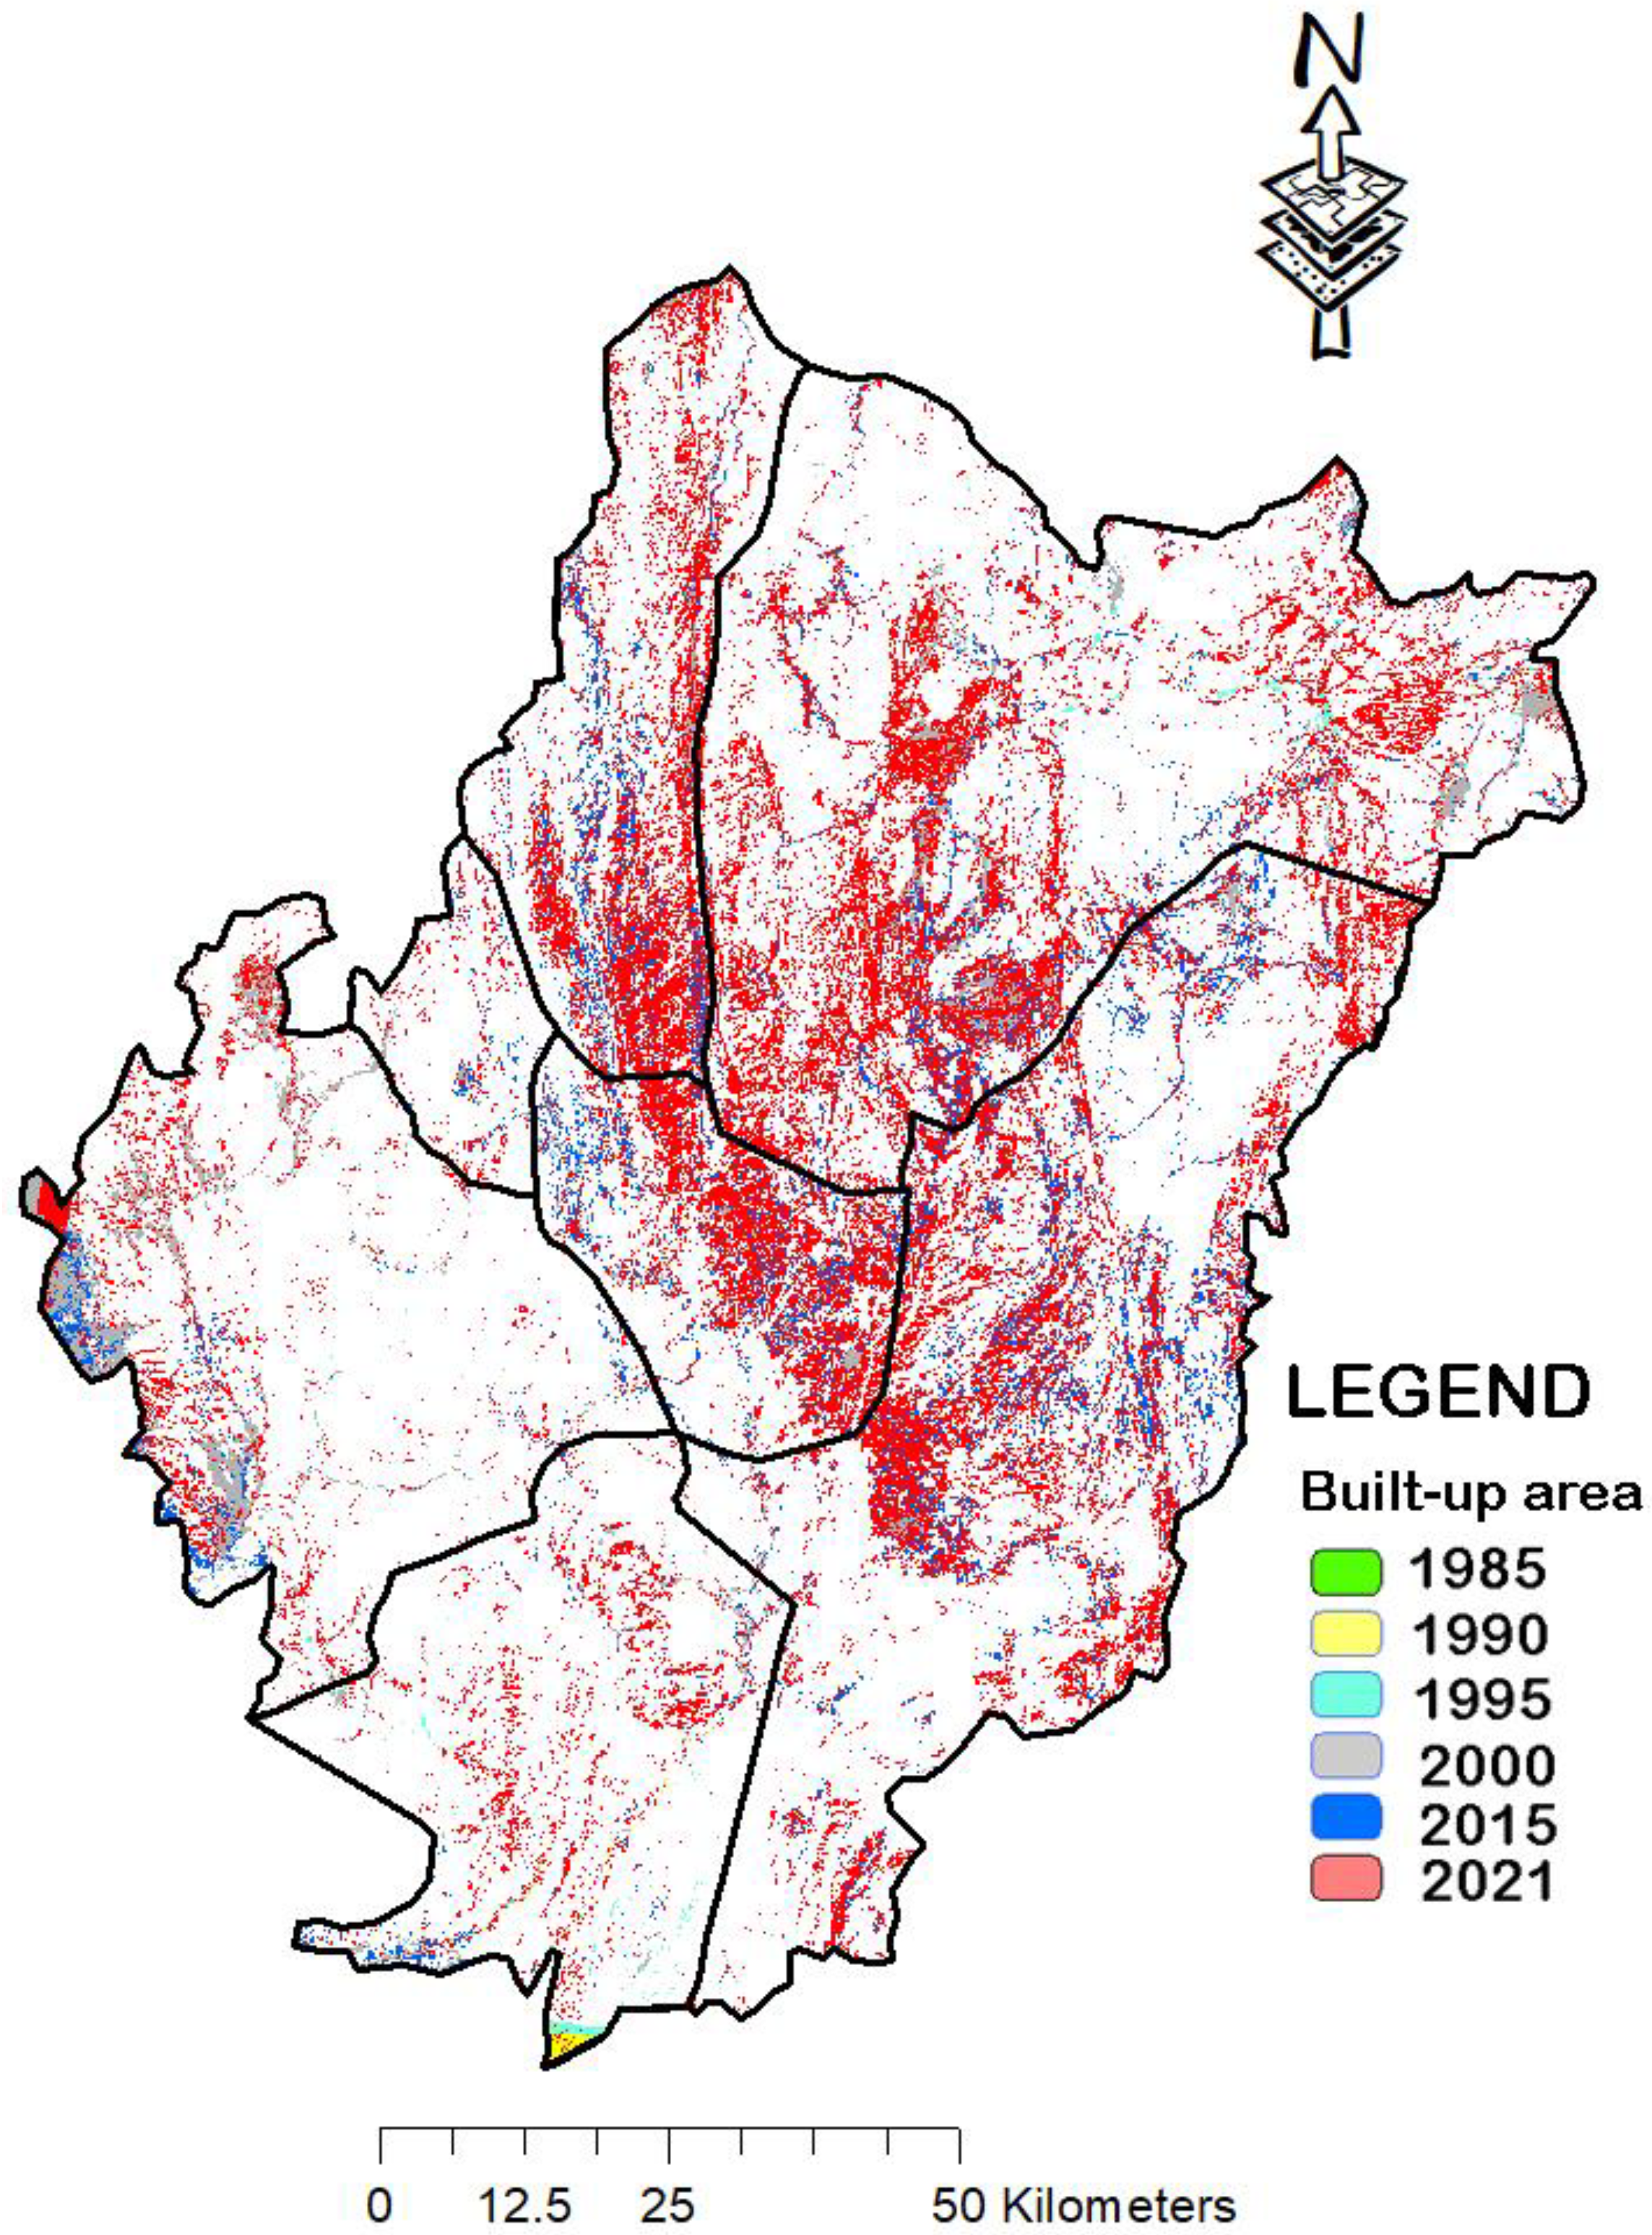
  • The urban growth has been observed in the northern parts (districts) of the study area explaining an urban growth toward the north (Alaqiq, Baljurish and Alatawlah).
  • The future simulation for the year 2047 shows that the Alaqiq district will have a great increase in the built-up areas by 471 km2 from 661 and 1132 km2, followed by Baljurish, Qelwah and Elmandaq with a relatively non-significant increase of 77, 24, and 14 km2, respectively.
The results obtained from this study may provide information to help decision-makers to make efficient practices for future planning and management of the growth of urban land use, especially in Saudi vision 2030 for the different sectors (water resources mobilization, environment, energy, construction, agriculture and other sectors). The main strength of this study is the use of a relatively long period that allowed us to make a good assessment of LULCC in the study area, especially with the insufficient reports in this framework. The aims of sustainable development goals (SDGs) at restoring, protecting, and promoting sustainable use of terrestrial ecosystems, combating desertification, sustainably managing forests, and halting biodiversity loss degradation. Thus, one of the limitations of this study is that it cannot contribute to resolving SDGs problems. Further to the scope of this study, an investigation of current and future urban growth will be conducted at the scale of each district of the study area, focusing on the forest and urban green spaces assessment for better sustainable urbanization planning.

Author Contributions

R.S. and M.A. conceived the framework of this research, processed data, designed the experiments, plots, and map preparation, validated the processing results, and wrote the manuscript. B.M. and A.A.A. gave feedback on the written manuscript and helped to analyze and edit the manuscript for proper English language, grammar, punctuation, spelling, and technical improvements. All authors have read and agreed to the published version of the manuscript.

Funding

There is a fund of 200,000 Saudi Riyal. This research is funded by the Ministry of High Education and Al-Baha University (Kingdom of Saudi Arabia). The contract number is MOE-BU-11-2020.

Institutional Review Board Statement

Not applicable.

Informed Consent Statement

Not applicable.

Data Availability Statement

The data that support the findings of this study are available from the corresponding author, [RS], upon reasonable request.

Acknowledgments

We would like to thank the Ministry of High Education and Al-Baha University (Kingdom of Saudi Arabia) for sponsoring this research which is a part of the research agreement of the Institutional Funding Program for Research and Development conducted in 2022 under the project title of Developing Digital Mapping for Al-Baha Region Using information systems (GIS).

Conflicts of Interest

The authors declare no conflict of interest.

References

  1. Kim, D.-G.; Kirschbaum, M.U. The effect of land-use change on the net exchange rates of greenhouse gases: A compilation of estimates. Agric. Ecosyst. Environ. 2015, 208, 114–126. [Google Scholar] [CrossRef]
  2. Castanheira, E.; Freire, F. Greenhouse gas assessment of soybean production: Implications of land use change and different cultivation systems. J. Clean. Prod. 2013, 54, 49–60. [Google Scholar] [CrossRef]
  3. Intergovernmental Panel on Climate Change; Watson, R.T.; Noble, I.R.; Bolin, B.; Ravindranath, N.H.; Verardo, D.J.; Dokken, D.J. IPCC Special Report on Land Use, Land-Use Change, and Forestry; Cambridge University Press: Cambridge, UK, 2000. [Google Scholar]
  4. Gatti, L.V.; Basso, L.S.; Miller, J.B.; Gloor, M.; Domingues, L.G.; Cassol, H.L.G.; Tejada, G.; Aragão, L.E.O.C.; Nobre, C.; Peters, W.; et al. Amazonia as a carbon source linked to deforestation and climate change. Nature 2021, 595, 388–393. [Google Scholar] [CrossRef]
  5. What Are the Advantages and Disadvantages of Urbanization? Available online: https://ar.myubi.tv/4635-what-are-the-advantages-and-disadvantages-of-urbanization (accessed on 10 May 2022).
  6. Matthews, Z.; Channon, A.; Neal, S.; Osrin, D.; Madise, N.; Stones, W. Examining the “Urban Advantage” in Maternal Health Care in Developing Countries. PLoS Med. 2010, 7, e1000327. [Google Scholar] [CrossRef] [PubMed]
  7. Yang, X.; Khan, I. Dynamics among economic growth, urbanization, and environmental sustainability in IEA countries: The role of industry value-added. Environ. Sci. Pollut. Res. 2021, 29, 4116–4127. [Google Scholar] [CrossRef] [PubMed]
  8. Liang, W.; Yang, M. Urbanization, economic growth and environmental pollution: Evidence from China. Sustain. Comput. Inform. Syst. 2019, 21, 1–9. [Google Scholar] [CrossRef]
  9. Ahmed, Z.; Asghar, M.M.; Malik, M.N.; Nawaz, K. Moving towards a sustainable environment: The dynamic linkage between natural resources, human capital, urbanization, economic growth, and ecological footprint in China. Resour. Policy 2020, 67, 101677. [Google Scholar] [CrossRef]
  10. Nguyen, H.M.; Nguyen, L.D. The relationship between urbanization and economic growth. Int. J. Soc. Econ. 2018, 45, 316–339. [Google Scholar] [CrossRef]
  11. Munir, K.; Ameer, A. Assessing nonlinear impact of urbanization, economic growth, technology, and trade on environment: Evidence from African and Asian emerging economies. GeoJournal 2021, 87, 2195–2208. [Google Scholar] [CrossRef]
  12. Wang, Q.; Wang, X.; Li, R. Does urbanization redefine the environmental Kuznets curve? An empirical analysis of 134 Countries. Sustain. Cities Soc. 2021, 76, 103382. [Google Scholar] [CrossRef]
  13. Chandrakanth, M.G.; Sridhar, K.S.; Smitha, K.C. Impact of urbanization on agriculture in India and China. In The Rise of India and China; Routledge: Delhi, India, 2020; pp. 145–168. [Google Scholar] [CrossRef]
  14. Andrade, J.F.; Cassman, K.G.; Edreira, J.I.R.; Agus, F.; Bala, A.; Deng, N.; Grassini, P. Impact of urbanization trends on production of key staple crops. Ambio 2021, 51, 1158–1167. [Google Scholar] [CrossRef] [PubMed]
  15. Zhang, D.; Xu, J.; Zhang, Y.; Wang, J.; He, S.; Zhou, X. Study on sustainable urbanization literature based on Web of Science, scopus, and China national knowledge infrastructure: A scientometric analysis in CiteSpace. J. Clean. Prod. 2020, 264, 121537. [Google Scholar] [CrossRef]
  16. Fonseca, C.A.B.D.; Al-Ansari, N.; Silva, R.M.D.; Santos, C.A.G.; Zerouali, B.; Oliveira, D.B.D.; Elbeltagi, A. Investigating Relationships between Runoff–Erosion Processes and Land Use and Land Cover Using Remote Sensing Multiple Gridded Datasets. ISPRS Int. J. Geo-Inf. 2022, 11, 272. [Google Scholar] [CrossRef]
  17. Bosch, M.; Jaligot, R.; Chenal, J. Spatiotemporal patterns of urbanization in three Swiss urban agglomerations: Insights from landscape metrics, growth modes and fractal analysis. Landsc. Ecol. 2020, 35, 879–891. [Google Scholar] [CrossRef]
  18. Wang, J.; Zhou, W.; Pickett, S.T.; Yu, W.; Li, W. A multiscale analysis of urbanization effects on ecosystem services supply in an urban megaregion. Sci. Total Environ. 2019, 662, 824–833. [Google Scholar] [CrossRef]
  19. Ahmed, Z.; Wang, Z.; Ali, S. Investigating the non-linear relationship between urbanization and CO2 emissions: An empirical analysis. Air Qual. Atmos. Health 2019, 12, 945–953. [Google Scholar] [CrossRef]
  20. Sun, M.; Wang, J.; He, K. Analysis on the urban land resources carrying capacity during urbanization—A case study of Chinese YRD. Appl. Geogr. 2020, 116, 102170. [Google Scholar] [CrossRef]
  21. Mohamed, A.; Worku, H. Simulating Urban Land Use and Cover Dynamics Using Cellular Automata and Markov Chain ApproaEnerh in Addis Ababa and the Surrounding. Urban Clim. 2020, 31, 100545. [Google Scholar] [CrossRef]
  22. Shafizadeh Moghadam, H.; Helbich, M. Spatiotemporal urbanization processes in the megacity of Mumbai, India: A Markov chains-cellular automata urban growth model. Appl. Geogr. 2013, 40, 140–149. [Google Scholar] [CrossRef]
  23. Rimal, B.; Zhang, L.; Keshtkar, H.; Haack, B.N.; Rijal, S.; Zhang, P. Land Use/Land Cover Dynamics and Modeling of Urban Land Expansion by the Integration of Cellular Automata and Markov Chain. ISPRS Int. J. Geo-Inf. 2018, 7, 154. [Google Scholar] [CrossRef]
  24. Dey, N.N.; Al Rakib, A.; Kafy, A.A.; Raikwar, V. Geospatial Modelling of Changes in Land Use/Land Cover Dynamics Using Multi-Layer Perception Markov Chain Model in Rajshahi City, Bangladesh. Environ. Chall. 2021, 4, 100148. [Google Scholar] [CrossRef]
  25. Aburas, M.M.; Ho, Y.M.; Pradhan, B.; Salleh, A.H.; Alazaiza, M.Y.D. Spatio-temporal simulation of future urban growth trends using an integrated CA-Markov model. Arab. J. Geosci. 2021, 14, 1–12. [Google Scholar] [CrossRef]
  26. Saadani, S.; Laajaj, R.; Maanan, M.; Rhinane, H.; Aaroud, A. Simulating spatial–temporal urban growth of a Moroccan metropolitan using CA–Markov model. Spat. Inf. Res. 2020, 28, 609–621. [Google Scholar] [CrossRef]
  27. Thompson, M.C. ‘Saudi vision 2030’: A viable response to youth aspirations and concerns? Asian Affa. 2017, 48, 205–221. [Google Scholar] [CrossRef]
  28. Mitchell, B.; Alfuraih, A. The Kingdom of Saudi Arabia: Achieving the Aspirations of the National Transformation Program 2020 and Saudi Vision 2030 Through Education. J. Educ. Dev. 2018, 2, 36. [Google Scholar] [CrossRef]
  29. Nurunnabi, M. Transformation from an Oil-based Economy to a Knowledge-based Economy in Saudi Arabia: The Direction of Saudi Vision 2030. J. Knowl. Econ. 2017, 8, 536–564. [Google Scholar] [CrossRef]
  30. Al-Ahmadi, K.; Heppenstall, A.; Hogg, J.; See, L. A Fuzzy Cellular Automata Urban Growth Model (FCAUGM) for the City of Riyadh, Saudi Arabia. Part 1: Model Structure and Validation. Appl. Spat. Anal. Policy 2009, 2, 65–83. [Google Scholar] [CrossRef]
  31. Alqadhi, S.; Mallick, J.; Balha, A.; Bindajam, A.; Singh, C.K.; Hoa, P.V. Spatial and decadal prediction of land use/land cover using multi-layer perceptron-neural network (MLP-NN) algorithm for a semi-arid region of Asir, Saudi Arabia. Earth Sci. Inform. 2021, 14, 1547–1562. [Google Scholar] [CrossRef]
  32. Aina, Y.A.; Adam, E.; Ahmed, F.; Wafer, A.; Alshuwaikhat, H.M. Using multisource data and the V-I-S model in assessing the urban expansion of Riyadh city, Saudi Arabia. Eur. J. Remote Sens. 2019, 52, 557–571. [Google Scholar] [CrossRef] [Green Version]
  33. Alqurashi, A.A.; Kumar, L. Land Use and Land Cover Change Detection in the Saudi Arabian Desert Cities of Makkah and Al-Taif Using Satellite Data. Adv. Remote Sens. 2014, 3, 106–119. [Google Scholar] [CrossRef]
  34. Abdallah, S.; Elmohemen, M.A.; Hemdan, S.; Ibrahem, K. Assessment of land use/land cover changes induced by Jizan Dam, Saudi Arabia, and their effect on soil organic carbon. Arab. J. Geosci. 2019, 12, 1–11. [Google Scholar] [CrossRef]
  35. Rahman, M.T.; Aldosary, A.S.; Mortoja, M. Modeling Future Land Cover Changes and Their Effects on the Land Surface Temperatures in the Saudi Arabian Eastern Coastal City of Dammam. Land 2017, 6, 36. [Google Scholar] [CrossRef]
  36. Aljoufie, M.; Zuidgeest, M.; Brussel, M.; van Maarseveen, M. Spatial–temporal analysis of urban growth and transportation in Jeddah City, Saudi Arabia. Cities 2013, 31, 57–68. [Google Scholar] [CrossRef]
  37. Alqurashi, A.F.; Kumar, L. An assessment of the impact of urbanization and land use changes in the fast-growing cities of Saudi Arabia. Geocarto Int. 2019, 34, 78–97. [Google Scholar] [CrossRef]
  38. Altuwaijri, H.A.; Alotaibi, M.H.; Almudlaj, A.M.; Almalki, F.M. Predicting urban growth of Arriyadh city, capital of the Kingdom of Saudi Arabia, using Markov cellular automata in TerrSet geospatial system. Arab. J. Geosci. 2019, 12, 1–15. [Google Scholar] [CrossRef]
  39. El-Hazek, A.N. Cost of dams in Al-Baha Province, Kingdom of Saudi Arabia. J. Environ. Eng. Sci. 2013, 2, 77. [Google Scholar]
  40. El-Hazek, A.N. Optimum water storage in Al-Baha, Kingdom of Saudi Arabia. Am. J. environ. Sci. 2014, 4, 19–24. [Google Scholar]
  41. USGS. United States Geological Survey. Available online: https://earthexplorer.usgs.gov/ (accessed on 1 October 2021).
  42. Tucker, C.J. Red and photographic infrared linear combinations for monitoring vegetation. Remote Sens. Environ. 1979, 8, 127–150. [Google Scholar] [CrossRef]
  43. Normalized Vegetationindices. Available online: https://stringfixer.com/ar/Normalized_Difference_Vegetation_Index/ (accessed on 1 March 2022).
  44. Sisodia, P.S.; Tiwari, V.; Kumar, A. Analysis of Supervised Maximum Likelihood Classification for Remote Sensing Image. In International Conference on Recent Advances and Innovations in Engineering (ICRAIE, IEEE). 2014, pp. 1–4. Available online: https://ieeexplore.ieee.org/document/6909319 (accessed on 1 February 2022).
  45. Hamza, D. Mapping Changes in the Occupancy of the Soil in the Mitidja Plain from Images Landsat. Master’s Thesis, Higher National School of Hydraulics, Blida, Algeria, 2017; p. 78. [Google Scholar]
  46. Richards, J. Remote Sensing Digital Image Analysis; Springer: Berlin/Heidelberg, Germany, 1999; 240p. [Google Scholar]
  47. Bolstad, P.; Lillesand, T.M. Rapid maximum likelihood classification. Photogramm. Eng. Remote Sens. 1991, 57, 67–74. [Google Scholar]
  48. Ahmad, A.; Quegan, S. Analysis of maximum likelihood classification on multispectral data. Appl. Math. Sci. 2012, 6, 6425–6436. [Google Scholar]
  49. Shivakumar, B.R.; Rajashekararadhya, S.V. Investigation on Land Cover Mapping Capability of Maximum Likelihood Classifier: A Case Study on North Canara, India. Procedia Comput. Sci. 2018, 143, 579–586. [Google Scholar] [CrossRef]
  50. Gagniuc, P.A. Markov Chains: From Theory to Implementation and Experimentation; John Wiley & Sons: Hoboken, NJ, USA, 2017; ISBN 9781119387558. [Google Scholar]
  51. Ferchichi, A. Propagation et Réduction des Incertitudes Dans les Modèles de Changement D’occupation des Sols. Ph.D. Thesis, Université de la Manouba, Manouba, Tunisia, 2017. [Google Scholar]
  52. Mathanraj, S.; Rusli, N.; Ling, G.H.T. Applicability of the CA-Markov Model in Land-use/Land cover Change Prediction for Urban Sprawling in Batticaloa Municipal Council, Sri Lanka. IOP Conf. Ser. Earth Environ. Sci. 2021, 620, 012015. [Google Scholar] [CrossRef]
  53. Hamad, R.; Balzter, H.; Kolo, K. Predicting Land Use/Land Cover Changes Using a CA-Markov Model under Two Different Scenarios. Sustainability 2018, 10, 3421. [Google Scholar] [CrossRef] [Green Version]
  54. Sarkar, A.; Chouhan, P. Dynamic simulation of urban expansion based on Cellular Automata and Markov Chain Model: A case study in Siliguri Metropolitan Area, West Bengal. Model. Earth Syst. Environ. 2019, 5, 1723–1732. [Google Scholar] [CrossRef]
  55. Desertification. Available online: https://www.faseel.org.sa/desertification/ (accessed on 1 October 2021).
  56. Ghanem, A.M.; Alamri, Y.A. The impact of the green Middle East initiative on sustainable development in the Kingdom of Saudi Arabia. J. Saudi Soc. Agric. Sci. 2022. [Google Scholar] [CrossRef]
  57. Hameed, A.; Jabeen, I.; Afzal, N. Towards an eco-friendly future: A corpus-based analysis of media discourse on "Saudi Green Initiative". Lege Artis 2022, 7. [Google Scholar]
  58. Naz, A.; Zaman, K.; Yousaf, S.U.; Nassani, A.A.; Aldakhil, A.M.; Abro, M.M.Q. Saudi Arabia-China-Pakistan Economic Corridor: Intergovernmental green initiatives. Environ. Sci. Pollut. Res. 2019, 26, 25676–25689. [Google Scholar] [CrossRef]
  59. Alzamil, W.; AlQarni, A.A. Urban sprawl on the natural environment in Al-Baha region in the Kingdom of Saudi Arabia. In Proceedings of the Geographical Environment Forum with Vision 2030 at El Aimra University, 28 March 2019. Arabic Version. [Google Scholar]
  60. Al-Baha Road Projects Enhance the Commercial, Economic and Tourism Movement in the Region. Available online: https://www.spa.gov.sa/viewstory.php?lang=ar&newsid=2359872/ (accessed on 1 February 2022).
  61. Abino, A.C.; Kim, S.Y.; Na Jang, M.; Lee, Y.J.; Chung, J.S. Assessing land use and land cover of the Marikina sub-watershed, Philippines. For. Sci. Technol. 2014, 11, 65–75. [Google Scholar] [CrossRef]
  62. Xu, T.; Zhou, D.; Li, Y. Integrating ANNs and Cellular Automata–Markov Chain to Simulate Urban Expansion with Annual Land Use Data. Land 2022, 11, 1074. [Google Scholar] [CrossRef]
  63. Hasan, M.E.; Nath, B.; Sarker, A.R.; Wang, Z.; Zhang, L.; Yang, X.; Nobi, M.N.; Røskaft, E.; Chivers, D.J.; Suza, M. Applying Multi-Temporal Landsat Satellite Data and Markov-Cellular Automata to Predict Forest Cover Change and Forest Degradation of Sundarban Reserve Forest, Bangladesh. Forests 2020, 11, 1016. [Google Scholar] [CrossRef]
  64. Fitawok, M.B.; Derudder, B.; Minale, A.S.; Van Passel, S.; Adgo, E.; Nyssen, J. Modeling the Impact of Urbanization on Land-Use Change in Bahir Dar City, Ethiopia: An Integrated Cellular Automata–Markov Chain Approach. Land 2020, 9, 115. [Google Scholar] [CrossRef]
  65. Koko, A.; Yue, W.; Abubakar, G.; Hamed, R.; Noman, A.A. Monitoring and Predicting Spatio-Temporal Land Use/Land Cover Changes in Zaria City, Nigeria, through an Integrated Cellular Automata and Markov Chain Model (CA-Markov). Sustainability 2020, 12, 10452. [Google Scholar] [CrossRef]
  66. Kaddour, O. Current Population Problems in ALBAHA Area. Damascus University Journal—Al-Mujamd. 2016, Voulme 32. Available online: http://damascusuniversity.edu.sy/mag/human/FCKBIH/file/2016-2/en/27.pdf (accessed on 1 February 2022).
  67. Hong, C.; Burney, J.A.; Pongratz, J.; Nabel, J.E.M.S.; Mueller, N.D.; Jackson, R.B.; Davis, S.J. Global and regional drivers of land-use emissions in 1961–2017. Nature 2021, 589, 554–561. [Google Scholar] [CrossRef] [PubMed]
  68. Urban Planning Process in Saudi Arabia. Available online: https://www.al-jazirah.com/2020/20200119/fe1.htm/ (accessed on 1 February 2022).
  69. The United Nations Human Settlements Program (2017). The New Urban Agenda. Available online: https://www.un.org/ruleoflaw/un-and-the-rule-of-law/united-nations-human-settlements-programme/ (accessed on 1 February 2022).
  70. Shrahily, R.Y.; Alsharif, M.A.; Mobarak, B.A.; Alzandi, A.A. Land Cover Mapping Using GIS and Remote Sensing Databases for Al Baha Region Saudi Arabia. Appl. Sci. 2022, 12, 8115. [Google Scholar] [CrossRef]
  71. Rahman, M.T. Detection of Land Use/Land Cover Changes and Urban Sprawl in Al-Khobar, Saudi Arabia: An Analysis of Multi-Temporal Remote Sensing Data. ISPRS Int. J. Geo-Inf. 2016, 5, 15. [Google Scholar] [CrossRef]
  72. Arifanti, V.B.; Novita, N.; Subarno; Tosiani, A. Mangrove deforestation and CO2 emissions in Indonesia. IOP Conf. Series Earth Environ. Sci. 2021, 874, 012006. [Google Scholar] [CrossRef]
  73. IPCC. Summary for Policymakers. In Climate Change and Land: An IPCC Special Report on Climate Change, Desertification, Land Degradation, Sustainable Land Management, Food Security, and Greenhouse Gas Fluxes in Terrestrial Ecosystems; Shukla, P.R., Skea, J., Buendia, E.C., Masson-Delmotte, V., Pörtner, H.-O., Roberts, D.C., Zhai, P., Slade, R., Connors, S., van Diemen, R., et al., Eds.; 2019; in press. [Google Scholar]
  74. Anwar, A.; Younis, M.; Ullah, I. Impact of Urbanization and Economic Growth on CO2 Emission: A Case of Far East Asian Countries. Int. J. Environ. Res. Public Health 2020, 17, 2531. [Google Scholar] [CrossRef]
  75. Anser, M.K.; Alharthi, M.; Babar, A.; Sarah, W. Impact of urbanization, economic growth, and population size on residential carbon emissions in the SAARC countries. Clean Techn. Environ Policy. 2020, 22, 923–936. [Google Scholar] [CrossRef]
Figure 1. Geographic location, digital elevation model of the study area and an overview of the area and population size of each district within the El Baha region.
Forests 13 01530 g001
Figure 2. Representation of maps showing (a) slope, (b) aspect, (c) hill shades, (d) contours, (e) distance from the road and (f) distance from the river.
Forests 13 01530 g002
Figure 3. Flowchart used in this study.
Forests 13 01530 g003
Figure 4. Land use land cover change maps for the years: 1985, 1990, 1995, 2000, 2015, and 2021.
Forests 13 01530 g004aForests 13 01530 g004b
Figure 5. Change in different land cover classes for the years: 1985, 1990, 1995, 2000, 2015, and 2021.
Forests 13 01530 g005
Figure 6. Change in built-up area in km2 for the years: 1985, 1990, 1995, 2000, 2015, and 2021.
Forests 13 01530 g006
Figure 7. Change in built-up area (km2) for the years: 1985, 1990, 1995, 2000, 2015, and 2021.
Forests 13 01530 g007
Figure 8. Mapping of built-up area (km2) for the years: 1985, 1990, 1995, 2000, 2015, and 2021.
Forests 13 01530 g008
Figure 9. Results of (a) contribution to net change in urban area (b) net change and (c) gains and losses for land cover of ElBaha region between 1984–2021.
Forests 13 01530 g009
Figure 10. Spatial mapping of the converted the various land cover to built-up areas at El Baha region between 1984–2021.
Forests 13 01530 g010
Figure 11. Spatial mapping of gains, losses and persistence of various land cover of El Baha region between 1985–2021.
Forests 13 01530 g011
Figure 12. Error monitoring during the training and testing stages for LULCC prediction.
Forests 13 01530 g012
Figure 13. Predicted Land use land cover change map for the year 2047.
Forests 13 01530 g013
Figure 14. Area of Land use land cover change classes for the years 2021 and 2047.
Forests 13 01530 g014
Figure 15. Area of built-up areas for all district of the El Baha region for the years 2021 and 2047.
Forests 13 01530 g015
Table 1. Remote sensing databases information.
Image TypeFile DateDate AcquiredRowPathSensor IDCloud%
Landsat 519 February 201729 July 198516846TM>10
12 June 20182 December 199016846TM>10
25 January 202129 October 199516846TM>10
Landsat 711 February 201727 May 200016846ETM+>7
16 January 201718 February 200516846ETM+<50
12 December 201630 October 201016846ETM+<50
Landsat 84 August 201718 September 201516846OLI_TIRS>5
30 November 202121 November202116846OLI_TIRS>5
Table 2. MLP running parameters and simulation results from TerrSet.
ProcessParameterValue
Training parametersLearning rate0.0005
Momentum factor0.5
Sigmoid constant1.0
Number of hidden Layer7
Stopping criteriaRoot mean square (RMS)0.01
Iterations10,000
Accuracy rate100%
ResultsTraining RMS0.190
Testing RMS0.190
Accuracy rate81.65%
Publisher’s Note: MDPI stays neutral with regard to jurisdictional claims in published maps and institutional affiliations.

