1. Introduction
Throughout the development process of urbanization, when the urbanization rate of a city exceeds 50%, the city gradually enters a period of rapid post-industrial development and economic prosperity. However, the accelerated urbanization process has led to an increase in urbanization pitfalls, such as rapid population growth, imbalanced regional development, social inequality, uneven allocation of public resources and environmental degradation [
1]. As the negative impact of urbanization becomes more prominent, there is greater concern about the urbanization process and intergenerational equity [
2]. The metropolitan area is considered to be the main element of the spatial structure of the post-industrial period [
3], and its development is an inevitable consequence of the urbanization process and an important way to solve the problem of urbanization pitfalls. As a spatial structure in which the central city radiantly drives the development of the member cities and forms close economic connectivity, the metropolitan area is a key physical space for economic growth, economic agglomeration, productivity innovation and competitiveness [
4,
5], as well as an important part of the local, national and global economy [
6], enabling the agglomeration of talent, industry, investment and other factors, and can make use of regional transport infrastructure, research and technology, skilled workers, and buyer-supplier networks and others to achieve free and efficient flows of capital [
7], people, logistics and information across administrative boundaries, rationalize the distribution of resources and optimize the layout of industries within the area. This, in turn, creates a closer and more deeply integrated socio-economy, with the advantage of being able to jointly exploit larger city sizes to unlock greater agglomeration economies, while mitigating the negative returns of over-concentration of activities in a single large center and taking regional economic development to new heights [
8].
From the historical perspective of development, China’s urbanization process is a process of agglomeration of population, industry and land for construction in urban areas [
9,
10]. China has the conditions to develop a metropolitan area pattern, and governments around the country have successively issued blueprint plans for metropolitan areas. In 2019, the Central Committee of the Communist Party of China and the State Council issued the Outline of the Yangtze River Delta Regional Integrated Development Plan (hereinafter referred to as the Outline), which clearly states that the development of the Shanghai metropolitan area should be vigorously promoted to form a replicable and promotable model metropolitan area, while driving the common development of the surrounding metropolitan area in the Yangtze River Delta region. This will create a new pattern of coordinated regional development, and enhance the level and capability of the region in the world economic pattern. This indicates that the metropolitan area has become an advanced spatial form with the ability to carry China’s economic development in the new era, as a key hub in global networks for the movement of goods, capital, information and people is an inevitable product of China’s position in the international platform [
5]. At present, the representative metropolitan areas in the world, such as the New York metropolitan area, the Tokyo metropolitan area and the London metropolitan area, are all at a mature stage of metropolitan area development, and their comprehensive strength and development momentum are very strong. China is relatively late in the process of developing metropolitan areas and has insufficient development momentum [
11,
12,
13]. In order to enhance international competitiveness, promoting the development of metropolitan areas and forming a regional economic pattern of high-quality development is an important step in the transformation of China’s economy into a new state. Therefore, by constructing an evaluation index system, revealing the current situation of the economic and social development level of the metropolitan areas, and then giving relevant countermeasure suggestions to narrow the differences between the metropolitan areas, it is of great significance to improve the quality of China’s coordinated regional economic development.
The current research areas on exploring the evaluation of the development level of metropolitan areas are mainly focused on the following aspects: (1) Based on the perspective of selecting indicators for the evaluation system, most scholars have constructed an evaluation index system to measure the development level of the metropolitan area through economic development, infrastructure construction, innovation strength and public services or political perspective [
14,
15,
16,
17,
18,
19,
20,
21,
22,
23,
24]. The existing research results provide a certain theoretical basis for evaluating the development level of metropolitan areas, but the construction of the evaluation index system has not yet formed a unified standard in academic circles and the index system in the existing research is less concerned with the selection of indicators that can reflect the core development concept of metropolitan areas, such as the degree of economic linkage and industrial structure. In the process of evaluating the development level of metropolitan areas, it is not only necessary to consider the static statistical indicators of the member cities within the metropolitan area, but also to fully reflect the inter-city linkage and synergistic development relationship between the member cities within the area. (2) Based on the application of evaluation methods, most of the evaluation methods adopted by scholars belong to static evaluation methods, such as hierarchical analysis, coefficient of variation method, entropy method, TOPSIS, etc. Compared with the above-mentioned static evaluation research methods, the development process of metropolitan areas is dynamic and changeable, and the development pattern expressed by temporal and spatial changes is random, so dynamic evaluation can reflect the development status of metropolitan areas more objectively [
25,
26,
27,
28,
29,
30,
31,
32]. (3) Based on the selection of the evaluation objects, most of the literature is based on the development of individual metropolitan areas, or on the differences in development between multiple metropolitan areas, and less on specific regions as a defined scope [
33,
34,
35,
36,
37,
38,
39].
In summary, in order to improve the inadequate selection of indicators, this study incorporates spatial-temporal economic linkage and industrial structure measurement indicators into the evaluation system. For the selection of evaluation methods, this paper adopts the “vertical and horizontal” evaluation method proposed by scholar Guo to study the economic and social development level of metropolitan areas [
40]. For the evaluation of regional development, this method mainly focuses on the study of cities and urban agglomerations [
41,
42,
43,
44,
45,
46], but does not pay attention to the research in the field of metropolitan area. As the intermediate carrier of the transition from city to urban agglomeration, it is necessary to study the development level of the metropolitan area. This paper applies the method to the field of evaluation of metropolitan area development for the first time. As a method of determining weights for panel data, the “vertical and horizontal” evaluation method provides a new means and method for development evaluation of metropolitan area and broadens the application field of the method. At the same time, this study takes the four major metropolitan areas in the Yangtze River Delta region as the object of in-depth research, and applies the method to research the development level of metropolitan areas, exploring the patterns and characteristics of the four metropolitan areas over time from a “vertical” perspective, and exploring the advantages and shortcomings of the development at a certain time from a “horizontal” perspective, with a view to provide reference for promoting the high-quality development of metropolitan areas.
2. Materials and Methods
2.1. The Evaluation Index System
By collating the research frameworks of scholars on metropolitan area development studies (see
Table 1 for details), the authors found that most scholars would explore the comprehensive development status of metropolitan areas based on economic, infrastructural, innovation, spatial and environmental aspects when studying metropolitan areas in different regions of different countries, while some scholars also include influencing factors such as policy, population, transport construction and education [
14,
17,
47,
48,
49,
50,
51,
52,
53,
54,
55,
56].
At the same time, this paper found that when Chinese scholars construct evaluation systems for regional development evaluation, they mostly combine them with China’s development policies [
12,
27,
43,
44,
57,
58], such as the Five-in-One, the New Development Concept and the Planning Outline (see
Table 2 for details). As the saying goes, policy leads and practice follows, and policy guidance can provide a clear direction of development for economic and social development. Therefore, this paper selects the five new development concepts of China “innovation, coordination, green, openness and sharing” as the evaluation system construction concept.
With reference to the research of the above scholars, and combined with the new development concept of China and the core development concept of “leading small cities with large ones and coordinated development” in the metropolitan area, this paper constructs a comprehensive evaluation system for the economic and social development of metropolitan areas based on scientific, systematic, comparable, representative and data availability, which includes five subsystems: economy, innovation, infrastructure, space and coordination, with a total of 46 indicators (see
Table 3 for details).
The specific descriptions of the five subsystems in the evaluation system are as follows: (1) The economy, as the foundation of regional livelihood, is the endogenous driving force of regional development. The economic subsystem reflects the comprehensive economic development strength of the metropolitan area through indicators such as industrial growth value, fixed asset investment, public finance budget revenue, total import and export trade and per capita retail sales of social consumer goods. (2) Innovation has now become the first driving force in economic development. In the innovation subsystem, the innovation strength of metropolitan areas is measured by indicators such as R&D expenditure, the number of patent applications and the number of R&D institutions. (3) Improvements in infrastructure can increase people’s sense of access and well-being, which in turn attracts foreign populations. The infrastructure subsystem explores the state of development of people’s lives in the metropolitan area by selecting indicators that are closely related to the people, such as education, healthcare and transportation. (4) The spatial subsystem explores the quality of people’s lives while focusing on the green social sustainability of the metropolitan area through environment-related indicators, such as greening level, waste utilization rate and park area per capita. (5) The coordination subsystem is designed to reflect the core development concept of the metropolitan area through spatial and temporal economic linkages and industrial structure indicators, and then explores the complementary and coordinated development among the member cities of the metropolitan area.
2.2. Evaluation Objects
The four major metropolitan areas of the Yangtze River Delta region, namely Shanghai, Nanjing, Hangzhou and Hefei, are used as research objects in this study. According to the relevant planning documents issued by the government for the metropolitan areas, a total of 26 cities are identified to be included in the four metropolitan areas (see
Table 4). Given the availability of data, the county-level cities of Liyang and Jintan in the Nanjing metropolitan area are replaced by the prefecture-level city of Changzhou, and the county-level city of Tongcheng in the Hefei metropolitan area is replaced by the prefecture-level city of Anqing.
2.3. Data Sources and Processing
The data were mainly selected from the Statistical Yearbook of each city from 2005 to 2020, some of the data were referred to the data in the China Urban Statistical Yearbook. Meanwhile, the indicator of mobile population size (A42), which reflects the economic vitality of the metropolitan area, was taken as the difference between the resident population and the registered population in view of the availability of data and the uniformity of statistical caliber; the indicator of temporal economic linkage (A43) and spatial economic linkage (A44) were measured by the gravity model, and the spatial distance and time data in the model were obtained from the website of Baidu Map and 12,306 China Railways; the indicator of industrial structure rationality (A45) and industrial structure synergy (A46) were measured by the Thiel index and industrial structure similarity coefficient, respectively. The evaluation index system constructed in this study can be divided into positive and negative indicators, and the negative indicators (A45 and A46) are converted into positive by taking the inverse of them according to the methods used by other scholars to deal with data [
43].
2.4. “Vertical and Horizontal” Evaluation Method
The dynamic evaluation method “vertical and horizontal” is based on three-dimensional time-series data and the principle of maximizing differences between the evaluated objects to obtain the weights of the indices. The weighting information comes directly from the original data of the evaluated object, which ensures a certain objectivity of the weighting coefficients, while the indicator weights determined by the three-dimensional time-series data implicitly include the time factor, thus making the evaluation value of each system at each time directly comparable. The specific idea of this method is as follows:
Assuming that comprehensive evaluation of the development of the n evaluated objects
in a certain aspect of the time period
is carried out, based on the constructed evaluation index system, the original data values of the m evaluation indices of the evaluated objects
in the time period
are collected, and the panel data matrix
. is obtained by collation. In order to eliminate different data types and dimensions of the original data, the data were pre-processed. For the sake of generality, assuming that
are all positive indices (the larger the value, the better), the data of the above-mentioned original indices are normalized by the method of dimensionless processing, which is as follows:
where
is the normalized data matrix,
and
represent the sample mean and standard deviation respectively.
For the comprehensive evaluation at the moment
, the study adopts the linear weighted comprehensive evaluation model as follows:
where
is the comprehensive evaluation value of the evaluated object
i at the moment
and
is the weight coefficient of the evaluation indicator
j.
In order to maximize the overall difference between the evaluation objects, namely the difference in the evaluation value data of matrix
is maximized, the total sum of squared deviations
is used to represent the difference, the formula is as follows:
After the data standardization process, the sample mean of the normalized matrix
is 0 and the sample variance is 1, the formula of
is as follows:
Then
can be simplified as:
where
is symmetric matrixof order m × m,
, and
Due to the existence of constraints on
, in order to obtain a maximum value for
, then the planning problem can be obtained, which is as follows:
For the above planning problem, the MATLAB_R2014b software was used to solve it.
On the basis of the “vertical and horizontal” evaluation method, the total evaluation value of each evaluation object in the time period
is obtained by quadratic weighting of time, the basic idea is to give greater weight to the recent value, the farther away the time, the smaller the weight coefficient, and the time weight result formula is as follows:
The total evaluation value
of each review object over the time period
, the formula is as follows:
where
is the time weight coefficient at moment
and
is the evaluation value of the evaluation object
at moment
.
Ultimately, the magnitude and ranking of evaluation value at moment and evaluation value in time period can be obtained from Equations (2) and (9), respectively.
2.5. Gravity Models
In order to explore the radiation intensity of the metropolitan area, this study draws on relevant studies by Zou and other scholars [
59,
60] to measure the radiation capacity of the central city to the surrounding small and medium-sized member cities using an improved gravity model. The development of transport facilities and the accessibility within the metropolitan area are reflected through economic connectivity in temporal and spatial contexts, respectively. Considering that there are certain differences in the development level of each member city within the area, the model uses the proportion of city GDP to the sum of the GDP of the two linked cities to correct the empirical constant
k.
Temporal economic connectivity formula is as follows:
Spatial economic connectivity formula is as follows:
where
i represents the central city of the metropolitan area,
j represents the other member cities,
is the intensity of economic connectivity between the city
i to the city
j,
S is the built-up area of the city,
P is the urban population of the city,
G is the GDP value of the city,
is the shortest travel path from the central city
i to the city
j based on traffic,
is the shortest travel time from the central city
i to the city
j.
2.6. Thiel Index
Reasonable industrial structure is the basis for ensuring the healthy development of the industry, due to the large difference between the economic level and industry development between the metropolitan areas, and considering the availability of data, the study draws on the relevant research of Li and Zou to measure the rationalization of industrial structure (RIS) in the area by using the Theil index, which is now widely applicable, and then explores the extent of coordinated industrial development in the metropolitan area [
61]. The formula is as follows:
where
i represents the industry,
G represents the gross domestic product (GDP), and
N represents the number of employed persons. According to the industry division, the value of k is taken as 3,
Gi/
G is the proportion of value added of the three industries to GDP, and
Ni/
N is the proportion of employees in the three industries. If
Gi/
Ni =
G/
N, then
RIS = 0, which means the economy is in equilibrium at this time and the industrial structure is most reasonable.
2.7. Industrial Structure Similarity Coefficient
The homogenization of industries is prone to the phenomenon of competition, resulting in the irrational allocation of resource factors. This paper measures the extent of industrial structure convergence in metropolitan areas according to the industrial structure similarity coefficient proposed by the United Nations Industrial Development Organization. Considering the complexity of the industrial division in each metropolitan area and the availability of data, the study draws on the relevant research of Song and selects the added value of primary, secondary and tertiary industries to calculate the industrial structure similarity coefficient to measure the similarity of the three industrial structures between the central city and the surrounding member cities in the metropolitan area [
62]. The formula is as follows:
where
i represents the central city of the metropolitan area,
j represents the surrounding member cities,
is the similarity coefficient between the central city
i and the city
j. is the industry
k of central city
i and
is the industry
k of member city
j. A high similarity coefficient indicates a high extent of convergence in the industrial structure of the two regions and there is a problem of duplicate construction and production.
3. Results and Discussion
For the five subsystems in the evaluation index system, this study assigns weight to them as equally important, then uses MATLAB software to solve the target planning formula (7), and then normalizes the results to obtain the weight coefficients of the evaluation indices (as shown in column 6 of
Table 2). Among them, the weight corresponding to the indicator of electricity supply per capita (A37) is too small to be shown, indicating that the difference in electricity consumption per capita among metropolitan areas is not significant. After the quadratic weighting of time, the differences between the metropolitan areas become prominent.
3.1. Comprehensive Analysis of the Economic and Social Development Level
The evaluation values in
Table 5 show that there is a wide gap between the four metropolitan areas in the Yangtze River Delta region, with the differences between them becoming significant from 2007 onwards. The SMA, which is firmly on top of the economic and social development level between 2005 and 2020, is inextricably linked to the unique economic conditions and resources of its central city, Shanghai Municipality, and it has a much higher overall score than others and is growing strongly. It also shows that the SMA, as the leading metropolitan area in the region, can serve as a model for others and is of great reference significance.
As early as 2000, Jiangsu Province proposed the concept of building a Nanjing metropolitan area centered on the provincial capital Nanjing, which provided strong policy support and laid a clear development route, resulting in an upward trend in the economic and social development of the Nanjing metropolitan area over the past 16 years, amidst slight fluctuations.
Since the promulgation of the Outline in 2019, the economic and social development level of the SMA has slowed down, and that of the other metropolitan areas has been enhanced. The situation has responded positively to the proposal in the Outline. The economic and social development momentum of HZMA is obviously insufficient, as the closest area to the SMA has not reached the expected level of development, and there is a large gap between the two. There are two possible reasons for this phenomenon: firstly, the number of cities in the HZMA is relatively small, which leads to a slight lack of comprehensive strength; secondly, there is an overlap of cities between the two, which may lead to competition. In order to avoid such competition, both areas can introduce relevant policies to avoid homogenous competition, while SMA can also appropriately evacuate non-core resource elements and provide development opportunities to HZMA to avoid the siphoning effect.
According to the empirical results, the economic and social development of the HFMA lags behind that of the others, and although the number of member cities has an advantage over that of the HZMA, its overall level of development is weak. At the same time, there is an overlap of member cities with the NMA, which may lead to a lack of development momentum. However, the area has certain advantages in some indices, so it can ensure the steady development of strengths while focusing on the construction of other weak aspects in order to improve comprehensive strength.
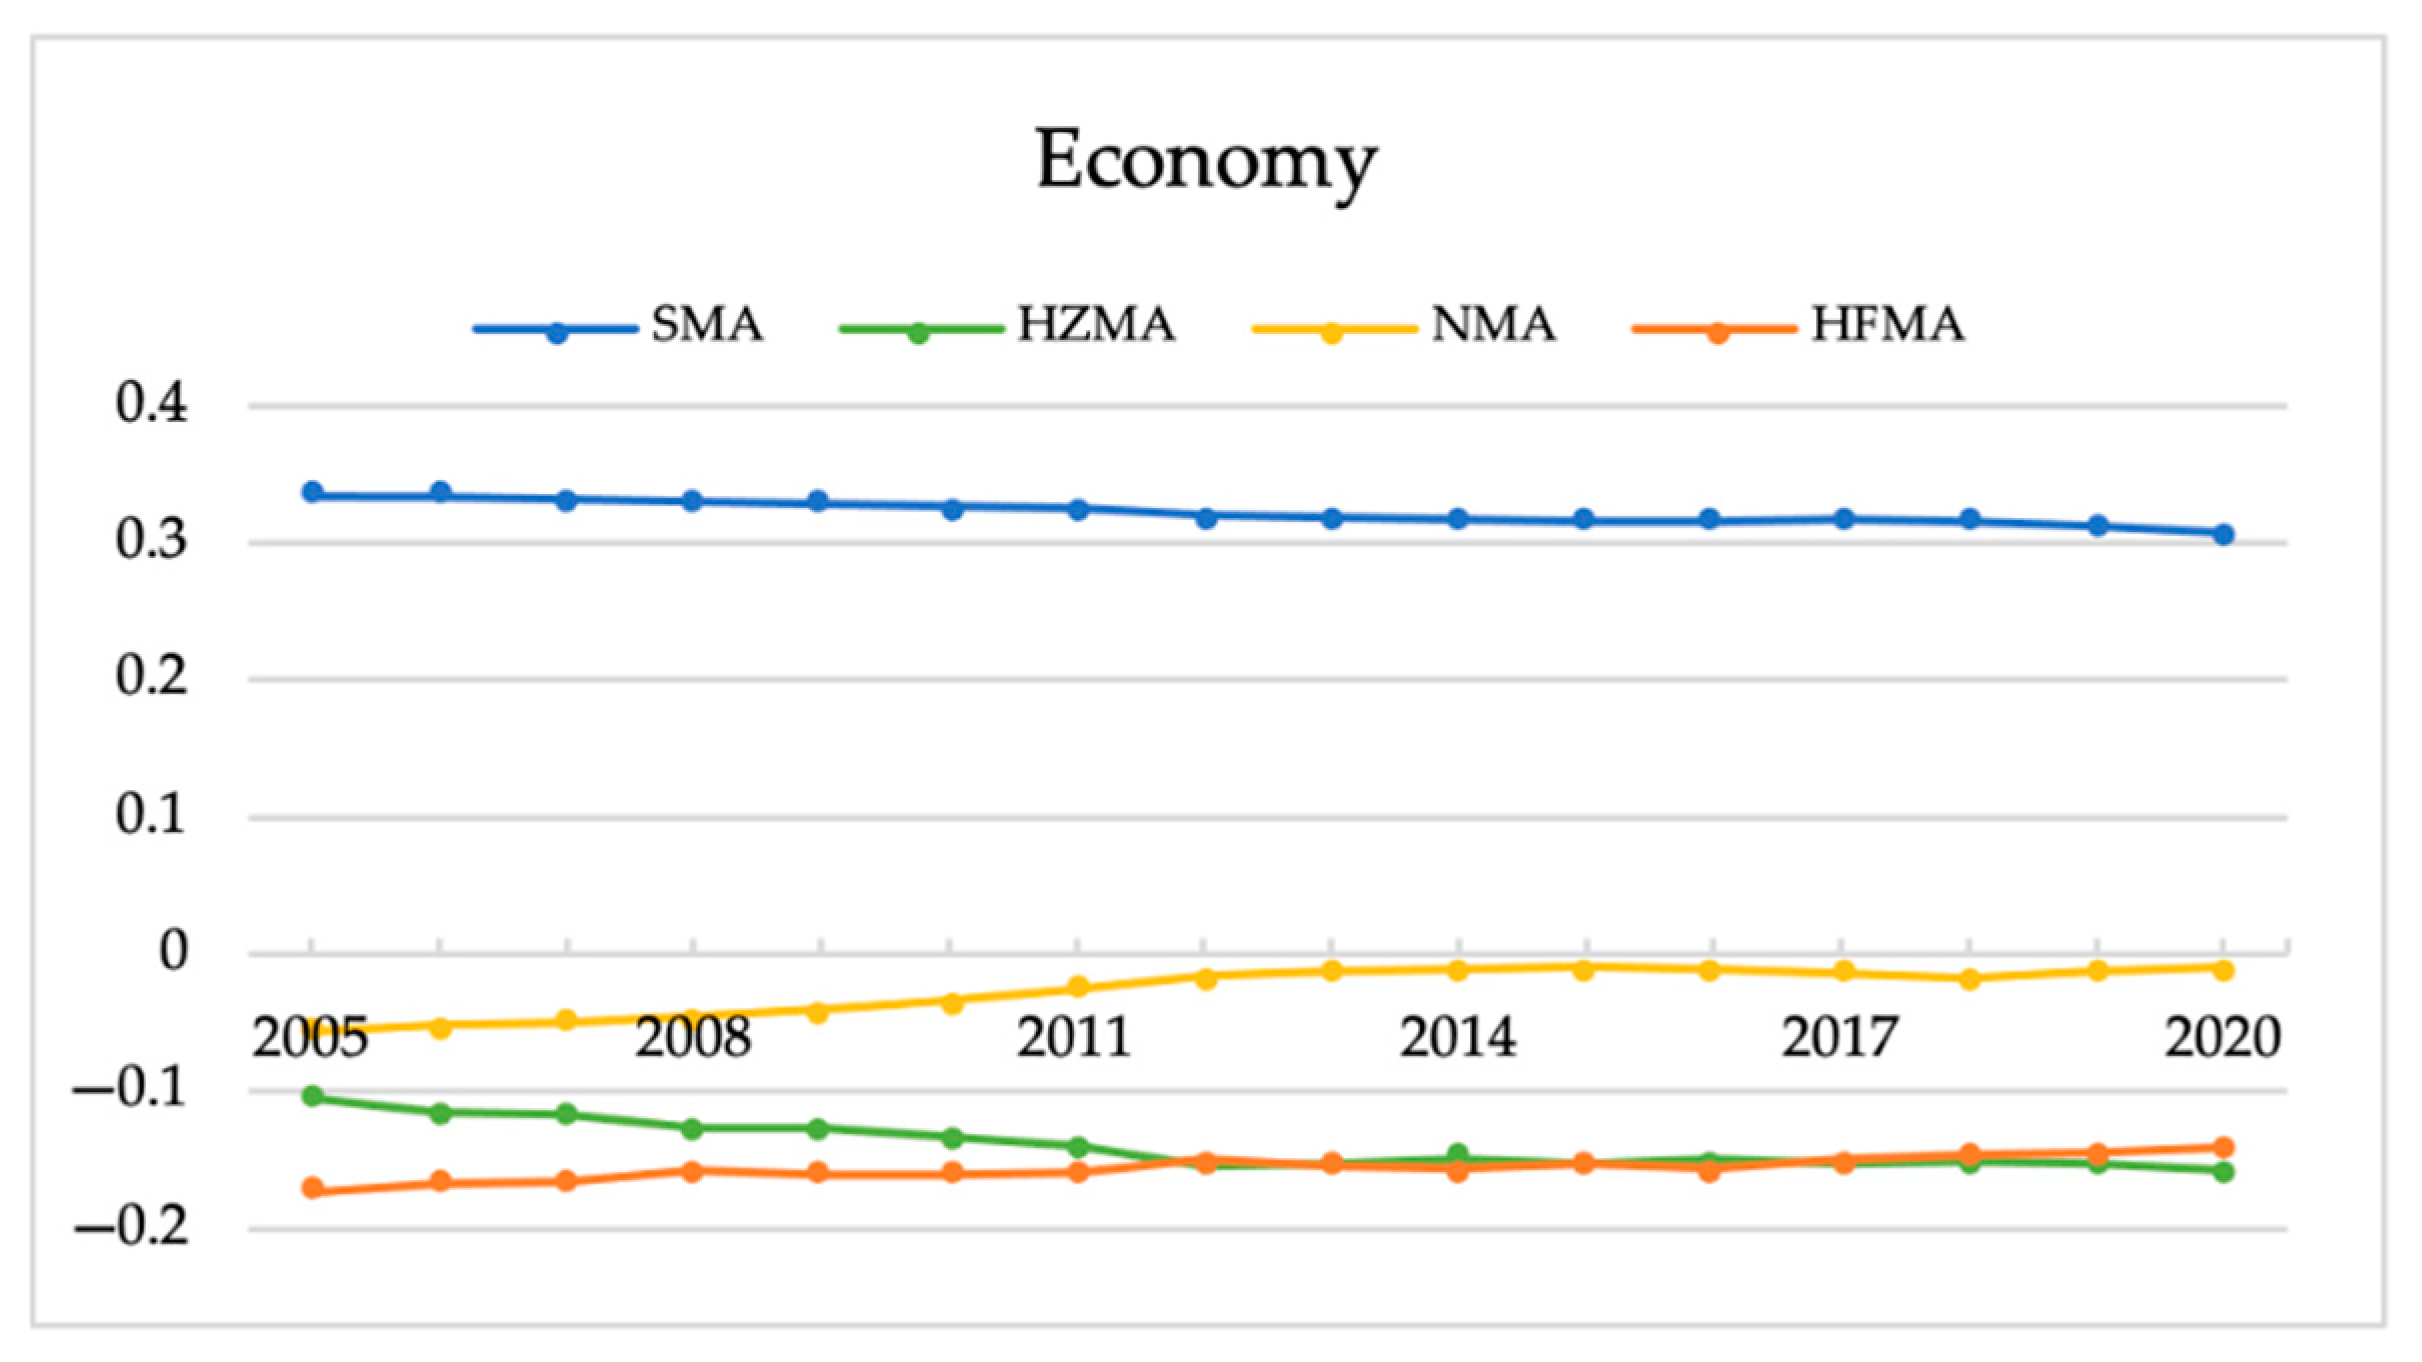
3.2. Analysis of Economic and Innovation
According to
Table 6, the SMA has a strong economic dynamism and is firmly in first position. Although the economic development of the NMA is more ahead of the HZMA and HFMA, the gap between its economic openness and the two is small, indicating that the development of this aspect in the NMA is lacking, and focus on its construction is needed.
According to
Figure 1, the gap in economic development between HFMA and HZMA has been decreasing year by year, with the HZMA being surpassed in 2012, benefiting from the steady upward trend of economic base and economic strength indicator scores in the HFMA, which has led to an overall increase in economic development. The deeper reason may be related to the characteristics of the HFMA itself, which has a strong development of private enterprises in economic structure, giving the area a better business environment and providing a driving force for economic growth.
At the innovation level (See
Figure 2 for details), the SNA is in a stable state of development. The NMA has been developing strongly since 2005, and it overtook the HZMA to take second position in 2012. On the contrary, the gap between the HFMA and the other three areas is increasing, which is not conducive to steady economic development. Innovation capacity plays an important role as a driver of economic transformation, and the HFMA can strengthen its innovation aspect to drive economic development and enhance the overall strength.
3.3. Analysis of Infrastructure and Space
According to the
Table 7, although the overall rank of the HFMA is not satisfactory, it has a significant increase compared with the other three areas in terms of infrastructure and is ranked third, ahead of the HZMA. The level of space development of the four major metropolitan areas in the Yangtze River Delta region has not fluctuated much over the past 16 years, with the HZMA having a weak level of space development and a low level of infrastructure development, which has resulted in a lack of momentum in population attraction and hence a less optimistic level of economic strength in recent years. Therefore, it is recommended that the HZMA should focus on the construction of basic transportation strength and public services, in order to enhance the happiness of residents and the population attractiveness, but it is also possible that the reason for this is that the number of member cities within the area is small, which leads to the area not having an advantage in the indices related to infrastructure and space.
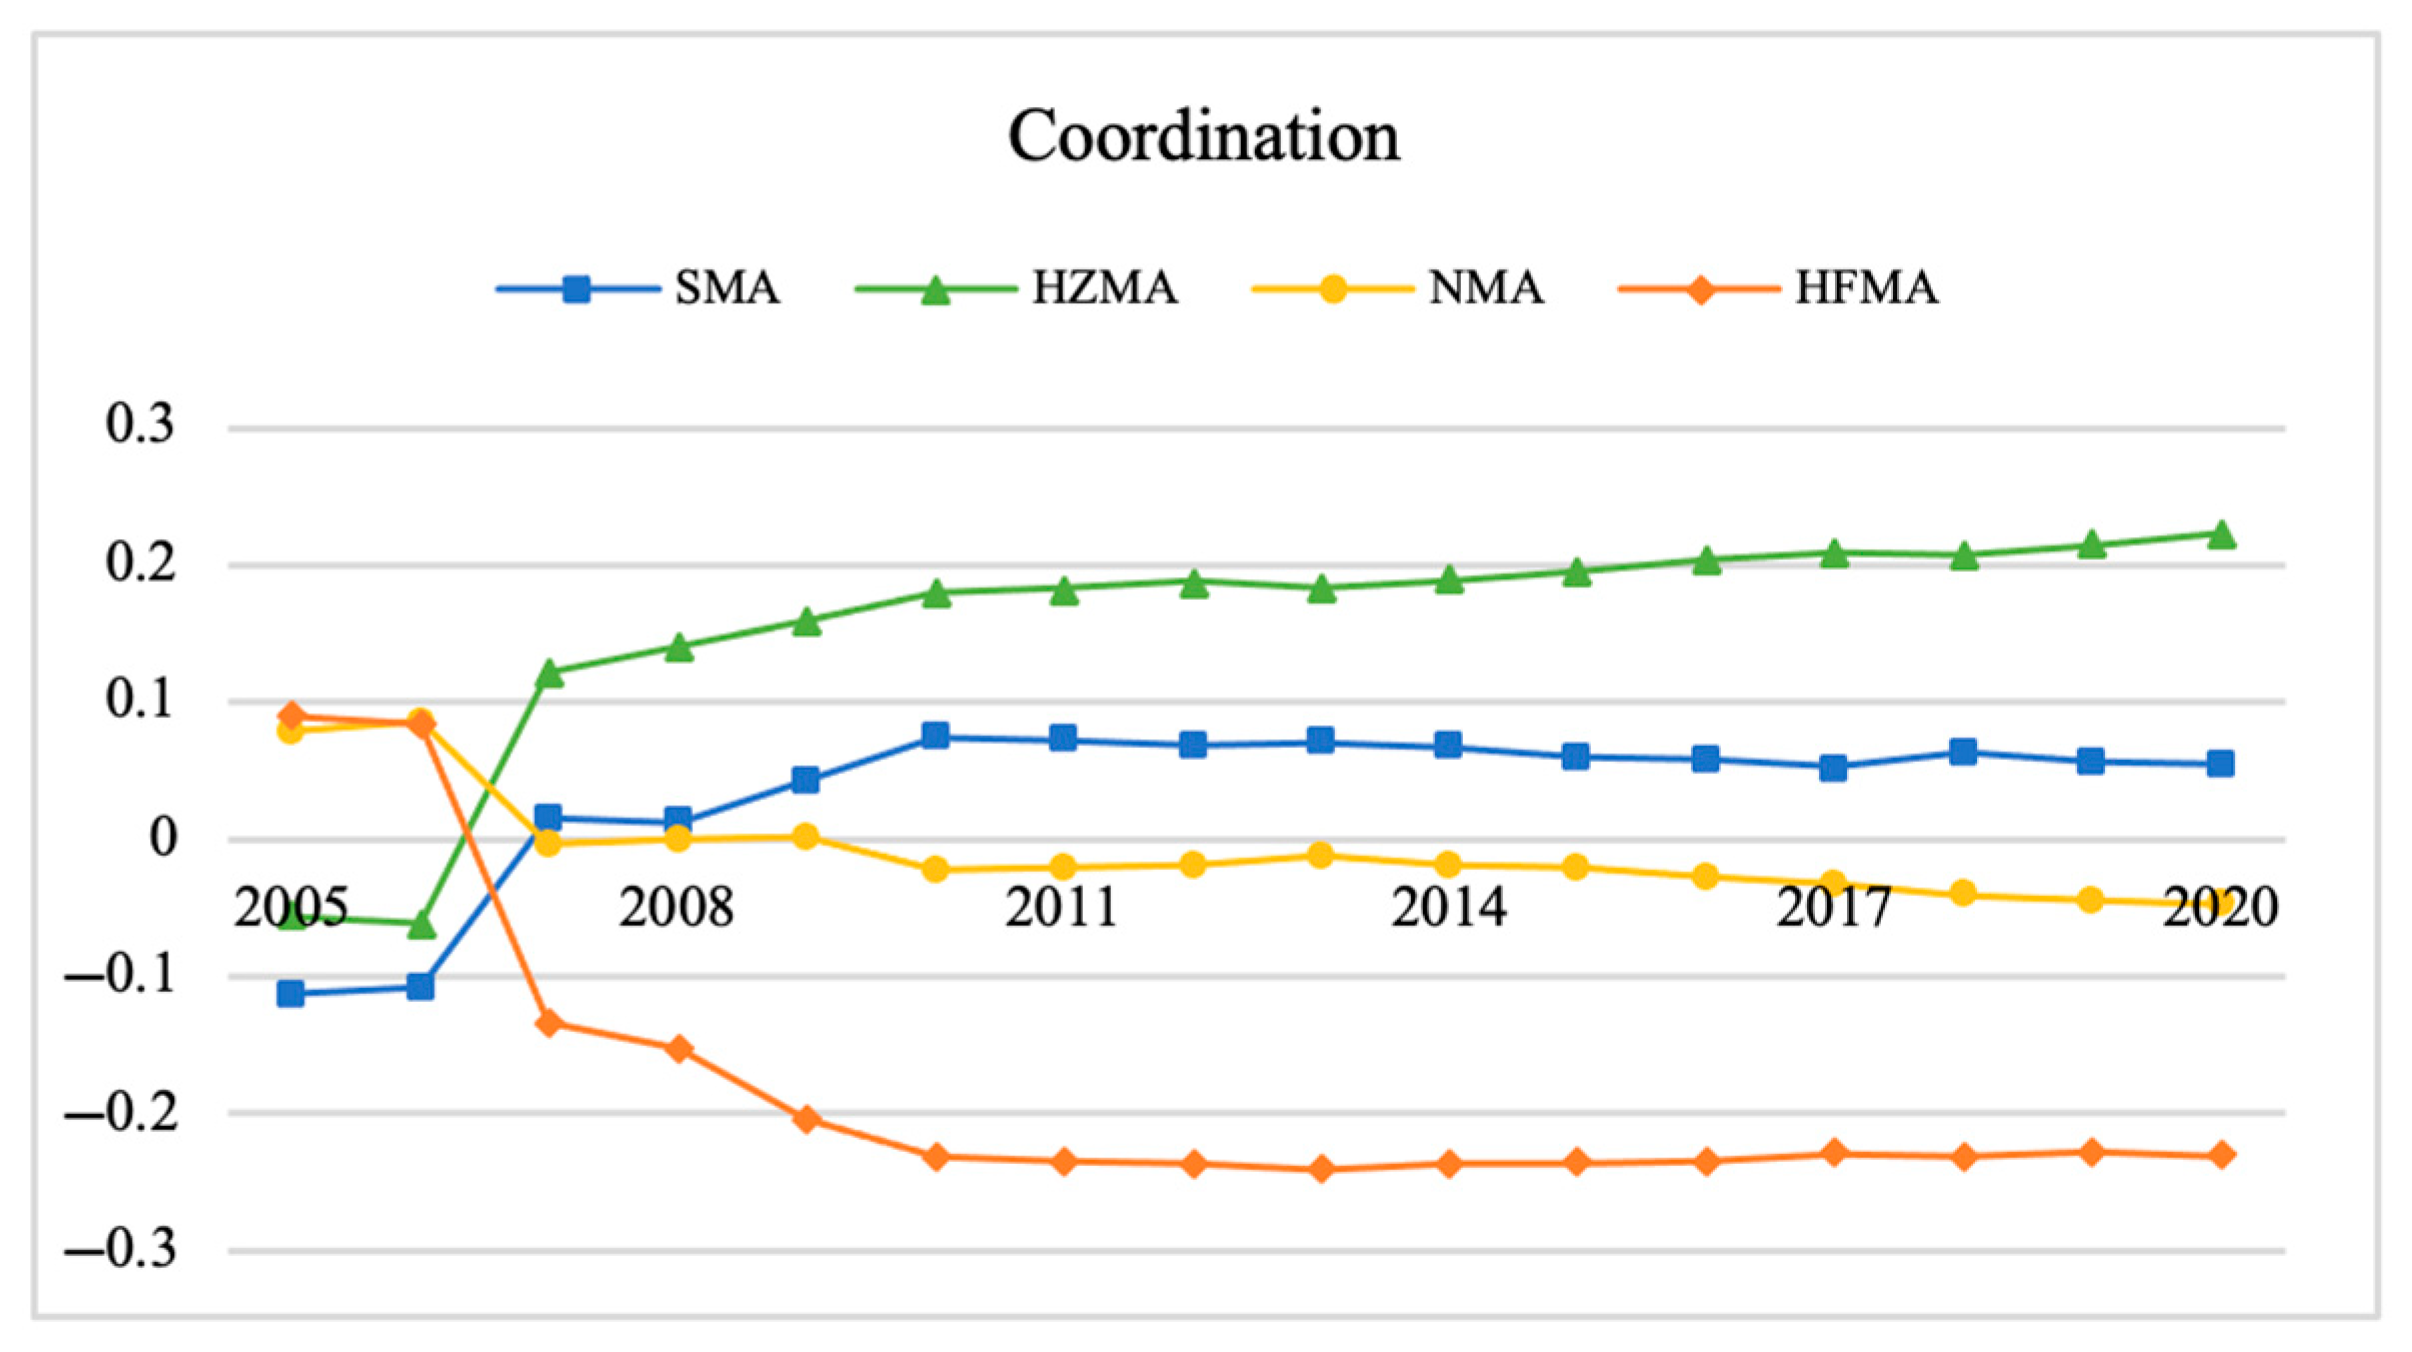
3.4. Analysis of Coordination
According to
Figure 3, the coordination of the SMA and HZMA were weak from 2005 to 2007, but the development level of two areas rose rapidly after 2007, and the gap between the four areas gradually widened, with the HZMA showing a clear advantage in the first place, followed by the SMA. After 2010, the development levels of the four areas were relatively stable.
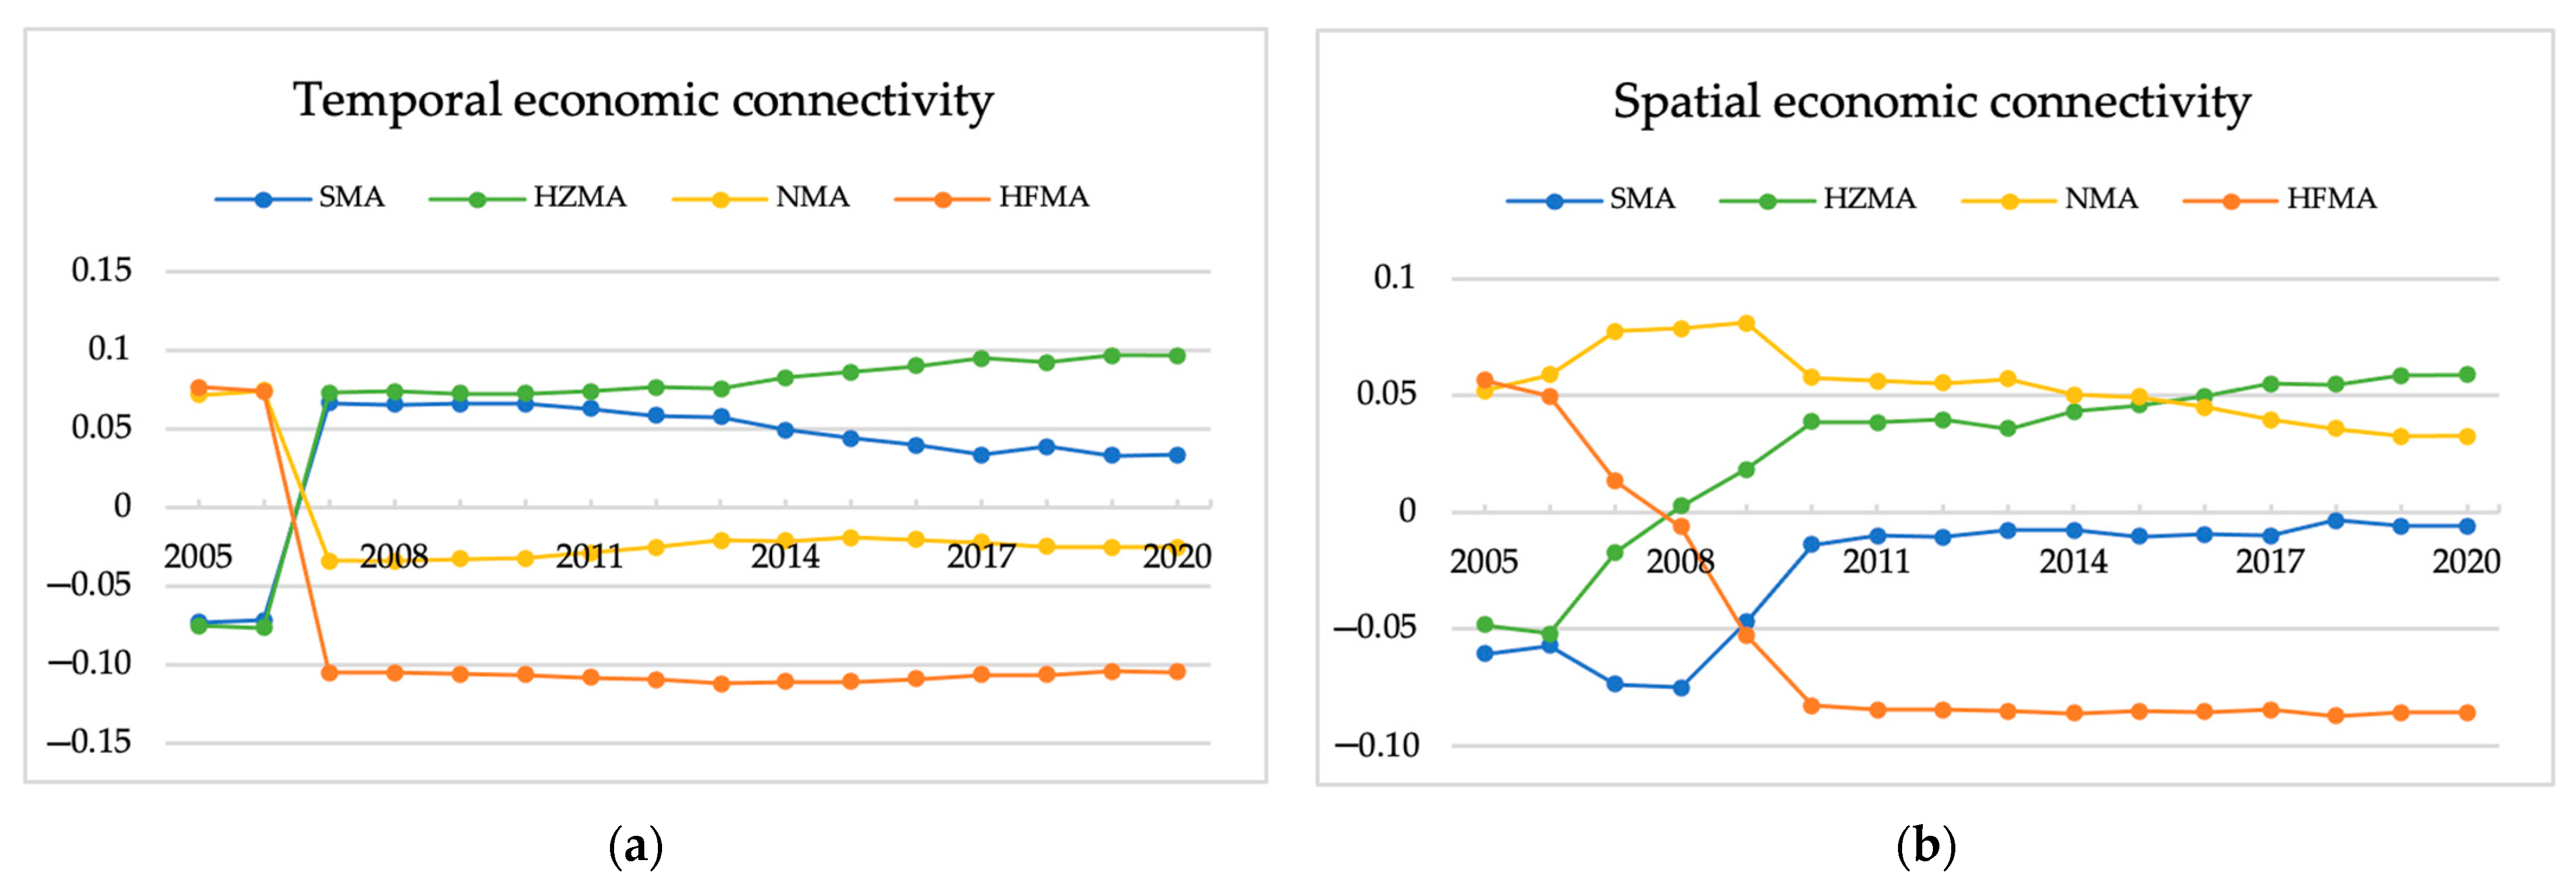
According to
Figure 4, the SMA has risen to the second highest level of coordination development due to the significant increase in spatial and temporal economic connectivity between 2005 and 2010. Prior to 2007, transport links between cities in the SMA were mainly by highway or public transport, and there were certain restrictions on the time and space distance. At the same time, there were many member cities in the SMA, and road access was not sufficient for the central city of Shanghai to form close links with the surrounding member cities, so the development of spatial and temporal economic links in the SMA was not satisfactory before 2007. However, the opening of the first Shanghai-Suzhou train in 2007 has largely weakened the spatial and temporal constraints and has efficiently increased the level of spatial and temporal economic connectivity within the area. This phenomenon is also evident in the HZMA, which has led to the highest level of development in spatial temporal economic connectivity.
Although the NMA does not have an outstanding advantage in terms of temporal economic linkages, the comprehensive performance of the area in the spatial economic connectivity ranks first, and the development level peaked in 2009 and then began to decline slowly and eventually leveled off. Due to the rapid rise of the SMA and HZMA, the HFMA did not have enough momentum to develop compared to them, and therefore the development tended to decline before 2010. The construction of smooth outward and inward transport links is the premise to ensure close economic connectivity. Therefore, each area should focus on the construction of transportation and strive to create a “one-hour commuting circle” in order to enhance the economic connectivity between the member cities, thus promoting the circulation of resources and factors within the area and providing a basic guarantee for the steady development of the metropolitan area.
- 2.
Analysis of the rationality and synergy of the industrial structure
According to the results of the industrial structure related indicator scores (see
Figure 5), it is clear that the industrial structure of the four metropolitan areas in the Yangtze River Delta region has certain shortcomings. Although the SMA has strong economic strength and a high degree of industrial structure rationalization, there is a certain lack of synergy, indicating that the three industrial structures of the central city and the neighboring member cities converge to a high degree. There may be a problem of fragmentation between Shanghai and other member cities in the area, with obvious administrative boundaries and a reluctance to disperse non-core industries or resource factors to other cities. This phenomenon will result in the fragmented flow of resource factors within the area, which is contrary to the core concept of coordinated industrial development in the metropolitan area. The NMA and the HFMA score low in terms of industrial rationality and synergy and have potential scope and capacity for transformation. The low degree of rationalization and high degree of convergence in industrial structure is likely to result in a more competitive, rather than cooperative pattern, which is not conducive to coordinated industrial development and then curbs the mainstream trend of colocation. Both should pay attention to the development of industrial structure, while ensuring healthy economic development. Although the HZMA is not at a high level of comprehensive development, it has a better advantage over the other three areas in rationalization and synergy of industrial structure, which can provide some reference for the future development direction of industries in other metropolitan areas.
4. Conclusions and Suggestions
Based on the new development concept of China and the core development concept of the metropolitan area, this paper constructs an evaluation system for the level of economic and social development. A quadratic weighted method was applied to evaluate the development level of the four metropolitan areas in the Yangtze River Delta region from 2005 to 2020. According to the empirical research results, the development among the four major metropolitan areas in the Yangtze River Delta region is relatively unbalanced, and the planning, transportation construction and industrial structure layout have an important impact on the economic and social development of the metropolitan area. The following conclusions can be drawn from the analysis:
- (1)
The spatial contradiction between top-level planning and collaborative governance practices is prominent. Duplication of member cities will result in competition for resource elements between metropolitan areas, and those with greater comprehensive strength in the central city will be more competitive and prone to a siphoning effect, to the detriment of the development of surrounding metropolitan areas, which, in turn, will result in imbalanced regional economic development [
63].
- (2)
A tendency for innovation to grow or decline in tandem with economic development, indirectly indicating that the development of innovation level can drive the economic growth of the area to a certain extent.
- (3)
Infrastructure and spatial development in metropolitan areas are mutually reinforcing [
63]. Good infrastructure development helps to attract foreign populations, bringing development dynamics to the metropolitan area, while the increased spatial potential of areas also contributes to the development of infrastructure, which, in turn, promotes economic development.
- (4)
The lagging construction of rail transit leads to insufficient radiation and driving effect of central cities. The importance of transport development is reflected in the fact that strengthening transport in metropolitan areas can greatly improve the spatial and temporal economic connectivity within the area [
12].
- (5)
The central city is not strong in radiation and drive, and the problem of excessive siphoning of resources is prominent [
11]. For metropolitan areas with strong central cities, such as the SMA and NMA, which have stronger control over resource factors, it is more likely that they will produce a high degree of industrial structural synergy, which also illustrates the problem that central cities are reluctant to evacuate non-core industries to neighboring member cities [
64]. Meanwhile, a high degree of industrial structural convergence among member cities is not conducive to the integrated development of metropolitan areas.
The paper puts forward the following suggestions:
- (1)
The metropolitan area needs to pay attention to the top-level design of policies to avoid duplication of construction of member cities, while building a reasonable “pyramid” type city distribution system within the area, enhancing the agglomeration and diffusion capacity of central cities, improving the decentralization level of medium-sized cities, and avoiding an excessive number of small cities in the region [
13]. To break down local protection, eliminate administrative barriers and avoid low-level duplication and excessive homogeneous competition by defining their own functional positioning [
65].
- (2)
The metropolitan area can accelerate the cultivation of globally competitive science and technology innovation centers, and through the construction of an efficient research system in order to gather innovation factors, create a first-class platform for science and technology innovation.
- (3)
Pay attention to public services, establish a unified and coordinated system and mechanism [
62], realize the interconnection of infrastructure among member cities in the metropolitan area, avoid conflicts of interests brought about by administrative divisions, so that the infrastructure development of the metropolitan area can be organically integrated with the development of economy and society, and improve the well-being of residents, while avoiding the over-agglomeration of population in the region.
- (4)
Optimize the layout of multi-level integrated transport hubs in the metropolitan area, create a modern transport network system in the region [
16], form an outreach and internal transport pattern and strengthen the main functions of major transport arteries and integrated transport networks in the metropolitan area, so as to promote a rational division of labor and linkage development among large, medium and small cities, and to enhance the radiation-driving capacity of their own city functions, while realizing the efficient connection of transport between regions.
- (5)
Deepen the integration and sharing of trading platforms for public resources within the metropolitan area, and promote the free flow of resources and factors so that the division of labor in the industry can be reasonably laid out [
66].
In addition, this study has certain limitations, due to the availability of data and the differences in local statistical indicators, some of which are not available, so they are not included in the index system for research. At the same time, this paper only studies the development of the four major metropolitan areas in the Yangtze River Delta region, and the level of economic development between the areas may be relatively close, the differences are not prominent enough, and there is limited room for mutual reference. In the future, we can explore the differences between multiple metropolitan areas in multiple regions (e.g., Beijing-Tianjin-Hebei, Chengdu-Chongqing, Pearl River Delta, etc.) by improving the index system, and propose improvement suggestions based on the significant differences between multiple regions in order to promote the formation of a regional economic layout for high-quality development in China, further highlighting the value of this study.


