Article

A Comparative Study of Mechanical and Microstructural Behavior for Metal Active Gas and Friction Stir Welded Micro-Alloyed Structural Steel

Department of Industrial and Digital Innovation, University of Palermo, Viale Delle Scienze, 90128 Palermo, Italy
*
Author to whom correspondence should be addressed.
J. Manuf. Mater. Process. 2022, 6(5), 104; https://doi.org/10.3390/jmmp6050104
Submission received: 30 July 2022 / Revised: 5 September 2022 / Accepted: 13 September 2022 / Published: 16 September 2022
(This article belongs to the Special Issue Advances in Welding Technology)

Abstract

:
Manufacturing tiny components into gigantic structures seems unimaginable without welding connections, whether it is for materials, parts, structures, or equipment. In the recent competitive market scenario, manufacturing industries are desperately looking for a viable alternative to fusion-based conventional material joining technologies, to improve upon cost-effectiveness along with performance. The present investigation is to evaluate the performance of structural steel thick plate joints prepared by advanced solid-state friction stir welding (FSW) over conventional metal active gas welding (MAG). The FSW experiments were carried out with different tool designs and configurations. The outcomes were evaluated in terms of microstructural integrity and mechanical joint resistance. Impressive results were obtained with FSW joints, characterized by an almost defect-free microstructure with a leaner heat-affected zone and higher joint resistance as compared to conventional MAG-welded joints.

1. Introduction

The recyclable nature of structural steel makes it a green construction material. According to a global report, the market size of structural steel valued at more than United States Dollar 100 billion in 2021, and is anticipated to grow at a compound annual growth rate (CAGR) of 5.3% from 2021 to 2028 [1]. Looking at this gigantic consumption pattern and anticipated growth numbers, a tiny improvement in the manufacturing/fabrication practices of structural steel could be multiplied into huge savings in terms of effort, time, and money. Manufacturers execute the structural design typically based on professional society-backed standards. A considerable improvement at this stage can lead to enduring the life of the component. An improvement in the fabrication technique could have a large contribution as it is a key factor for structural integrity. Welding technology finds its application in two different regimes, viz., manufacturing and maintenance. The present investigation is focused on the former.
Fusion-based welding of structural steel tends to have a complex relationship with heat input, reactivity, and phase formations wherein failure modes such as cracking, distortion, hydrogen dissolution, and embrittlement are very hard to avoid. The detrimental phase formation and resulting mechanical properties in the arc welding of several sheets of steel were examined in numerous previous investigations [2,3,4,5,6,7,8,9]. Reported defects like air holes and embrittlement cracks in the joints produced with the MAG welding of low carbon bainite ADB610 structural steel proposed by Zhang et al. [10]. Such defects were generated owing to the uncontrolled heating and cooling cycle during MAG welding.
In the last two decades, FSW has emerged as a credible alternative to conventional fusion-based joining techniques like shielded metal arc welding, Metal-arc Inert Gas (MIG), Metal-arc Active Gas (MAG) welding, etc. The mechanical performance of FSW joints has surpassed fusion-based welding joints produced with not only soft materials like aluminum and magnesium but harder ones such as structural steel, stainless steel, titanium, etc., owing to its low heat input attribute [11,12,13,14,15,16]. For instance, Fujii et al. [17] reported that FSW of carbon steel could be completed within a wide range of temperatures from below the A1 to above the A3 line. Moreover, FSW may offer a choice of resultant microstructure characterized by a refined mixture of ferrite and cementite, pearlite, bainite, or martensite, by simply altering the welding parameters. The comparison between MIG and FSW of aluminum alloy Al 5083, reported by Yazdipour et al. [18], indicated the distinct grain morphology in the welded zones. While the weld zone of the MIG specimen was characterized by larger grains than the parent metals, the FSW specimen was characterized by very fine equiaxed grain morphology. Moreover, an ultrafine-grained structure was reported by Xue et al. [19] for the FSW of steel joints, whereas only a coarse solidification microstructure was formed in the fusion welds of the same material. Such a distinction is majorly attributable to the distinctive heat input during welding. As it is minimal in the case of FSW, this joint microstructure is characterized by finer grains. Yan et al. [20] also reported identical results for A7N01-T4 aluminum alloy, wherein FSW specimens exhibited higher mechanical properties (i.e., joint resistance and hardness) as compared to MIG-welded specimens ensuing from a finer grain structure in the weld zone. Apart from the grain dimensions, the size of the heat-affected zone (HAZ) is also minimized comparatively in the case of FSW as per an investigation published by Kumar et al. [21] for mild steel. The HAZ, considered generally the weakest zone in most materials, is characterized by a larger grain with the induction of hard and brittle phases in the microstructure of arc-welded joints. As the HAZ size is minimized in the case of FSW, it not only improves the joint resistance but provides a more uniform defect-free microstructure.
It is strongly believed that the joint performance is varied by the welding parameters and resultant deformation behavior of steels at elevated temperatures [22,23,24]. Yet, the FSW of a thick steel plate is still considered challenging due to the size of the rotating tool and the required FSW machine rigidity. To date, only limited studies about FSW of thick structural steel plates with a thickness of more than 6 mm have been reported. A very interesting study was reported by Konkol et al. [25] for a two-pass FSW of 12.7 mm thick HSLA-65 steel, wherein a single pass weldment was 6.4 mm. However, numerous practical challenges are present during FSW of thick plates, as the very high amount of stress on the rotating tool at elevated temperatures causes very high tool wear or even fracture, which not only negatively affects the tool life but the cost economy of the FSW process [26].
From the presented pieces of literature, it can be stated that there is huge potential for structural steel butt joints for thick plates produced by FSW, in terms of its industrial applicability accompanied by the lack of literature availability. In particular, when welding thick plates by FSW, the pin length plays a key role in the final properties of the joint, as it determines the overlap between the two passes at the mid-thickness of the joint cross-section. This aspect, which has been very scarcely investigated in the literature, could be critical for the industrial adoption of the process. Hence, the objective of the present investigation is not only to compare the 8 mm thick structural steel joints produced by FSW and MAG but also to infer the role of different FSW tool designs and configurations on their microstructural and mechanical properties, including grain dimensions, detrimental phase formation, joint strength, and microhardness.

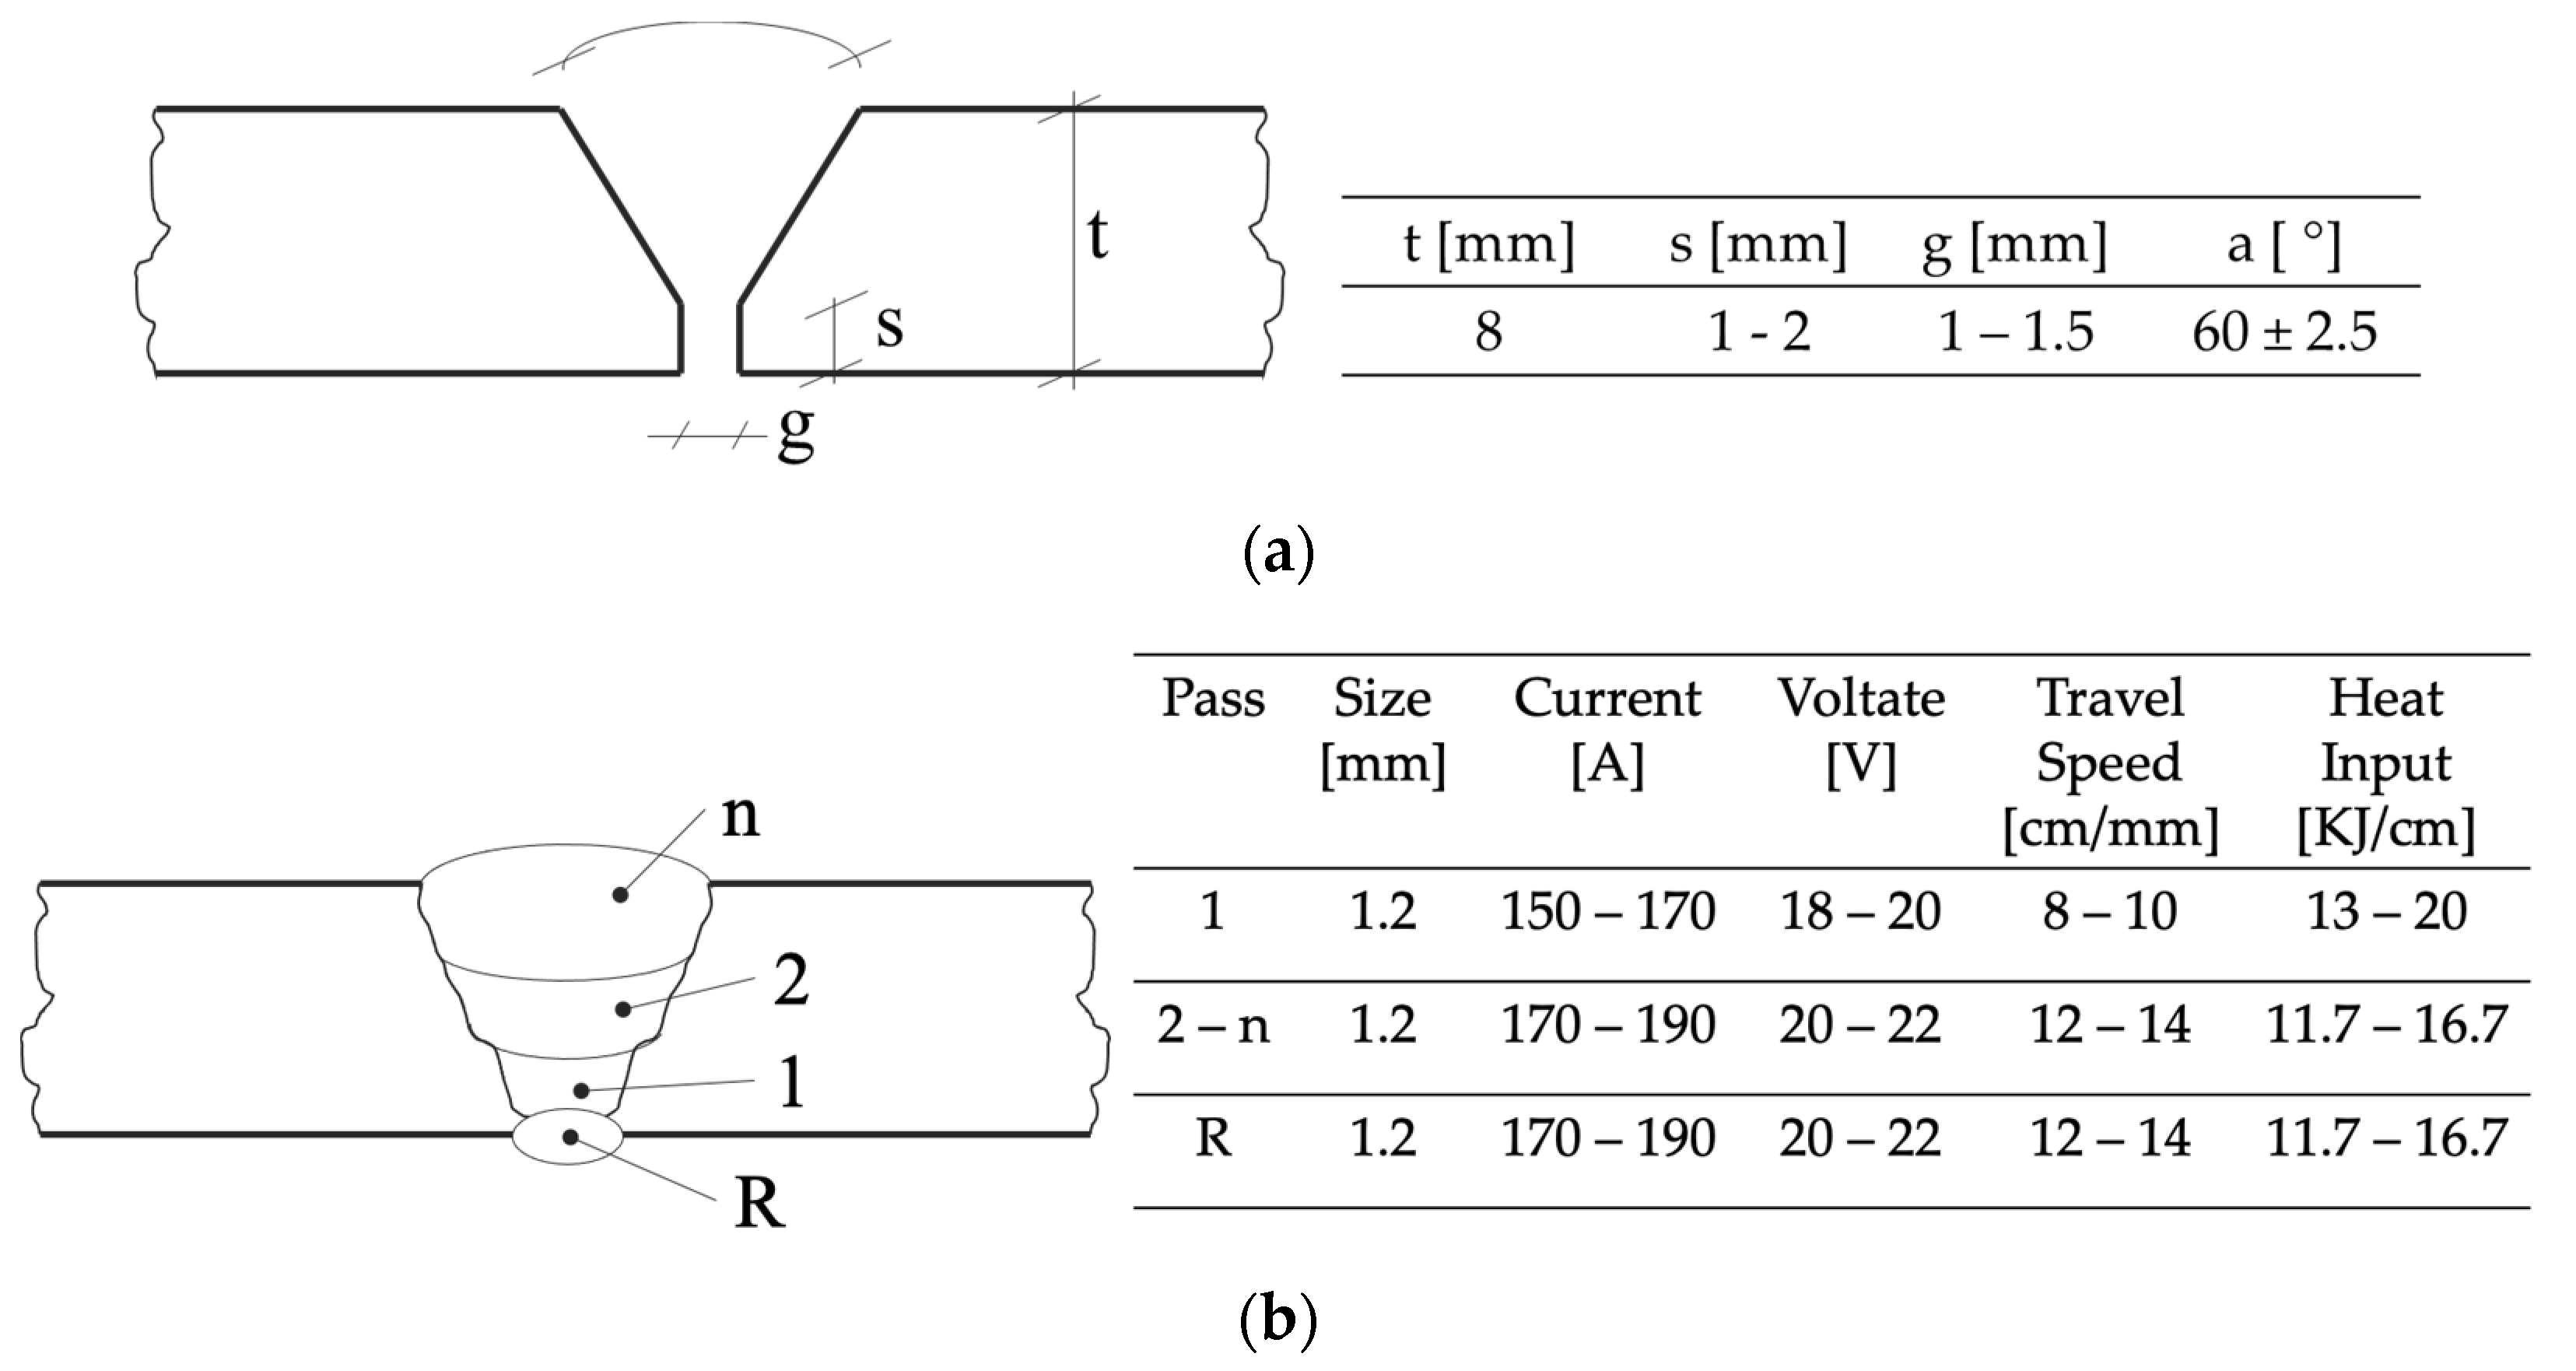
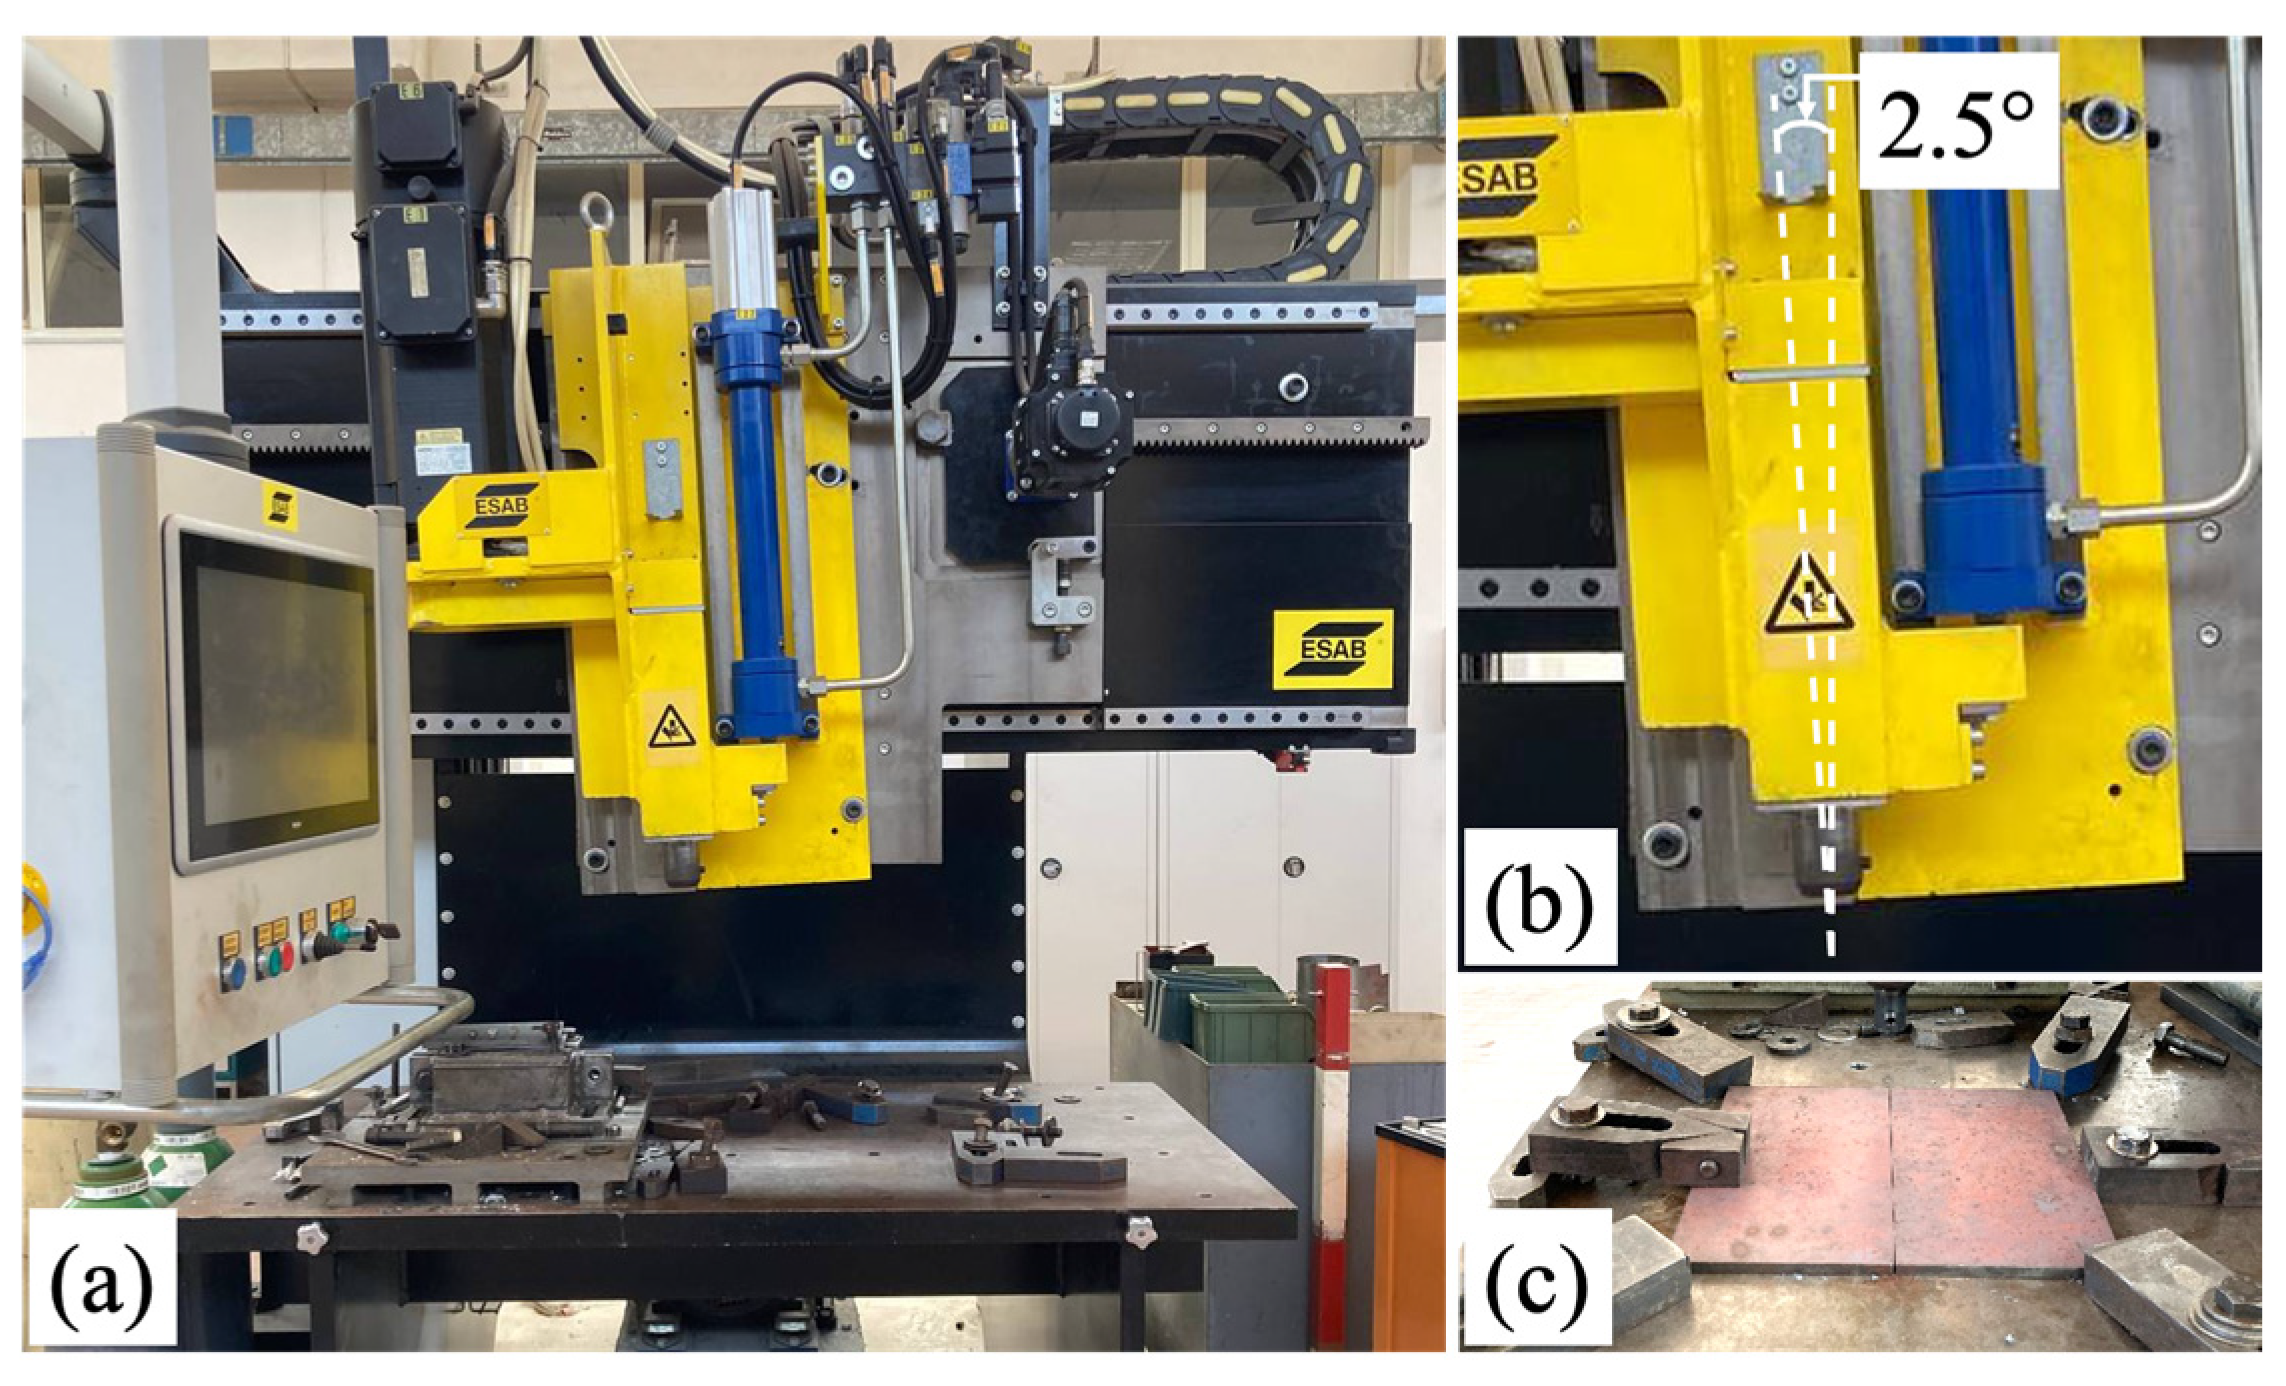
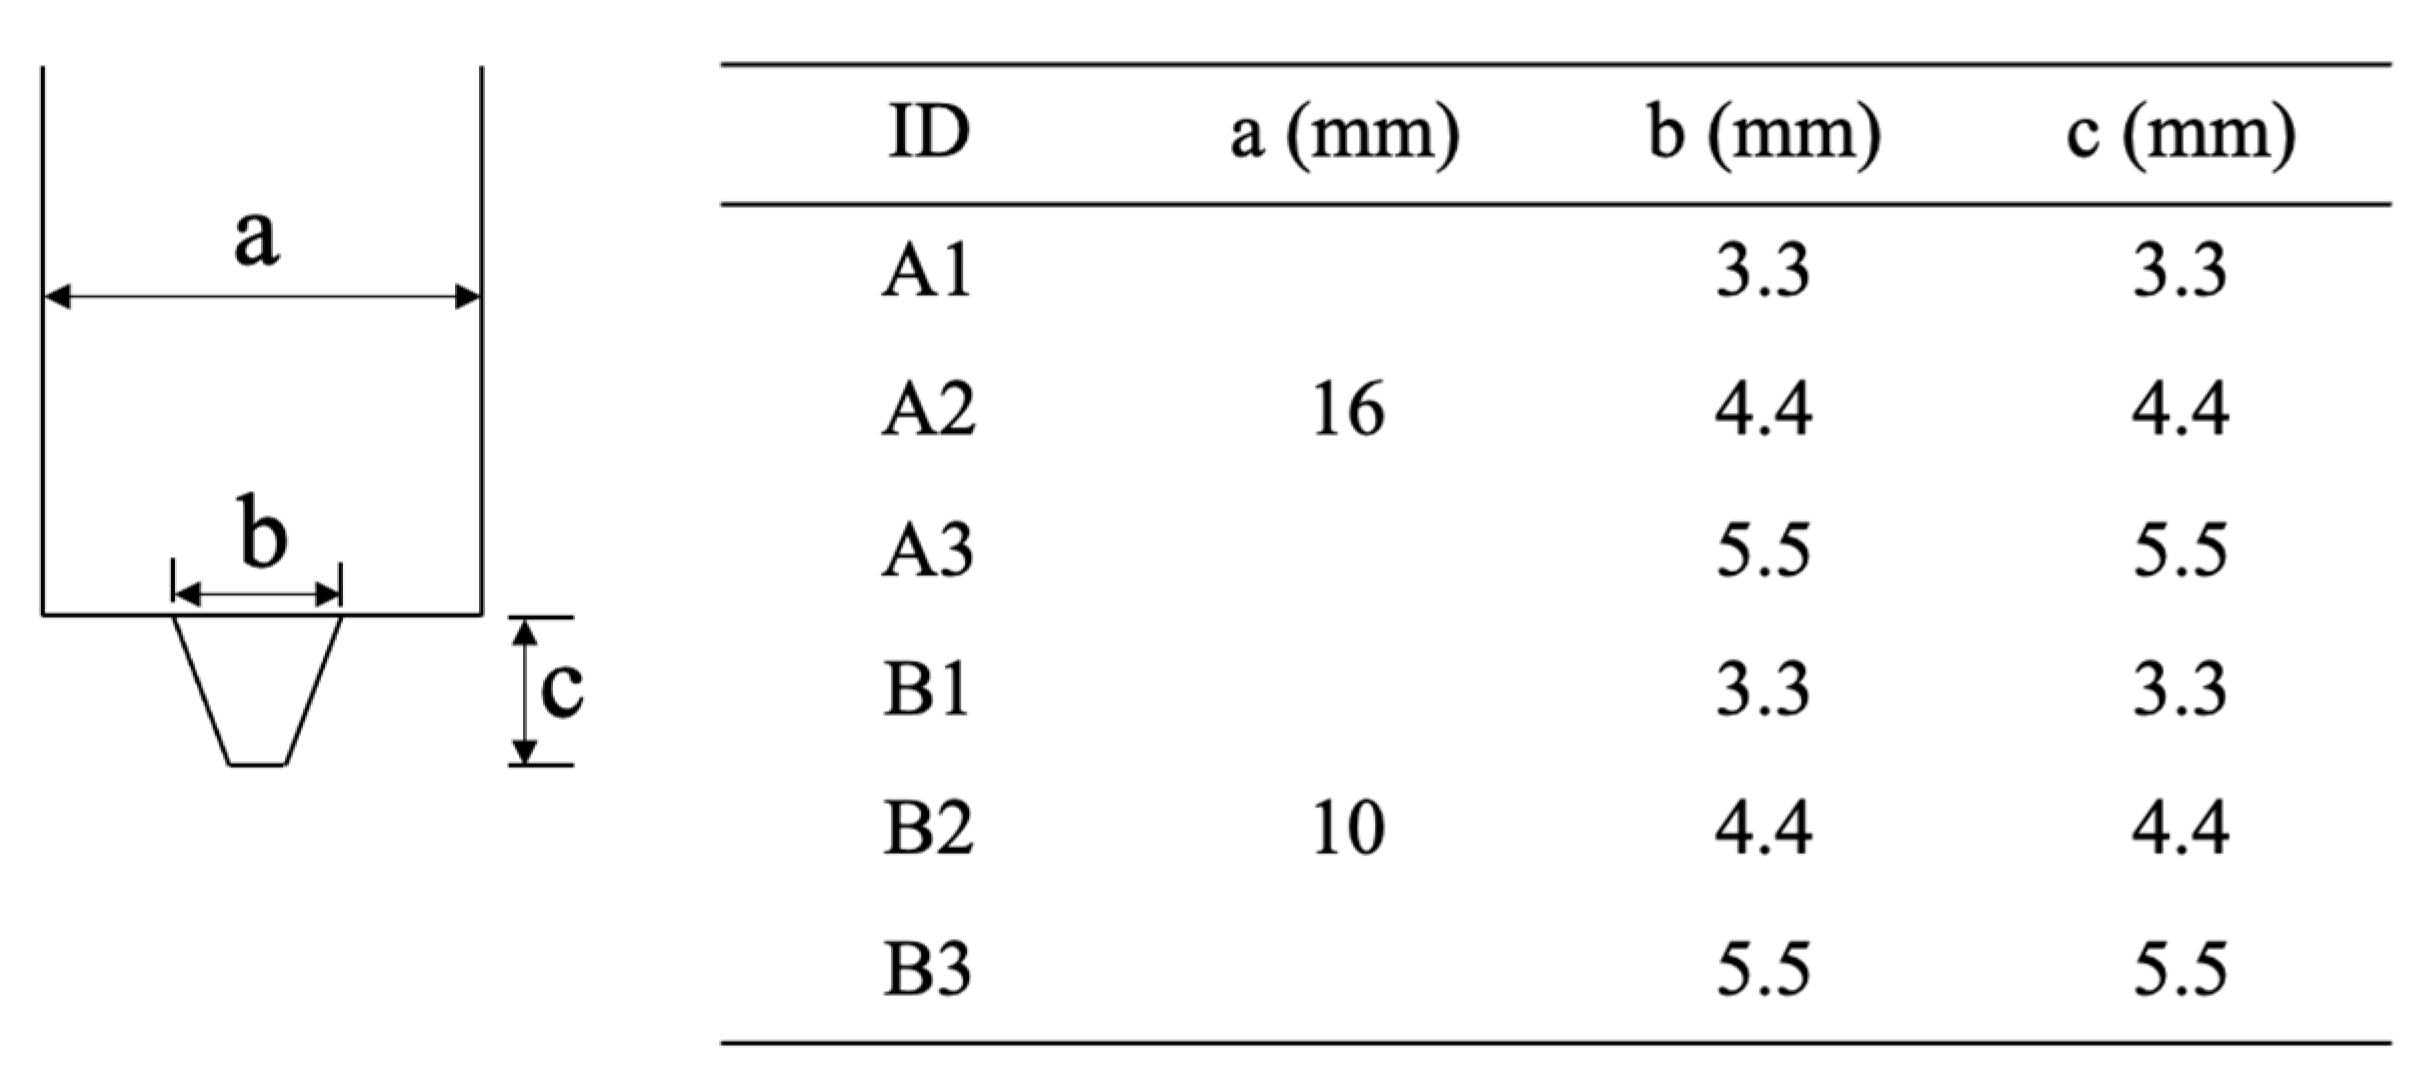
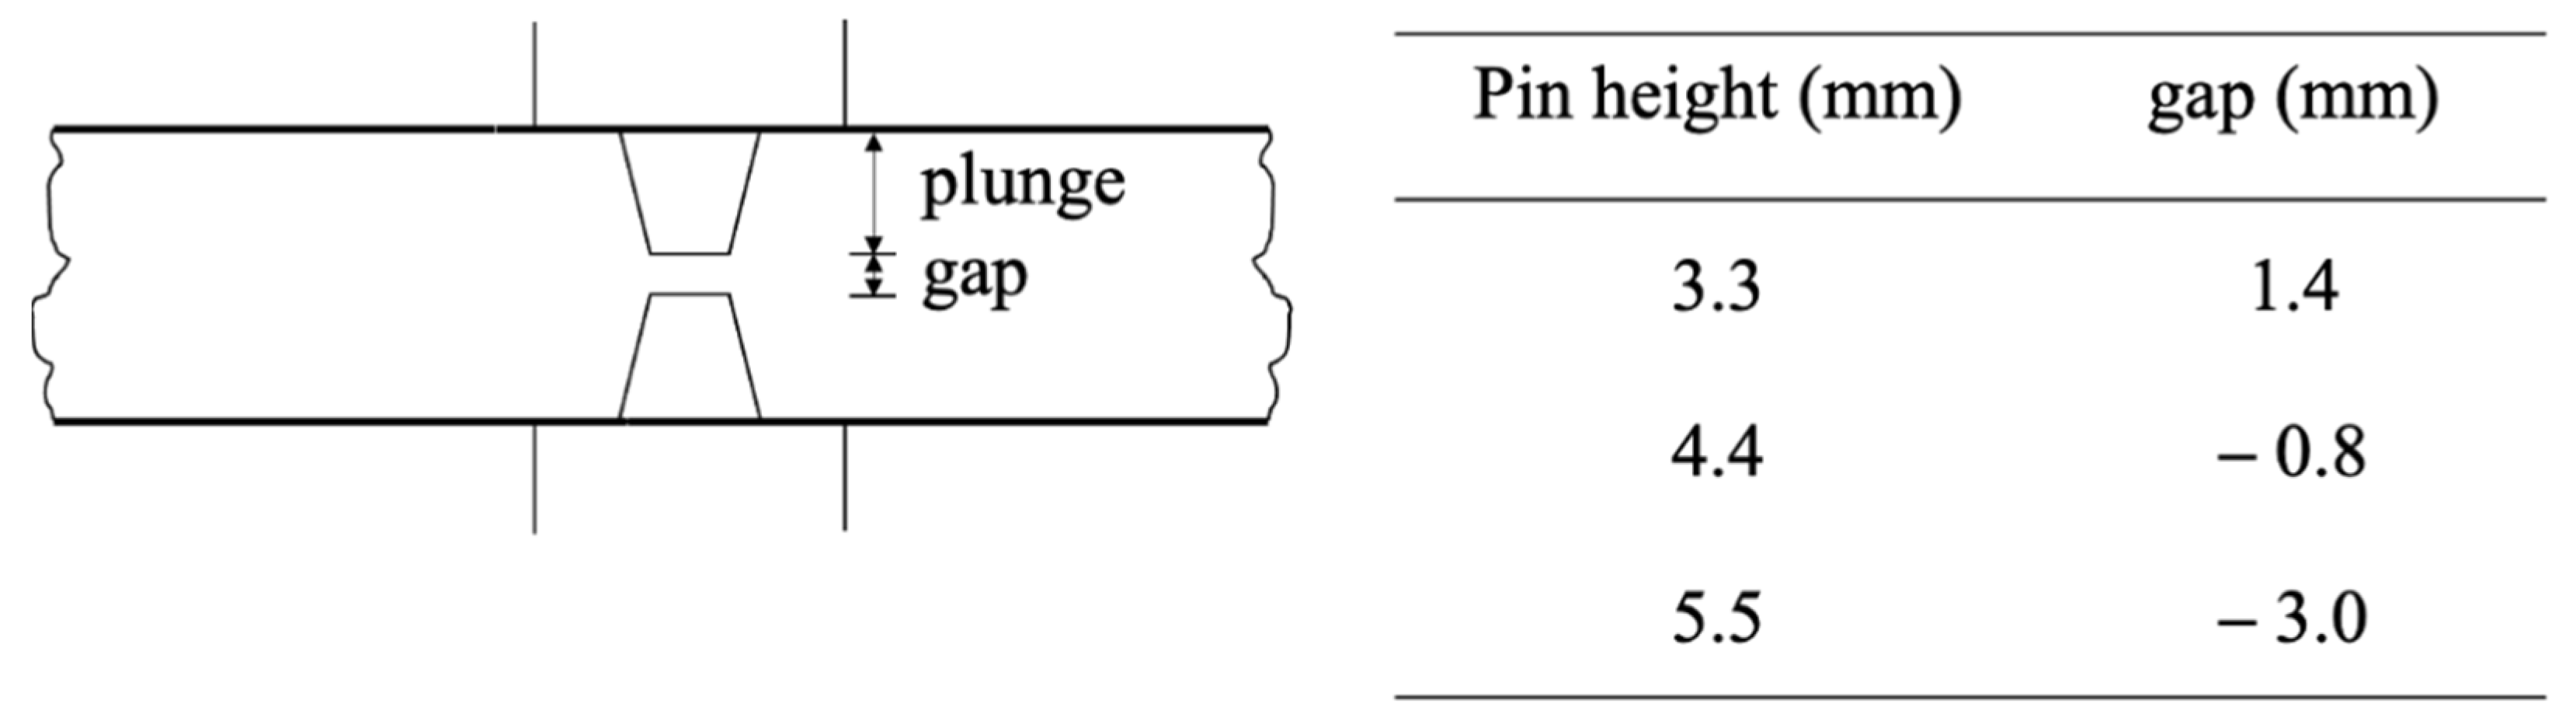
2. Materials and Methods

Joints prepared with low-carbon manganese steel (S355J2), plate sizing 300 × 250 × 8 mm, were the subject of the comparison between MAG and FSW experiments. The chemical composition and primary mechanical characteristics of the substrate material are listed in Table 1.
MAG welding was carried out on an ESAB welding machine (Origo MIG/MAG 6502cw) using a T 46 2 P M 21 1 H 10 flux-cored wire with rapidly solidifying slag and with an active gas mixture of Ar (80%) + CO2 (20%). Figure 1a,b show the geometrical characteristics and technological parameters for MAG, respectively.
All the FSW experiments were carried out on the ESAB LEGIO machine (Figure 2a), using a tool tilt angle of 2.5°(θ) and a clamping fixture as illustrated in Figure 2b,c, respectively.
W25Re, characterized by a melting temperature of 3050 °C and a recrystallization temperature of around 1900 °C, was used as FSW tool material. The experiments carried out with distinct FSW tool geometrical parameters are depicted with their IDs in Figure 3.
As far as the FSW process parameters are concerned, the tool rotation and the feed rates, 900 rpm and from 80 mm/min, respectively, were used. These parameters were derived from a preliminary experimental campaign. As the material thickness is very high and the extreme stress on the rotating tool at elevated temperatures causes very high tool wear, this leads to numerous defects as described earlier in Section 1. To counterfeit these consequences, FSW was carried out in two stages as displayed in Figure 4, wherein the first FSW pass to cover almost half-plate thickness was followed by the second pass with the plate flipped.
Cross-sections from the center of the welded seam were sliced perpendicular to the welding direction and prepared following the metallographic procedures. Further, they were hot mounted in resin, ground, and finally polished down with 3 µm diamond paste before etching with Picral reagent (HNO3 2% vol. + C2H5OH bal.%). Prepared microstructural samples were examined through optical microscopy (OM) (OLYMPUS, Model—Inverted Metallurgical Microscope GX51) for features such as grain morphologies, intermetallic particles, fractured particles, porosities, and other compositional elements.
Hardness traverses (2-mm increments) were produced across the weld regions using a 5 Kg load and a 15-s dwell time with an Eseway 4302 Vickers hardness tester. Tensile testing as per ASTM E8 was carried out on all the prepared samples with a velocity of 2 mm/minute.

3. Results

3.1. Welding Time and Economical Evaluation

MAG welding and FSW processes both work on different technological parameters; hence, for a proper evaluation as per industrial norms, the first and foremost step is to evaluate each process based on time and economy. The average time consumption for welding the length of 500 mm in 8 mm thick plate was 20–22 min for MAG welding whereas it was 12–13 min for FSW. On one hand, a total of five weld overlays were required, while on the other hand, FSW was finished with only two passes, viz., a top and bottom pass. It is important to note that this time is exclusive of time spent on the pre-weld preparation and post-welding treatments.
As far as the economical aspect is concerned, during FSW no filler material was consumed, while a total of 10 kg of filler material was consumed in 20 min of the MAG welding. Additionally, during the MAG process, 120 kg of inert gas was utilized at a rate of 260 [liters/min].

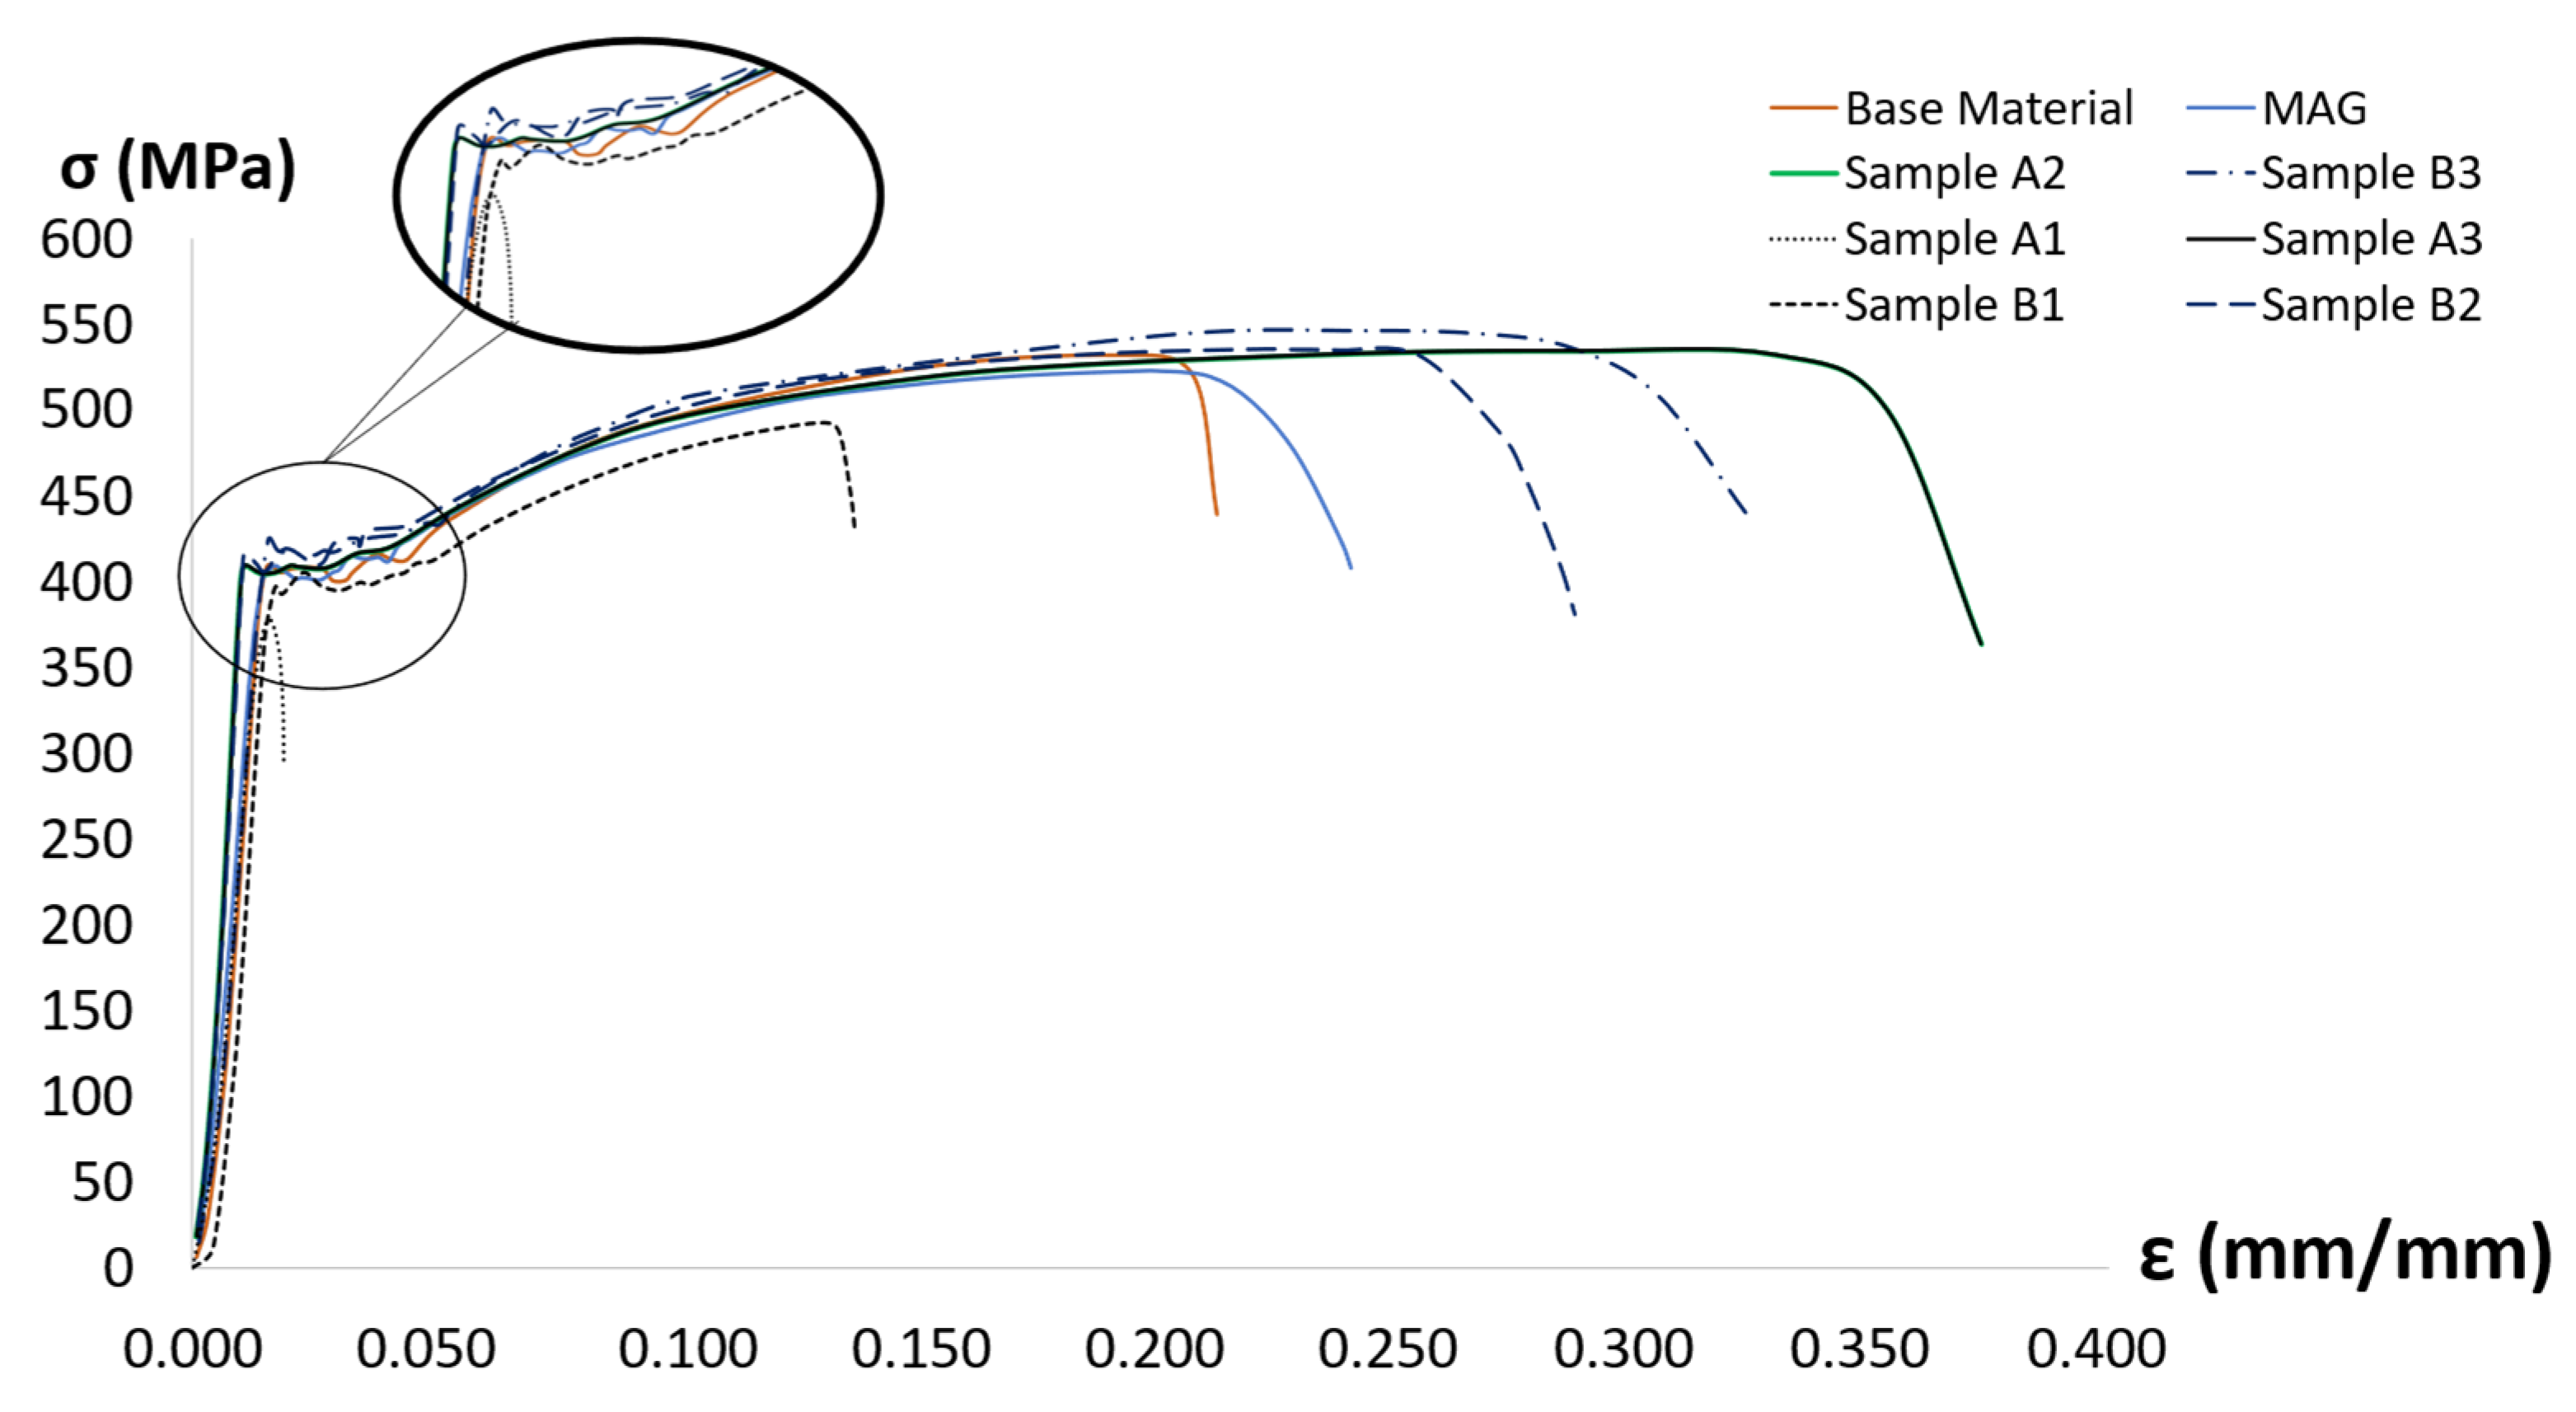
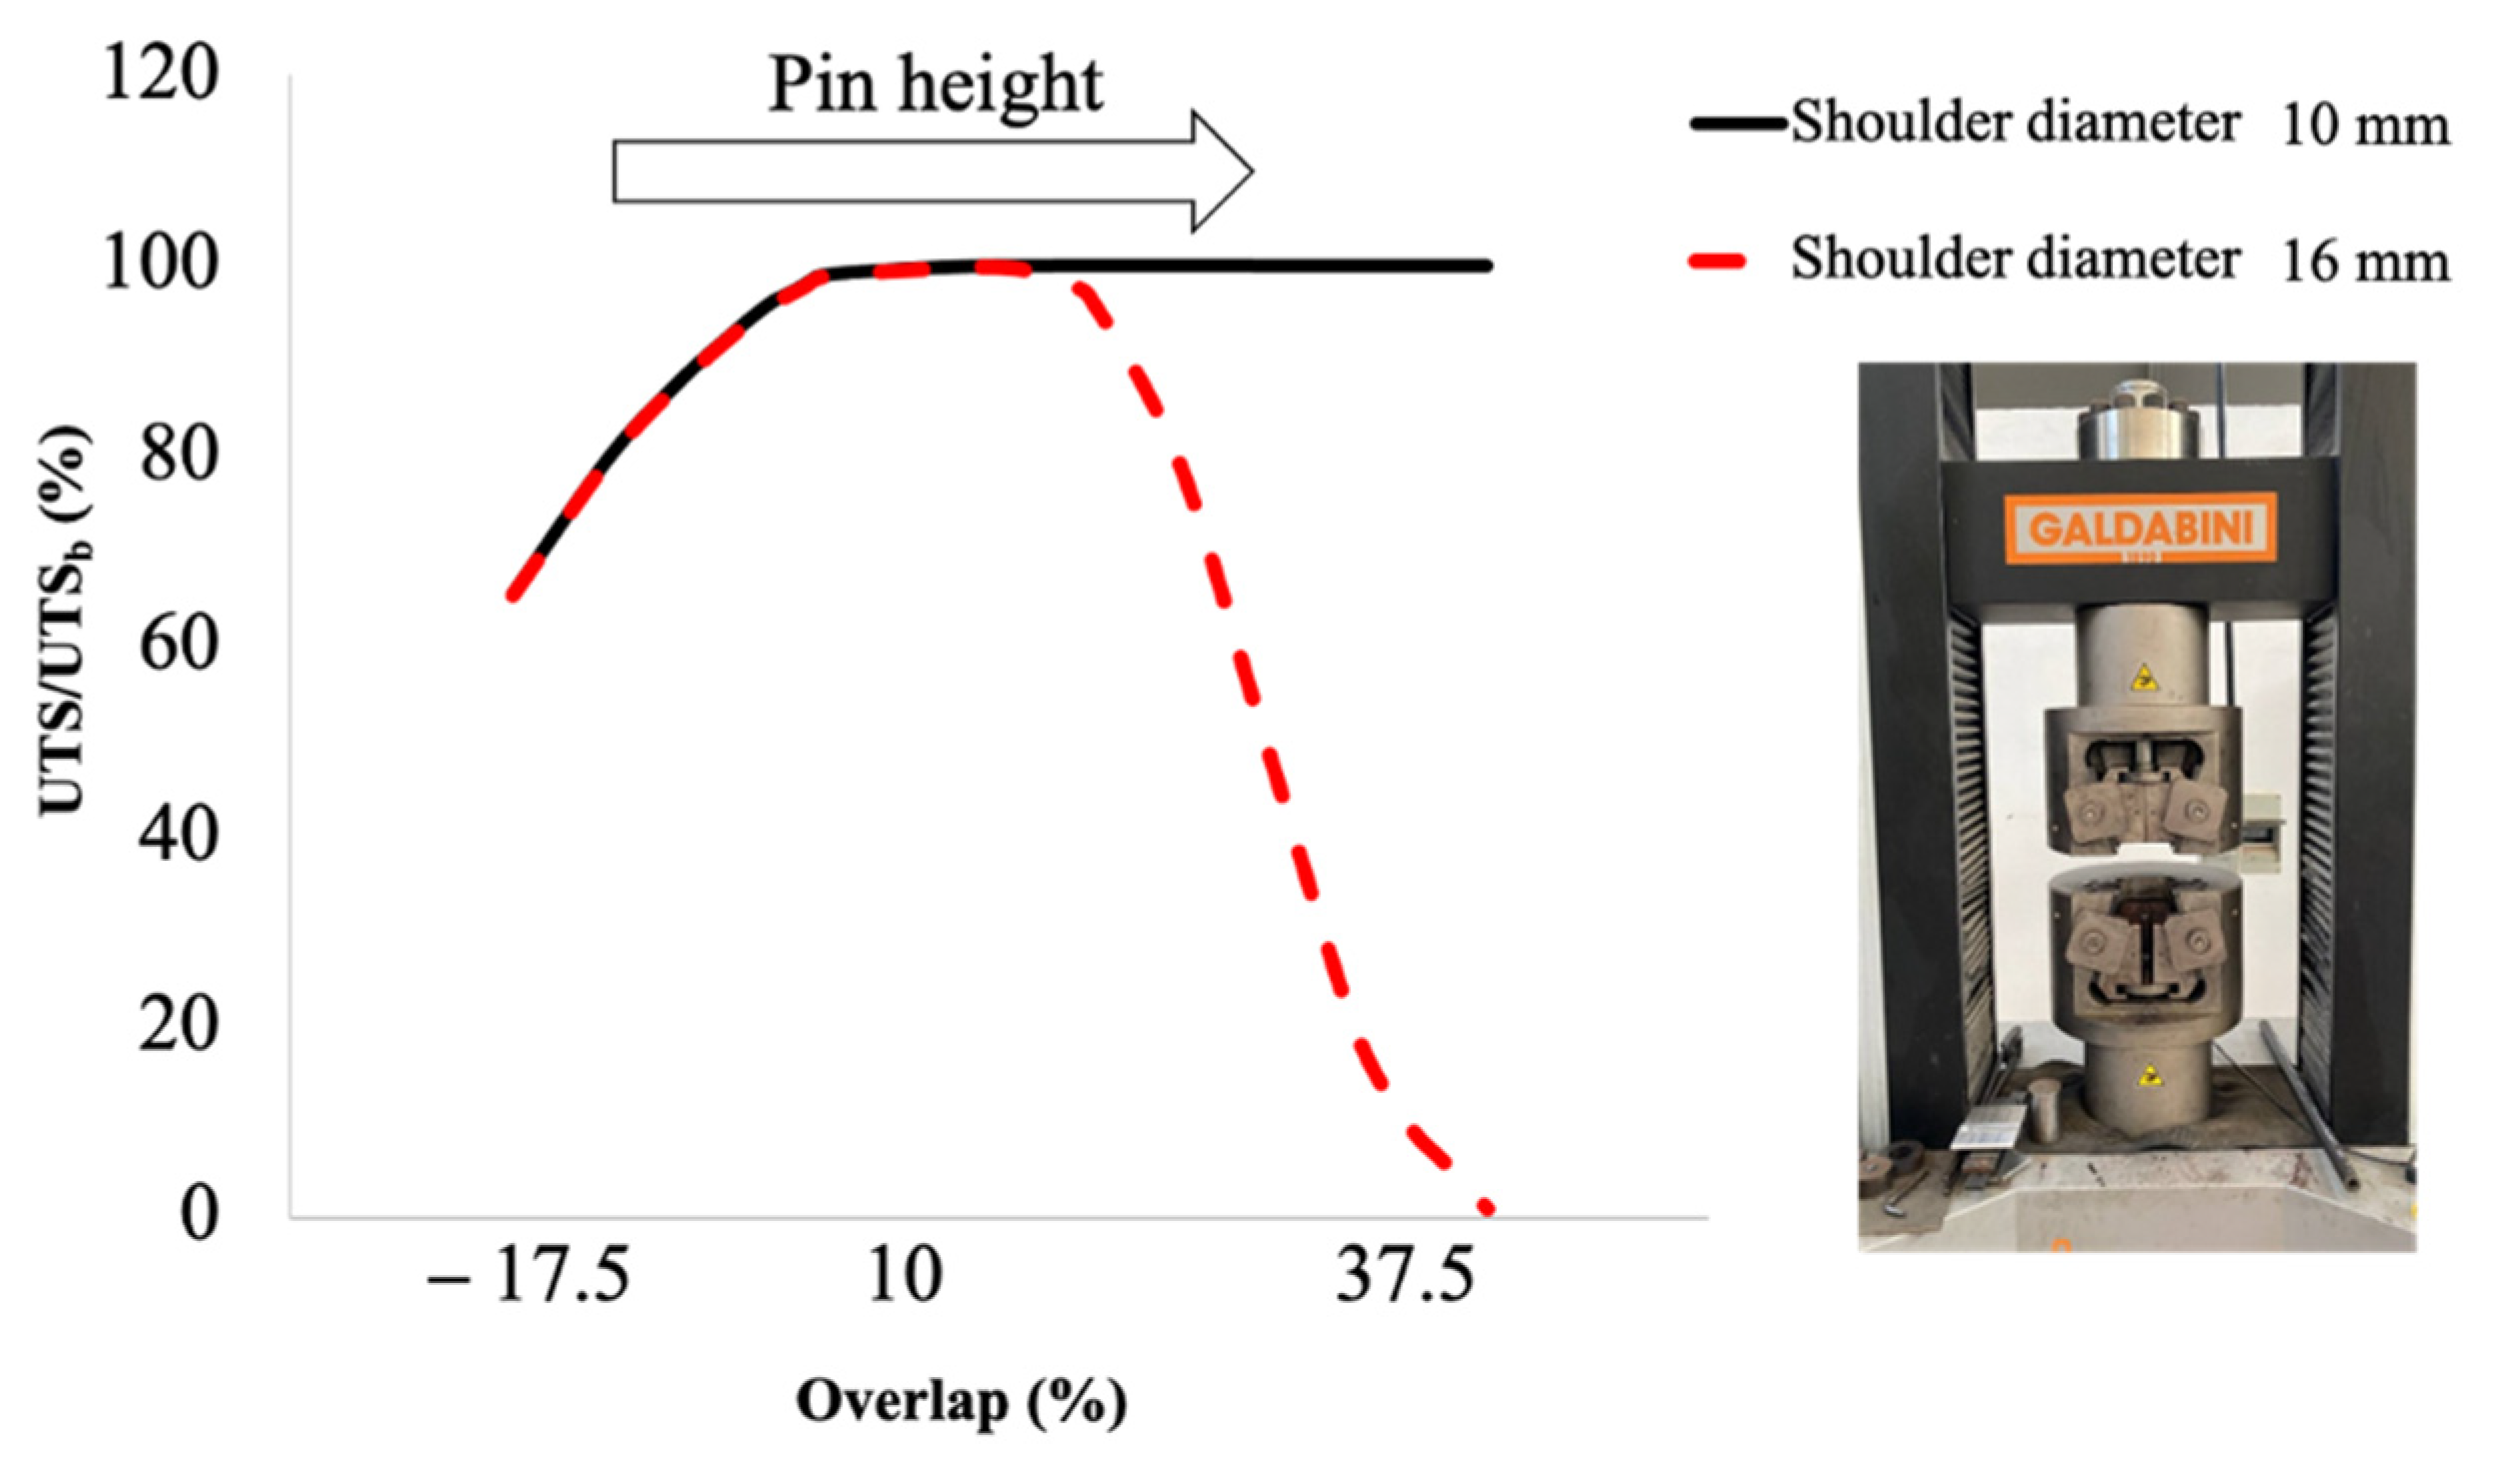
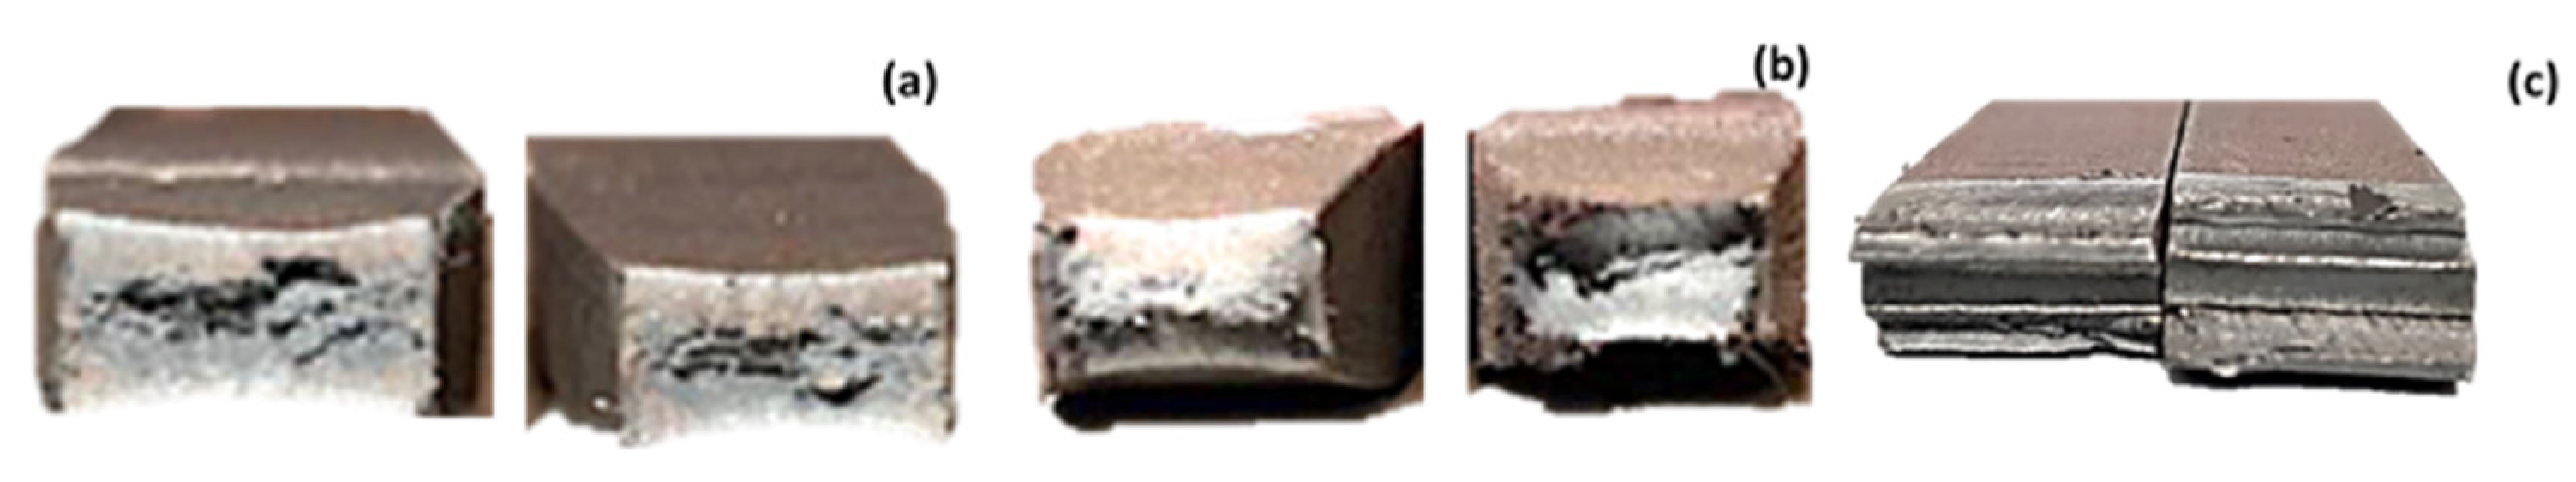
3.2. Tensile Evaluations

Tensile results of the base material (BM), MAG, and FSW samples are graphically represented in Figure 5. While the yield strength and ultimate tensile strength (UTS) for BM were 400 and 520 MPa, respectively, they were 390 and 490 MPa, respectively, for the MAG samples, which is almost 6% lower than BM. Moreover, the location of fracture for the MAG samples was the heat-affected zone (HAZ) area. It is noteworthy to report that the FSW sample B3, prepared with a 5.5 mm pin height (PH) and 10 mm shoulder diameter (SD), exhibited the yield strength and UTS at 430 and 530 MPa, respectively. Although the joint strength seems to have only a marginal increase, as the location of the fracture was in the BM region, it can be said that the FSW samples’ joint strength surpassed the one with BM.
These things considered, when all FSW samples were subjected to a tensile test, interestingly, all FSW samples fractured from the BM region. Among all the FSW samples, the yield strength and UTS of sample B3 (SD = 10 mm, PH = 5.5 mm) were remarkably high, as graphically represented in Figure 6; however, the highest elongation was recorded with sample A3 (SD = 16 mm, PH = 5.5 mm). Figure 6 compares the influence of pin height and % weld overlap with two different shoulder diameters on joint efficiency. Interestingly, while the samples welded with a SD of 16 mm exhibited a bell curve for joint efficiency, the samples welded with a SD of 10 mm exhibited a constant rise in the joint efficiency value up to a 10% weld overlap, and then it became almost constant up to 38% of overlap.
Moreover, during the fracture surface evaluation, the MAG sample’s fractured surface exhibited a brittle fracture with ridges, whereas the FSW sample B3 exhibited ductile fracture with cup and cone geometry at the fracture location, as shown in Figure 7. However, sample A1, which was welded with 3.3 mm PH, exhibited rupture from a recessed defect.

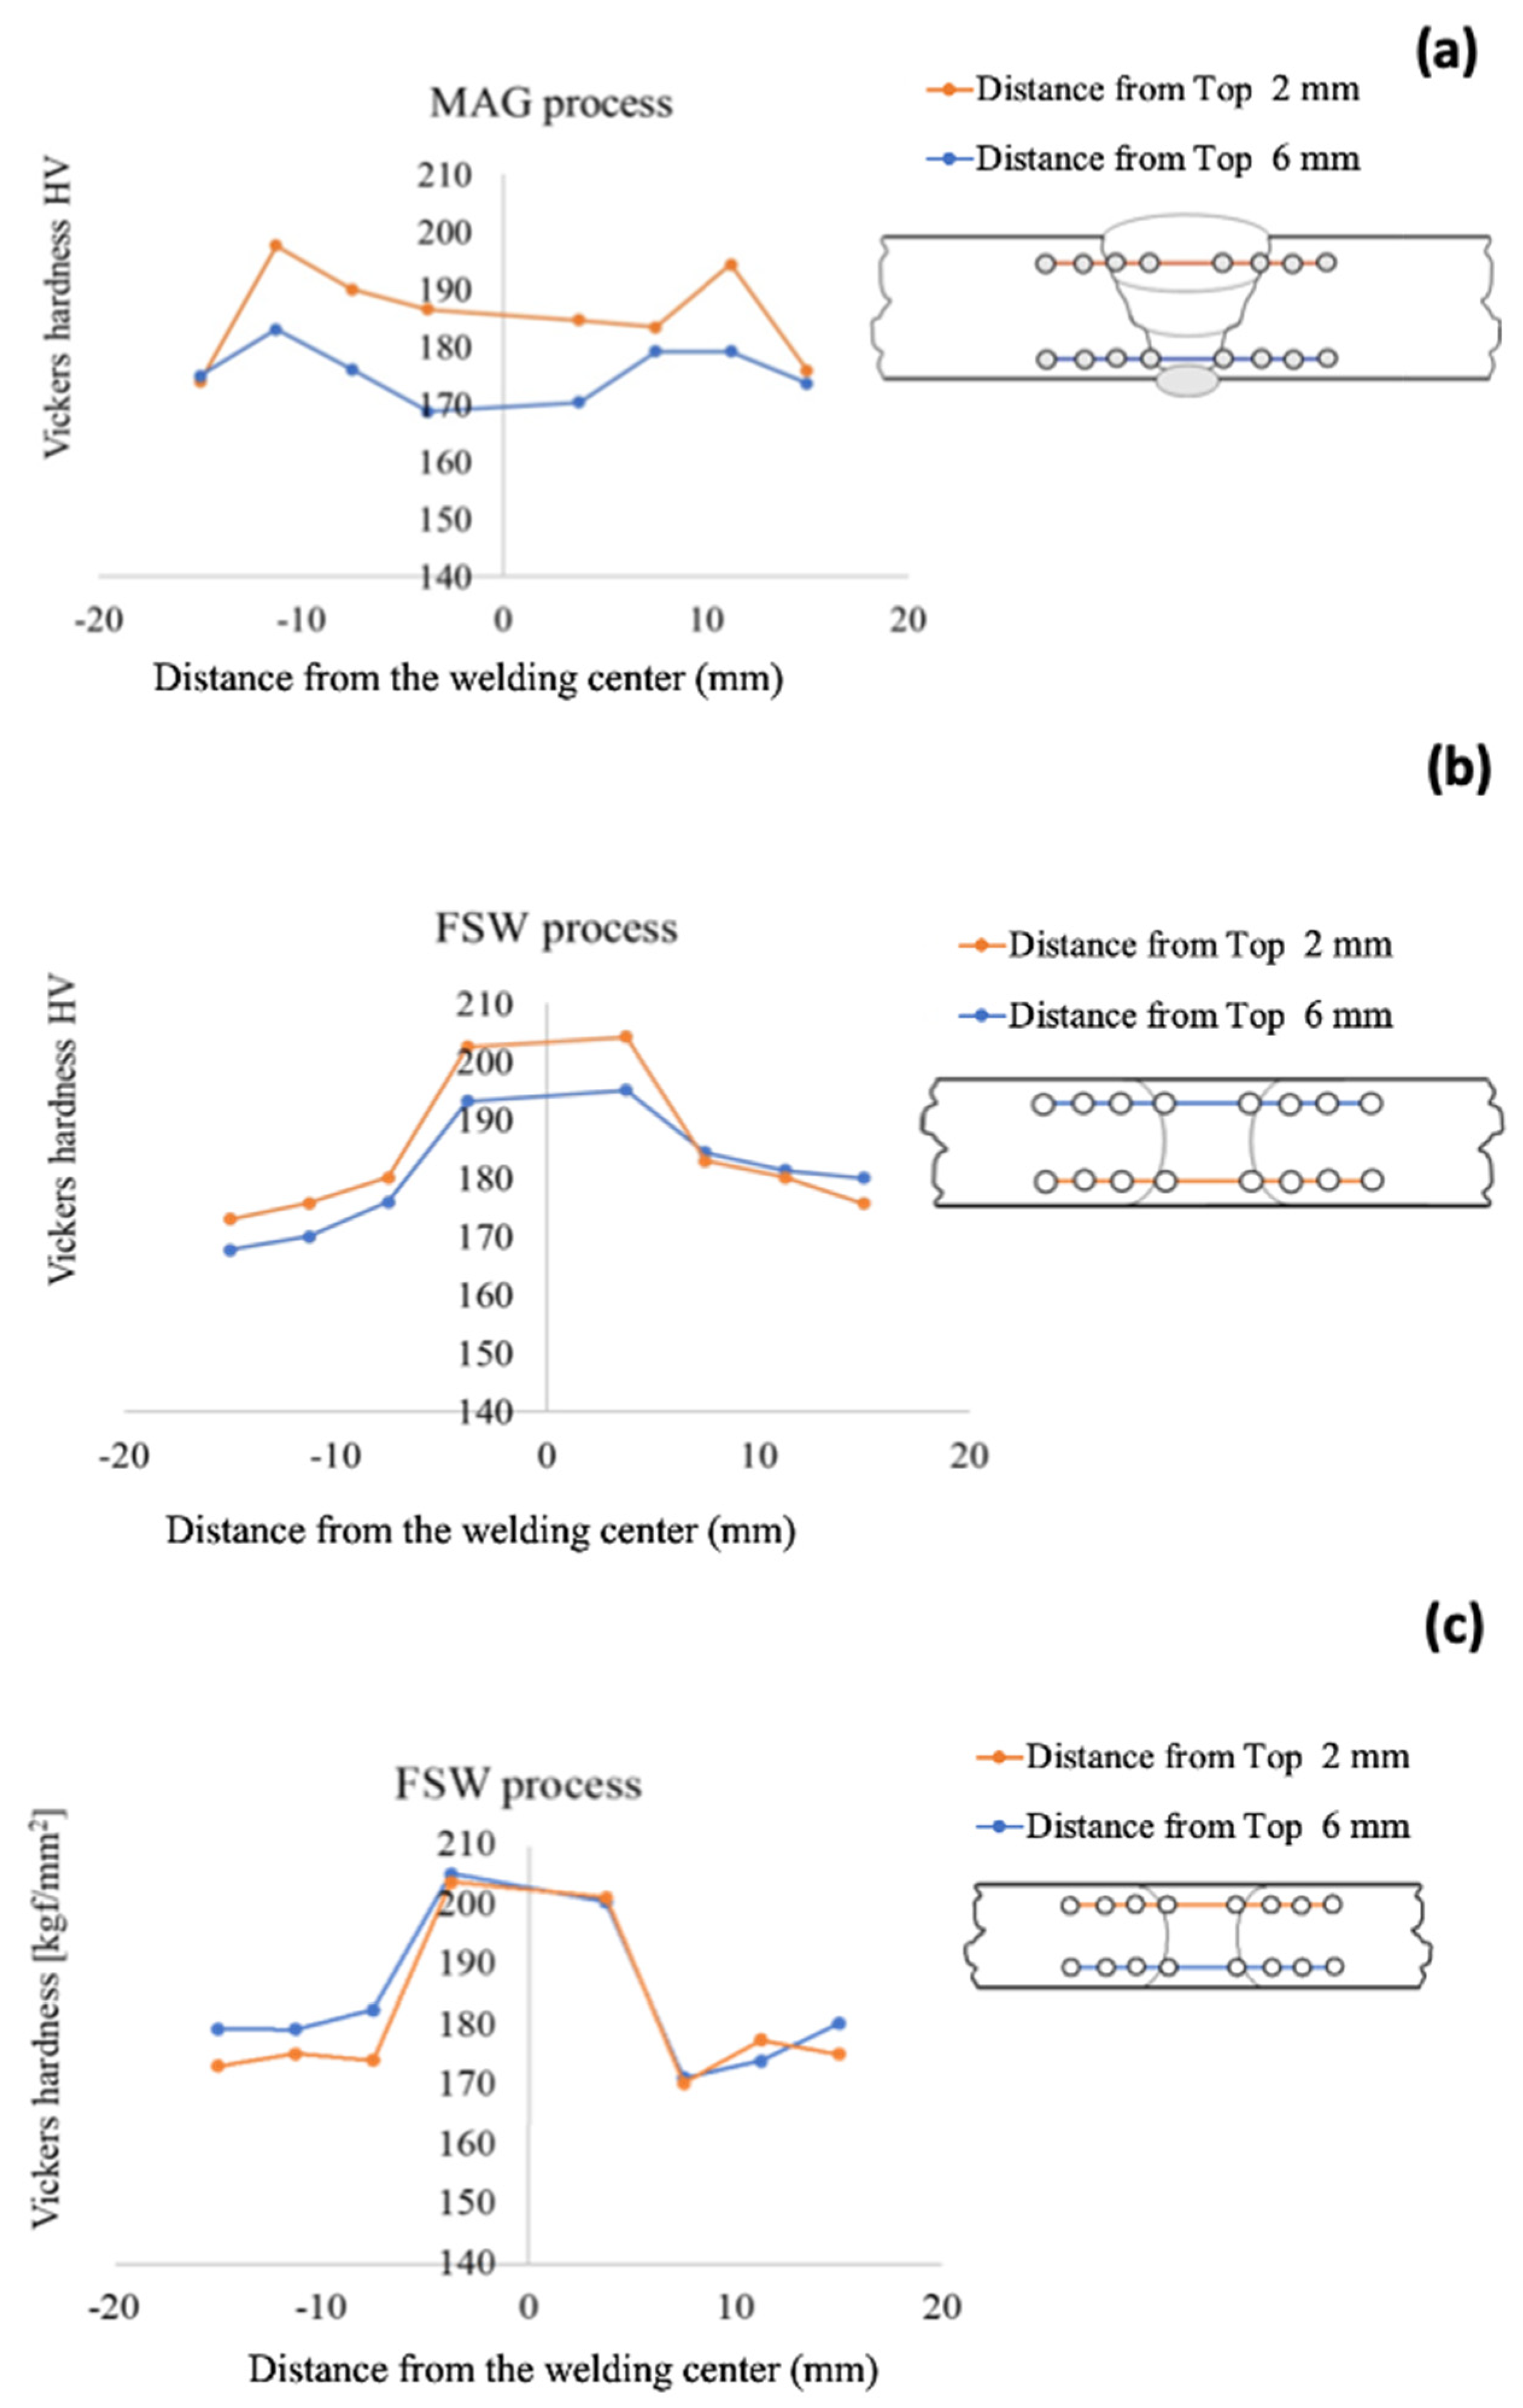
3.3. Hardness Evaluations

Hardness profiles for MAG and FSW sample B2 are graphically represented in Figure 8. The hardness indentations were made along the two lines across the joint area to evaluate the whole weld zone. While the first line of indentations was 2 mm beneath the top surface, the second was 6 mm beneath the top weld surface, as indicated in Figure 8. The maximum hardness of 204 HV was recorded within the nugget area of sample B2, whereas it was 188 HV for the MAG sample.
Additionally, sample B3 not only exhibited the highest hardness values but the most uniform hardness distribution across the welded region among all the samples. The hardness values were consistent in the welded region for both lines. However, there was a huge variation of almost 10% between the hardness values along the two indentation lines for the MAG sample. Furthermore, the hardness values were higher in the HAZ region as compared to the weld zone, characterized by a V-curved hardness distribution. In addition, there was a very lean variation of 3–4% between the hardness of the two indentation lines for FSW sample A3.

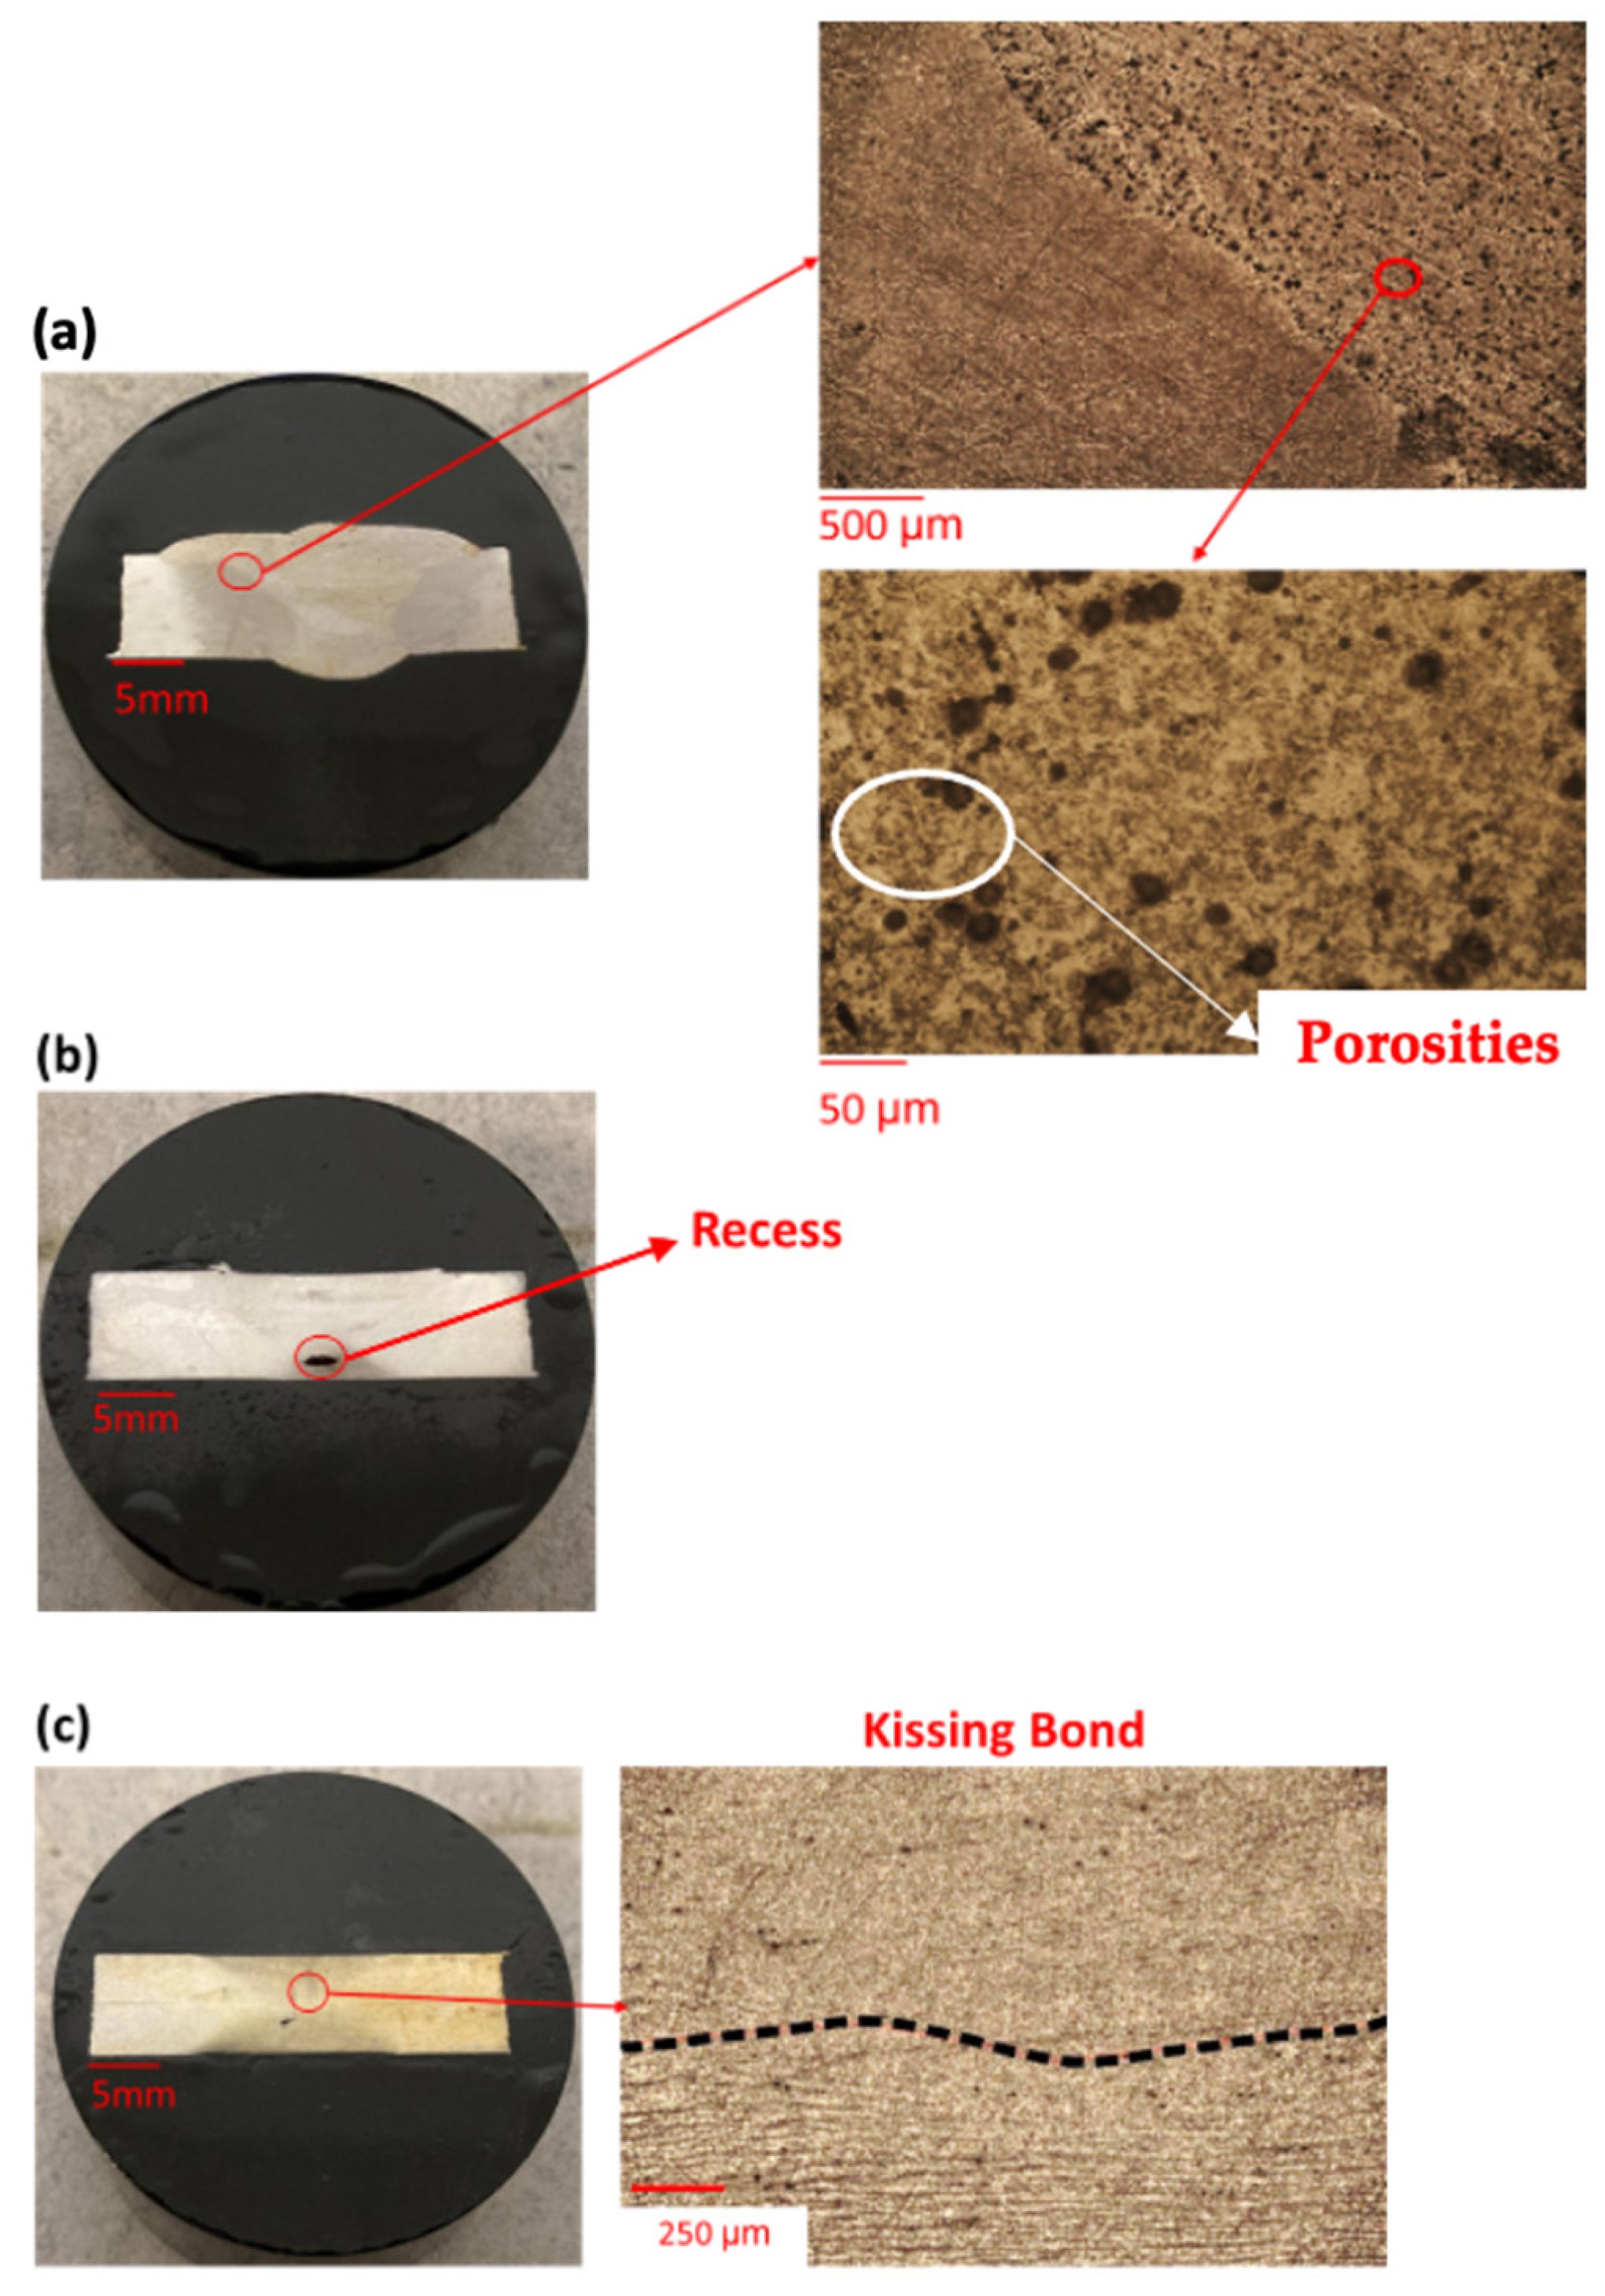
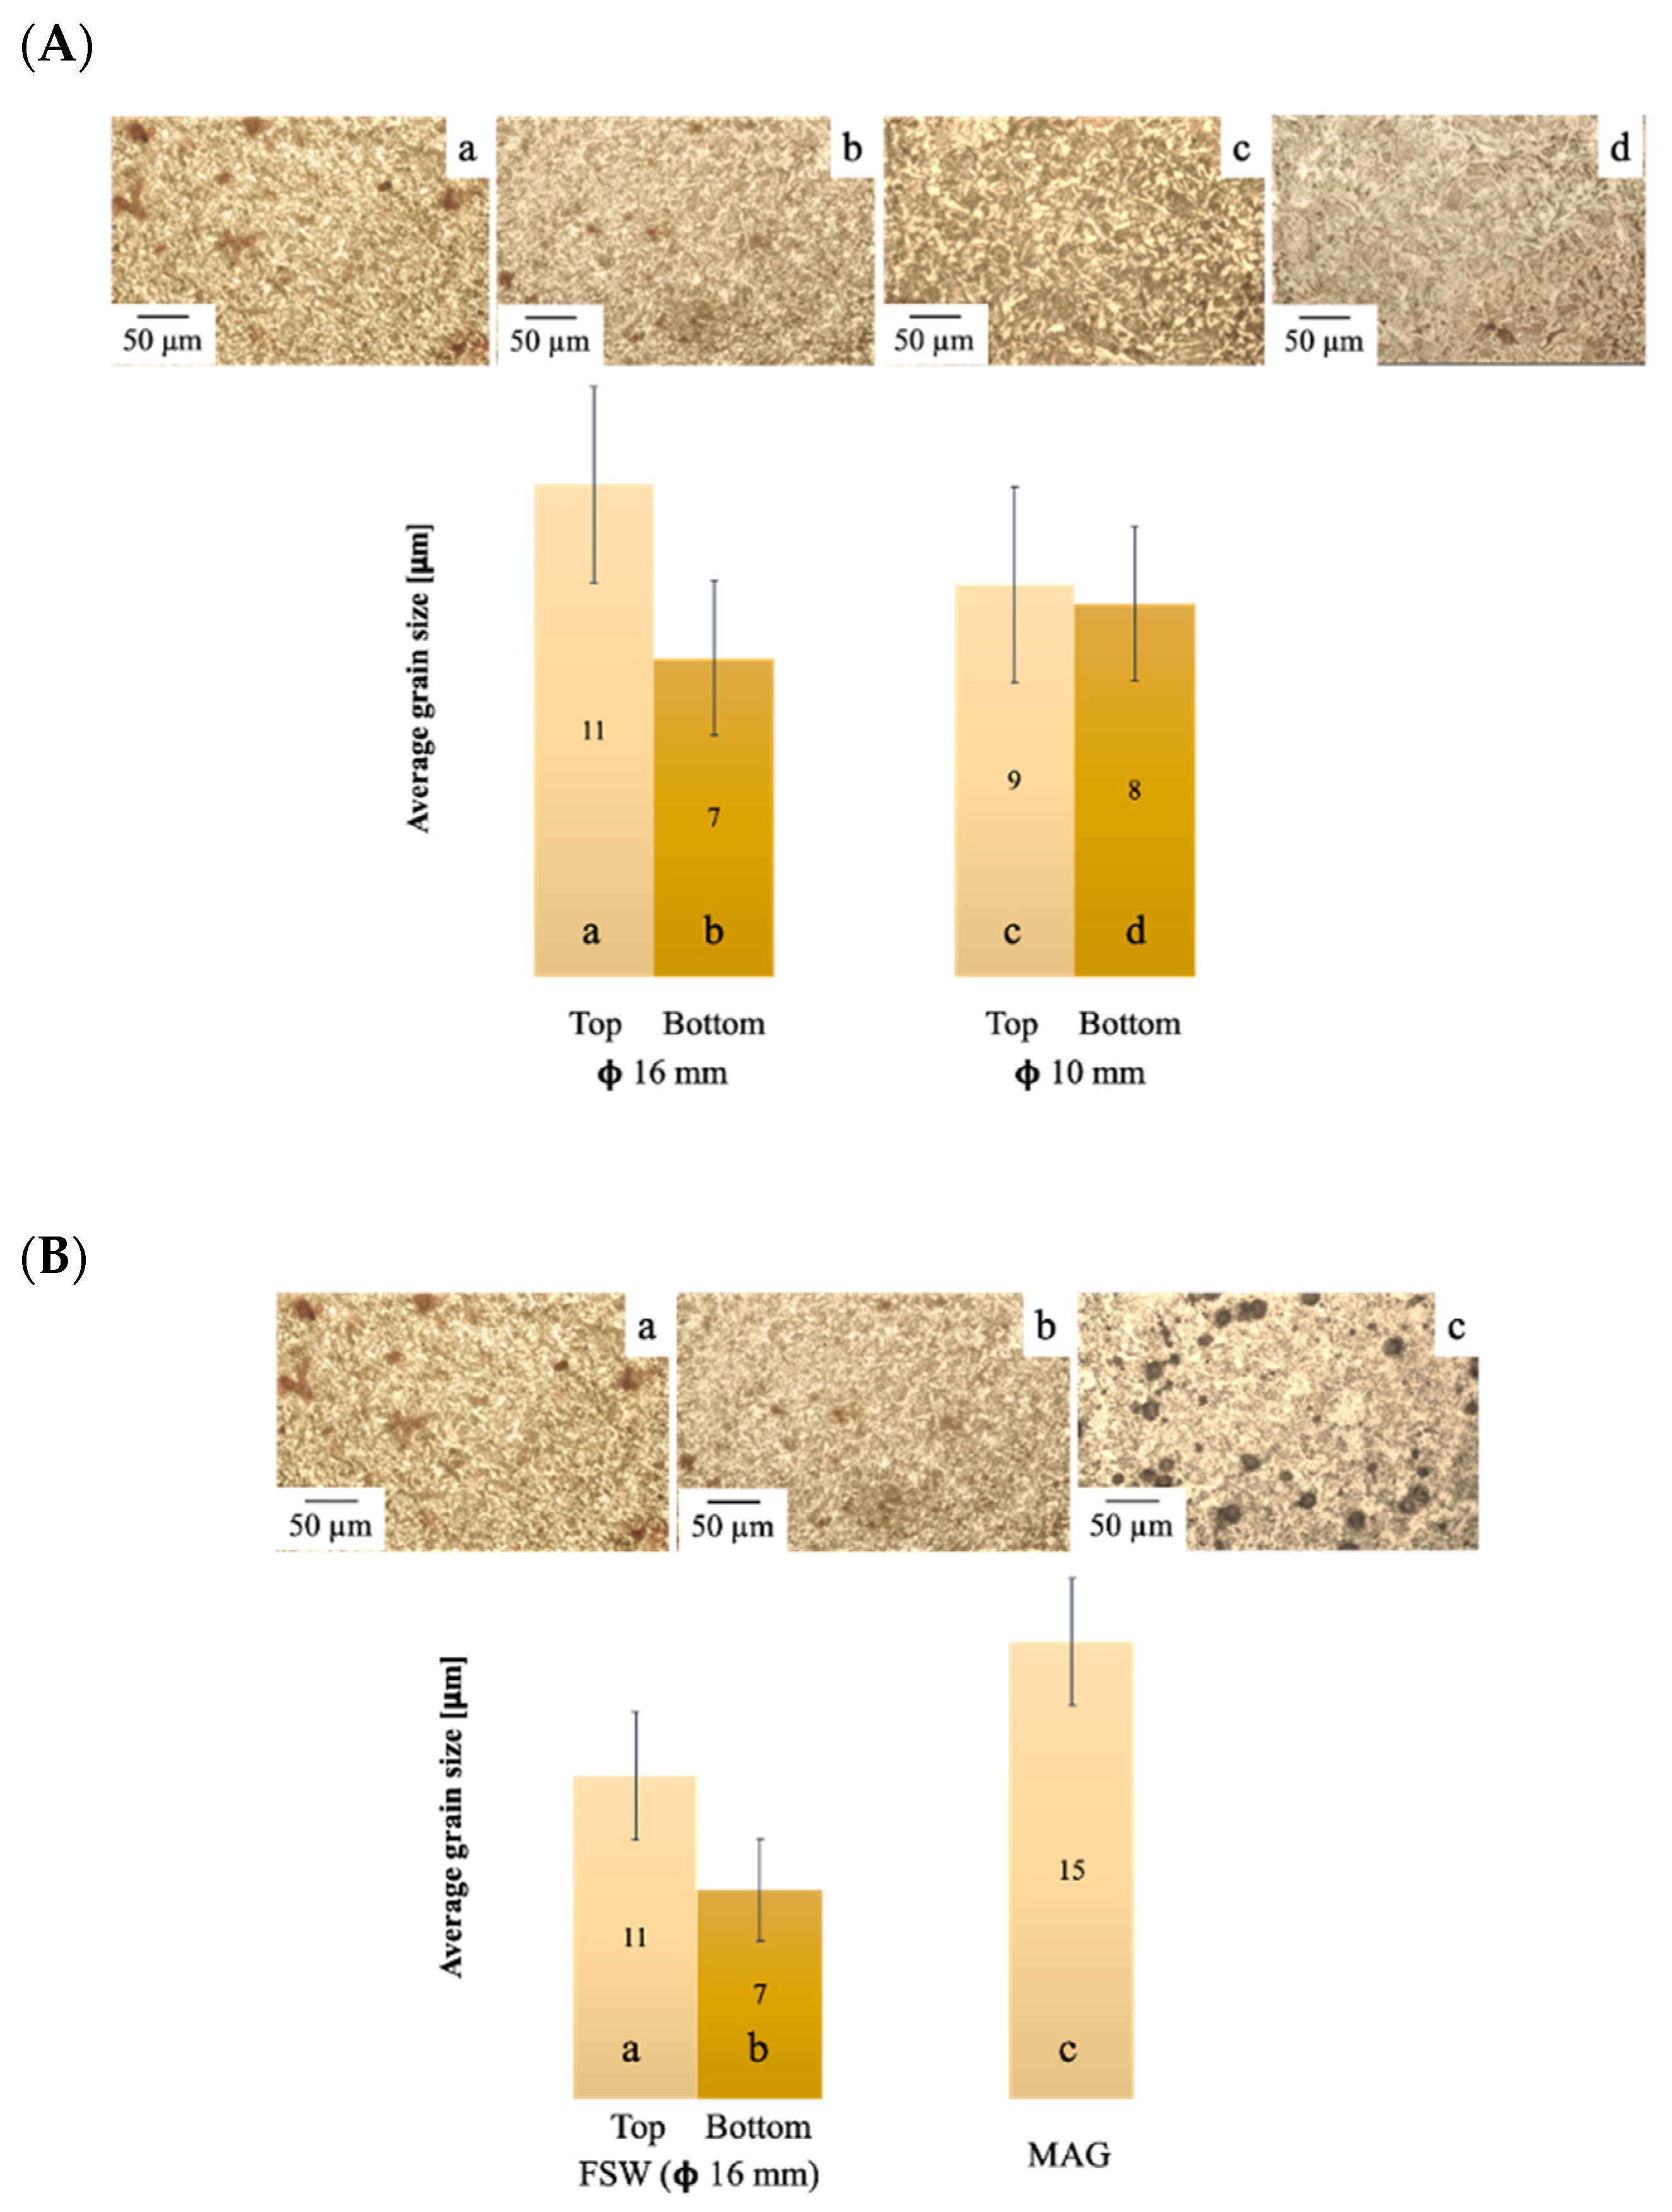
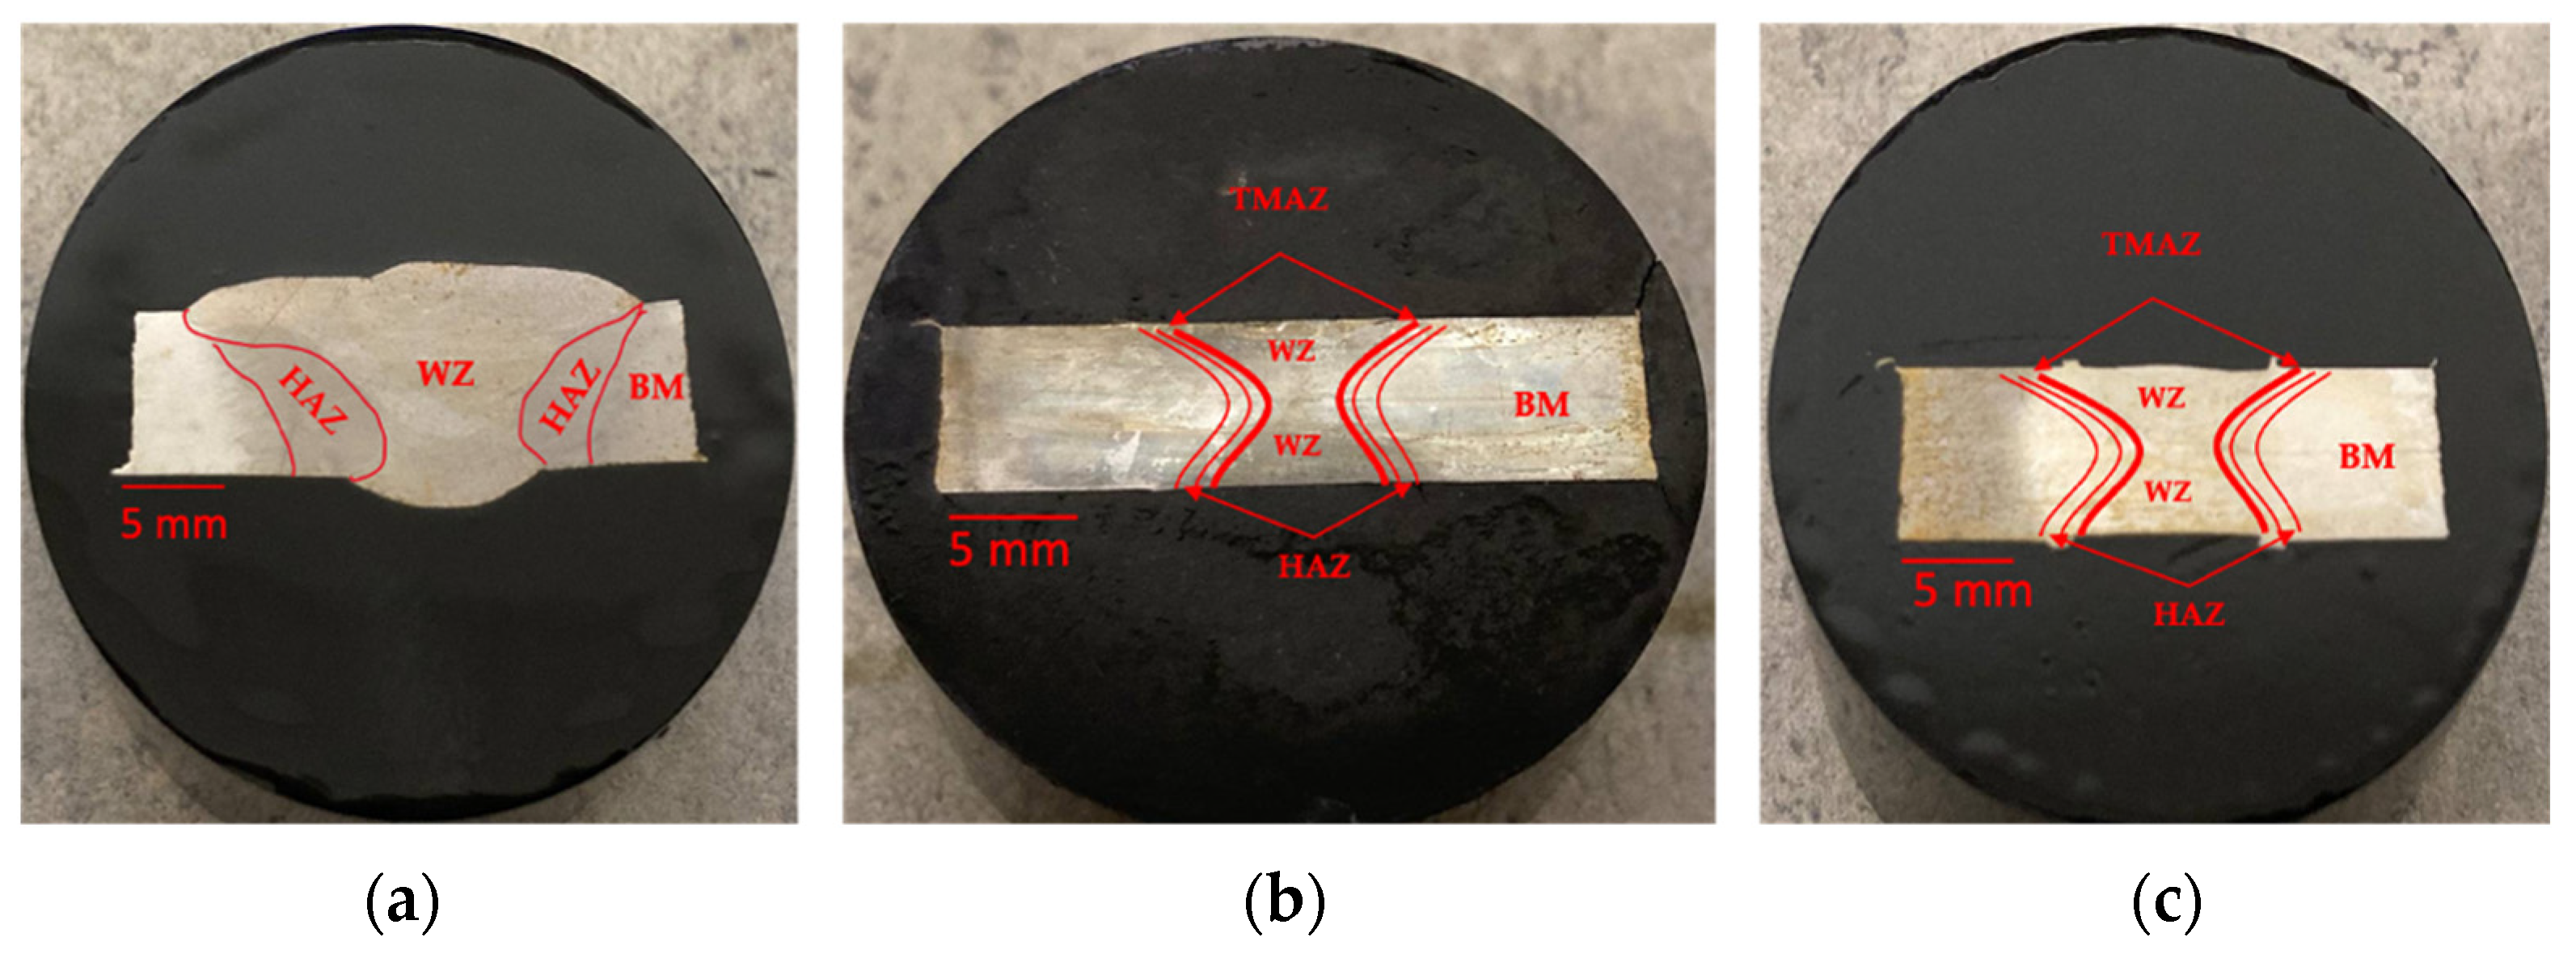
3.4. Macro- and Microstructure Evaluations

A macrostructural comparison of the MAG and FSW samples, corresponding to different zones, is exhibited in Figure 9. The weld zone (WZ) of the MAG sample was majorly characterized by enlarged grains as compared to the HAZ.
The heat flow direction along the ferrite grain is visible in Figure 10a, which indicates the cooling rate is the slowest in the center of the WZ during MAG welding. Additionally, lots of porosity was present across the WZ of this sample. The WZ consists of coarse grains along with some martensite packets oriented in the preferred directions. At the WZ/HAZ interface, the unidirectional crystallographic oriented martensitic lath structure is visible.
However, samples welded with FSW exhibited an almost porosity-free WZ, a very lean thermo-mechanically affected zone (TMAZ), and a HAZ as well. These samples contain a refined microstructure in the WZ. Most areas in the WZ display single variants of grains, though FSW samples welded with 3.3 and 4.4 mm PH exhibited recess defects, as depicted in Figure 10b,c, respectively.
The grain size comparison for different samples welded with MAG and FSW is graphically represented along with microstructure images, depicted in Figure 11. As the FSW samples were subjected to top and bottom passes separately, their grain sizes were also evaluated separately.
MAG samples exhibited an average grain size of 15 µm in the WZ. The FSW samples exhibited average grain sizes ranging from 7 to 11 µm. Further, when average grain sizes were compared among the FSW samples, sample B3 exhibited the finest grain dimensions.

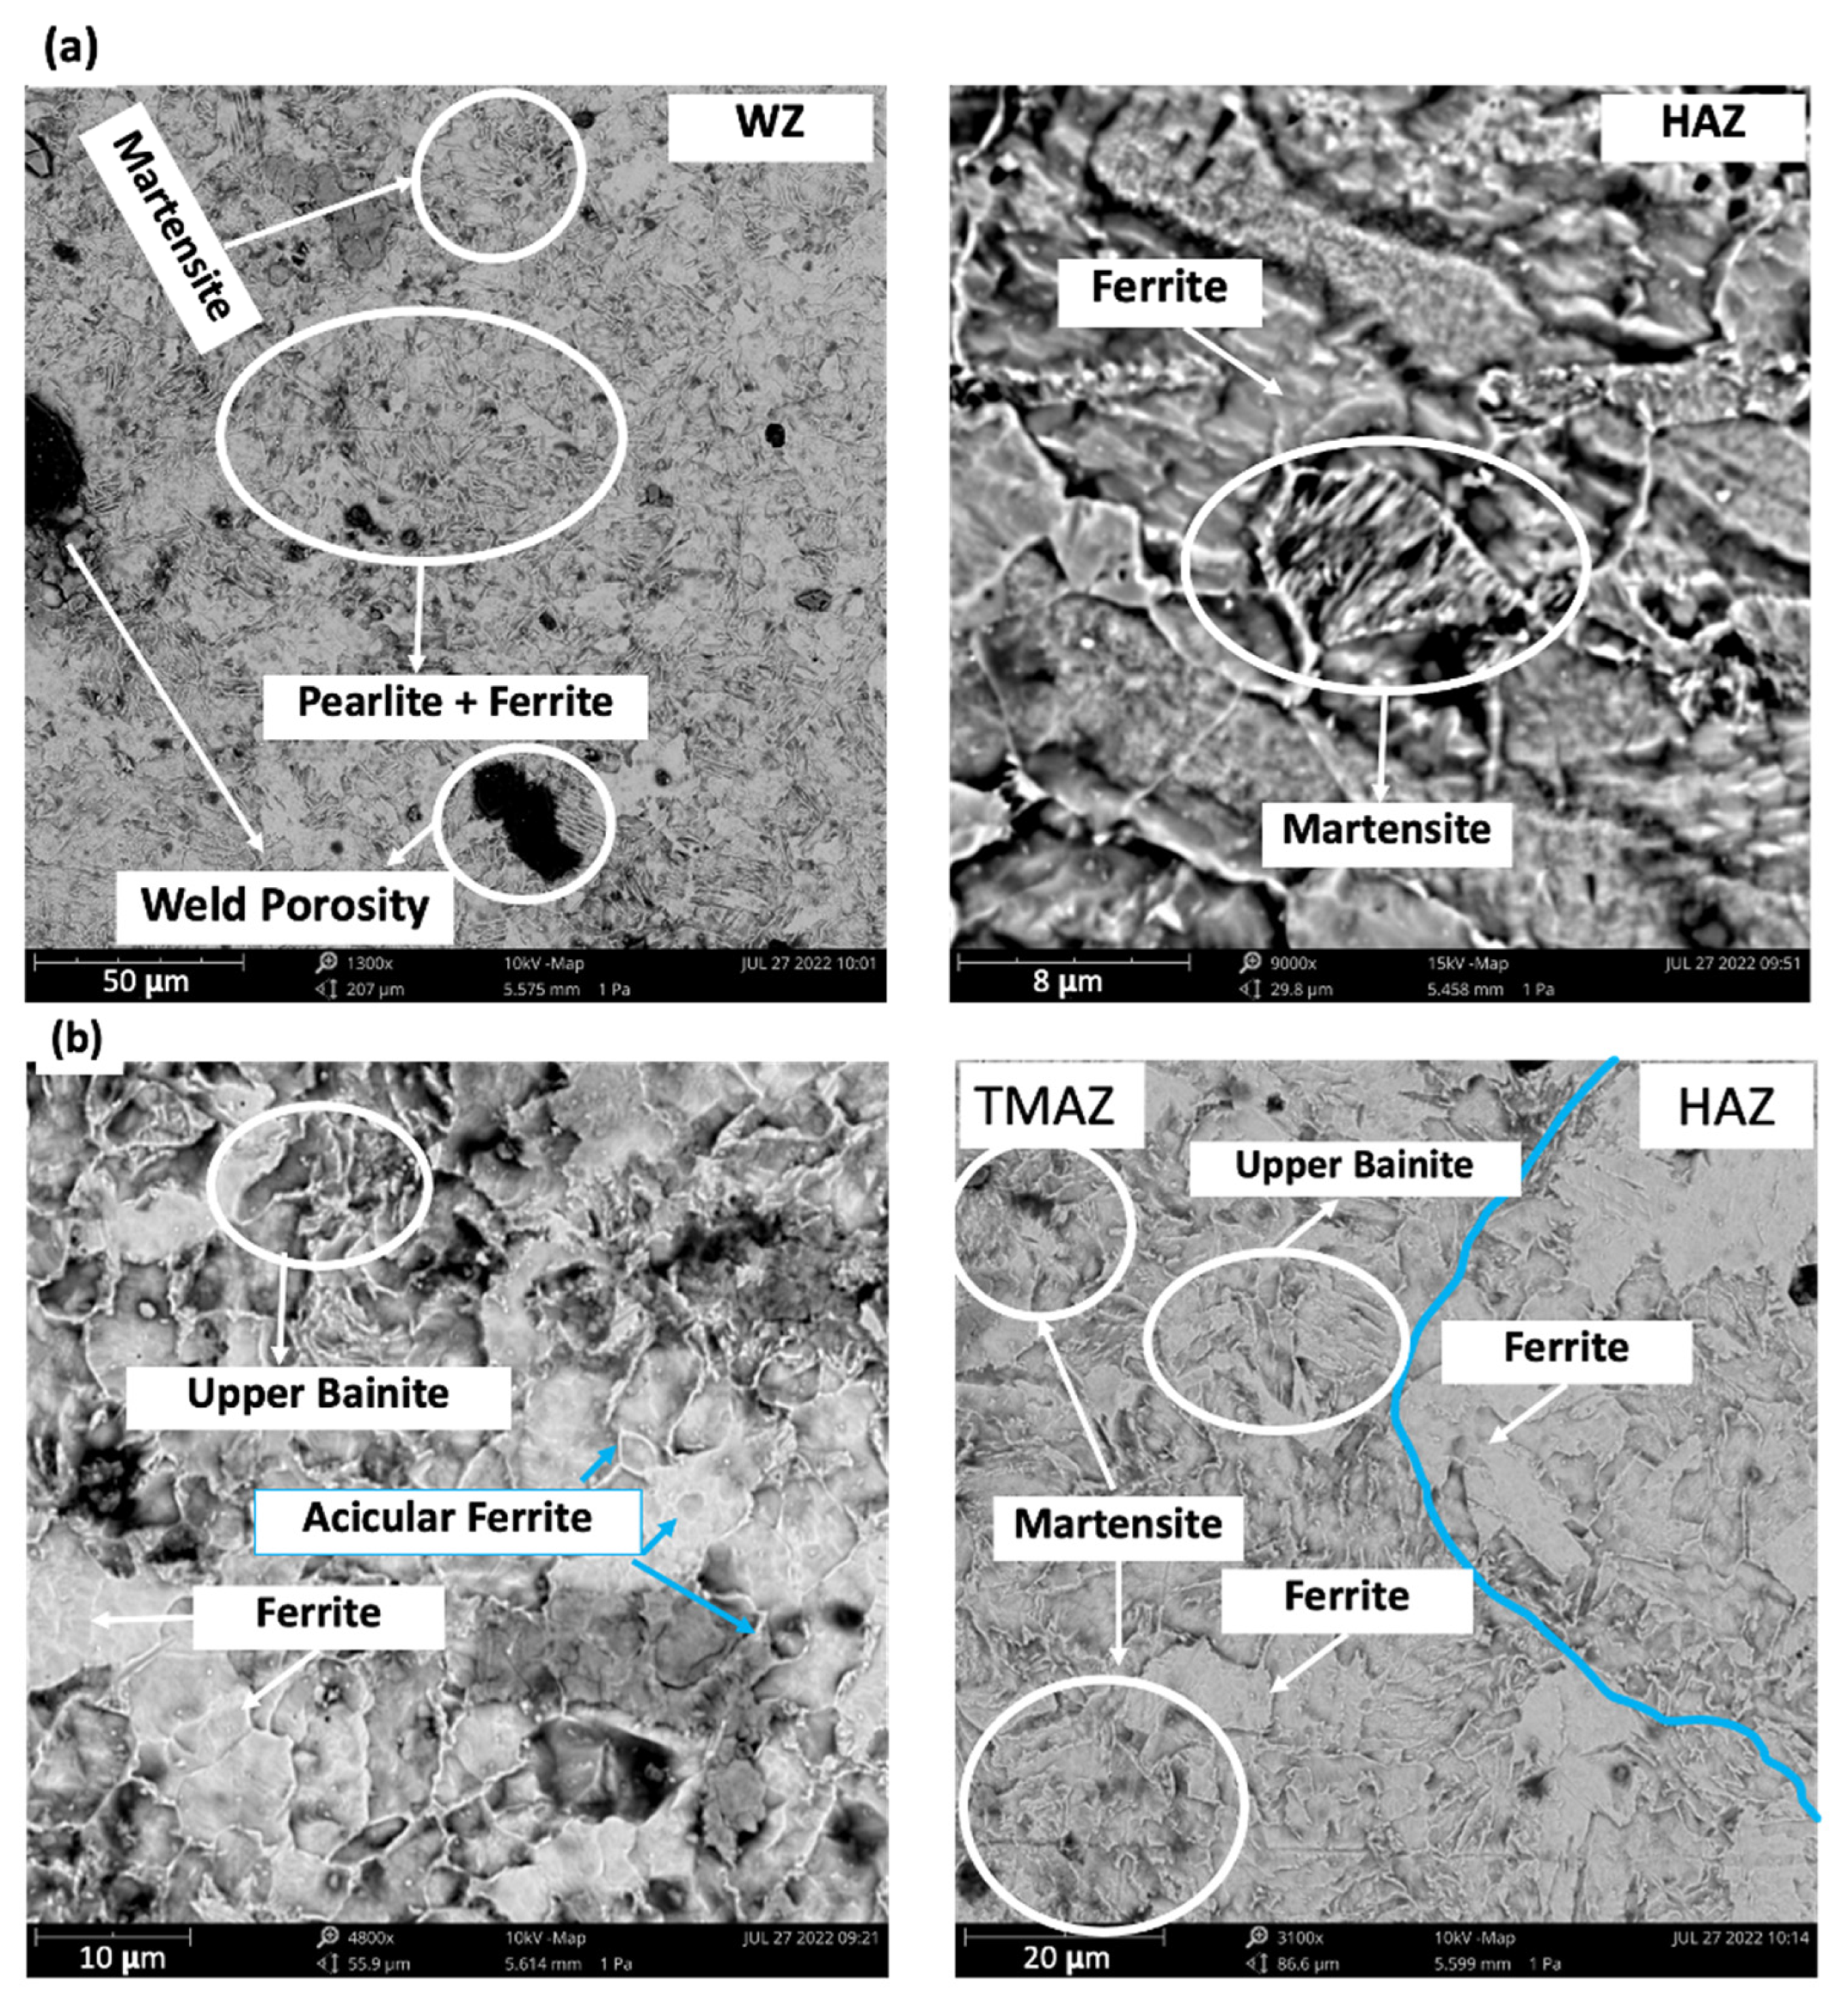
Microstructure Evaluations through Scanning Electron Microscope (SEM)

SEM micrographs, depicting different zones of the MAG and FSW sample A3, are displayed in Figure 12a,b, respectively. On one hand, the MAG sample was characterized by a combined ferritic-pearlitic structure along with a few spots of martensite in the WZ, yet several weld porosities were also present. The HAZ contained mainly a ferritic structure with several spots of martensite wherein the lathes of martensite are aligned towards the preferred direction of heat flow.
On the other hand, there is an appreciable morphological variation in the formation of acicular ferrite and bainite as compared to MAG. The SEM micrographs of the FSW joint indicate that the WZ comprises bainite, and acicular ferrite dispersed throughout the zone. Interestingly, no trace of martensite was present in the WZ of the FSW sample. The TMAZ exhibited distorted grains with a few spots of martensite and upper bainite. The HAZ region was mainly characterized by the ferrite-pearlite structure with the least-distorted structure. The grain morphological variation clearly indicates the interface between the TMAZ and HAZ.

4. Discussion

4.1. Influence of Welding Process Variants on Microstructure

The chemical composition in filler material and the heat input are crucial factors for resulting microstructural features and morphologies in the joint area. Most commonly, higher heat input followed by slower cooling rate results in coarse gain structures in the WZ [10,24]; however, low heat input during welding fosters faster cooling and results in a finer grain structure. In the present investigation, the MAG welding was carried out by cladding one after another up to five passes, during which the heat is built up in the WZ and never gets enough time to cool down completely, ensuing in grain growth. Although low heat leads to finer grain microstructure comparatively, refinement of the microstructure is quite dependent on the intrinsic nature of the process. For instance, during FSW the grains are refined not only by the low heat input processing, but tool pin-led plastic deformation plays an important role too in grain refinement. Hence, when the faster cooling rate is coupled with plastic deformation, the formation of upper bainite with a small amount of acicular ferrite is probabilistically present. That is one of the prevailing reasons for the upper bainite grains in the WZ of FSW samples, as displayed in Figure 12b.
Nevertheless, the higher heat input nature of the MAG welding process is majorly responsible for the phase transformation in the WZ. The base material microstructure consisting of ferrite with a small amount of pearlite was transformed into the acicular ferrite and retained austenite and martensite, as shown in Figure 12a. Additionally, filler metal plays a vital role in the transformation of microstructures too. Hence, it seems very challenging to get a uniform microstructure in fusion-based arc welding [21].
FSW samples exhibited a refined structure with a nearly uniform structure in terms of phase distribution. The rotating pin not only infuses the heat by friction, but it plastically deforms the grain structure too, which results in the refined grain structure as discussed earlier. Among the different FSW samples, the one produced with a 5.5 mm pin length and 10 mm shoulder sample (Sample B3) exhibited the highest grain refinement aligned with the highest mechanical properties. However, the sample welded with a 5.5 mm pin was characterized by finer grains as compared to 4.4 mm. This can be attributed to the 38% overlap of the top and bottom passes, churning out the grains further down to 7 µm from 11 µm, as displayed in Figure 12b. Additionally, the grain size varied from top to bottom of the WZ. This different grain size can be explained by the dual heating cycle experienced by the WZ top region. As indicated earlier, to cover the complete thickness of the plate, the FSW was carried out in two steps, namely a top and bottom pass. So, as the top pass was followed by the bottom one, the material stirred by the first pass experiences heating while the second pass is carried out. Hence, the region is recrystallized again without appreciable plastic deformation, leading to larger grains as compared to the bottom part. During FSW, as the shoulder equally contributes to heat input as a pin, the sample with a larger shoulder diameter inducts more heat and so does the larger grain, as resulted with sample A3 [27].
As far as the defects are concerned in all the welded samples, each defect is driven by a different mechanism owing to their different welding conditions. For MAG welding, the atmospheric gases like hydrogen, oxygen, or nitrogen get dissolved in a weld puddle during the welding, which later is released during solidification leaving a residual porosity in the WZ, as indicated in Figure 11A and Figure 12a. However, a quite different phenomenon is associated with the presence of porosity in FSW samples. Porosities are reported in the cases where: (i) the material flow stress is too high to make it hard to deform and stir uniformly, (ii) when the heat input is insufficient to soften the material, or (iii) when the tool plunge is insufficient to stir whole material volume underneath the shoulder [28]. In the current study, for the samples welded with 3.3 mm PH (Sample A1 and B1), insufficient plunge depth resulted in porosity, as displayed in Figure 12b. The samples welded with 4.4 and 5.5 exhibited an almost identical defect-free microstructure.

4.2. Influence of Welding Process Variants on Mechanical Properties

The joint properties rely mainly on the microstructure along with the chemical composition of the WZ. The prevailing reason for the property enhancement of the WZ is the resulting microstructure post-welding. The yield strength improvement of the prepared joints can be attributed to the interaction of cracks with the dynamic dislocations or grain boundaries [29]. On the one hand, the % elongation of the MAG sample was 22%, and this is lower than the base metal (26%). The reason for the decrease in the elongation is the presence of the hard and brittle martensite phase in the WZ, as mentioned in Section 4.1. Moreover, the yield strength and UTS were also lowered by almost 6%, as compared to the base material, mainly due to the visible gain growth in the WZ and the porosity defects. Moreover, a typical hardness trend was observed in the MAG sample. The hardness started declining from the HAZ/WZ interface to the weld center. Such a trend can be attributable to the concentrated heat flow at the center of the WZ followed by slow cooling, which not only promoted grain growth but the formation of stable acicular ferrite with a fraction of upper bainite. However, the martensitic transformation led by the faster cooling increased the hardness in the HAZ, which is also superior to that of the base material. Moreover, when the hardness profile in the two different regions (viz., top and bottom region) were compared, the lower half of the WZ exhibited reduced hardness values. This can be directly related to the different grain size distributions in the WZ, in which the top region was characterized by larger grains as compared to the bottom. As discussed in Section 4.1, as the weld puddle was prepared by cladding one by one five layers of filler material, the bottom-most region experienced multiple heating and cooling cycles, ensuing in grain growth. Further, the MAG sample fractured from the HAZ region. The WZ/HAZ interface acts as the weakest link during the tensile test due to distinct hardness values possessed by each zone. This soft/hard interface led to the necking and final fracture across the HAZ region [30]. As this kind of interface is not present in the case of base metal, it exhibits higher ductility, comparatively.
On the other hand, the FSW samples exhibited an extraordinary rise in the % elongation, tensile strength, and hardness values as compared to the base material and MAG samples. Whereas the % elongation of the best-welded sample (Sample B3) was 45%, the other FSW samples also exhibited an incredible rise in the % elongation as compared to the BM. During FSW, the material experiences severe plastic deformation along with heat input, leading to dynamic recrystallization and ultimately refined grain structure. With an increased grain boundary area by finer grains, the crack and dislocation motions are hindered, ensuing in increased properties like strength, ductility, and hardness. This phenomenon can be further confirmed by the Hall–Petch relation, according to which the fine grains are expected to enhance both the hardness and strength of the weld metal [31,32,33,34]. Besides, among the FSW samples, the amount of heat input plays a decisive role in the final microstructural features like grain size and phase transformations. The samples welded with a 10 mm shoulder characterized by the finer grain structure exhibited higher strength and hardness as compared to the 16 mm shoulder sample. As far as the FSW pin dimensions are concerned, the samples with a 3.3 mm pin exhibited lower properties owing to the recess defects present in the WZ. In addition, the samples welded with 4.4 and 5.5 mm PH demonstrated defect-free microstructure. However, as the WZ of sample B3 which was welded with 5.5 mm PH experienced double FSW passes, the grains were churned and refined twice, as discussed in Section 4.1. These finer grain structures not only assist in increasing the tensile strength but the hardness values too.
As far as the hardness values are concerned, a very interesting profile was generated in sample B3. While the sample welded with MAG and 4.4 mm PH in FSW exhibited a huge variation in the hardness values for the top and bottom region of WZ, the sample B3 exhibited almost constant hardness throughout the WZ owing to the completely and uniformly refined microstructure. This uniformity had been inducted by the 38% overlap of the top and bottom passes. Undoubtedly, the WZ demonstrated higher hardness values as compared to the BM region. It demonstrated higher values than the TMAZ and HAZ too. Hence, the process mechanic is very important for the resultant mechanical properties.
In a nutshell, the FSW process surpasses MAG welding in almost every aspect, whether it is time and economy, as discussed in Section 3.1, or the microstructural integrity and resultant mechanical properties. It is the industry-ready approach for the replacement of conventional fusion-based welding technologies.

5. Conclusions

A comparative analysis among the joints produced with metal active gas welding and friction stir welding was successfully carried out. The processes were evaluated in terms of time, economy, microstructure, and resultant joint properties. The influence of different process variables like tool shoulder diameter, pin height, pass overlap on the microstructure, tensile strength, and hardness was studied in detail for friction stir welded samples. The following conclusions were extracted from the study.
  • For a welding length of 500 mm in an 8 mm thick plate, the average time required for MAG welding was 20–22 min, whereas the average time required for FSW welding was 12–13 min. This time does not include the amount of time spent on pre-weld prep and post-weld treatments;
  • In terms of cost, during the FSW no filler material was used, however, during MAG welding, 10 kg of filler material was used up in just 20 min. Additionally, 120 kg of inert gas was used during the MAG process at a rate of 260 [liters/min];
  • The best FSW sample exhibited 21% and 11% higher hardness as compared to the base material and MAG samples. Such a commendable rise in the hardness can be attributed to dynamic recrystallization in the WZ led by severe plastic deformation, localized heating, and faster cooling during the FSW process. Additionally, whereas MAG samples were found with almost 10% hardness variation in the top and bottom regions of the WZ, it was consistent in the case of FSW samples owing to more uniformity in the microstructure.
  • Of the FSW samples, the one welded with the highest pin height of 5.5 mm and the smallest shoulder diameter of 10 mm outperformed others concerning tensile strength and hardness, owing to the low amount of heat input and 38% overlap of top and bottom passes, led grain refinement.

Author Contributions

Conceptualization, D.C. and T.L.; methodology, investigation, and writing, D.C. and H.R.; supervision, R.D.L.; funding acquisition, D.C. All authors have read and agreed to the published version of the manuscript.

Funding

This research was funded by Attraction and International Mobility (AIM), grant number PON AIM1813040 and The APC was funded by Ministero dell’Università e della Ricerca.

Institutional Review Board Statement

Not applicable.

Informed Consent Statement

Not applicable.

Data Availability Statement

Not applicable.

Conflicts of Interest

The authors declare that they have no known competing financial interests or personal relationships that could have influenced the work reported in this paper.

References

  1. Grand View Research, Inc. Structural Steel Market Size, Share & Trends Analysis Report by Application (Residential, Non-Residential), by Region (Asia Pacific, North America), and Segment Forecasts, 2021–2028; Grand View Research, Inc.: San Francisco, CA, USA, 2020; Available online: https://www.grandviewresearch.com/industry-analysis/structural-steel-market (accessed on 31 July 2022).
  2. Lienert, T.; Siewert, T.; Babu, S.; Acoff, V. Dilution in Fusion Welding; ASM International: Almere, The Netherlands, 2011. [Google Scholar]
  3. Ranjbarnodeh, E.; Hanke, S.; Weiss, S.; Fischer, A. Effect of welding parameters on the heat-affected zone of AISI409 ferritic stainless steel. Int. J. Miner. Metall. Mater. 2012, 19, 923–929. [Google Scholar] [CrossRef]
  4. Boumerzoug, Z.; Derfouf, C.; Baudin, T. Effect of welding on microstructure and mechanical properties of an industrial low carbon steel. Engineering 2010, 2, 502. [Google Scholar] [CrossRef]
  5. Akselsen, O.M.; Grong, Ø.; Ryum, N.; Christensen, N. HAZ grain growth mechanisms in welding of low carbon microalloyed steels. Acta Metall. 1986, 34, 1807–1815. [Google Scholar] [CrossRef]
  6. Nathan, S.R.; Balasubramanian, V.; Malarvizhi, S.; Rao, A.G. Effect of welding processes on mechanical and microstructural characteristics of high strength low alloy naval grade steel joints. Def. Technol. 2015, 11, 308–317. [Google Scholar] [CrossRef]
  7. Ohya, K.; Kim, J.; Yokoyama, K.i.; Nagumo, M. Microstructures relevant to brittle fracture initiation at the heat-affected zone of weldment of a low carbon steel. Metall. Mater. Trans. A 1996, 27, 2574–2582. [Google Scholar] [CrossRef]
  8. Thaulow, C.; Paauw, A.J.; Gunleiksrud, Å.; Naess, O.J. Heat affected zone toughness of a low carbon microalloyed steel. Met. Constr. 1985, 17, 94R–99R. [Google Scholar]
  9. Olabi, A.G.; Hashmi, M.S.J. The microstructure and mechanical properties of low carbon steel welded components after the application of PWHTs. J. Mater. Processing Technol. 1996, 56, 88–97. [Google Scholar] [CrossRef]
  10. Zhang, Y.-q.; Zhang, H.-q.; Li, J.-F.; Liu, W.-m. Effect of heat input on microstructure and toughness of coarse grain heat affected zone in Nb microalloyed HSLA steels. J. Iron Steel Res. Int. 2009, 16, 73–80. [Google Scholar] [CrossRef]
  11. Kulekci, M.K. Mechanical properties of friction stir-welded joints of AlCu~ 4SiMg aluminium alloy. Kov. Mater. 2003, 41, 97–105. [Google Scholar]
  12. Singh, K.; Singh, G.; Singh, H. Review on friction stir welding of magnesium alloys. J. Magnes. Alloys 2018, 6, 399–416. [Google Scholar] [CrossRef]
  13. Thomas, W.M.; Threadgill, P.L.; Nicholas, E.D. Feasibility of friction stir welding steel. Sci. Technol. Weld. Join. 1999, 4, 365–372. [Google Scholar] [CrossRef]
  14. Buffa, G.; Fratini, L.; Micari, F.; Settineri, L. On the choice of tool material in friction stir welding of titanium alloys. Proc. NAMRI/SME 2012, 40. [Google Scholar]
  15. Çam, G. Friction stir welded structural materials: Beyond Al-alloys. Int. Mater. Rev. 2011, 56, 1–48. [Google Scholar] [CrossRef]
  16. Cho, H.-H.; Han, H.N.; Hong, S.-T.; Park, J.-H.; Kwon, Y.-J.; Kim, S.-H.; Steel, R.J. Microstructural analysis of friction stir welded ferritic stainless steel. Mater. Sci. Eng. A 2011, 528, 2889–2894. [Google Scholar] [CrossRef]
  17. Fujii, H.; Cui, L.; Tsuji, N.; Maeda, M.; Nakata, K.; Nogi, K. Friction stir welding of carbon steels. Mater. Sci. Eng. A 2006, 429, 50–57. [Google Scholar] [CrossRef]
  18. Yazdipour, A.R.; Shafieim, A.; Aval, H.J. An investigation of the microstructures and properties of metal inert gas and friction stir welds in aluminum alloy 5083. Sadhana Acad. Proc. Eng. Sci. 2011, 36, 505–514. [Google Scholar] [CrossRef]
  19. Xue, P.; Ma, Z.Y.; Komizo, Y.; Fujii, H. Achieving ultrafine-grained ferrite structure in friction stir processed weld metal. Mater. Lett. 2016, 162, 161–164. [Google Scholar] [CrossRef]
  20. Yan, Z.; Liu, X.; Fang, H. Mechanical properties of friction stir welding and metal inert gas welding of Al-Zn aluminum alloy joints. Int. J. Adv. Manuf. Technol. 2017, 91, 3025–3031. [Google Scholar] [CrossRef]
  21. Kumar, L.; Yazar, K.U.; Pramanik, S. Effect of fusion and friction stir welding techniques on the microstructure, crystallographic texture and mechanical properties of mild steel. Mater. Sci. Eng. A 2019, 754, 400–410. [Google Scholar] [CrossRef]
  22. Chen, J.; Young, B.; Uy, B. Behavior of high strength structural steel at elevated temperatures. J. Struct. Eng. 2006, 132, 1948–1954. [Google Scholar] [CrossRef]
  23. Campanella, D.; Marcon, G.; Lombardo, A.; Buffa, G.; Fratini, L. The role of thermal contribution in the design of AA2024 friction stir welded butt and lap joints: Mechanical properties and energy demand. Prod. Eng. 2022, 16, 247–259. [Google Scholar] [CrossRef]
  24. Wright, A.; Munro, T.R.; Hovanski, Y. Evaluating Temperature Control in Friction Stir Welding for Industrial Applications. J. Manuf. Mater. Process. 2021, 5, 124. [Google Scholar] [CrossRef]
  25. Konkol, P.J.; Mathers, J.A.; Johnson, R.; Pickens, J.R. Friction stir welding of HSLA-65 steel for shipbuilding. J. Ship Prod. 2003, 19, 159–164. [Google Scholar] [CrossRef]
  26. Hasieber, M.; Grätzel, M.; Bergmann, J.P. A novel approach for the detection of geometric-and weight-related FSW tool wear using stripe light projection. J. Manuf. Mater. Process. 2020, 4, 60. [Google Scholar] [CrossRef]
  27. Momeni, M.; Guillot, M. Effect of tool design and process parameters on lap joints made by right angle friction stir welding (RAFSW). J. Manuf. Mater. Process. 2019, 3, 66. [Google Scholar] [CrossRef]
  28. Sabry, I.; El-Kassas, A.M.; Mourad, A.-H.I.; Thekkuden, D.T.; Abu Qudeiri, J. Friction stir welding of T-joints: Experimental and statistical analysis. J. Manuf. Mater. Process. 2019, 3, 38. [Google Scholar] [CrossRef]
  29. Lambert, A.; Drillet, J.; Gourgues, A.F.; Sturel, T.; Pineau, A. Microstructure of martensite-austenite constituents in heat affected zones of high strength low alloy steel welds in relation to toughness properties. Sci. Technol. Weld. Join. 2000, 5, 168–173. [Google Scholar] [CrossRef]
  30. Kang, J.; Wang, C.; Wang, G.D. Microstructural characteristics and impact fracture behavior of a high-strength low-alloy steel treated by intercritical heat treatment. Mater. Sci. Eng. A 2012, 553, 96–104. [Google Scholar] [CrossRef]
  31. Bates, W.P.; Patel, V.; Rana, H.; Andersson, J.; De Backer, J.; Igestrand, M.; Fratini, L. Properties Augmentation of Cast Hypereutectic Al–Si Alloy Through Friction Stir Processing. Met. Mater. Int. 2022, 1–14. [Google Scholar] [CrossRef]
  32. Rana, H.; Badheka, V. Elucidation of the role of rotation speed and stirring direction on AA 7075-B4C surface composites formulated by friction stir processing. Proc. Inst. Mech. Eng. Part L J. Mater. Des. Appl. 2017, 233, 977–994. [Google Scholar] [CrossRef]
  33. Rana, H.; Badheka, V. Influence of friction stir processing conditions on the manufacturing of Al-Mg-Zn-Cu alloy/boron carbide surface composite. J. Mater. Process. Technol. 2018, 255, 795–807. [Google Scholar] [CrossRef]
  34. Rana, H.; Badheka, V.; Kumar, A.; Satyaprasad, A. Strategical parametric investigation on manufacturing of Al–Mg–Zn–Cu alloy surface composites using FSP. Mater. Manuf. Processes 2018, 33, 534–545. [Google Scholar] [CrossRef]
Figure 1. MAG: (a) “V” groove dimensions, and (b) Parameters selected during welding.
Jmmp 06 00104 g001
Figure 2. (a) ESAB Legio 3 ST machine, (b) Tilt angle used, and (c) Clamping fixture.
Jmmp 06 00104 g002
Figure 3. Geometrical parameters used in friction stir welding where a is the shoulder diameter, b is the pin diameter and c is the pin height.
Jmmp 06 00104 g003
Figure 4. Schematic double passes FSW process.
Jmmp 06 00104 g004
Figure 5. Stress vs. strain curve for BM, MAG, and FSW samples.
Jmmp 06 00104 g005
Figure 6. Effect of % overlap of FSW passes on Joint efficiency.
Jmmp 06 00104 g006
Figure 7. Fractured surface comparison for: (a) MAG, (b) Sample B3, and (c) Sample A1.
Jmmp 06 00104 g007
Figure 8. Hardness values for: (a) MAG, (b) FSW Sample A3, and (c) FSW sample B3.
Jmmp 06 00104 g008
Figure 9. Macrographs of samples: (a) MAG, (b) A3, and (c) B3.
Jmmp 06 00104 g009
Figure 10. Macrographs showing defects in the samples: (a) MAG, (b) A1, and (c) A2.
Jmmp 06 00104 g010
Figure 11. Weld zone average grain size comparison between: (A) MAG and Sample A3, and (B) Sample A3 and Sample B3.
Jmmp 06 00104 g011
Figure 12. SEM micrographs of different zones for: (a) MAG, and (b) Sample A3.
Jmmp 06 00104 g012
Table 1. Main mechanical and chemical properties of the examined S355J2 steel.
MaterialsUltimate Tensile Strength
[Mpa]
Yield Strength 0.2% Proof
[Mpa]
Elongation at Break
[%]
Vickers Hardness
[HV]
S355J26104706170
CSiMnPSCu
Maxmaxmaxmaxmaxmax
0.200.551.600.0250.0250.40
Publisher’s Note: MDPI stays neutral with regard to jurisdictional claims in published maps and institutional affiliations.

