Article

A Collection of Molecular Fingerprints of Single Aerosol Particles in Air for Potential Identification and Detection Using Optical Trapping-Raman Spectroscopy

1
Department of Physics and Astronomy, Mississippi State University, Starkville, MS 39759, USA
2
DEVCOM Army Research Laboratory, 2800 Powder Mill Road, Adelphi, MD 20783, USA
*
Author to whom correspondence should be addressed.
Molecules 2022, 27(18), 5966; https://doi.org/10.3390/molecules27185966
Submission received: 25 July 2022 / Revised: 31 August 2022 / Accepted: 7 September 2022 / Published: 14 September 2022
(This article belongs to the Special Issue Recent Advancements in the Research of Aerosol Science & Technology)

Abstract

:
Characterization, identification, and detection of aerosol particles in their native atmospheric states remain a challenge. Recently, optical trapping-Raman spectroscopy (OT-RS) has been developed and demonstrated for characterization of single, airborne particles. Such particles in different chemical groups have been characterized by OT-RS in recent years and many more are being studied. In this work, we collected single-particle Raman spectra measured using the OT-RS technique and began construction of a library of OT-RS fingerprints that may be used as a reference for potential detection and identification of aerosol particles in the atmosphere. We collected OT-RS fingerprints of aerosol particles from eight different categories including carbons, bioaerosols (pollens, fungi, vitamins, spores), dusts, biological warfare agent surrogates, etc. Among the eight categories, spectral fingerprints of six groups of aerosol particles have been published previously and two other groups are new. We also discussed challenges, limitations, and advantages of using single-particle optical trapping-Raman spectroscopy for aerosol-particle characterization, identification, and detection.

1. Introduction

Aerosol particles are microscopic solids or liquids that are from mineral dust, carbon black, metal flakes, soot, sea spay, or biological organisms including fragments and microorganisms, with a size ranging from 0.01 µm to 100 µm [1,2]. Aerosol impacts human health, climate, and biological security. For example, the aerosol pollution that derives from industrial emissions, biomass burning, dusts, etc., causes huge impacts on human health, weather, tropospheric oxidation, etc. [3]. Some aerosolized fungi or bacteria in the atmosphere, such as Aspergillus, Penicillium, and Streptococcus, have been associated with various respiratory allergies or lung diseases, such as asthma, rhinitis, and hypersensitivity pneumonitis [4,5]. In addition, the aerosolized bacteria and fungi, due to their biological metabolites and interactions, can aggressively affect cloud formation and ice nucleation in the atmosphere [6,7]. Furthermore, some life-threatening substances such as biological warfare agents and infectious viruses can be readily aerosolized and released into the atmosphere, which is a potential threat to the national security [8]. The study of aerosols involves a collective effort from engineering, physics, chemistry, and biochemistry to address existing challenges in various topics such as aerosol instrumentation, light scattering, surface chemistry, bio-variability, formation and loss, etc. [9,10,11]. One of the challenges is characterization and detection of single, airborne particles in their native atmospheric states, i.e., freely suspended in air, without surface interactions with a substrate or particle accumulation in sampling.
Many different techniques have been used for characterization and detection of aerosols. Microscopy techniques such as optical microscopy and scanning electron microscopy are typically used to characterize physical properties, such as size, shape, and structure [12,13]. Mass spectrometry and X-ray spectrometry are used for measurements of elemental compositions [14,15]. Raman spectroscopy (RS), laser-induced fluorescence (LIF), and polymerase chain reaction are typically utilized for analyzing chemical and biological compositions [16,17,18,19]. These techniques require collecting a sufficient volume of samples and then placing the samples on a substrate or flowing into a tube or a vessel for subsequent measurements [20]. In this case, the sample’s properties may be changed in the sampling procedures, and interference may be introduced by interactions between the particle’s surface and its surrounding. Additionally, aerosol particles dispersed in air are in an extremely low concentration; thus, measurement of these aerosol particles often requires the collection of sample particles in a sufficient sample volume [20,21], and this resulting measurement may yield different information than that carried by the individual particles. Furthermore, physical and chemical properties of aerosol particles in air are changing all the time due to change in humidity, temperature, or chemical reaction with atmospheric molecules and air pollutants [22,23,24,25,26,27]. These natural processes in the atmosphere cannot be accurately measured if aerosol particles are sampled using conventional means and measured using a bulk sample.
In recent years, the study of single particles levitated in air has been increasingly reported [28,29,30,31,32,33]. Single-particle studies avoid the interferences caused by the interaction between the particle surface and its surroundings, including substrates and surface modifications during the sample handling [34]. Furthermore, the native state of a particle in the atmosphere can be simulated by levitating the particle in air [35]. On the other hand, compared with using a bulk sample, which can only provide the averaged information of the samples, using a single particle facilitates more precise and specific information about each particle, such as the particle phase, mixing state, and chemical makeup, as well as the variance in the sample [36]. To this end, one way to study aerosol particles is to levitate or trap a single particle in air or in a controlled reactive environment using optical trapping (OT).
Optically levitating a particle was first demonstrated by Ashkin in the 1970s [37]. Over the last several decades, OT and manipulation technologies have been significantly developed [38,39,40,41]. Now, a universal optical trap (UOT) can be applied to trap a single particle of a wide range of size (sub micrometer to ~100 microns), morphology, and materials in air [36,42]. After achieving stable trapping, advanced optical and spectroscopy techniques, such as cavity ringdown spectroscopy (CRDS), elastic light scattering (ELS), RS, etc. can be applied for subsequent measurements. Raman spectroscopy has been used for aerosol characterization and detection due to the high specificity of the structural identification of chemical composition based on vibrational frequencies of molecules. However, conventional Raman spectroscopy also faces the same challenges in the measurement of aerosol particles: the information from averaged measurements using bulk materials and the substrate interference. Furthermore, an additional challenge for Raman spectroscopy is that strong fluorescence can overwhelm a weak Raman signal, especially for bioaerosol particles [43,44]. Nevertheless, the combination of optical trapping and Raman spectroscopy has shown the promise in addressing both challenges.
The first OT-RS study was reported in 1983 by Trunk and Kiefer [45]. In their study, solid glass spheres and nonspherical quartz particles of 10–30 µm size were trapped in air, and the Raman spectra were acquired simultaneously. Recently, OT-RS has been reported for the study of airborne aerosol particles. Hopkins et al. reported that a single aerosol droplet could be controlled by a single-beam gradient-force and characterized by RS in 2004 [46]. Pan et al. reported the first measurements of single-particle Raman spectra for an optically trapped multi-walled carbon nanotube (MWCNT) by photophoretic force in 2012 [47]. Ling et al. (2013) reported on Raman spectroscopy of optically levitated, micron-sized, airborne absorbing particles using a single, focused Gaussian beam [48]. Wang et al. reported the Raman spectra of single pollens and grass spores in air, which were obtained by OT-RS, in 2015 [49]. In that work, five Raman bands were found close to 3000 cm−1, where most bands were overwhelmed by the strong fluorescence. Gong et al. reported fluorescence-free Raman spectra of fluorescence-dye-coated spheres optically trapped in air [50]. The results show that the strong fluorescence will be bleached in several seconds. As a result, it was demonstrated that the UOT formed by the counter-propagating hollow beams can effectively reduce or even remove the fluorescence. Later, Gong and coworkers measured Raman spectra using the same OT-RS system from single pollen particles and reported their clean Raman spectra without fluorescence [36]. Very recently, Ai et al. used OT-RS to characterize single, trapped fungal particles in a controlled environment [51]. Single fungal aerosol particles were trapped for a period of time to observe physical and chemical changes over time and to monitor the chemical reaction between a single particle and ozone based on changes in the Raman spectra. More details about recent studies of single, airborne particles using OT-RS can be read in several recent reviews [52,53,54].
In this work, we presented a collection of single-particle Raman spectra using OT-RS. The research objective was to begin development of an open-end data reference of Raman spectral fingerprints of single, airborne particles that have been studied using OT-RS. Such a database is currently not available. This work provides a collection of the single-particle Raman spectra from eight different categories: amino acids, B-vitamins, biowarfare agents, spores, pollens, fungi, extraterrestrial dust, and terrestrial dust, which have been previously published as well as some new data [8,36,49,50,51,55]. As a result, this single-particle spectral database will serve as a useful reference for potential identification and detection of single, aerosol particles in air using OT-RS and for the interpretation of Raman spectra of aerosol particles when exposed to complex conditions including reactive environments. Promise and limitation of the OT-RS technique for characterization, identification, and detection of airborne particles in their native states is also briefly discussed.

2. Materials and Methods
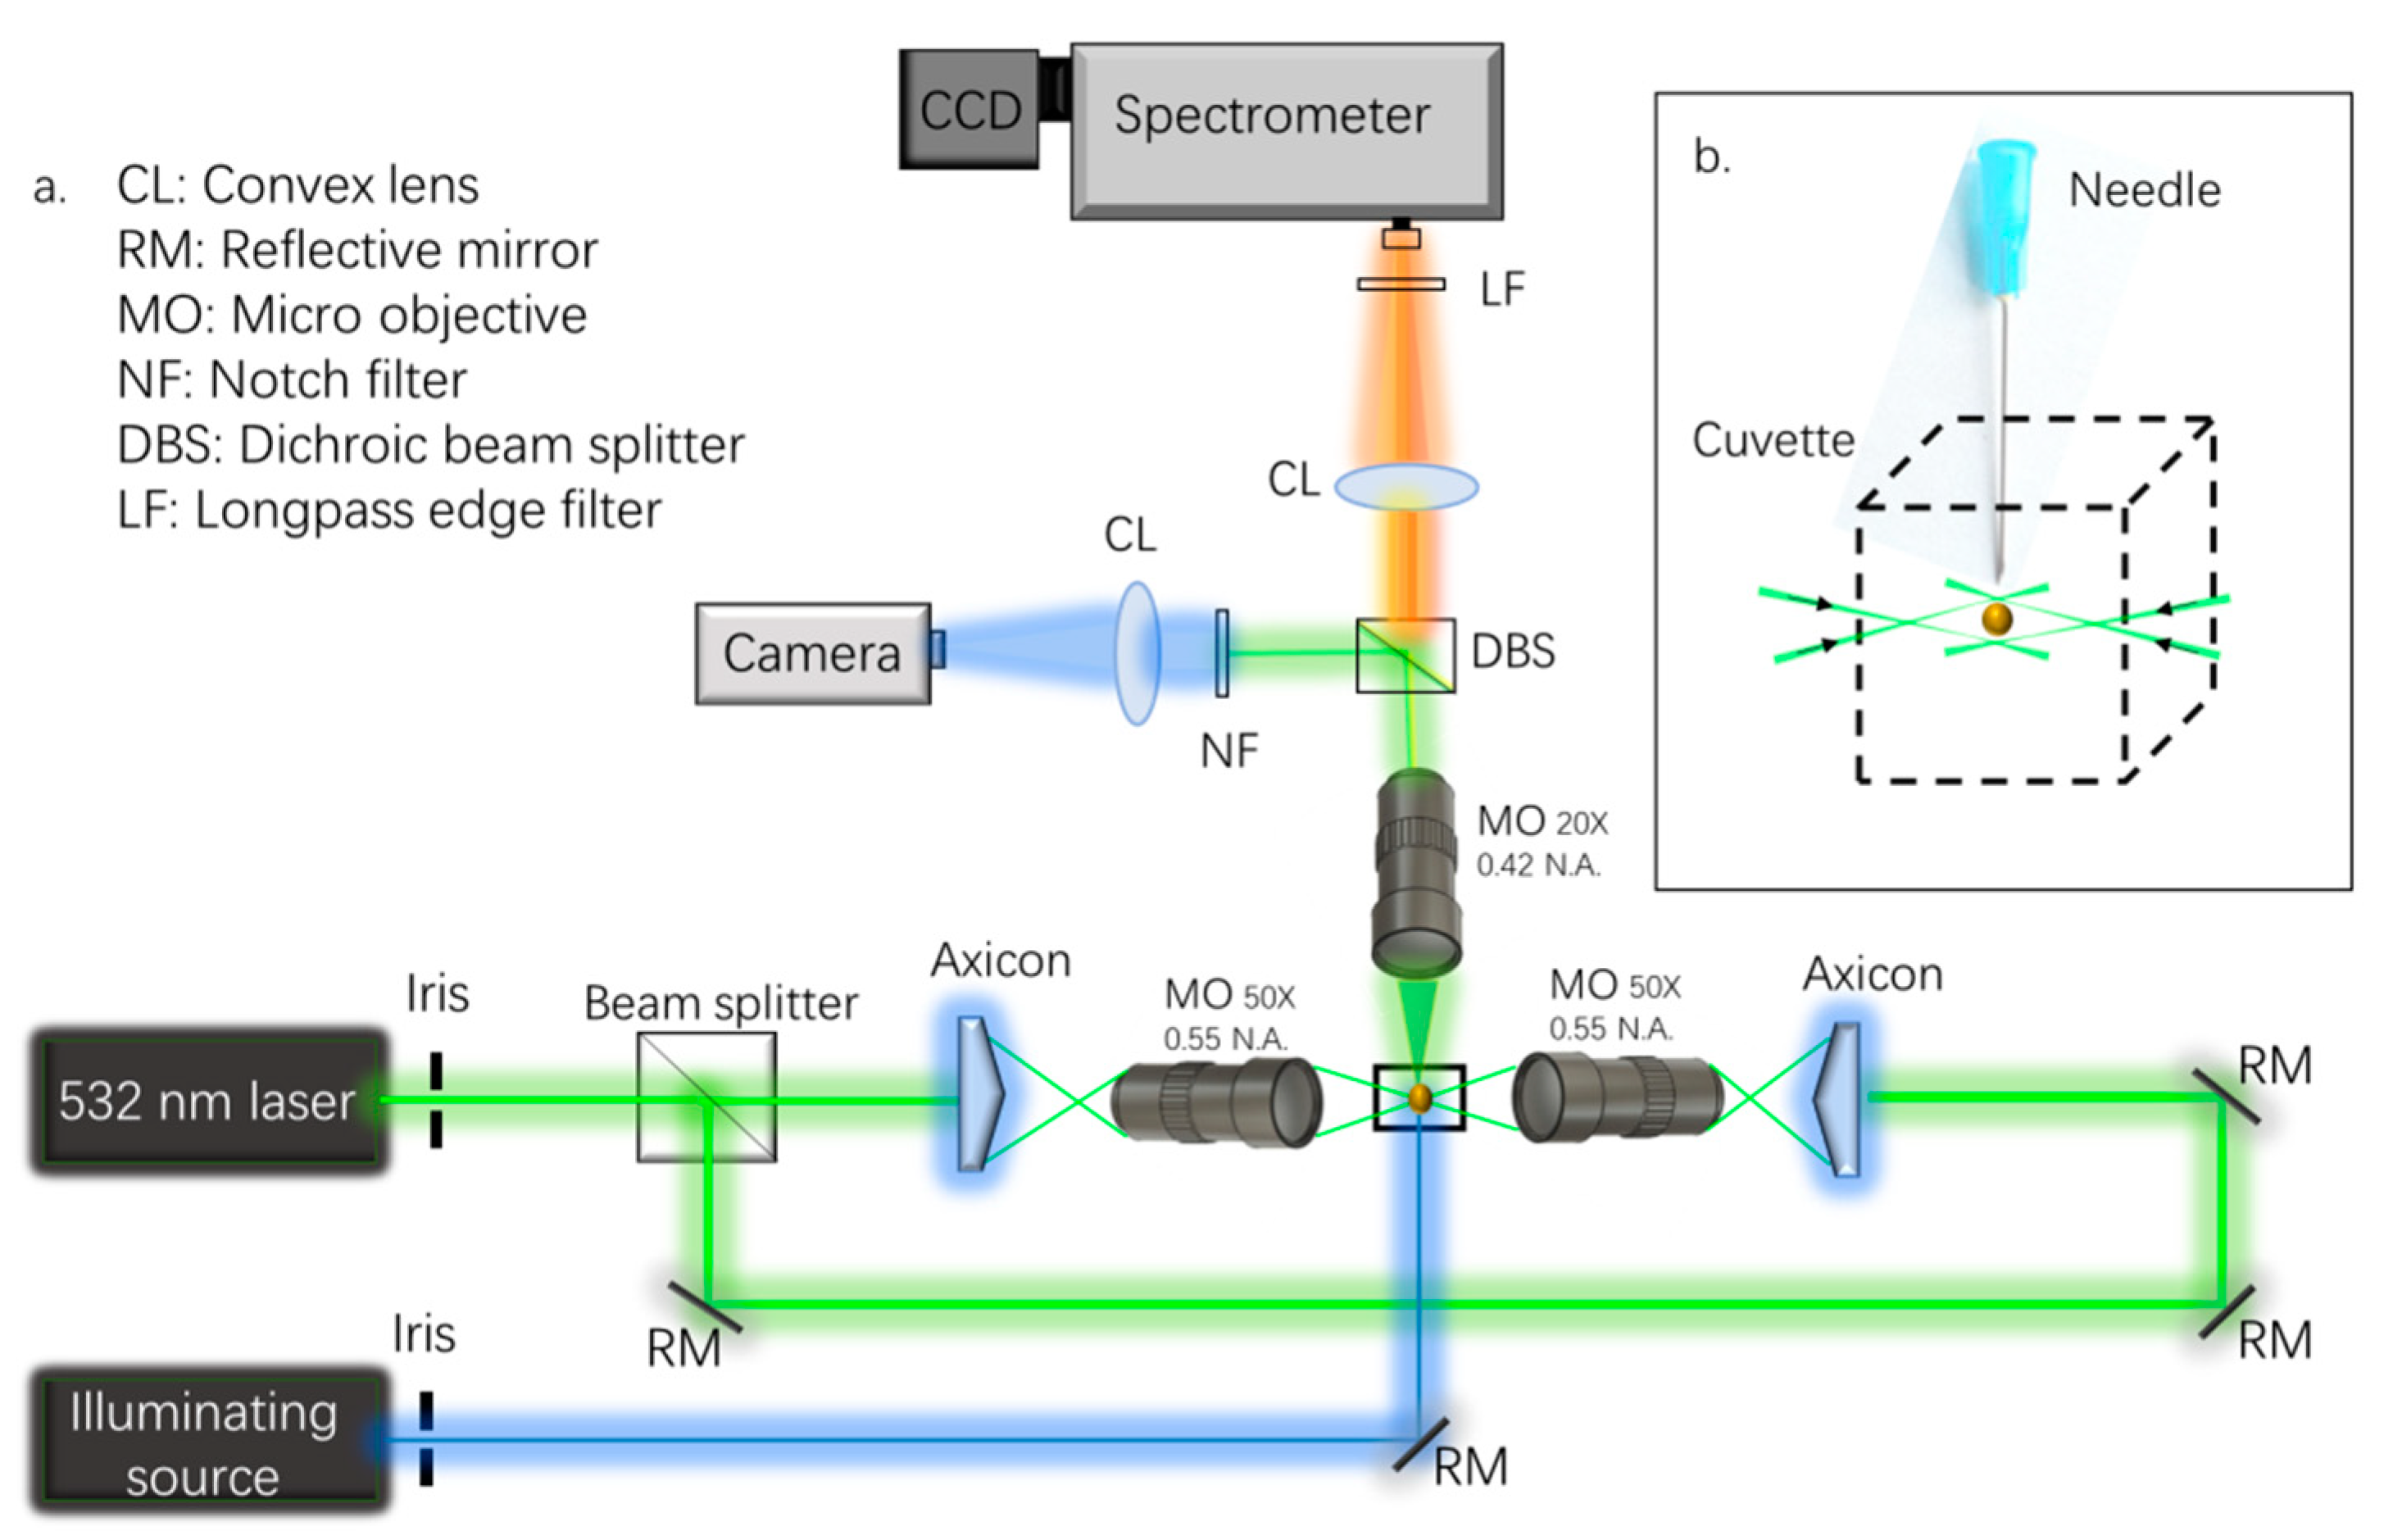
2.1. OT-RS Setup

Figure 1a illustrates the experimental setup of the OT-RS system. A detailed description can be found in previous publications, e.g., [8,25,36,50,51,55]. A continuous wave Gaussian beam at 532 nm (near TEM00 mode) is used for both trapping particles of interest and Raman excitation. The power of the laser is controlled between 50 and 1500 mW to trap a wide variety of single particles. The beam is split into two and converted to two hollow beams using two axicons (cone angle = 170 degree, Thorlabs). The two hollow beams are focused into two optical hollow cones via two micro-objectives (MO) (×50, numerical aperture (N.A.) = 0.55). The optical trapping region is formed between the two foci of the counter-propagating hollow beams, which is termed as the UOT. An octagonal chamber is placed between the two micro-objectives to house the UOT and to facilitate the control of the reactive environment around the trapped particle in the UOT. The size of the focal region is controlled by adjusting the separation distance between two MOs. Figure 1b shows the particles in the form of powder/dust introduced by a syringe needle into the trapping region. The syringe needle is mounted on a translation stage to adjust the position in the x-y plane.
The Raman scattering is excited by the trapping beams and collected by an MO (×20, N.A. = 0.42). Then, the scattering signal passes through a dichroic beam splitter and is divided into two beams. One beam passes a convex lens and a long-pass edge filter, which transmits the Raman scattering to the spectrometer (Acton 2300i, Princeton, NJ, USA). An electron-multiplying charge-coupled device (EMCCD, ProEM, Princeton, NJ, USA) is attached to the Raman spectrometer for data recording. The entrance slit of the spectrometer is set at 100–200 µm.
The grating is set at 600 or 1200 groves/mm. The spectral integration time is varied from 0.01 to 300 s, depending on the signal intensity. The other beam that is split by the dichroic beam splitter passes through a convex lens and is imaged onto a compact CMOS camera that can monitor shape, size, and position of the trapped particle in real time. A collimated laser beam at 405 nm is used to illuminate the trapped particle for imaging. The imaging system is calibrated to 0.18 ± 0.01 µm/pixel while the exposure time of the images is 0.25–0.5 ms and triggered via the EMCCD.
Note that the OT-RS system shown in Figure 1 is a typical OT-RS system that has been used for the studies of airborne particles that are covered in this work. For a specific particle sample, experimental parameters such as trapping laser beam power, size of the UOT, signal integration time, etc. are varied, but within the ranges mentioned above.

2.2. Trapping Forces

Trapping airborne particles mainly involves two types of optical forces, photophoretic force (PPF) and the radiation pressure force (RPF) [39,53]. The PPF is created by photopheresis due to differences in the surface thermal accommodation coefficient and in the particle’s surface temperature, which plays a dominant role in trapping strongly absorbing particles. The RPF, which consists of the scattering force and gradient force, can be formed by a tightly focused laser beam to trap non-absorbing particles. Depending on experimental needs, optical traps of various optical configurations have been reported [39,56]. Among them, a UOT that is formed by two counter-propagating hollow beams can trap both absorbing and non-absorbing particles of arbitrary physical and chemical properties. In this work, most samples were trapped using a UOT [8,36,50,51,55]. However, some samples in the previous works were trapped using the photophoretic trapping system, as the particle materials are strongly absorbing. For example, pollen samples are bright and absorb much less light than single-wall carbon nanotube (SWCNT) particles, which are dark. Thus, it is easy to trap SWCNT particles, but hard to trap pollen grains using a photophoretic trapping system. Nevertheless, a UOT is capable of trapping all airborne particles [53].
In Figure 1b, the particle is trapped in a UOT, which is formed by counter-propagating hollow beams. The size of the UOT can be adjusted by precisely tuning the separation distance between the two foci. The separation distance is set between several microns and ~100 microns, depending on particle size and material properties. As illustrated in Figure 1b, the trapping beam does not touch the particle directly. Thus, minimum to no photodamage is induced on the particle surface. But there will be some mass loss caused by the thermal evaporation on the particle’s surface when a thermally sensitive particle is trapped, or the trapping beams’ intensities are too strong. Additionally, the power of the trapping beams and the surface thermal conductivity of a particle are also important factors to determine the trapping time of the particle. In the practice of optical trapping, due to different mass loss rates, some particles can be trapped rigidly for hours or longer, while other particles can be trapped only for a few seconds. Therefore, in order to achieve stable trapping, the trapping beam power must be set in a specific range to minimize the mass loss and maximize the trapping time of the particle. In addition to the surface thermal conductivity, many other factors, such as particle size and morphology, also contribute to the trapping time. Some particles may experience a thermal fragmentation as the particles are hit by the trapping beams when they are introduced into the trapping region. In this case, only one part of a particle is eventually trapped in the UOT. Whether a particle will be fragmentized depends on the particle’s thermal conductivity, size, morphology, power of the trapping beams, and the forces holding the particle together. For instance, strongly absorbing SWCNTs have a high thermal conductivity and can remain unaltered in the UOT. Alternatively, some biological particles, like pollen grains, have lower thermal conductivity and are thermally decomposed easily. When a single bioaerosol particle enters the trapping region, the particle can be fragmentized into sub-micron to micrometer-sized pieces. In such instances, after the fragments settle in the trapping region, one of the fragments will be stably trapped. Even though only one small individual fragment is trapped, the particle-fragment is sufficient to allow the OT-RS system to reveal its chemical composition [35,57].

2.3. Sample Materials

Table 1 lists the samples along with their suppliers and a brief description of their properties, such as size, color, morphology, etc. The trapping efficiency denotes how difficult it was to achieve successful trapping. Stability illustrates how long such particles have been stably trapped by the OT system (H: more than one hour, M: 10–60 min, L: below 10 min). There is a strong correlation between trapping efficiency and stability. All samples were in the form of dried powders. Raman spectra were obtained from single, trapped particles. The samples were used as received without further modification or preparation (e.g., coating, heating, etc.).
Aerosol particles have different properties in size, light absorbance, morphology, etc., which offer more flexibility for the particles to be trapped and manipulated. This diversity creates challenges in controlling the particle’s motion and the elaboration of trapping force components. In air, trapping is more challenging than and not as easy as trapping in liquid due to external perturbations such as mechanical vibrations and airflow. However, once a particle is stably trapped, Raman spectra can be measured under experimental control. The samples’ names with their abbreviations used in this paper are all listed in Table 1 as follows: glycine, L-glutamic, L-threonine, Vitamin B5 (B5), Vitamin B7 (B7), Vitamin B12 (B12), Bacillus globigii (BG), Yersinia rhodei (YR), MS2, Bacillus subtilis (BS), Johnson grass smut spore (JG), Bermuda grass spore (BGS), Perennial ryegrass (rye), Western ragweed (ragweed), Paper mulberry (mulberry), and English oak (oak), Aspergillus fumigatus (AF), Aspergillus versicolor (AV), Cladosporium herbarum (CH), Paecilomyces variotii (PV), Penicillium camembertii (PCa), Penicillium chrysogenum (PCh), Penicillium digitatum (PD), lunar-regolith simulant (LS), Mars analog (MA), volcanic ash (VA), carbon sphere (CS), silica microspheres (SM), SWCNT, MWCNT, and rhodamine B doped polyethylene microspheres (RhB-PEMS).

3. Results and Discussion

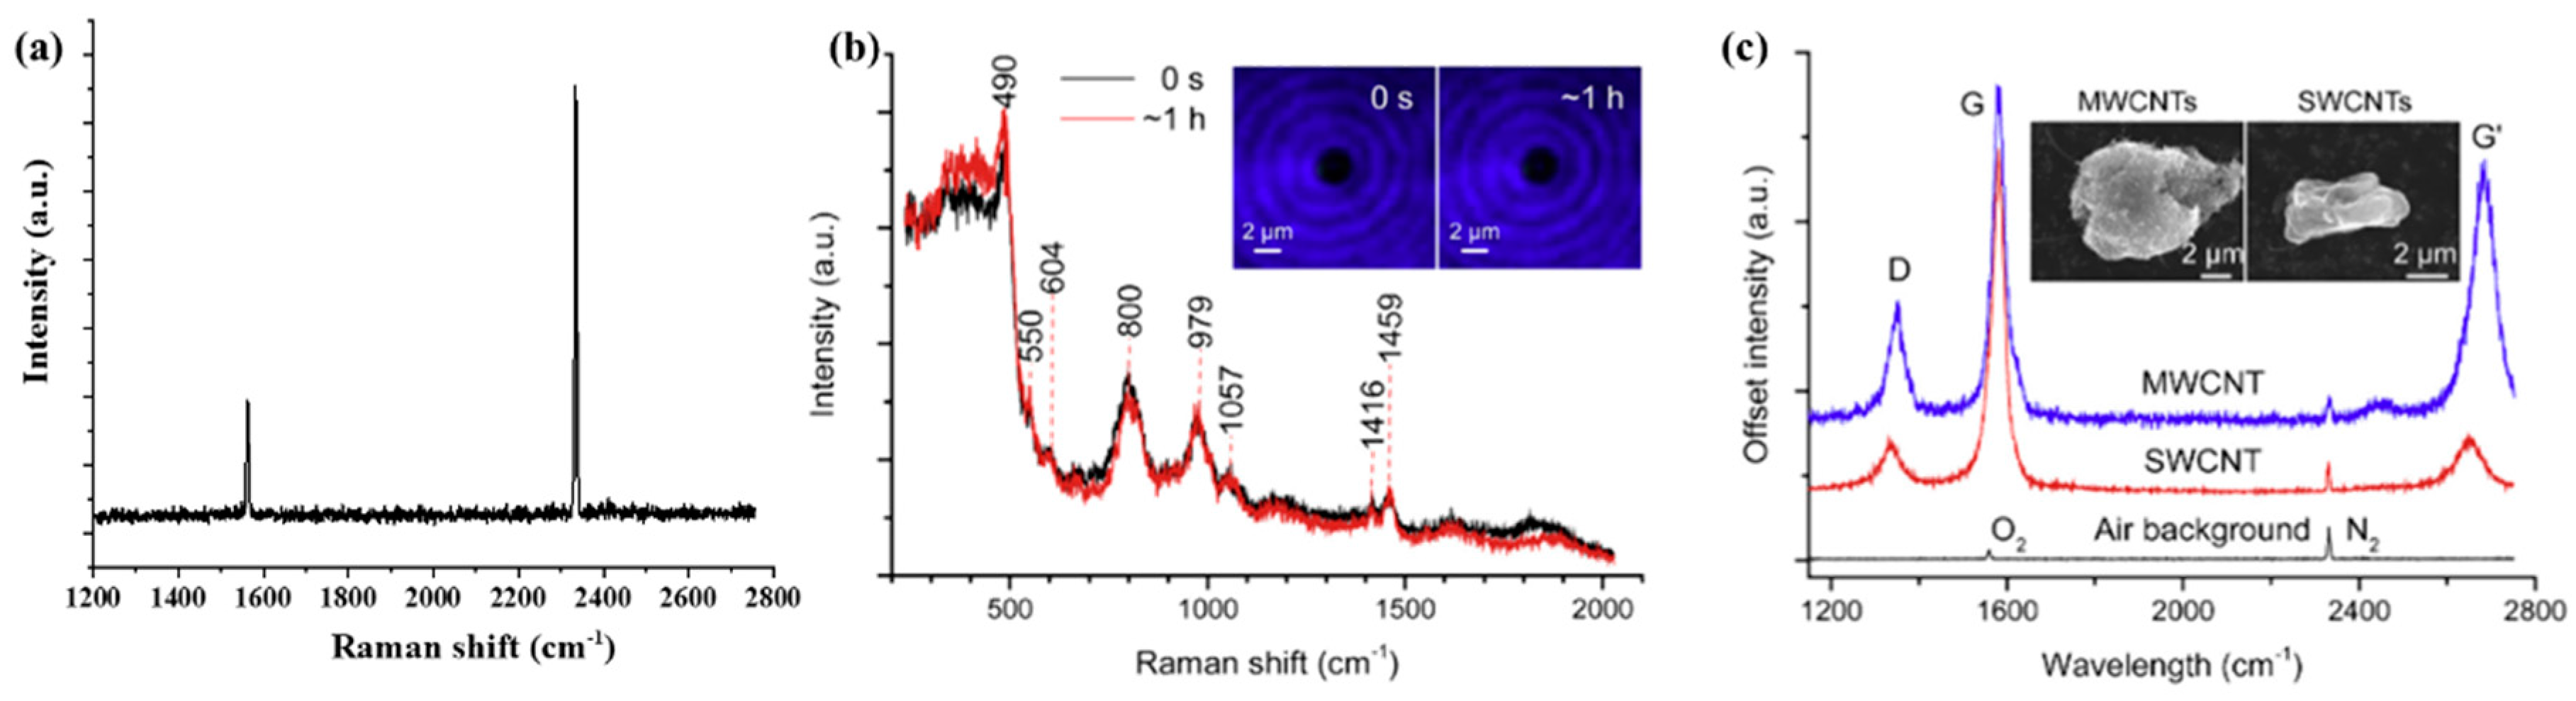
3.1. Single-Particle Raman Spectra of Standard Samples (Validation of the OT-RS System)

In general, the SWCNT, MWCNT, and SM were used to calibrate the OT-RS system. The entrance slit of the spectrometer was set at 100 μm for the spectra acquisition. A grating with 1200 groves/mm was used, and the integration time was set at 60 s for the data acquisition. The laser power was set at 50 mW to trap SWCNT and MWCNT, and 700 mW to trap SM. The Raman spectra of the ambient lab air are illustrated in Figure 2a [8]. The typical Raman bands of oxygen and nitrogen are located at 1558 cm−1 and 2331 cm−1, respectively. The spectral resolution calculated by the full width at half maximum of the nitrogen band is ±4 cm−1. Figure 2b is the Raman spectra of a single trapped SM [36]. The Raman peaks at 490 cm−1 and 605 cm−1 present the breathing modes of 4- and 3-membered rings. The peaks at 800 cm−1 and 980 cm−1 are attributed to the optical mode of the SiO2 and (OH)-Si, respectively. As shown in Figure 2b, even after trapping for one hour, there is no spectral change found. Therefore, Figure 2a,b are used for the spectra calibration of the OT-RS system. Figure 2c shows the Raman spectra of the single, trapped SWCNT and MWCNT clusters using OT-RS [36]. The common Raman bands of carbon materials are located at 1349 cm−1, 1581 cm−1, and 2684 cm−1, which correspond to the D-band, G-band, and G’-band, respectively. The signal-to-noise ratio (SNR) can be calculated by SNR = S ¯ y of the CNT spectra, where S ¯ is the average peak intensity and σy is the deviation of the peak intensity. The spectrum SNR is larger than 50, which is quite good. Once these validations are complete, the OT-RS system is ready to be used.

3.2. Raman Spectral Fingerprints of Single Bioaerosol Particles

3.2.1. Amino Acid

Chemical compositions of amino acid were characterized by using the single-particle Raman spectra obtained by the OT-RS system. The entrance slit was set at 100 μm. A grating with 600 groves/mm was used. The integration time was set at 60 s for the data acquisition. The trapping laser power was set between 400 and 700 mW based on the trapping stability of each trapped particle. Figure 3 shows typical Raman spectra of three types of amino acid particles (glycine, L-glutamic, and L-threonine). All three spectra were obtained in the first minute after a particle was stably trapped.

Glycine

The spectrum in Figure 3a was obtained from a single glycine particle trapped in air. Most bands appear in the low-wavenumber region. The CH2 torsional mode is observed at 369 cm−1 [58]. In the zwitterion form, the amino acids exhibit the COO-rocking vibrational mode in the wavenumber region of 500–550 cm−1. In this work, the rocking COO vibrational mode in the glycine molecule is coupled with C-N deformational mode, which was observed at 513 cm−1 [58,59,60]. The COO wagging vibrational mode is observed at 616 cm−1 [58]. Generally, the COO scissoring vibrational modes occur in the region of 650–750 cm−1. In the present investigation, the COO scissoring is coupled with C-C stretching vibration that is obtained at 709 cm−1 [58]. Mostly, the rocking CH2 vibrational modes occur in the region 750–950 cm−1 [58]. In this work, the CH2 rocking vibrational mode is coupled with COO deformational mode that is obtained at 905 cm−1, which is the most massive band in the glycine spectrum [58]. Bands at 1048 and 1122 cm−1 are assigned to C-NH2 stretching and NH3+ rocking vibrational modes that are coupled with the CH2 twisting vibrational mode [58,61]. The wagging vibrational mode of the CH2 group generally appears in the region of 1330–1360 cm−1. The CH2 wagging vibrational mode of glycine molecules is obtained at 1338 cm−1 which is the second intense peak in the glycine spectrum [58]. The CH2 scissoring in the plane-bending vibrational mode is coupled with the COO symmetric and asymmetric stretching vibrational mode, which are obtained at 1416 cm−1 and 1452 cm−1, respectively [58]. The NH3+ symmetric deformation mode is observed at 1580 cm−1 [58,62]. On the other hand, amino acids show weaker Raman bands in the region 1590–1690 cm−1 due to the asymmetric deformation mode of the NH3+, which can be observed in this work as a weak band around 1677 cm−1. The Raman band of N2 is observed at 2331 cm−1 [8]. The CH2 symmetric stretching vibrational modes are observed at 2976 cm−1 and 3013 cm−1, which are the most common bands in biological materials [58]. A weak and broad band at 3162 cm−1 has been assigned to NH3+ asymmetric stretching vibrational mode [58].

L-glutamic

The Raman spectrum of a single, trapped L-glutamic acid particle is shown in Figure 3b. The C-C stretching was observed at 1064 cm−1 [63]. A vibration associated with deformation of NH3+ was observed at 1122 cm−1 [60]. The CH2 wagging band was obtained at 1301 cm−1 [63]. The band at 1443 cm−1 has a broad width, which is assigned to the COO symmetric stretching vibration [64]. The most intense band is in the high-wavenumber region of the spectrum, which corresponds to CH2 stretching at 2848 and 2880 cm−1 [65].

L-threonine

Typical Raman spectrum of a single, trapped L-threonine acid particle is shown in Figure 3c. Threonine is a secondary alcohol group, in which most of its bands are attributed to the C-C stretching vibration or carboxylate group. A vibration that is associated with the CCN stretching mode is observed at 876 cm−1 [66]. The peak at 1076 cm−1 is assigned to OH deformation motion [66]. The methine group, which is associated with CH2 wagging vibration mode, can be seen at 1299 cm−1 [67]. A COO symmetric stretching vibration is observed at 1443 cm−1 [60,67]. A strong intensity band associated with the CH2 stretching mode is observed 2878 cm−1 [67].
Because of the long spectra-acquisition time and no surface interference of a trapped particle, the OT-RS system results in high SNR. For instance, the glycine spectrum in Figure 3a has a smooth baseline compared with spectra collected using a substrate [66]. Furthermore, some interference caused by fluorescence can be observed on the baseline. This is mainly because of the photo-bleach process of UOT. More details about photo-bleaching are discussed in Section 3.2.2 and Section 3.2.3.
In general, the Raman spectra of amino acids are quite different from each other, but there are still some common bands among them. For instance, all amino acids have a carboxyl group (COOH) at one terminus and an amine group (NH2) at the other side. They are different in their side chains, which gives amino acids their characteristic chemical properties. In all spectra, the C-C skeletal stretching is observed around the 1000 cm−1, and the CH stretching vibration mode is found around 3000 cm−1. These are also the common bands for most bioaerosols, as the amino acids are components of proteins and substances for carbon metabolism in most bioaerosols [68]. Thus, these amino-acid spectra can be used for interpretation of the Raman spectra of biological materials.

3.2.2. B Vitamins

Figure 4 shows typical single-particle Raman spectra for vitamins B5, B7, and B12. The experimental parameters were the same as those described in Section 3.2.1. The three spectra were obtained in the first minute after a particle was stably trapped.

B5 (D-Pantothenic Acid Hemicalcium Salt)

The spectrum in Figure 4a was obtained from a single B5 particle trapped in air. In the spectrum of B5, the C=C=C angle deformation mode and the C=C stretching vibration mode are found at 658 cm−1 and 842 cm−1, respectively [69]. In addition, the peak at 933 cm−1 belongs to the rocking mode of CH2 [69]. Two stretching normal modes attributed to the C-O(H) group are observed at 1041 cm−1 and 1139 cm−1 [69]. Furthermore, the CH group has a deformation mode at 1306 cm−1 [69]. The most intense band at 1477 cm−1 is assigned the antisymmetric deformation of the CH3 mode and the band at 1628 cm−1 is assigned the C=O stretching vibrational mode [69]. The wide wave package around 3000 cm−1 is due to the symmetric stretching modes of the CH group.

B7 (Biotin)

The observed Raman spectrum of a single B7 particle is shown in Figure 4b. The peak at 1071 cm−1 is due to the stretching mode of the ureido ring [70]. The CH and CH2 deformation modes are observed at 1318 cm−1 and 1458 cm−1, respectively [70]. The peak at 1654 cm−1 is assigned the C=O stretching vibrational mode [70]. The strong intense peak at 2892 cm−1 corresponds to the CH stretching vibration [71].

B12 (Cyanocobalamin)

Figure 4c shows the Raman spectrum of a single B12 particle. The weak band at 733 cm−1 is assigned the CH3 rocking vibration mode [72], and bands between 1149 to 1574 cm−1 are attributed to the corrin ring vibration mode [73,74]. The corrin ring is a characteristic structure for B12, which is considered the core of the molecular structure.
Although the three samples shown in Figure 4 are from a vitamin family, they show quite different chemical structures as different Raman bands appear. The special components of ureido and the coring ring for B7 and B12 make their spectra easily differentiated; however, they still share some common Raman bands. The peak around 1300 cm−1 corresponds to the CH stretching mode, which is observed in B5 at 1306 cm−1 and in B7 at 1318 cm−1. In addition, the peak around 3000 cm−1 of the CH stretching vibration is observed in B5 and B7. B12 is a highly fluorescent sample, and it is difficult to completely get rid of the fluorescence. Ibáñez et al. reported the Raman spectrum of B12 using surface-enhanced Raman spectroscopy with a 785 nm exciting laser [74]. The results show some Raman bands in the spectrum, but the interference caused by fluorescence is still high. In Figure 4c, some peaks are resolved, but the baseline is still noisy, and many peaks are comparable with the noise, which is mainly caused by the fluorescence of the sample. In this work, the fluorescence may be excited by the trapping laser beam, as a laser beam at 532 nm can induce strong fluorescence in biomaterials, the UOT can reduce the fluorescence through photo-bleach process. In practice, many factors determine the photo-bleach efficiency, such as the fluorescent properties of the sample materials, the laser illumination time, the laser wavelength and intensity, the location of a trapped particle in the UOT, etc. Although the UOT is efficient for single-particle fluorescence bleaching, it is not effective for all sample materials. Different approaches are also being explored to quench the fluorescence; for example, an additional laser beam at a different wavelength may be added to the OT-RS system to illuminate the particle and help further reduce fluorescence.

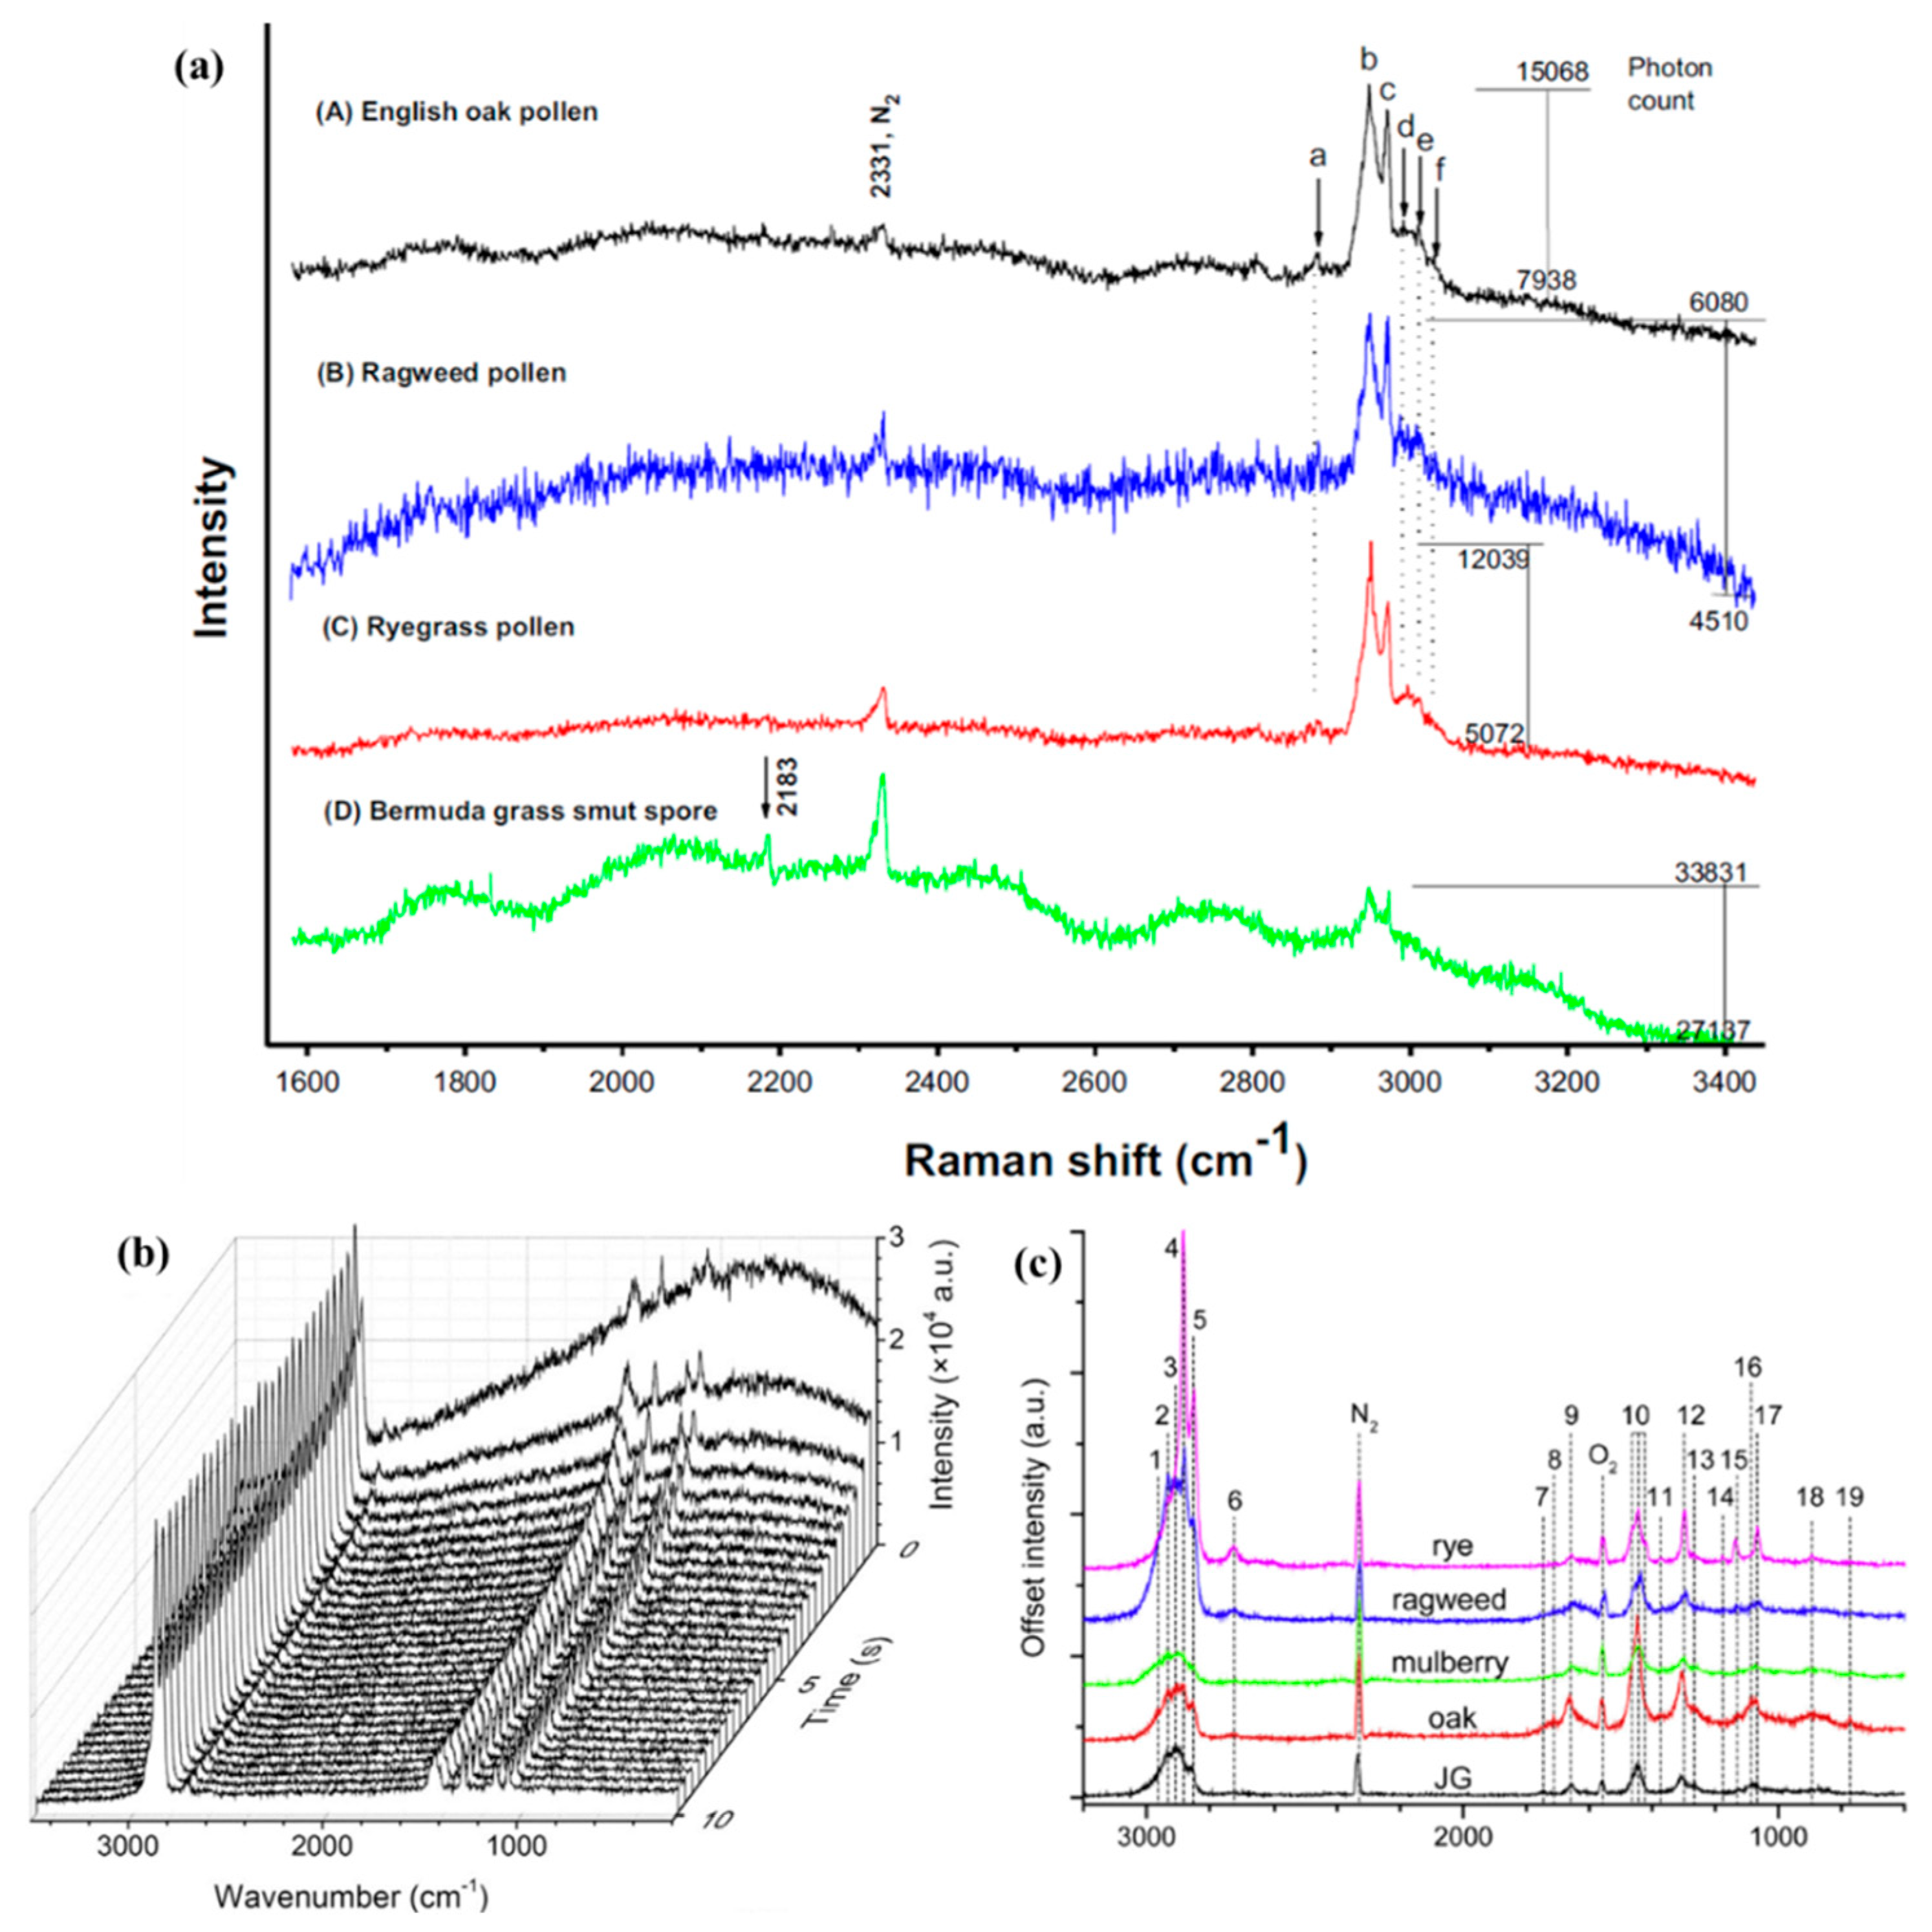
3.2.3. Pollens and Spores

The first Raman spectra of single pollens and fungal spores optically trapped in air were reported by Wang et al. in 2015 [49]. Three pollens of English oak, ragweed, and ryegrass, and a Bermuda grass spore were studied. The single-particle Raman spectra of these four samples were recorded in the spectral range of 1600–3400 cm−1. As shown in Figure 5a, five Raman bands were obtained around 3000 cm−1, which were assigned to the CH2 symmetric stretch (2948 cm−1), CH2 Fermi resonance stretch (2970 cm−1), CH3 symmetric stretch (2990 cm−1), CH3 out-of-plane end asymmetric stretch (3010 cm−1), and unsaturated =CH stretch (3028 cm−1). Even though the five Raman bands around 3000 cm−1 are resolved for the three pollen species and two bands for the Bermuda grass spores, some bands are barely distinctive due to the strong fluorescence background and the baseline noise. Furthermore, no characteristic Raman bands for the samples were found in the hump-like region between 1600 and 2900 cm−1. In 2017, Gong et al. reported time-resolved Raman spectra of a single dye-doped polymer particle trapped by a UOT in air [50]. The time-evolution of Raman spectra of the single, dye-doped polymer particle is illustrated in Figure 5b. As the fluorescent particle is trapped in the UOT, the fluorescence can be rapidly photo-bleached in the first several seconds. While this occurs, the baseline flattens, and the clear Raman bands become apparent. Later, the fluorescence-free Raman spectra of pollens and spores (Perennial ryegrass, Western ragweed, English oak, and Johnson grass smut spore) were reported by Gong et al. by using the same OT-RS system [36]. In this experiment, the entrance slit was set at 200 μm, and the integration time was set at 300 s. This larger slit width and longer acquisition time were used to obtain a better SNR signal for each trapped particle. As shown in Figure 5c, the baseline of the Raman spectra is clean, only with minimum influence from fluorescence. Compared with the previous study [49], more information can be revealed by the cleaner Raman spectral fingerprints. For example, the Raman bands of the CH stretching around 3000 cm−1 are much better resolved, showing more accurate band positions. Furthermore, many characteristic Raman bands were found in the wavenumber region of 700–1800 cm−1. For instance, the C-C stretching mode around 1080 cm−1, CH2 bending mode at 1450 cm−1, and Amide I mode at 1660 cm−1, which were not shown in the previous study, were observed in these fluorescence-free Raman spectra.
In general, many organic functional groups contain fluorophores, which may generate strong fluorescence in the detected Raman shift region, depending on the excitation wavelength. For some biological samples, fluorescence can be generated by a laser excitation wavelength from near UV to near IR. In this work, as the Raman signal was excited directly by the trapping beam wavelength at 532 nm, strong fluorescence can be generated. As optical trapping is less sensitive to trapping laser wavelength thought PPF is based on light absorbance that is wavelength dependent, we may use different trapping laser sources to avoid strong fluorescence interference for different sample materials. It is challenging to completely eliminate the fluorescence in the Raman spectra, regardless of what methods or techniques are used. Photo-bleaching is an efficient way to quench the fluorescence. The conventional method is long-time irradiation of the samples that are placed on a substrate, using mercury lamps, ultraviolet, or a visible laser. The irradiation time can range from minutes to several hours [49]. This approach is not only time-consuming but also may damage the sample’s surface due to the uneven heating and the slow heat dissipation. Comparatively, the photo-bleaching process from the UOT is fast and without any photo-induced damage. An optically levitated particle in the UOT is engulfed by the scattered light from the trapping beams and the entire surface of the particle is photo-bleached. In this case, even though a high laser power is used, the local temperature induced resulting from laser heating is still much lower than when the particle is placed on a substrate. In addition, the photo-bleaching process can be completed in several seconds because the particle is trapped inside the UOT where photons are coupled and pass throughout the whole particle through scattering and reflections, and the resonance effect of whispering gallery modes (WGM) can further enhance the bleaching effect if the particle is spherical [50]. As a result, in most cases, the OT-RS can effectively reduce the fluorescence by a fast photo-bleaching process.

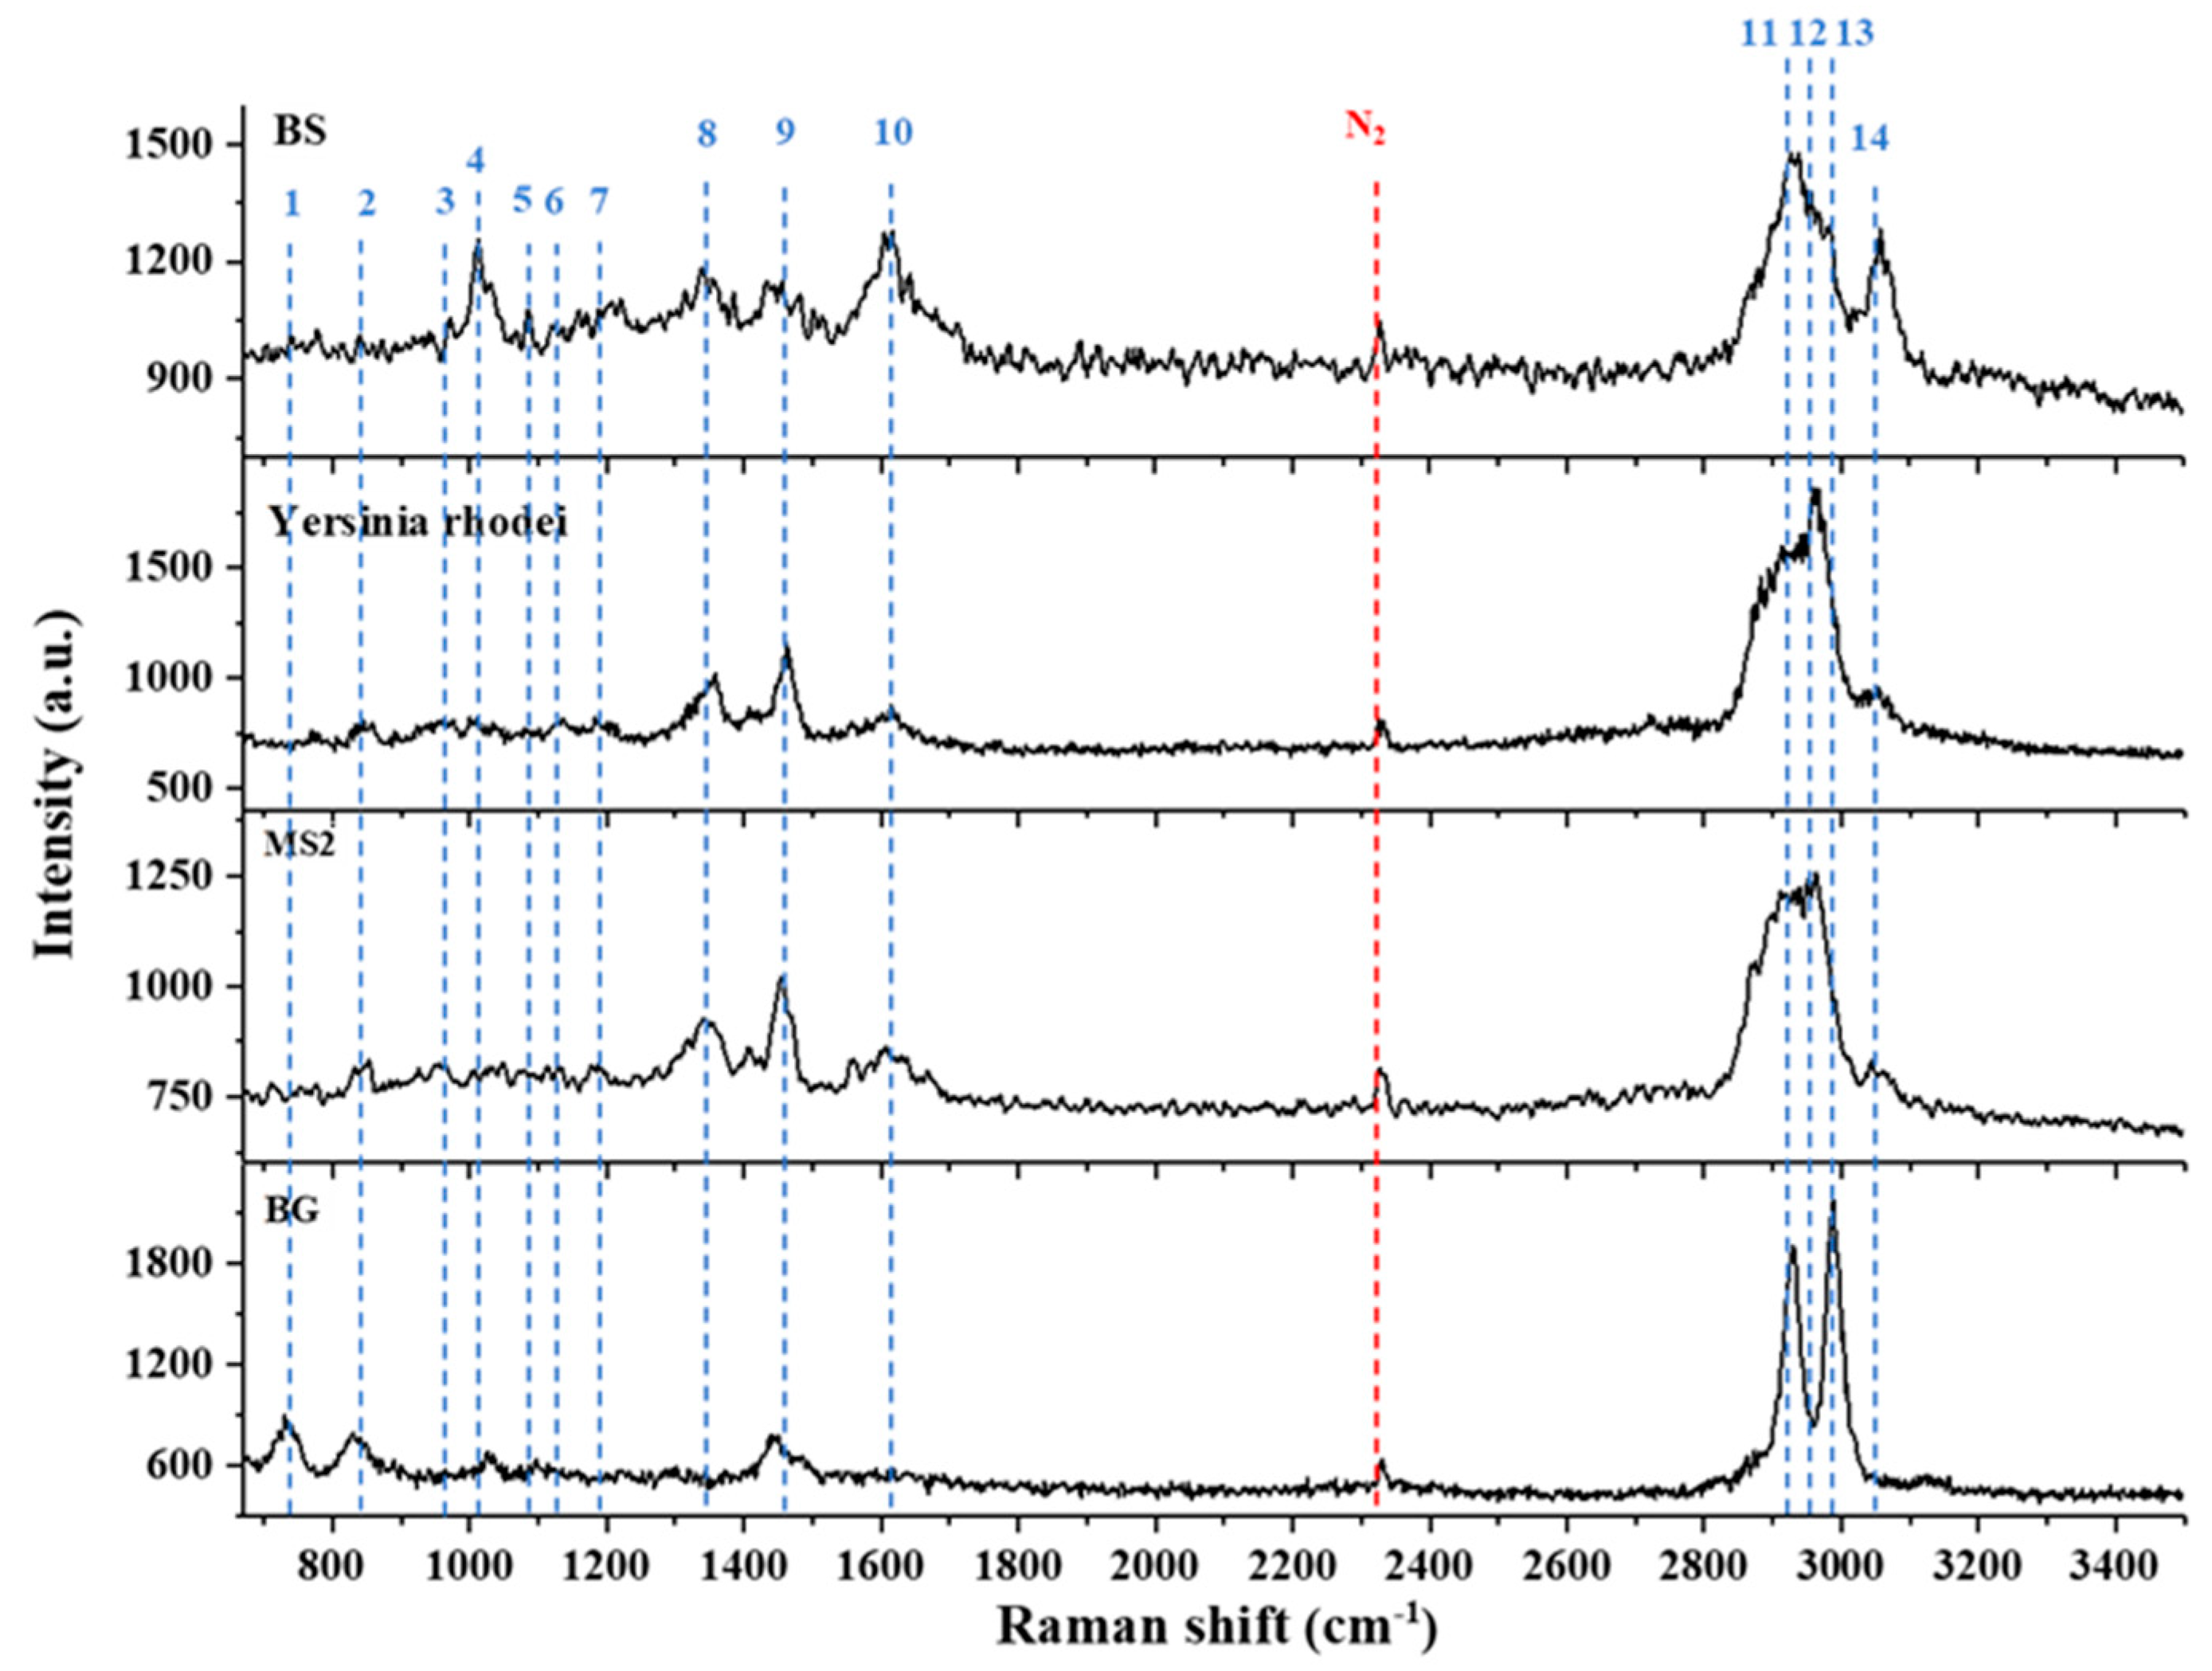
3.2.4. Aerosolized Biowarfare Agent (BWA) Surrogates

In a previous work, BWA surrogates were studied using OT-RS [8]. In this experiment, the slit width of the spectrometer was set at 200 μm, and the integration time of 60 s was used for the spectra acquisition. The single-particle Raman spectra of four different types of BWA surrogates (BG, YR, MS2, and BS) were collected for species classification and potential identification. Due to the photo-bleaching process, the Raman spectra of the four BWA surrogates shown in Figure 6 are clean, with low baseline noise generated by fluorescence. As shown in Figure 6, the spectra have some similarities; for example, the wave package around 3000 cm−1 was seen in all the samples. These common bands are related to CH stretching that relates to lipids or proteins in most biomaterials as discussed in the previous section. However, even though some common bands are found in this region, the spectral structures are different and can be used to classify the different samples. Furthermore, the Raman spectra in Figure 6 also revealed distinctive bands for each sample. For example, the Raman band at 732 cm−1 was only seen in the spectra of BG; the band at 955 cm−1 which comes from the C-C backbone appears only in the spectra of BS and MS2; the band at 1032 cm−1 that is from phenylalanine was unique for BS among the four samples. Therefore, different BWA surrogates can be identified by these characteristic spectral fingerprints. The principal component analysis for the four BWA surrogates as well as three common atmospheric bioaerosols (JG, oak, and ragweed) further demonstrated that the four BWA surrogates can be identified, and all the samples can be clearly classified by their single-particle Raman spectra [8].

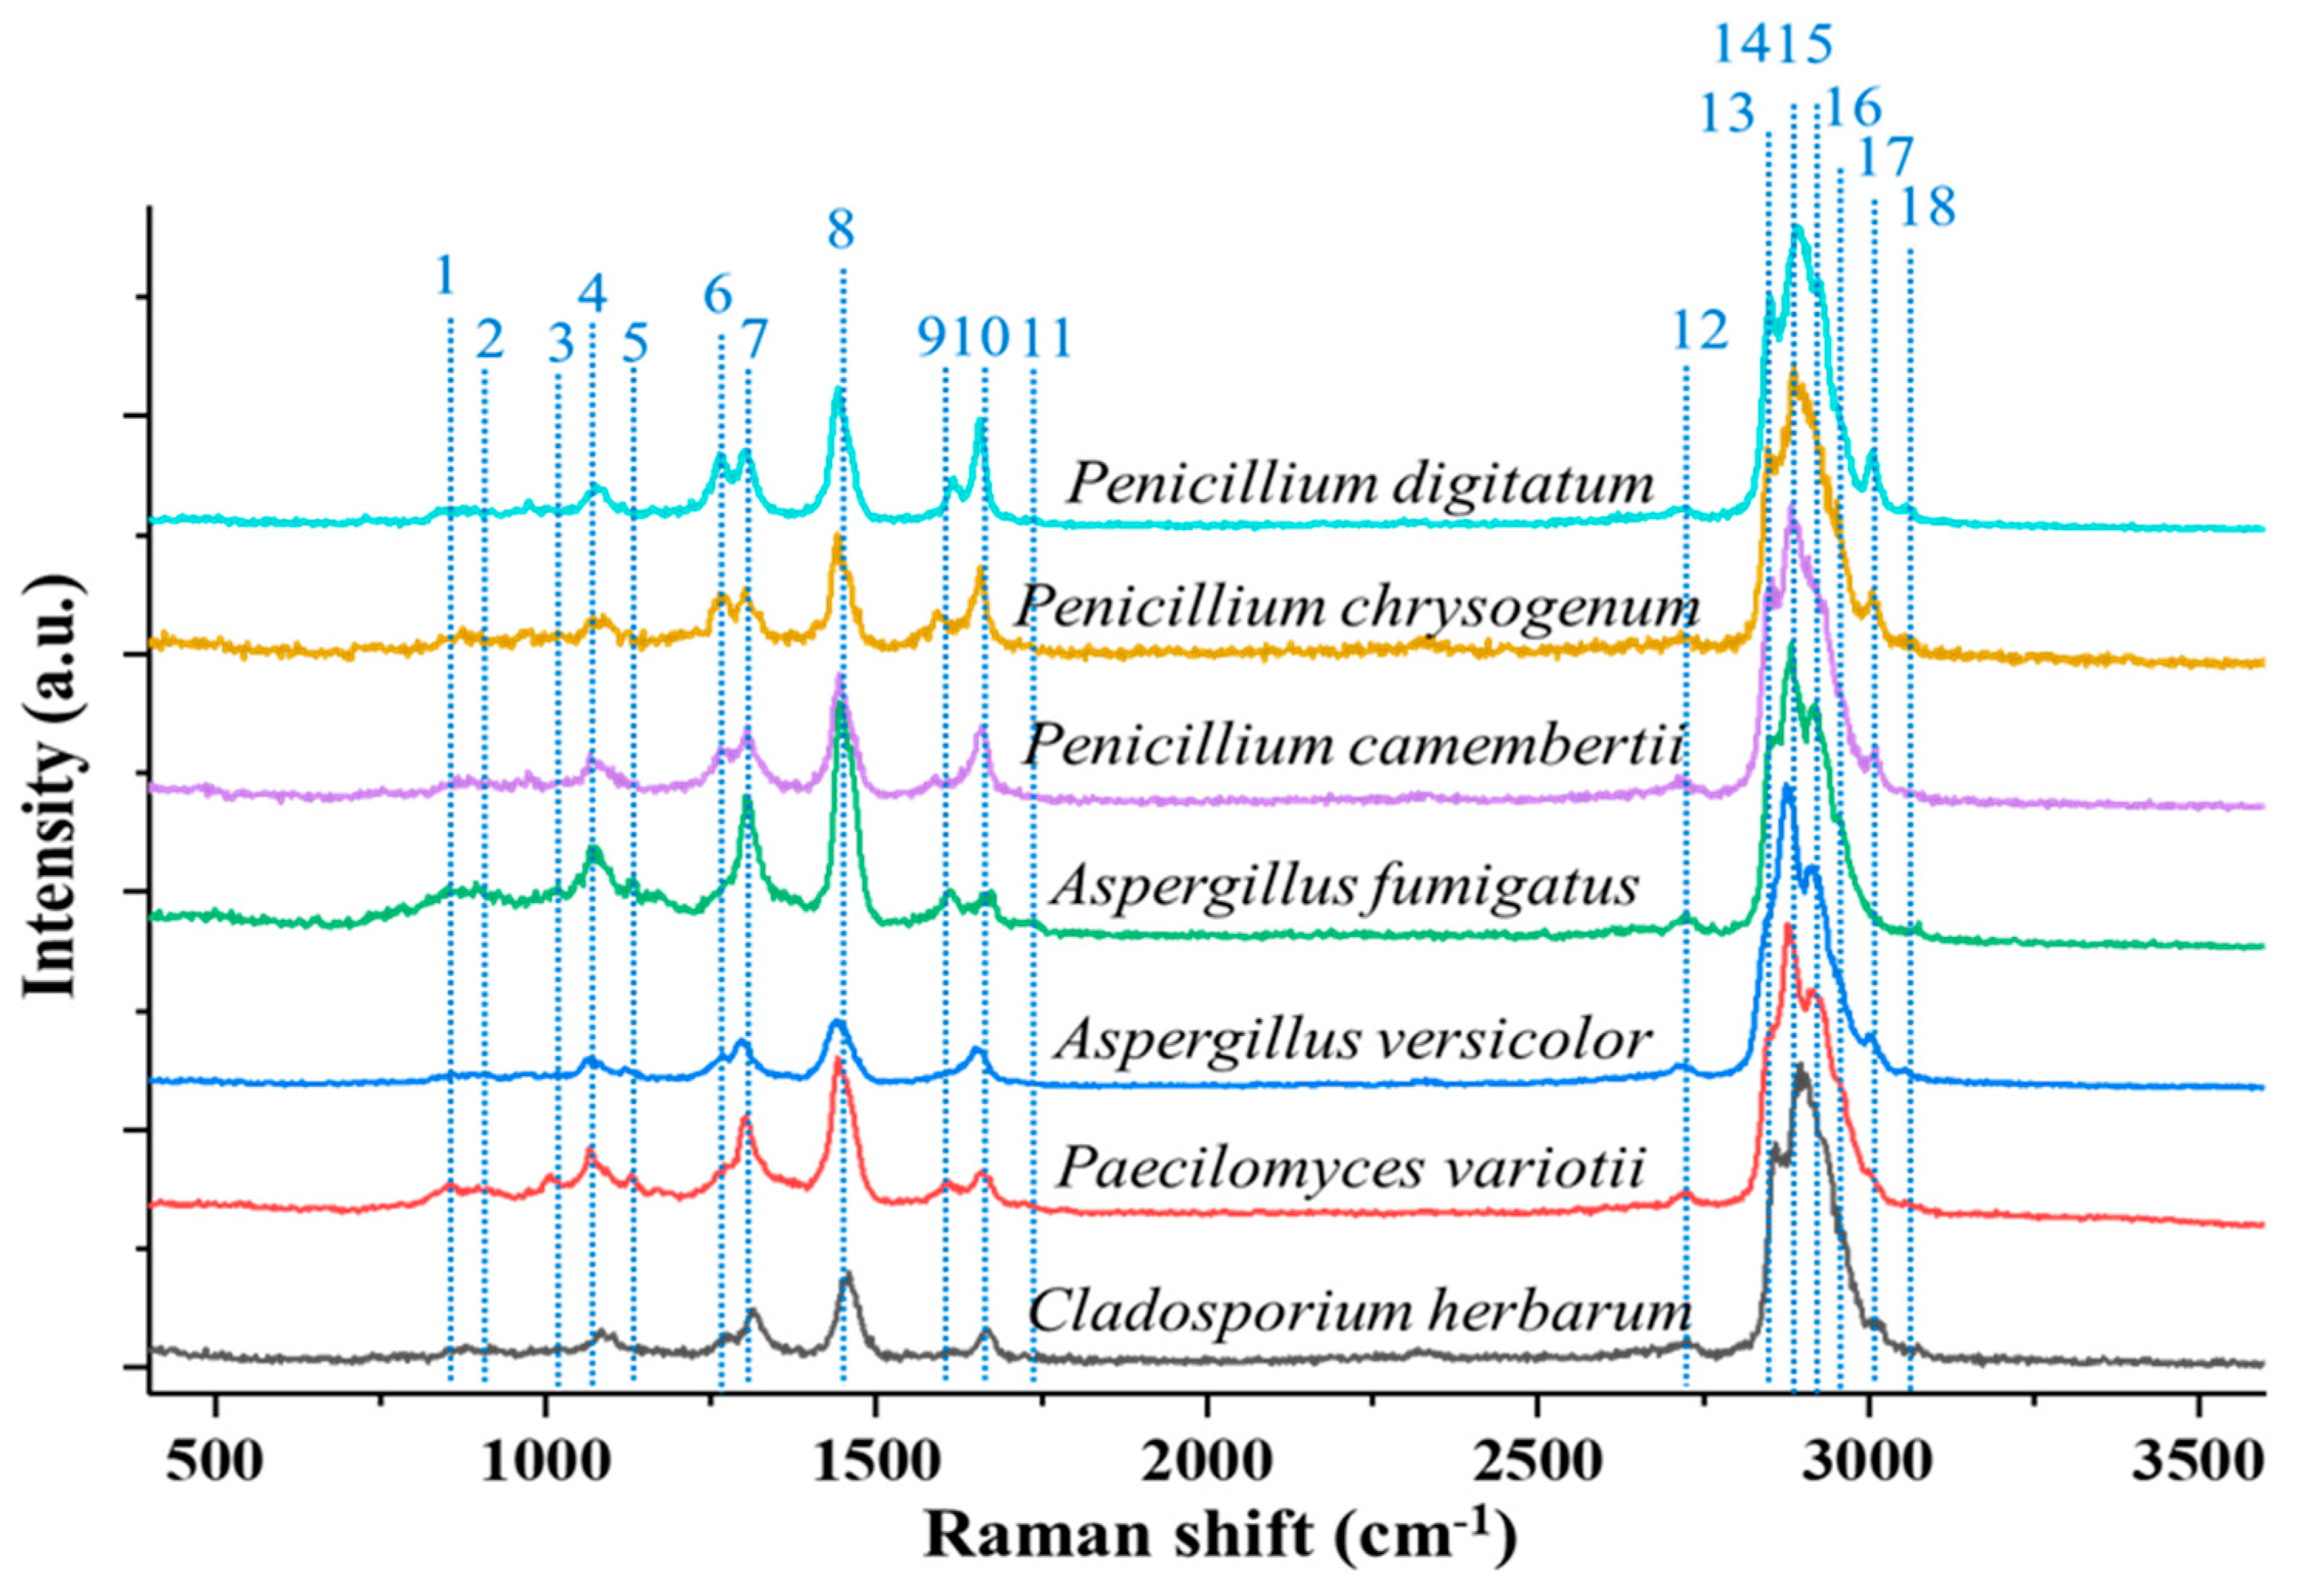
3.2.5. Fungal Particles

Recently, the Raman spectra of single, fungal aerosol particles were measured using OT-RS by Ai et al. [51]. In this experiment, the trapping laser power was set at 1500 mW to obtain the maximum stability for the particle trapping. Similar to the previous section, the slit width of the spectrometer was set to 200 μm, and the integration time of 60 s was used for the spectra acquisition. Seven different fungus samples were used: Aspergillus fumigatus, Aspergillus versicolor, Cladosporium herbarum, Paecilomyces variotii, Penicillium, Camembertii, Penicillium chrysogenum, and Penicillium digitatum. The single-particle Raman spectra of these samples are shown in Figure 7. All the fungus samples share the most common Raman bands of bioaerosols, such as the C-C stretching around 1000 cm−1 and CH stretching band packages around 3000 cm−1. In addition, some distinguishable bands which may reveal specific properties of each fungus also can be seen. For example, the Raman band at 1131 cm−1 arising from palmitic acid and the band at 1750 cm−1 from lipids or C=O were found in the Aspergillus species only. The band around 1267 cm−1 associated with the CH stretching (lipids in normal tissue) was seen only in the Penicillium type of fungus. These Raman bands are indicative of the distinctive chemical composition or properties of the specific fungi or fungal species; therefore, different fungal species can be classified by these characteristic spectral fingerprints.
In addition to the characteristic spectral features that are obtained when single particles are trapped in air, the single-particle Raman spectra also can be used to study surface chemistry when a trapped particle is exposed to a reactive environment, such as ozone [51]. The time-resolved, single-particle Raman spectra show a uniform decrease of the peak intensity with time when a particle is trapped in air. This is mainly because of the mass loss that is caused by the surface chemical evaporation. When trapped in ozone, Raman bands showed nonuniform changes in terms of their peak intensities, reflective of the chemical changes occurring. For example, a decrease of intensity of the band at 840 cm−1 is caused by the reaction of tyrosine with O3. The increase of the Raman band intensity at 1005 cm−1 is due to the lipid oxidation. In such cases, the OT-RS technique is capable of monitoring the chemical reactions based on the spectral features of the bands. Consequently, Raman spectral fingerprints from OT-RS can not only be used to identify and classify aerosol particles when exposed in air, but also be used for the study of chemical reactions in the simulated native state.

3.3. Raman Spectral Fingerprints of Extraterrestrial and Terrestrial Dust Simulants

The Earth’s atmosphere contains interplanetary dust particles, which play an important role in the Earth’s ecosystem and may also carry the primitive information of the early Solar system. Very recently, OT-RS has demonstrated itself to be a powerful tool for the study of extraterrestrial dusts particles [55]. In this experiment, the entrance slit was set at 200 μm. A grating with 600 groves/mm was used, and the integration time was set at 60 s for the data acquisition. Figure 8 shows single-particle Raman spectra obtained by OT-RS from two extraterrestrial dust simulants that include a lunar-regolith simulant and a Mars analog, and two terrestrial dust simulants that are a carbon sphere and volcanic ash.
The Raman spectrum shown in Figure 8A was acquired from a trapped single carbon sphere. The common bands of carbon materials were found at 1367 cm−1 (D-band), 1585 cm−1 (G-band), and 2700 cm−1 (G’-band). In addition, one more band was found at 2900 cm−1, which corresponds to the 2LO-band. Those band features can be used to distinguish structural and compositional characteristics of different carbonaceous materials. Figure 8B shows the single-particle Raman spectrum of volcanic ash. The main chemical compositions of volcanic ashes are SiO2 glasses, ferric minerals, and sulfate. The Raman band at 361 cm−1 is from the Ca-O stretching vibration. The band at 468 cm−1 is assigned to SiO2. The band around 665 cm−1 is related to silicate minerals, which is assigned to the Si-O-Si symmetrical band. The peak at 1006 cm−1 is attributed to band of sulfates SO 4 2 in calcium sulfate. Figure 8C,D show the single-particle Raman spectra of extraterrestrial dust simulants. The Raman spectrum of a single Mars analog particle is shown in Figure 8C. The Raman band at 371 cm−1 is attributed to the Mg-O stretching of pyroxenes and the peak at 503 cm−1 is the O-Si-O band of pyroxenes. Another band around 627 cm−1 relates to the bending of Si-O-Si, which comes from end-member Mg-Fe-Ca pyroxenes. These bands indicate that the major composition of this Mars analog is pyroxenes. In addition, the Raman band at 1565 cm−1 is from the G-band, which indicates the existence of amorphous or graphitic carbon. Figure 8D shows the Raman spectrum of a single lunar-regolith particle. Principle materials in lunar regolith are pyroxene and plagioclase, along with ilmenite and olivine. The Raman band at 500 cm−1 refers to the plagioclase group, which is associated with the symmetric T-O-T stretching mode of the four member TO4 tetrahedral ring, where T stands for Al or Si.
Table 2 summarizes the spectral characteristics of all single particles measured using OT-RS to date. More than 100 chemical function groups from single trapped particles in air or in a reactive environment have been assigned based on references of the Raman spectra measured using bulk samples. Note that a Raman band or a Raman shift (cm−1) from the same function group, e.g., the CH stretching mode, can be slightly different in individual molecules containing the same function group, or same molecules from individual aerosol particles. One spectral feature (band location, intensity ratio, band shape, absence and presence of a bands, etc.) may not be used for identification of a chemical composition; however, a combination of such features of several function groups can be a unique identification of a specific chemical constituent or a specific type of aerosol particles [8,25,51]. Given a database of such features, advanced data-analysis methods such as principal component analysis [8] and machine learning [75] can be utilized for spectral pattern formation and recognition to achieve particle identification. Note that some spectral data on single particles using other particle levitation techniques such as electrodynamic balance are not included here. Molecular fingerings from single particles in future studies are strongly encouraged to be added to this open-end collection.

4. Future OT-RS for Potential Identification and Detection of Single Airborne Particles

The OT-RS technique enables us to characterize single particles in air or under a controlled reactive environment without the need for using a substrate or a sample container [8,25,36,49,50,51,55]. The technology is advantageous in aerosol characterization in the following aspects:
It reveals a particle’s chemical composition and molecular structure based on spectral features. Single-particle Raman spectroscopy can reveal both the average information of bulk materials and specific information of individual particles.
  • It helps minimize particle surface contamination, modification, and interaction with its surroundings.
  • It helps mitigate background fluorescence interference via photo-bleaching and the WGM resonance effect [50].
  • Measured data reveal temporal information about a particle in a simulated atmospheric state while the particle is being measured.
  • It has high temporal and spatial resolutions (µs, and 300 nm × 300 nm), which facilitate the study of surface properties of a particle and its time-evolution.
  • Integrated with an imaging system, it can concurrently monitor changes in physical and chemical properties of single particles in near-real time.
  • It requires minimal volume of samples, essentially a single particle, which is critically important in detecting or sensing airborne particles in low concentration, e.g., life-threatening viruses and aerosolized BWA particles spread in air.
However, in terms of identification and detection of airborne particles using the OT-RS technique, there are several challenges to be met and further developments are expected in future research:
  • A large, comprehensive database of Raman spectral features is needed. Although Raman spectra of most small molecules or chemical function groups have been established to date, the spectral data have been obtained predominantly using bulk samples and such samples are placed on a substrate. As a result, the specificity of Raman spectral features (relative peak intensity patterns, band structures, spectral overlap, etc.) for individual airborne particles is low and the fluorescence interference may hinder Raman-band assignments. For example, the formation and loss single airborne aerosol particles, which cannot be found by the averaged information from the Raman spectra from bulk measurements, can be characterized by the single-particle Raman spectra via observation of specific or signature Raman band(s) or the relative peak intensity patterns of the particle in each growth/loss phase [43]. On the other hand, in the atmosphere, the surface of each aerosol particle is chemically heterogeneous. Chemical reagents resulting from air pollution process (e.g., contamination) and the solar/UV radiation (e.g., photolytic reactions) can aggressively change the properties of the particle’s surface [51]. These changes cannot be characterized using measurements from bulk materials because the changes can be highly time and particle dependent and can be easily overwhelmed by the averaged Raman signal from the bulk materials. Finally, for some bioaerosol particles that usually contain some fluorescent compounds, the OT-RS technique can effectively mitigate the background fluorescence interference via the efficient photobleaching effect from the optical trap [50]. This point fundamentally differentiates the OT-RS from the bulk-sample RS. Therefore, the existing Raman spectra database cannot replace the single-particle Raman spectral database. Although the collection of single, airborne particle spectral features is not included in this work, only a limited number of particle types have been studied to date. Further collective efforts are needed to expand this data to include the vast number of aerosol types in existence.
  • Given a sufficient database of single-particle Raman spectral features available for single-particle identification, it is necessary to develop data-processing algorithms to link measured spectral patterns to specific airborne particle or its chemical composition. Such studies are rare.
  • Current studies of single particles using OT-RS are lab-based. In real-world applications, the characterization of single particles will rely on deployable, rugged, easy-to-use instruments. Development of such instrumentation is only beginning and must address several individual challenges such as automated, single-particle sample introduction, trapping efficiency and rigidness in the presence of field perturbations (airflow, vibration, etc.), as well as cost-effectiveness. Experience and knowledge derived from existing aerosol instrumentation can be helpful, yet new instrumentation schemes and innovative designs are expected in future studies.
  • Like the evolution of many other technology developments, we should keep our minds open. This includes integrating OT-RS with other advanced optical and spectroscopic techniques (e.g., CRDS, LIF, ELS), as well as new data-processing algorithms (e.g., machine learning) to enhance detection specificity.

5. Summary

Raman spectroscopy is based on chemical identification and detection at the molecular level. Recent developments in single, airborne particle handling using optical trapping and manipulations allow for the integration of optical trapping with Raman spectroscopy, and the OT-RS technique has demonstrated great promise in single-particle characterization, identification, and detection of atmospheric aerosols. To this end, one of our knowledge gaps is that we lack a single-particle Raman spectral database, namely, Raman spectra measured from single particles freely suspended in air or under controlled environments. As recent developments of the OT-RS technology advance rapidly, expanded applications of OT-RS in lab-studies and OT-RS-based instrumentation for future field work are highly conceivable. Therefore, there is a need to build a reference for single-particle, Raman spectra. In this work, we presented a new collection of Raman spectra of single-particles from eight different chemical groups (amino acid and B- vitamin, BWA, pollens, fungi, spores, extraterrestrial dust, and terrestrial dust) using OT-RS. This work represents a first step toward establishing a spectral database for single, airborne particles, as a starting point, a complete data bank requires the collection of OT-RS from continued additions of more single, airborne particles of any kind [76]. Parallel to ongoing engineering efforts in OT-RS instrumentation, this open-end database may serve as a valued reference for future identification and detection of single airborne particles using the OT-RS technique. In this work, advantages of OT-RS in single-particle studies and challenges in identification and detection using OT-RS in future studies were also discussed.

Author Contributions

Conceptualization and methodology, C.W. and Y.-L.P.; investigation and data curation, H.A., Y.A., C.W., Y.-L.P. and G.V.; formal analysis, H.A. and Y.A.; writing—original draft preparation, H.A. and Y.A.; writing—review and editing, C.W., Y.-L.P. and G.V.; funding acquisition, C.W. All authors have read and agreed to the published version of the manuscript.

Funding

The research reported here was funded in whole or in part by the Army Research Office via grant # W911NF-21-1-0171 to Mississippi State University. Any errors and opinions are not those of the Army Research Office or Department of Defense and are attributable solely to the authors.

Institutional Review Board Statement

Not applicable.

Informed Consent Statement

Not applicable.

Data Availability Statement

Not applicable.

Conflicts of Interest

The authors declare no conflict of interest.

References

  1. Pan, Y.L.; Kalume, A.; Wang, C.; Santarpia, J. Atmospheric aging processes of bioaerosols under laboratory-controlled conditions: A review. J. Aerosol Sci. 2021, 155, 105767. [Google Scholar] [CrossRef]
  2. Després, V.; Huffman, J.A.; Burrows, S.M.; Hoose, C.; Safatov, A.; Buryak, G.; Fröhlich-Nowoisky, J.; Elbert, W.; Andreae, M.; Pöschl, U.; et al. Primary biological aerosol particles in the atmosphere: A review. Tellus B Chem. Phys. Meteorol. 2012, 64, 15598. [Google Scholar] [CrossRef]
  3. Félix-Rivera, H.; Hernández-Rivera, S.P. Raman spectroscopy techniques for the detection of biological samples in suspensions and as aerosol particles: A review. Sens. Imaging 2012, 13, 1–25. [Google Scholar] [CrossRef]
  4. Mbareche, H.; Morawska, L.; Duchaine, C. On the interpretation of bioaerosol exposure measurements and impacts on health. J. Air Waste Manag. Assoc. 2019, 69, 789–804. [Google Scholar] [CrossRef]
  5. Suchorab, Z.; Frąc, Ł.M.; Guz, K.; Oszust, G.; Łagod, A.; Gryta, N.; Wielgus, B.; Czerwiński, J. A method for early detection and identification of fungal contamination of building materials using e-nose. PLoS ONE 2019, 14, e0215179. [Google Scholar] [CrossRef]
  6. Yoo, K.; Lee, T.K.; Choi, E.J.; Yang, J.; Shukla, S.K.; Hwang, S.; Park, J. Molecular approaches for the detection and monitoring of microbial communities in bioaerosols: A review. J. Environ. Sci. 2017, 51, 234–247. [Google Scholar] [CrossRef]
  7. Grewling, L.; Frątczak, A.; Kostecki, Ł.; Nowak, M.; Szymańska, A.; Bogawski, P. Biological and chemical air pollutants in an urban area of central Europe: Co-exposure assessment. Aerosol Air Qual. Res. 2019, 19, 1526–1537. [Google Scholar] [CrossRef]
  8. Ai, Y.; Alali, H.; Pan, Y.L.; Videen, G.; Wang, C. Single-particle optical-trapping Raman spectroscopy for the detection and identification of aerosolized airborne biological particles. Meas. Sci. Technol. 2021, 32, 055207. [Google Scholar] [CrossRef]
  9. Huffman, J.A.; Perring, A.E.; Savage, N.J.; Clot, B.; Crouzy, B.; Tummon, F.; Shoshanim, O.; Damit, B.; Schneider, J.; Sivaprakasam, V.; et al. Real-time sensing of bioaerosols: Review and current perspectives. Aerosol Sci. Technol. 2020, 54, 465–495. [Google Scholar] [CrossRef]
  10. Ault, A.P.; Axson, J.L. Atmospheric aerosol chemistry: Spectroscopic and microscopic advances. Anal. Chem. 2017, 89, 430–452. [Google Scholar] [CrossRef]
  11. Ziemann, P.J.; Atkinson, R. Kinetics, products, and mechanisms of secondary organic aerosol formation. Chem. Soc. Rev. 2012, 41, 6582–6605. [Google Scholar] [CrossRef] [PubMed]
  12. Pietrodangelo, A.; Pareti, S.; Perrino, C. Improved identification of transition metals in airborne aerosols by SEM-EDX combined backscattered and secondary electron microanalysis. Environ. Sci. Pollut. Res. 2014, 21, 4023–4031. [Google Scholar] [CrossRef] [PubMed]
  13. Wentzel, M.; Gorzawski, H.; Naumann, K.H.; Saathoff, H.; Weinbruch, S. Transmission electron microscopical and aerosol dynamical characterization of soot aerosols. J. Aerosol Sci. 2003, 34, 1347–1370. [Google Scholar] [CrossRef]
  14. Lebedev, A.T. Mass spectrometry in identification of ecotoxicants including chemical and biological warfare agents. Toxicol. Appl. Pharm. 2005, 207, 451–458. [Google Scholar] [CrossRef]
  15. Brostrøm, A.; Kling, K.I.; Hougaard, K.S.; Mølhave, K. Complex aerosol characterization by scanning electron microscopy coupled with energy dispersive X-ray spectroscopy. Sci. Rep. 2020, 10, 9150. [Google Scholar] [CrossRef]
  16. Guicheteau, J.; Christesen, S.; Emge, D.; Tripathi, A. Bacterial mixture identification using Raman and surface-enhanced Raman chemical imaging. J. Raman Spectrosc. 2010, 41, 1632–1637. [Google Scholar] [CrossRef]
  17. Sivaprakasam, V.; Hart, M.B. Surface-enhanced Raman spectroscopy for environmental monitoring of aerosols. ACS Omega 2021, 6, 10150–10159. [Google Scholar] [CrossRef]
  18. Gabbarini, V.; Rossi, R.; Ciparisse, J.F.; Malizia, A.; Divizia, A.; Filippis, P.D.; Anselmi, M.; Carestia, M.; Palombi, L.; Divizia, M.; et al. Laser-induced fluorescence (LIF) as a smart method for fast environmental virological analyses: Validation on Picornaviruses. Sci. Rep. 2019, 9, 12598. [Google Scholar] [CrossRef]
  19. Gery, A.; Delanoe, A.; Heutte, N.; Chosson, E.; Bonhomme, J.; Garon, D. A novel qPCR based-method for detection and quantification of three recurrent species of Penicillium isolated from bioaerosols in mold-damaged homes. J. Microbiol. Methods 2021, 186, 106236. [Google Scholar] [CrossRef]
  20. Santarpia, J.L.; Shumate, S.R.; Haddrell, A. Laboratory study of bioaerosols: Traditional test systems, modern approaches, and environmental control. Aerosol Sci. Technol. 2020, 54, 585–600. [Google Scholar] [CrossRef] [Green Version]
  21. Kinahan, S.M.; Tezak, M.S.; Siegrist, C.M.; Lucero, G.; Servantes, B.L.; Santarpia, J.L.; Kalume, A.; Zhang, J.; Felton, M.; Williamson, C.C.; et al. Changes of fluorescence spectra and viability from aging aerosolized E. coli cells under various laboratory-controlled conditions in an advanced rotating drum. Aerosol Sci. Technol. 2019, 53, 1261–1276. [Google Scholar] [CrossRef]
  22. Ding, J.; Dai, Q.; Zhang, Y.; Xu, J.; Huangfu, Y.; Feng, Y. Air humidity affects secondary aerosol formation in different pathways. Sci. Total Environ. 2021, 759, 143540. [Google Scholar] [CrossRef] [PubMed]
  23. Bzdek, B.R.; Reid, J.P.; Cotterell, M.I. Open questions on the physical properties of aerosols. Commun. Chem. 2020, 3, 105. [Google Scholar] [CrossRef]
  24. Estillore, A.D.; Trueblood, J.V.; Grassian, V.H. Atmospheric chemistry of bioaerosols: Heterogeneous and multiphase reactions with atmospheric oxidants and other trace gases. Chem. Sci. 2016, 7, 6604–6616. [Google Scholar] [CrossRef]
  25. Gong, Z.; Pan, Y.L.; Videen, G.; Wang, C. Chemical reactions of single optically trapped bioaerosols in a controlled environment. Aerosol Sci. Technol. 2019, 53, 853–859. [Google Scholar] [CrossRef]
  26. Krieger, U.K.; Marcolli, C.; Reid, J.P. Exploring the complexity of aerosol particle properties and processes using single particle techniques. Chem. Soc. Rev. 2012, 41, 6631–6662. [Google Scholar] [CrossRef]
  27. Li, W.; Shao, L.; Zhang, D.; Ro, C.U.; Hu, M.; Bi, X.; Geng, H.; Matsuki, A.; Niu, H.; Chen, J. A review of single aerosol particle studies in the atmosphere of East Asia: Morphology, mixing state, source, and heterogeneous reactions. J. Clean. Prod. 2016, 112, 1330–1349. [Google Scholar] [CrossRef]
  28. Buajarern, J.; Mitchem, L.; Reid, J.P. Characterizing multiphase organic/inorganic/aqueous aerosol droplets. J. Phys. Chem. A 2007, 111, 9054–9061. [Google Scholar] [CrossRef]
  29. Reid, J.P. Particle levitation and laboratory scattering. J. Quant. Spectrosc. Radiat. Transf. 2009, 110, 1293–1306. [Google Scholar] [CrossRef]
  30. Jauffred, L.; Taheri, S.M.R.; Schmitt, R.; Linke, H.; Oddershede, L.B. Optical trapping of gold nanoparticles in air. Nano. Lett. 2015, 15, 4713–4719. [Google Scholar] [CrossRef] [Green Version]
  31. Bowman, R.W.; Padgett, M.J. Optical trapping and binding. Rep. Prog. Phys. 2013, 76, 026401. [Google Scholar] [CrossRef] [PubMed]
  32. Gong, Z.; Pan, Y.L.; Wang, C. Characterization of single airborne particle extinction using the tunable optical trap-cavity ringdown spectroscopy (OT-CRDS) in the UV. Opt. Express 2017, 25, 6732–6745. [Google Scholar] [CrossRef] [PubMed]
  33. Arnold, J.A.; Kalume, A.; Yu, H.; Wirth, C.L.; Videen, G.; Pan, Y.L. Measurements of elastic light-scattering patterns and images of single, oriented, optically trapped particles. J. Quant. Spectrosc. Radiat. Transf. 2022, 287, 108223. [Google Scholar] [CrossRef]
  34. Xie, C.; Goodman, C.; Dinno, M.A.; Li, Y.-Q. Real-time Raman spectroscopy of optically trapped living cells and organelles. Opt. Express 2004, 12, 6207–6214. [Google Scholar] [CrossRef] [PubMed]
  35. Kalume, A.; Wang, C.; Santarpia, J.; Pan, Y.L. Liquid-liquid phase separation and evaporation of a laser-trapped organic-organic airborne droplet using temporal spatial-resolved Raman spectroscopy. Phys. Chem. Chem. Phys. 2018, 20, 19151. [Google Scholar] [CrossRef]
  36. Gong, Z.; Pan, Y.L.; Videen, G.; Wang, C. Optical trapping-Raman spectroscopy (OT-RS) with embedded microscopy imaging for concurrent characterization and monitoring of physical and chemical properties of single particles. Anal. Chim. Acta 2018, 10120, 86–94. [Google Scholar] [CrossRef]
  37. Ashkin, A. Acceleration and trapping of particles by radiation pressure. Phys. Rev. Lett. 1970, 24, 156–159. [Google Scholar] [CrossRef]
  38. Daly, M.; Sergides, M.; Chormaic, S. Optical trapping and manipulation of micrometer and submicrometer particles. Laser Photonics Rev. 2015, 9, 3309–3329. [Google Scholar] [CrossRef]
  39. Gong, Z.; Pan, Y.L.; Videen, G.; Wang, C. Optical trapping and manipulation of single particles in air: Principles, technical details, and applications. J. Quant. Spectrosc. Radiat. Transf. 2018, 214, 94–119. [Google Scholar] [CrossRef]
  40. Kalume, A.; Wang, C.; Pan, Y.L. Optical-trapping laser techniques for characterizing airborne aerosol particles and its application in chemical aerosol study. Micromachines 2021, 12, 466. [Google Scholar] [CrossRef]
  41. Corsetti, S.; Dholakia, K. Optical manipulation: Advances for biophotonics in the 21st century. J. Biomed. Opt. 2021, 26, 070602. [Google Scholar] [CrossRef] [PubMed]
  42. Redding, B.; Pan, Y.L. Optical trap for both transparent and absorbing particles in air using a single shaped laser beam. Opt. Lett. 2015, 40, 2798–2801. [Google Scholar] [CrossRef]
  43. Gallimore, P.J.; Davidson, N.M.; Kalberer, M.; Pope, F.D.; Ward, A.D. 1064 nm dispersive Raman microspectroscopy and optical trapping of pharmaceutical aerosols. Anal. Chem. 2018, 90, 8838–8844. [Google Scholar] [CrossRef] [PubMed]
  44. Wei, D.; Chen, S.; Liu, Q. Review of fluorescence suppression techniques in Raman spectroscopy. Appl. Spectrosc. Rev. 2015, 50, 387–406. [Google Scholar] [CrossRef]
  45. Thurn, R.; Kiefer, W. Raman-microsampling technique applying optical levitation by radiation pressure. Appl. Spectrosc. 1984, 38, 78–83. [Google Scholar] [CrossRef]
  46. Hopkins, R.J.; Mitchem, L.; Ward, A.D.; Reid, J.P. Control and characterisation of a single aerosol droplet in a single-beam gradient-force optical trap. Phys. Chem. Chem. Phys. 2004, 6, 4924–4927. [Google Scholar] [CrossRef]
  47. Pan, Y.L.; Hill, S.C.; Coleman, M. photophoretic trapping of absorbing particles in air and measurement of their single-particle Raman spectra. Opt. Express 2012, 20, 5325–5334. [Google Scholar] [CrossRef]
  48. Ling, L.; Li, Y.-Q. Measurement of Raman spectra of single airborne absorbing particles trapped by a single laser beam. Opt. Lett. 2013, 38, 416–418. [Google Scholar] [CrossRef]
  49. Wang, C.; Pan, Y.L.; Hill, S.C.; Redding, B. Photophoretic trapping-Raman spectroscopy for single pollens and fungal spores trapped in air. J. Quant. Spectrosc. Radiat. Transf. 2015, 153, 4–12. [Google Scholar] [CrossRef]
  50. Gong, Z.; Pan, Y.L.; Videen, G.; Wang, C. The temporal evolution process of fluorescence bleaching and Raman spectra from single solid particles optically trapped in air. Chem. Phys. Lett. 2017, 689, 100–104. [Google Scholar] [CrossRef]
  51. Ai, Y.; Wang, C.; Pan, Y.L.; Videen, G. Characterization of single fungal aerosol particles in a reactive atmospheric environment using time-resolved optical trapping-Raman spectroscopy (OT-RS). Environ. Sci. Atmos. 2022, 2, 591–600. [Google Scholar] [CrossRef]
  52. Redding, B.; Schwab, M.J.; Pan, Y.L. Raman spectroscopy of optically trapped single biological micro-particles. Sensors 2015, 15, 19021–19046. [Google Scholar] [CrossRef] [PubMed]
  53. Wang, C.; Pan, Y.L.; Videen, G. Optical trapping and laser-spectroscopy measurements of single particles in air: A review. Meas. Sci. Technol. 2021, 32, 102005. [Google Scholar] [CrossRef]
  54. Liang, Z.; Chu, Y.; Gen, M.; Chan, C.K. Single-particle Raman spectroscopy for studying physical and chemical processes of atmospheric particles. Atmos. Chem. Phys. 2022, 22, 3017–3044. [Google Scholar] [CrossRef]
  55. Alali, H.; Gong, Z.; Videen, G.; Pan, Y.L.; Muñoz, O.; Wang, C. Laser spectroscopic characterization of single extraterrestrial dust particles using optical trapping-cavity ringdown and Raman spectroscopy. J. Quant. Spectrosc. Radiat. Transf. 2020, 255, 107249. [Google Scholar] [CrossRef]
  56. Gong, Z.; Pan, Y.L.; Wang, C. Optical configurations for photophoretic trap of single particles in air. Rev. Sci. Instrum. 2016, 87, 103104. [Google Scholar] [CrossRef]
  57. Kalume, A.; Zhu, E.; Wang, C.; Santarpia, J.; Pan, Y.L. Position-resolved Raman spectra from a laser-trapped single airborne chemical droplet. Opt. Lett. 2017, 42, 5113–5116. [Google Scholar] [CrossRef]
  58. Parameswari, A.; Premkumar, S.; Premkumar, R.; Milton Franklin Benial, A. Surface enhanced Raman spectroscopy and quantum chemical studies on glycine single crystal. J. Mol. Struct. 2016, 1116, 180–187. [Google Scholar] [CrossRef]
  59. Tortonda, F.R.; Pascual-Ahuir, J.L.; Silla, E.; Tuñón, I.; Ramírez, F.J. Aminoacid zwitterions in solution: Geometric, energetic, and vibrational analysis using density functional theory-continuum model calculations. J. Chem. Phys. 1998, 109, 592–603. [Google Scholar] [CrossRef]
  60. Stewart, S.; Fredericks, P.M. Surface-enhanced Raman spectroscopy of amino acids adsorbed on an electrochemically prepared silver surface. Spectrochim. Acta A Mol. Biomol. Spectrosc. 1998, 55, 1641–1660. [Google Scholar] [CrossRef]
  61. Podstawka, E.; Ozaki, Y.; Proniewicz, L.M. Part II: Surface-enhanced Raman spectroscopy investigation of methionine containing heterodipeptides adsorbed on colloidal silver. Appl. Spectrosc. 2004, 58, 581–590. [Google Scholar] [CrossRef] [PubMed]
  62. Chakraborty, D.; Manogaran, S. Vibrational analysis of glycine zwitterion—An ab initio study. Chem. Phys. Lett. 1998, 294, 56–64. [Google Scholar] [CrossRef]
  63. Guicheteau, J.; Argue, L.; Hyre, A.; Jacobson, M.; Christesen, S.D. Raman and surface-enhanced Raman spectroscopy of amino acids and nucleotide bases for target bacterial vibrational mode identification. Chem. Bio. Sens. VII 2006, 6218, 174–184. [Google Scholar]
  64. Culka, A.; Jehlička, J.; Edwards, H.G.M. Acquisition of Raman spectra of amino acids using portable instruments: Outdoor measurements and comparison. Spectrochim. Acta A Mol. Biomol. Spectrosc. 2010, 77, 978–983. [Google Scholar] [CrossRef]
  65. Freire, P.T.C.; Barboza, F.M.; Lima, J.A.; Melo, F.E.A.; Filho, J.M. Raman spectroscopy of amino acid crystals. In Raman Spectroscopy and Applications; Khan, M., Ed.; Intech Open: London, UK, 2017; pp. 201–223. ISBN 978-953-51-2908-0. [Google Scholar]
  66. Zhu, G.; Zhu, X.; Fan, Q.; Wan, X. Raman spectra of amino acids and their aqueous solutions. Spectrochim. Acta A Mol. Biomol. Spectrosc. 2011, 78, 1187–1195. [Google Scholar] [CrossRef]
  67. Pawlukoj, A.; Leciejewicz, J.; Tomkinson, J.; Parker, S.F. Neutron Scattering, infra red, Raman spectroscopy and ab initio study of L-threonine. Spectrochim. Acta A Mol. Biomol. Spectrosc. 2001, 57, 2513–2523. [Google Scholar] [CrossRef]
  68. Liu, Y.-K.; Kuo, H.-C.; Lai, C.-H.; Chou, C.-C. Single amino acid utilization for bacterial categorization. Sci. Rep. 2020, 10, 12686. [Google Scholar] [CrossRef] [PubMed]
  69. Srivastava, M.; Singh, N.P.; Yadav, R.A. Experimental Raman and IR spectral and theoretical studies of vibrational spectrum and molecular structure of pantothenic acid (vitamin B5). Spectrochim. Acta A Mol. Biomol. Spectrosc. 2014, 129, 131–142. [Google Scholar] [CrossRef]
  70. Srivastava, M.; Singh, P.; Yadav, A.; Yadav, R.A. Experimental and quantum chemical investigation of vibrational and molecular structural experimental and quantum chemical investigations on vibrational and molecular structural characteristics of vitamin B7: Biotin Molecule. Asian J. Phys. 2015, 24, 635–656. [Google Scholar]
  71. Kim, N.H.; Lee, S.J.; Kim, K. Isocyanide and biotin-derivatized ag nanoparticles: An efficient molecular sensing mediator via surface-enhanced Raman spectroscopy. Chem. Commun. 2003, 3, 724–725. [Google Scholar] [CrossRef]
  72. Andruniow, T.; Zgierski, M.Z.; Kozlowski, P.M. Vibrational analysis of methylcobalamin. J. Phys. Chem. A 2002, 106, 1365–1373. [Google Scholar] [CrossRef]
  73. Zhang, Z.; Wang, B.; Yin, Y.; Mo, Y. Surface-enhanced Raman spectroscopy of vitamin B12 on silver particles in colloid and in atmosphere. J. Mol. Struct. 2009, 927, 88–90. [Google Scholar] [CrossRef]
  74. Ibáñez, D.; Pérez-Junquera, A.; González-García, M.B.; Hernández-Santos, D.; Fanjul-Bolado, P. Spectroelectrochemical elucidation of B vitamins present in multivitamin complexes by EC-SERS. Talanta 2020, 206, 120190. [Google Scholar] [CrossRef]
  75. Piedra, P.; Kalume, A.; Zubko, E.; Mackowski, D.; Pan, Y.L.; Videen, G. Particle-shape classification using light scattering: An exercise in deep learning. J. Quant. Spectrosc. Radiat. Transf. 2019, 231, 140–156. [Google Scholar] [CrossRef]
  76. A website for “An open database for molecular fingerprints of single aerosol particles in air using optical trapping—Raman spectroscopy” is being constructed and will be open to public. 2022; in press.
Figure 1. (a) The experimental setup of the OT-RS system; (b) the schematic shows a particle trapped in UOT.
Molecules 27 05966 g001
Figure 2. (a) Raman spectra of oxygen and nitrogen in ambient lab air, (Reproduced with permission from [8]. Copyright 2021, IOP science). (b) Raman spectra of single, trapped SM, (c) Raman spectra of single, trapped SWCNT and MWCNT. (Reproduced with permission from ref. [36]. Copyright 2018, Elsevier).
Molecules 27 05966 g002
Figure 3. Typical Raman spectra of three types of single amino-acid particles measured by the OT-RS: (a) glycine, (b) L-glutamic, and (c) L-threonine.
Molecules 27 05966 g003
Figure 4. Raman spectra of three types of single, trapped B-vitamins (a) B5, (b) B7, and (c) B12.
Molecules 27 05966 g004
Figure 5. (a) Raman spectra of single, trapped spores. (Reproduced with permission from ref. [49]. Copyright 2015, Elsevier). (b) Raman spectra of trapped RhB-PEMS. (Reproduced with permission from ref. [50]. Copyright 2017, Elsevier). (c) Raman spectra of various types of single, trapped pollen and spore. (Reproduced with permission from ref. [36]. Copyright 2018, Elsevier).
Molecules 27 05966 g005
Figure 6. Raman spectra of BWA surrogates. (Reproduced with permission from ref. [8]. Copyright 2021, IOP science).
Molecules 27 05966 g006
Figure 7. Raman spectra of various types of single, trapped fungi. (Reproduced with permission from ref. [51]. Copyright 2022, the Royal Society of Chemistry).
Molecules 27 05966 g007
Figure 8. Raman spectra of a single, trapped (A) carbon sphere, (B) volcanic ash, (C) Mars analog, and (D) lunar-regolith simulant. (Reproduced with permission from [55]. Copyright 2020, Elsevier).
Molecules 27 05966 g008
Table 1. A list of the samples along with their suppliers and brief descriptions.
Sample ClassName (a)SupplierDescriptions (Size, Shape, Color, etc.)Trapping Efficiency (b)StabilityRef.
Standard
samples
SWCNTUS nano-Materials (Houston, TX, USA)Cylinderical shape, blackHH[36]
MWCNT HH
SMWhite House Scientific (Chester, PB, USA)2 µm, silica shpere, whiteLH
Amino AcidGlycine
L-glutamic
L-threonine
Sigma-Aldrich (St. Louis, MO, USA)Submicron to several microns,HH
irregular shape, white to off-whiteMH
HH
VitaminB5Sigma-AldrichSubmicron to several microns, irregular shape, white to off-white, except for B12 is glitter dark redLM
B7LM
B12MH
BWAYREdgewood Chemical Biological center (Seattle, WA, USA)~10 µm, irregular shape, light browMM[8]
MS2MM
BS MM
BGHM
PollensryeGreer lab (Lenoir, NC, USA)~35 μm, irregular shape, light brownMM[36,49]
ragweed ~24 μm, irregular shape, yellowLM
mulberry ~14 μm, irregular shape, light brownLM
oak ~34 μm, irregular shape, yellowMM
sporesJGGreer lab~8 μm, irregular shape, dark brownLL[36,49]
BGS5.6–8.2 μm, irregular shape, dark blackML
FungiAFGreer labActual size is in millimeters, the MM[51]
AV samples were further groundML
CH to submicron to tens ofMM
PV microns for experimentalMM
PCa purpose. Irregular shape,MM
PCh black and dark grayLL
PD LL
Extraterrestrial dustLAJohnson sapce center (Houston, TX, USA)~4 µm, irregular shape with clear edgeLM[55]
MAIrregular shape, moreLM
stickie, brown
Terrestrial dust VAvolcanic eruptionIrregular shape, dark grayMH[55]
CSSigma-Aldrich2–4 μm, spherical, blackHH
Fluorescent particleRhB-PEMSCospheric (Santa Barbara, CA, USA)10–30 μm, sphere
RhB% = ~1%
HH[50]
(a) Abbreviations of the names used. (b) The trapping efficiency in terms of H (high), M (moderate), and L (low).
Table 2. A collection of Raman spectral fingerprints from single particles optically trapped in air.
ClassNameRS Bands (cm−1)AssignmentsRef.
Amino AcidGlycine369CH2 torsional mode[58]
513COO coupled with C-N deformation mode[58,59,60]
616COO wagging[58]
709COO coupled with C-C stretching[58]
905CH2 rocking coupled with COO deformation[58]
1048C-NH2 stretching coupled with CH2 twisting[58,61]
1122NH3+ rocking coupled with CH2 twisting[58,61]
1338CH2 wagging vibration[58]
1416CH2 scissoring coupled with COO symmetric stretching vibration[58]
1452CH2 scissoring coupled with COO asymmetric stretching vibration[58]
1580NH3+ symmetric deformation mode[58,62]
1677 NH3+ asymmetric deformation mode [58]
2331N2[8]
2976CH2 symmetric starching vibration[58]
3013CH2 symmetric starching vibration[58]
3162NH3+ asymmetric stretching vibration[58]
L-glutamic1064C-C stretching vibration[63]
1122Deformation of NH3+[60]
1301CH2 wagging band [63]
1443COO symmetric stretching vibration [64]
2848CH2 stretching [65]
2880CH2 stretching [65]
L-threonine876CCN stretching [66]
1076OH deformation motion [66]
1299CH2 wagging vibration [67]
1443COO symmetric [60,67]
2878CH2 stretching [67]
VitaminB5658C=C=C angle deformation mode[69]
842C=C stretching[69]
933CH2 rocking[69]
1041C-O(H) stretching[69]
1139C-O(H) stretching[69]
1306CH deformation[69]
1477CH3 antisymmetric deformation[69]
1628C=O stretching[69]
3000CH stretching[69]
B71071Ureido ring[70]
1318CH deformation[70]
1458CH2 deformation[70]
1654C=O stretching vibration[70]
2892CH stretching vibration[71]
B12733CH3 rocking vibration[72]
1149Corrin ring vibration[73,74]
1359Corrin ring vibration[73,74]
1459Corrin ring vibration[73,74]
1574Corrin ring vibration[73,74]
BWA surrogatesYR732C-C adenosine ring stretching[8]
MS2840Tyrosine[8]
BS955C-C backbone stretching, protein[8]
BG1032Phenylalanine [8]
1080C-C stretching, C-O-C glycosidic link[8]
1136C-N or C-C stretching[8]
1187Cytosine, nucleotides: base ν(CN), guanine[8]
1350Amide III[8]
1451Lipids, protein, or the C-H2 deformation[8]
1618Amide I[8]
2720CH stretching[8]
3100CH stretching[8]
Pollens and sporesrye771ν(O-P-O) diester, phosphatidylinositol[36,49]
regweed892C-C skeletal stretching, C-O-C backbone[36,49]
mulberry1065C-C or C-N stretching[36,49]
oak1080C-C skeletal stretching mode, C-O-C glycosidic link[36,49]
JG1136C-C or C-N starching[36,49]
BGS1177Cytosine, nucleotides: base ν(CN), guanine [36,49]
1265Proteins, Amide III[36,49]
1298CH2 twisting, fatty acid, lipids[36,49]
1420–1480Lipids, protein, CH2 deformation [36,49]
1660Amide I, lipids, v(C=C)[36,49]
1713C=O[36,49]
1750Lipids, C=O[36,49]
2720–3000CH stretching, sporopollenin[36,49]
Fungal aerosolsAF840Tyrosine[51]
AV892C-O-C backbone, C-C skeletal stretches[51]
CH1032Phenylalanine[51]
PV1080C-O-C glycosidic link, C–C skeletal stretches [51]
PCa1131Palmitic acid[51]
PCh1267Triacylglycerol, CH (lipid in normal tissue)[51]
PD1298CH2 deformation[51]
1450Lipid/protein, CH deformation[51]
1610Cytosine[51]
1660Amide I[51]
1750Lipids, C=O[51]
2739Stretching vibrations of CH[51]
2855CH2 symmetric stretch of lipids[51]
2878CH2 symmetric stretch of lipids[51]
2915CH2 stretch lipids and proteins[51]
2960Out-of-plane chain end antisymmetric CH3 stretch band[51]
3008νas(=CH), lipids, fatty acids[51]
3059(C=CH) aromatic stretching[51]
Extraterrestrial dustLA500Symmetric T-O-T stretching mode (T = Al or Si)[55]
MA371Mg-O stretch[55]
503O-Si-O band[55]
627Si-O stretching vibrations [55]
1078Band of the Co 3 2 ion[55]
1565G-band of graphite [55]
3382O-H[55]
3614O-H[55]
Terrestrial dustVA361Ca-O stretching vibration[55]
468Quartz SiO2[55]
665Si-O-Si symmetric band[55]
1006Sulfates SO 4 2 [55]
CS1367D-band of graphite[55]
1585G-band of graphite[55]
2700G’-band[55]
29002LO-band[55]
SWCNT490Breathing modes of 4- and membered rings[36]
MWCNT604Breathing modes of 4- and membered rings[36]
800Optical mode of the SiO2 network[36]
979Vibration of (OH)-Si[36]
1349D-band[36]
1518G-band[36]
2684G’-band[36]
RhB-PEMS1080C-C stretching band[50]
1305CH2 twisting[50]
1450CH2 bending[50]
2800–3000CH stretching vibrational modes[50]
Publisher’s Note: MDPI stays neutral with regard to jurisdictional claims in published maps and institutional affiliations.

