Article

Changes in Dry Matter and Carbon, Nitrogen, and Sulfur Stocks after Applications of Increasing Doses of Pig Slurry to Soils with Tifton-85 for Six Years in Southern Brazil

by
Cristiano Santos
1,
Arcângelo Loss
1,*,
Marisa de Cássia Piccolo
2,
Eduardo Girotto
3,
Marcos Paulo Ludwig
4,
Julia Decarli
4,
José Luiz Rodrigues Torres
5,
Cledimar Rogério Lourenzi
1 and
Gustavo Brunetto
6
1
Center of Agricultural Sciences, Federal University of Santa Catarina, Itacorubi, Florianópolis, SC 88034-000, Brazil
2
Center of Nuclear Energy in Agriculture, University of São Paulo, Piracicaba, SP 13416-970, Brazil
3
Federal Institute of Education, Science and Technology of Rio Grande do Sul, Campus Bento Gonçalves, Bento Gonçalves, RS 95700-206, Brazil
4
Federal Institute of Education, Science and Technology of Rio Grande do Sul, Campus Ibirubá, Ibirubá, RS 98200-000, Brazil
5
Federal Institute of Triângulo Mineiro, Uberaba, MG 38064-790, Brazil
6
Center of Rural Sciences, Federal University of Santa Maria, Camobi, Santa Maria, RS 97105-900, Brazil
*
Author to whom correspondence should be addressed.
Agronomy 2022, 12(9), 2058; https://doi.org/10.3390/agronomy12092058
Submission received: 9 August 2022 / Revised: 22 August 2022 / Accepted: 26 August 2022 / Published: 29 August 2022

Abstract

:
Pig slurry (PS) has been used as soil fertilizer due to its nutrient and organic matter contents, which may improve soil nitrogen, carbon, and sulfur stocks. The objective of this work was to evaluate the best PS dose that favors the increase in dry matter production and carbon (C), nitrogen (N), and sulfur (S) contents and stocks after applications of PS to soils with Tifton-85 for six years. The experiment was conducted in a randomized block design with four replications, in a hay-producing area under a clayey Typic Hapludox in southern Brazil. The treatments consisted of annual applications of organic and mineral fertilizers at rates based on their N contents, using PS (100, 200, 300, and 400 kg ha−1) and urea (200 kg ha−1), and a control without N application. Samples of the soil in 0–5, 5–10, and 10–30 cm layers were collected in March 2019 and evaluated for soil bulk density and N, C, and S contents and stocks. The Tifton-85 dry matter production was evaluated using samples from three cuts carried out between 2012/2013 and 2017/2018 agricultural years. The applications of increasing doses of PS in Tifton-85 pastures over six years increase linearly the dry matter and soil organic C, N, and S stocks in the 0–30 cm layer. The PS rate equivalent to 100 or 200 kg ha−1 of N is recommended for increasing soil C, N, and S stocks, since it resulted in C, N, and S stocks equal to or higher than the control and mineral (urea) treatments.

1. Introduction

Organic fertilizers have been used to improve soil physical and chemical attributes, important indicators of soil quality and sustainability, and the yield in agricultural systems, including pastures. Pastures for animal grazing in Brazil cover large areas, reaching 162 million hectares in 2019, with a mean of 1.32 animals per hectare [1]. Brazil has more than 210 million bovine and 40 million swine animals [2,3], due to increases in technology and yields of intensive animal productions. However, these animals generated high quantities of wastes, which need to be properly disposed of or reused. Pig production in Brazil is concentrated in the South region of the country [2], where the total quantity of pig waste reaches more than 63 Gg day−1 [4], and the mean pig slurry resulted from pig production in the state of Santa Catarina is 47.1 L pig−1 day−1 [5].
Wastes from pig production are usually stored in anaerobic ponds and used as an alternative soil fertilizer for agricultural crops and pastures [6,7,8,9,10], with similar results to commercial soluble chemical fertilizers [11,12]. Studies have shown increases in biomass production and quality, lower environmental impacts and production costs, and improvements in soil physical, chemical, and biological attributes [13,14,15,16,17].
The application of organic fertilizers such as pig slurry (PS), using proper methods and rates, can improve soil attributes and plant yields in pastures under extensive systems by adding nutrients and organic matter and promoting soil aggregation [9,18,19]. In addition, there is an increasing demand for socio-environmentally sustainable farming production practices, which can be assessed by economic efficiency and quality indicators [20]. Soil physical characteristics and stocks of carbon and nutrients are indicators used to determine strategies for increasing yields, monitoring soil quality, and avoiding soil degradation, mainly in pasture areas [21].
Despite that soil fertility is determinant for biomass production and the nutritional value of pasture grasses, and fertilizer application is essential to add nutrients to the soil, few farmers in Brazil use liming (14.4%), chemical and organic (10.7%), chemical (20%), or organic (11.7%) fertilizer applications, and many of them do not use fertilizer on pastures (58%) [22]. The application of plant or animal residues and biofertilizers are among the alternatives to lower the dependency on non-renewable resources, production costs, and environmental impacts, and increase the sustainability of agricultural systems [6,9,13,23,24,25].
PS can be as efficient as urea for the supply of N to pasture soils [26], with the advantage of a slow release of N [27], resulting in significant increases in biomass production [6,10,27,28]. In addition, it can increase soil organic carbon [29,30,31,32,33] and total nitrogen [31,34,35,36] contents, improve soil aggregation [15,17,30,37,38], minimize adverse effects of C and N emission to the atmosphere by volatilization and nitrification, and improve C and N retention by microorganisms, plant biomass, and soil aggregates [9,39,40,41].
Maize and oat crop rotations under the long-term application of PS were evaluated by Sacomori et al. [42], who found an increase in soil organic carbon in the soil 5–10 cm layer for PS rates of up to 100 m3 ha−1, and by Mafra et al. [43], who found increasing soil organic carbon contents and stocks as the PS rates and soil layers were increased. Santos et al. [44] evaluated nutrient contents of an Oxisol fertilized with PS in the Cerrado biome, Brazil, and found no differences in N stocks; they attributed it to the PS rates applied, high organic matter contents, and leaching, since the N stocks were higher in the deeper layers; in addition, they found increases in sulfur contents in the plant biomass and attributed it to the high soil N, organic matter, and clay contents, which facilitate sulphate absorption; it reflected on the biomass production and nutrient content of the Tifton-85 pastures.
These effects indirectly increase soil organic matter and improve soil physical properties [18,30,37,41], which is shown by the soil aggregation, soil bulk density, and porosity [45]. In addition, successive applications of PS can increase soil NO3—N contents, mainly in degraded soils, and organic matter contents, promoting N availability to crops [29,46].
Sulfur (S) is another essential nutrient for the growth of forage species that can be supplied by PS applications. The interaction between S and N has been studied for grass species, such as Brachiaria brizantha cv. Marandu, showing that the balance between these nutrients affects their absorption; the N rate applied determines the S concentration in root tissues and the S deficiency affects N absorption [47]; and the higher the N rate, the higher the S contents in leaf tissues [48].
PS has been successfully used for adding nutrients to soils, decreasing Al saturation [49] in pasture areas [50], and recovering degraded areas [51]. Several studies have evaluated the effects of PS as a soil fertilizer to define criteria for application and rates, mainly for annual crops; however, despite that many of them have shown increases in biomass, grain yield, and soil C and N contents as the PS rates are increased, there are no consensus regarding these criteria.
Moreover, the effects of PS application to soils are dependent on management factors of the pig production and application technology, which denotes the need for characterizing the PS components, rates, and effects to avoid undesirable changes or soil contamination [52,53,54]. Thus, long-term evaluations of the effect of different rates of PS and the sustainability of agroecosystems over time is necessary to assess whether it is an environmentally correct practice, based on technical criteria [55].
High doses of PS can increase the addition of C and N to the soil, but can also cause damage to physical attributes, such as a decrease in soil aggregation [17,52] and an increase in heavy metals, such as Cu and Zn [56]. Therefore, it is essential to evaluate the best dose of PS to be applied for the purpose of increasing dry mass and increasing C and N stocks in long-term experiments. Considering the higher nutrient exportation by pasture grass species compared to annual grain crops and the importance of soil bulk density and C and N stocks for biomass production in pasture areas, the objective of this work was to evaluate the best PS dose that favors the increase in dry matter production and carbon, nitrogen, and sulfur contents and stocks after applications of PS to soils with Tifton-85 for six years in southern Brazil.

2. Materials and Methods

2.1. Study Area

The experiment was conducted at the Federal Institute of Education, Science, and Technology of Rio Grande do Sul (IFRS), in Ibirubá, RS, Brazil (28°39′09″ S, 53°06′20″ W, and altitude of 421 m), in an area that had been grown with Bermuda grass (Cynodon dactylon (L.) Pers., cv. Tifton-85) intended for hay production for approximately 10 years. The region presents a Cfa2, subtropical humid climate, according to the Köppen classification. The annual mean minimum and maximum temperature and rainfall depths of the region, according to the Brazilian National Institute of Meteorology [57] are shown in Table 1.
The soil of the area was classified as Typic Hapludox according to Soil Survey Staff (USDA) [58], Rhodic Ferralsol (Dystric) according to the World Reference Base for Soil Resources (FAO) [59], and as Latossolo Vermelho Distroferrico tipico, according to Santos et al. (EMBRAPA) [60]. Soil samples were collected in the area before the installation of the experiment (May 2012) and subjected to chemical and physical analysis, according to the methods described by Tedesco et al. [61]; the results are shown in Table 2.

2.2. Treatments and Sampling

The experimental area was prepared in October 2012, and the application of the treatments started in November 2012, using 4 × 5 m plots (20 m2). A randomized block experimental design was used, with four replications.
The treatments consisted of six annual applications of fertilizer containing N, using an organic source (pig slurry—PS) at the rates of 0 (control, no N fertilizer application), 100 (PS100), 200 (PS200), 300 (PS300), and 400 (PS400) kg N ha−1, and a mineral source (urea) at the rate of 200 kg N ha−1 (Min200). The mineral treatment included phosphorus (P) and potassium (K) applications, using potassium chloride and triple superphosphate as sources; the rates used were based on soil analysis and the Tifton-85 biomass accumulation. P and K sources were annually applied to the soil surface manually, using 90 kg of P2O5 ha−1 and 120 kg of K2O ha−1. The PS rates used were based on its N contents, which were estimated annually, using five subsamples, according to the methodology proposed by the Soil Chemistry and Fertility Committee [11]. The characteristics of the PS rates applied (average contents) is presented in Table 3.
The total annual quantity of PS and urea were divided into three equal applications, after each one of the three cuts of the grass carried out for dry matter evaluation, in six agricultural years (2012/2013, 2013/2014, 2014/2015, 2015/2016, 2016/2017, and 2017/2018). The grass cuttings were removed from the area before the applications.
Samples of the soil 0–5, 5–10, and 10–30 cm layers of each plot were collected in March 2019 to evaluate soil density and C, N, and S contents and stocks. Undisturbed samples were used to determine soil bulk density, using a metal ring of known volume (Kopeck; 50 cm3), according to the methods described by the Embrapa [62]. Disturbed soil samples were used for chemical analysis. Three undisturbed and disturbed subsamples were collected in each plot of each treatment to compose undisturbed and disturbed samples, resulting in four undisturbed and four disturbed samples per treatment for each soil layer.

2.3. Dry Matter Production

The Tifton-85 total dry matter production (DMP) was evaluated using samples from three cuts carried out between December and April in the 2012/2013 to 2017/2018 agricultural year. The grass was cut at 5 cm height in an area of 0.5 m2 in each plot, dried in a forced air circulation oven at 65 °C until constant weight, and then weighed to determine the DMP of each plot; the results were expressed in Kg ha−1.

2.4. Soil Chemical Analysis

Total organic carbon (TOC), total nitrogen (TN), and sulfur contents were determined by the dry combustion method in autoanalyzer (LECO TruSpec CHNS Micro; LECO S-144 DR; LECO Corporation, St. Joseph, MO, USA) at 1300 °C, in the Nutrient Cycling Laboratory (LCN) of the of Center of Nuclear Energy in Agriculture (CENA) of the University of São Paulo (USP), in Piracicaba (SP), Brazil.
C, N, and S stocks were calculated using the equivalent mass method [63], according to the equation:
C S = i = 1 n 1 C T i + M T n i = 1 n M T i i = 1 n M S i C T n
where: C S is the total stock (Mg ha−1); i = 1 n 1 C T i is the sum of C, N, or S contents from the first (surface) to the last layer of the soil profile in the evaluated treatment (Mg ha−1); i = 1 n M T i is the sum of the soil mass from the first to the last layer of the soil profile in the evaluated treatment (Mg ha−1); i = 1 n M S i is the sum of the soil mass from the first to the last layer of the soil profile in the reference treatment (Mg ha−1); M T n is the mass in the last layer of the soil profile in the evaluated treatment (Mg ha−1); and C T n is the C, N, or S contents in the last layer of the soil profile in the evaluated treatment (Mg ha−1).
The reference treatments for each soil layer were those that presented the lowest soil bulk density and, consequently, the lowest equivalent masses, namely, PS300 for the layers 0–5 and 5–10 cm and PS200 for the layer 10–30 cm.

2.5. Statistical Analysis

The results of C, N, and S were subjected to normality (Lilliefors) and homogeneity (Cochran) tests. The results of the treatments were subjected to analysis of variance (ANOVA) by the F test and significant means were compared by the Scott–Knot test at 5% probability using the Sisvar 5.6 program [64]. Tifton-85 dry matter production results were submitted to regression analysis, testing linear and quadratic models, opting for the most significant model. Subsequently, the accumulated dry matter total (2012/13 to 2017/18) and C, N, and S contents and stocks were submitted to principal component analysis (PCA) to explore the variance of the data, allowing the identification of more complex interactions between the variables and treatments. PCA was performed using the ‘FactoMineR’ package from the statistical environment R [65].

3. Results

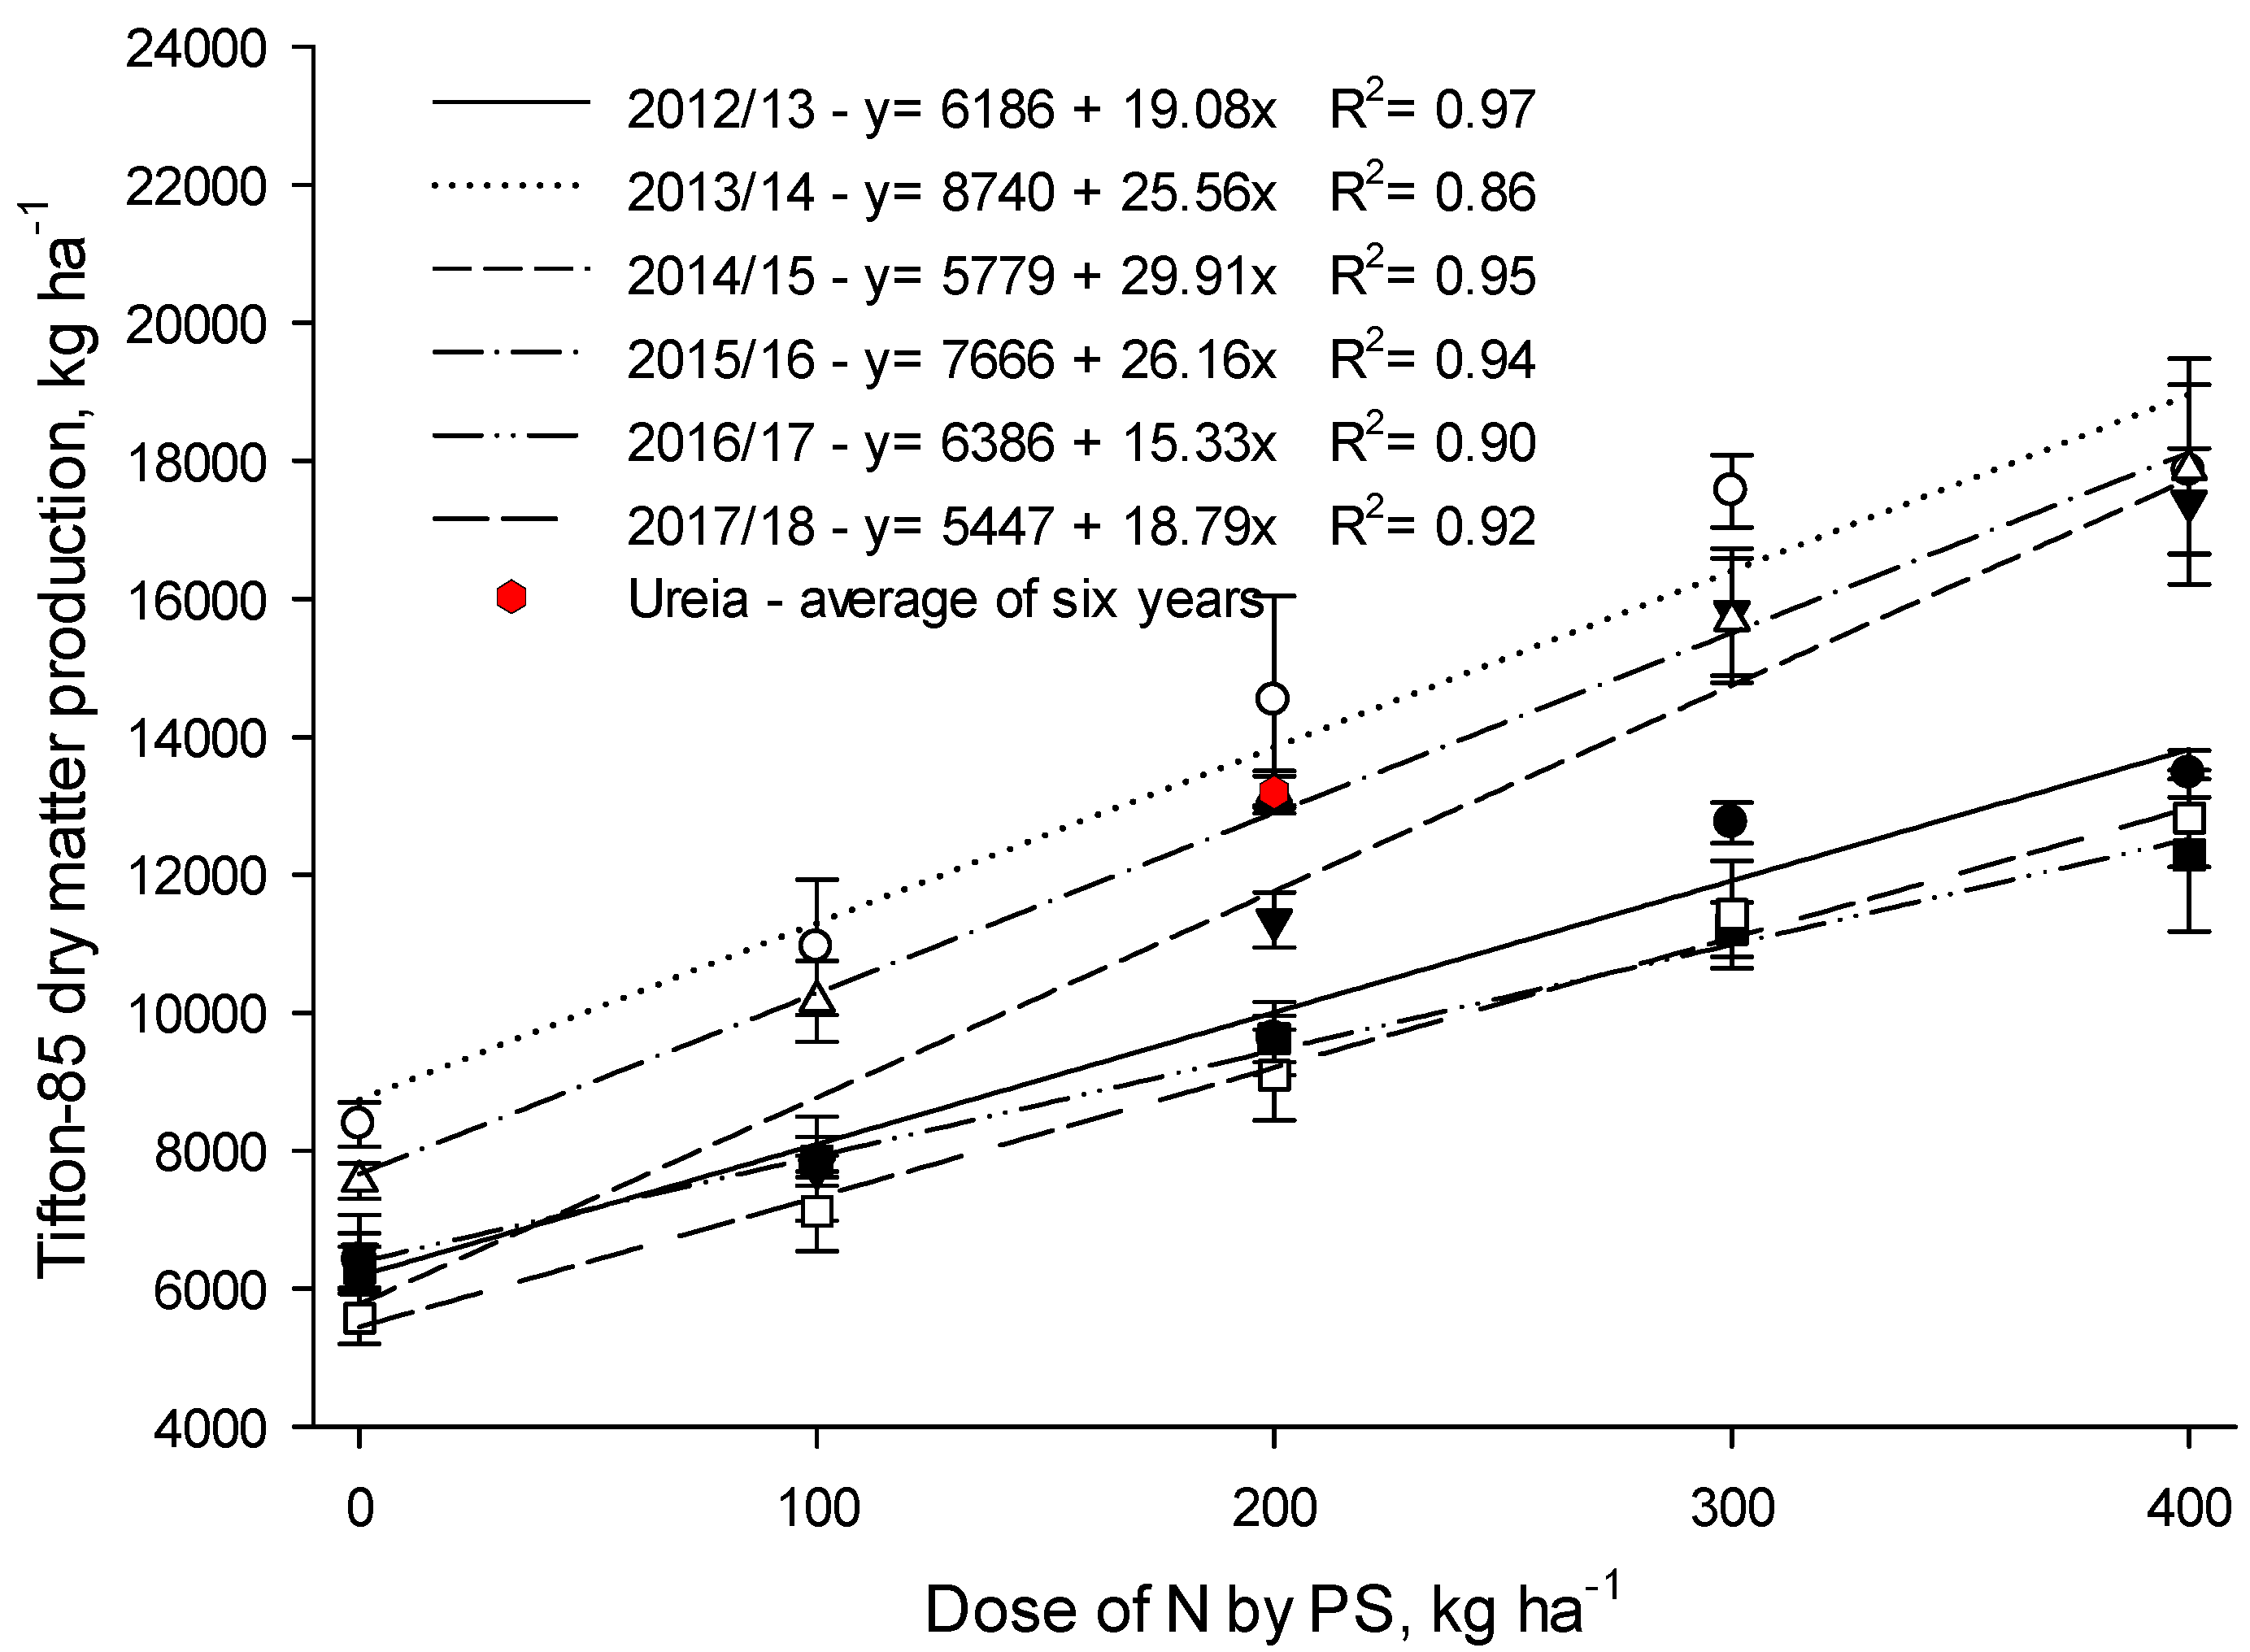
3.1. Tifton-85 Dry Matter Production

The accumulated mean dry matter production (DMP) of the Tifton-85 grass in the 2012/2013 to the 2017/2018 agricultural year increased linearly with increasing doses of applied PS (Figure 1). The control treatment showed the lowest DMP averages compared to PS and urea treatment.
The mean values of DMP of the Tifton-85 grass in the 2012/2013 to 2017/2018 for the control, Min200 (urea) and PS100, PS200, PS300, and PS40 treatments were 6.785, 13.197, 8.597, 11.234, 11.169, and 15.238 kg ha−1 (Figure 1).
The cumulative DMP of Tifton 85 after six agricultural crops (2012/13 to 2017/18) was 91.702 kg ha−1 (PS400), 79.182 kg ha−1 (urea), 73.018 kg ha−1 (PS300), 67.409 kg ha−1 (PS200), 51.585 kg ha−1 (PS100), and 40.714 kg ha−1 (control). These accumulated DMP values were used in the principal component analysis (Figure 2).

3.2. Soil Bulk Density and Carbon, Nitrogen, and Sulfur Contents

The soil bulk density (SD) was, in general, not significantly affected by the treatments; significant difference was found only in the soil 10–30 cm layer for the treatment PS200, which showed a lower SD than the other treatments (Table 4).
C contents in soils fertilized with PS were significantly higher in the 0–5 cm layer, when compared to the control and the treatment with mineral fertilizer. Significant relative increases were found in the 0–5 cm layer for PS200 (50.3%) and PS400 (57.1%) when compared to the control, and for PS200 (29.9%) and PS400 (35.7%) when compared to Min200 (Table 4).
C contents were similar in the soil 5–10 and 10–30 cm layers, except for PS400 in the soil 5–10 layer, which resulted in significantly higher soil C contents when compared to the other treatments, and 45.8% higher than the control (Table 4).
N contents in the 0–5 cm layer of soils fertilized with PS and mineral fertilizer were significantly higher than those of the control, except for PS100; treatment PS400 resulted in significantly higher soil N contents than the other treatments in the 5–10 cm layer; and PS300, PS400, and the control resulted in significantly higher N contents in the 10–30 cm layer (Table 4).
The treatments PS300 and PS400 showed significantly higher S contents in the soil 0–5 and 5–10 cm layers, and PS100 and PS300 showed significantly higher S contents in the soil 10–30 cm layer, when compared to the other treatments (Table 4).

3.3. Soil Carbon, Nitrogen, and Sulfur Stocks

C stocks of soils treated with PS were higher than those treated with Min200 and the control in the 0–5 cm layer. PS400 resulted in higher C stocks in the 5–10 cm layer, and PS200 resulted in lower C stocks in the 10–30 cm layer than the other treatments, which were similar to each other. In general (0–30 layer), C stocks of soils treated with PS100, PS400, and Min200 were higher than those of the other treatments (Table 5).
The treatments had no effect on the soil N stocks, except in the soil 10–30 cm layer, in which PS200 resulted in lower N stocks (Table 5).
S stocks were similar in the 0–5 cm layer and higher for the treatments PS300 and PS400 in the 5–10 cm layer; in the 10–30 layer, PS100 and PS300 resulted in higher S stocks (Table 5).
C, N, and S stocks in the 0–30 cm layer of soils treated with PS were, in general, equal to or higher than those in the control and Min200 treatments.

3.4. Principal Component Analysis (PCA)

Using the PCA, it was possible to show that the PC1 component plus the PC2 component explained 71.25% of the accumulated variance. Through PCA, we can evidence the separation of the control and PS400 treatments from the other treatments (PS100, PS200, PS300, Min200), which were grouped (Figure 2). C and N stocks in the 0–30 cm layer are directly related to the increase in the MS total of Tifton 85 (2012/13 to 2017/18).
The variables with the greatest influence on the separation of the control treatment was N30; for the PS40 treatment they were C10, N10, S5, and S10, and for the Min200 (urea), PS100, PS200, and PS300 treatments, they were C30 and S30 (Figure 2).

4. Discussion

4.1. Tifton-85 Dry Matter Production (DMP)

The highest DMP in treatments with PS denote the efficiency of these applications in increasing DMP, with similar results to mineral fertilizers, as also found in other studies [6,27,28]. The literature shows that PS has been used as organic fertilizer, mainly as a source of N in areas cultivated with pastures and annual crops [26,34,56,66,67,68]. Successive applications of PS, as an organic fertilizer, enhance the growth and DMP accumulation of Tifton-85 (Cynodon sp.) [6,27,28], which is well-adapted to the subtropical climate conditions of southern Brazil, and is characterized by rapid growth and a high digestibility.
According to [10], Tifton-85 grass has a high responsiveness to N fertilization and the use of residues from animal production, including PS, which increases the Tifton-85 DMP, yield, and crude protein levels. The accumulated DMP found (Figure 1) confirm that the use of PS to supply mineral N results in a higher forage production when compared to the control treatment. Thus, cultivated areas with Tifton-85 grass are an alternative to the disposal of residues from animal production.
The increase in Tifton-85 DMP is also associated with the climatic conditions of the study region [10,19]. There were good climatic conditions (temperature and precipitation) for the forage development in the period in which the production of Tifton-85 was evaluated (Table 1). We highlight the 2013/2014, 2014/2015, and 2015/2016 crops, which presented higher values of accumulated annual precipitation compared to other agricultural crops (Table 1), which possibly influenced the higher amounts of Tifton-85 DMP (Figure 1). However, despite these increases in DMP as the PS rates were increased, some factors should be considered for achieving high DMP while maintaining the soil sustainability and protecting the environment, such as soil aggregation and nutrient accumulation.
The linear increase in Tifton-85 DMP in PS treatments (Figure 1) is related to the essential nutrients that PS contains for plants, such as N, P, K, Ca, and Mg, which contribute to crop growth and productivity [46,69,70,71]. In addition, the use of PS increases the levels of C and N (Table 4) and, consequently, of SOM, with an increase in the cation exchange capacity, resulting in increased productivity [9,15,34,35].

4.2. Soil Bulk Density and Carbon, Nitrogen, and Sulfur Contents

The lack of significant effect of the treatments on soil bulk density (SD) were probably due to the grass fasciculate root system and soil cover and the absence of grazing, which result in a homogeneous soil density.
SD is usually lower in the soil surface layer [72,73] because of the organic matter added by plants. Thus, the difference in the 10–30 cm layer was probably due to the soil aggregation, which results in a higher volume of pores and a lower SD, since PS200 presented the highest geometric mean diameter of aggregates, simi tolar that of the control [17], and resulted in 26,695 kg ha−1 higher accumulated DMP (Figure 1).
Other studies have also reported no significant differences in SD due to the PS applications, regardless of the time of application [45,74]. However, according to Andrade et al. [75], the SD and resistance to penetration are variables highly correlated with the application of animal manure and soil management systems.
Soil physical attributes may change due to management practices or PS applications, mainly the SD, the soil particle arrangement, and the volume of the pores. However, despite PS applications not changing these properties, even in the long-term, they generate benefits such as a decrease in soil aluminum saturation and an increase in base saturation up to a 20 cm depth [29].
Bandeira et al. [76] evaluated a clayey Inceptisol in the state of Santa Catarina, Brazil, under a no-tillage system with PS applications and also found no significance for SD between the soil layers, but found a higher SD for the control treatment in the deeper layers; they attributed it to the PS stimulation of soil biological activity, which increase aggregate stability and macroporosity and decrease the SD. Oliveira et al. [73] and Arruda et al. [72] found a lower SD for the surface layer and correlated this result to the organic matter added through PS applications, which improved soil aggregation.
The SDs found in the present study were below the critical limits for root elongation and the production of grass species in clayey Oxisols [77], which is above 1.4 g cm−2. In addition, the use of Tifton-85 grass may reduce the compaction of clayey soils [10].
The C contents found in the 0–5 cm layer denoted the effectiveness of using PS to increase soil C contents, which assisted in increasing biomass production in the PS200 and PS400, presenting relative mean increases of 65% and 125%, respectively, when compared to the control (Figure 1). The results found for the soil 5–10 and 10–30 cm layers were due to the soil surface applications of PS and the initial soil organic carbon (SOC) contents (Table 1), which were low in deeper layers; thus, the PS applications over the years may have increased C contents in the soil surface layer. In addition, PS400 presented a higher accumulated DMP than the control, Min200 and PS treatments (Figure 1).
An increase in total C contents by PS applications improves soil aggregation, aeration, water infiltration, and decreases the SD and compaction [18,32]. According to Quadro et al. [39], C and N contents of the microbial biomass increase linearly up to the PS rate of 12 and 18 Mg ha−1, respectively. In addition, PS applied to Oxisols with a maize and oat rotation using a no-till system may increase soil organic carbon up to the rate of 200 m3 ha−1, increasing C fixation in up to 1.0 Mg ha−1 year−1 [32].
The N contents found denoted that increases in PS rates increased the soil N contents due to the PS N contents; in addition, soils under the treatments PS200, PS300, PS400, and Min200 presented higher dry matter percentages than those under PS100 and the control (Figure 1), promoting a higher addition and cycling of N.
This also explains the higher N contents for the highest PS rates in deeper layers; however, the high N contents found for the control in the 10–30 cm layer may be connected to the higher soil aggregation, shown by the high aggregation presented by the control, which was similar to that of the PS200 [17]. Moreover, the evaluated soil presented, naturally, high Ca, Mg, and clay contents at the beginning of the experiment (Table 2), and the maintenance of the pasture improved the soil aggregation in depth, thus protecting N contents within aggregates.
Similar results were found by Grohskopf et al. [68], who evaluated PS at rates of 200 m3 ha−1 and mineral applications to a Typic Hapludox and found higher N contents in surface layers; however, they reported that it may also result in greater losses through volatilization, leaching, and surface runoff. In addition, Lourenzi et al. [71] evaluated the distribution of nutrients in the soil profile after 19 PS applications at rates of up to 80 m3 ha−1 under no-tillage over 93 months and found increases in total N up to a 30 cm depth, but reported that it may have undesirable environmental and economic consequences and recommended the use of lower PS rates combined with mineral fertilizers.
The effect of the treatments on S contents were due to the addition of S to the soil through the PS, which increased the plant S uptake and the S cycling, since the S to C ratio in plant residues is sufficiently high for the decomposition of plant residues to release more S than the soil microorganism requires, resulting in the mineralization of S [78].
According to Peu et al. [79], S retention by pigs is, on average, 1.1 g day−1, and it is not affected by the diet; thus, the S contents found in PS are highly affected by the animals’ diet; they found that S contents in PS varied from 1.5 to 6.9 g pig−1 day−1, according to the diet, and is excreted mainly as sulfate. Mikkelsen and Norton [80] found that S contents in manures vary from 0.3% to 1%, depending on the animal species, diet, and management; however, a mineralization period may be needed to convert compounds containing organic S into sulfate for plant absorption.
The addition of PS to supply N to plants can meet the S requirements of most crops, since the N to S ratio of PS ranges from 13:1 to 25:1 [78]. Balieiro Neto et al. [81] found a linear fit for shoot S contents in Tifton-85 grass, and a quadratic fit for Panicum maximum cv. Tanzânia for the use of increasing S rates. In addition, the use of S fertilizers can increase the shoot and root biomass production of Tifton-85 and Brachiaria decumbens Stapf., and the uptake of S is dependent on the grass species; Tifton-85 is more responsive to S fertilizers and presents a higher S absorption; however, the application of high rates of S may exceed the plant requirement and increase soil S contents [42,81,82].
Bonfim-Silva et al. [83] found significance for the interaction between S and N for the growth of Brachiaria decumbens. However, the biomass production of Panicum maximum cv. Tanzânia is dependent on the S to N ratio, since S deficiency affects N absorption by plants, which may result in an N deficiency that masks the S deficiency [47].

4.3. Soil Carbon, Nitrogen, and Sulfur Stocks and PCA

The higher C stocks found for treatments with PS are connected to the addition of C through the PS (Table 3), the accumulative DMP of Tifton 85 after six agricultural crops (Figure 2), and its effect on the mineralization of C from plant residues by stimulations of microbial activity, which increase SOM mineralization, mainly in the surface layer; and the contribution of the grass roots in deeper layers [43]. In addition, the mean DMP of treatments with PS were higher than the control, and PS300 and PS400 presented a higher DMP than the Min200 (Figure 1), denoting the contribution of PS to the addition and fixation of soil C.
Despite the low C to N ratio of PS, the soil clay contents (Table 2) promoted C stabilization via physical and chemical mechanisms, affecting the bounding between mineral surfaces and organic matter [84]. In addition, the clay + silt content is associated with soil aggregation, which may result in a physical protection of organic matter, decreasing C accessibility by microorganisms [85,86].
However, the addition of soluble carbon, water, and nitrogen through PS may have different effects on the aggregate formation processes and soil C and N [37,58]. Mafra et al. [32] found increases in C and N contents and stocks in clayey soils with long-term PS applications using rates of up to 200 m3 ha−1.
The soil organic carbon accumulation rates are partly determined by the organic matter content and quality added, and soil C and N stocks depend on the annual quantity of manure added, their conversion rate into SOM, and the SOM mineralization rate [87,88].
Organic fertilizers with low dry matter and organic carbon contents can increase microbial activity and SOM mineralization, and only maintain or even reduce C stocks; thus, organic fertilizers such as PS combined with materials of a high C to N ratio can increase organic C stocks [34,89]. SOM has significant carbon stocks and microbial biomass due to its physical properties and chemical components; thus, the quantity of plant residues, root recycling, and SOM decomposition rates in agroecosystems affect soil C stocks [32].
The similar N stocks found in the different soil layers and treatments were probably related to losses of N by volatilization and leaching. High N contents were added to the soil through PS (Table 3) and the accumulative DMP of Tifton 85 after six agricultural crops (Figure 2). However, soil N stocks are affected by several inherent factors: soil drainage, texture, slope steepness, and rainfall affect N transport; and air temperature and soil moisture, aeration, and salt contents affect the N mineralization rate from organic matter decomposition and nitrogen cycling; these factors may cause nitrogen losses through leaching, runoff, or denitrification [61].
Bergström and Kirchmann [90] evaluated soils fertilized with PS for 3 years and found that N leaching tends to increase with increasing slurry application, reaching 139 kg ha−1 for the highest application used (equivalent to the PS200 treatment). Basso et al. [91] also found that N (ammonia) losses increase as the PS rates are increased; they attributed the high potential volatilization found (up to 72%) to the higher percentage of mineral N on the PS when compared to total N and reported that the use of lower rates of PS can be more efficient for plant production.
The results found for S stocks were due to the accumulation of S from the PS applications over the years. Santos et al. [44] found increases in sulfur contents in plants grown in an Oxisol fertilized with PS, which was reflected in the biomass production of Tifton-85 pastures. This was also found in the present study; the addition of S probably partly contributed to the higher mean DMP of Tifton-85 in treatments using PS.
C, N, and S stocks in the 0–30 cm layer of soils treated with PS were, in general, equal to or higher than those in the control and Min200 treatments (Table 5). The PCA showed that the cumulative increase in Tifton-85 dry mass during six agricultural crops increased C and N stocks in the 0–30 cm layer (Figure 2). It is noteworthy that the variables DMP and C, N, and S (0–30 cm) stocks are in the opposite position to the control treatments, and in an intermediate position to the PS400 and the other treatments (PS100, PS200, PS300, and Min200) (Figure 2). This pattern corroborates the lower stocks of C and S (0–30 cm) and N (0–5 cm) in the control treatment; and similar values among the Min200 (urea) and PS100, PS200, and PS300 treatments (Figure 2, Table 5).
However, despite that the application of PS at high rates improves organic matter contents and nutrient availability, it adds excessive rates of P, Cu, and Zn, that are potentially toxic to plants [70] and to the environment, by increasing surface runoff and leaching, which can contaminate surface and subsurface waters [53]. Some forms of N can also be lost by leaching [69,92,93] or volatilization to the atmosphere [88,94]. Therefore, the PS rate equivalent to 100 or 200 kg ha−1 of N is recommended for increasing soil C, N, and S stocks and soil aggregation due to environmental issues, since the cumulative Tifton-85 DMP in this treatment was bigger than the control, and similar to that in the urea (Min200).

5. Conclusions

The applications of increasing doses of pig slurry under Tifton-85 pastures over six years increase linearly the dry matter and soil organic C, N, and S stocks in the 0–30 cm layer.
The PS rate equivalent to 100 or 200 kg ha−1 of N is recommended for increasing soil C, N, and S stocks, since it resulted in C, N, and S stocks equal to or higher than the control and mineral (urea) treatments.

Author Contributions

Conceptualization, A.L., M.P.L. and E.G.; methodology, C.S., J.D. and M.d.C.P.; software, A.L.; validation, C.S., G.B. and A.L.; formal analysis, C.R.L. and A.L.; investigation, C.S.; resources, A.L. and G.B.; data curation, C.S. and A.L.; writing—original draft preparation, C.S.; writing—review and editing, A.L., J.L.R.T. and M.d.C.P.; visualization, G.B. and J.L.R.T.; supervision, A.L.; project administration, E.G. and M.P.L.; funding acquisition, A.L. All authors have read and agreed to the published version of the manuscript.

Funding

This research was funded by in part by the “Coordenação de Aperfeiçoamento de Pessoal de Nível Superior—Brasil (CAPES)—Finance Code 001”; and the APC was funded by “Programa de Pós-graduação em Agroecossistemas da Universidade Federal de Santa Catarina”.

Institutional Review Board Statement

Not applicable.

Informed Consent Statement

Not applicable.

Data Availability Statement

Not applicable.

Acknowledgments

The authors thank the Brazilian National Council for Scientific and Technological Development (CNPq), for the research productivity scholarships granted to the 2nd, 3rd, 7th, 8th, and 9th authors.

Conflicts of Interest

The authors declare no conflict of interest.

References

  1. ABIEC—Associação Brasileira das Indústrias Exportadoras de Carne. Beef Report—Perfil da Pecuária no Brasil. 2019. Available online: http://www.abiec.com.br/controle/uploads/arquivos/sumario2019portugues.pdf (accessed on 12 December 2021).
  2. MAPA—Ministério da Agricultura, Pecuária e Abastecimento. Agropecuária Brasileira em Números Maio de. 2019. Available online: http://www.agricultura.gov.br/assuntos/politica-agricola/todas-publicacoes-de-politica-agricola/agropecuaria-brasileira-em-numeros/agropecuaria-brasileira-em-numeros-maio-de-2019.pdf/view (accessed on 11 November 2020).
  3. MAPA—Ministério da Agricultura, Pecuária e Abastecimento. Projeções do Agronegócio 2018/2019–2028/2029, 10th ed.; MAPA: Brasília, Brasil, 2019; 126p.
  4. Zaman, M.; Saggar, S.; Blennerhassett, J.D.; Singh, J. Effect of urease and nitrification inhibitors on N transformation, gaseous emissions of ammonia and nitrous oxide, pasture yield and N uptake in grazed pasture system. Soil Biol. Biochem. 2009, 41, 1270–1280. [Google Scholar] [CrossRef]
  5. Ministério da Agricultura, Pecuária e Abastecimento. Suinocultura de Baixa Emissão de Carbono—Tecnologias de Produção Mais Limpa e Aproveitamento Econômico dos Resíduos da Produção de Suínos, 1st ed.; Ministério da Agricultura, Pecuária e Abastecimento: Brasília, Brazil, 2016.
  6. De Moura Zanine, A.; Ferreira, D.J. Animal Manure as a Nitrogen Source to Grass. Am. J. Plant Sci. 2015, 6, 899–910. [Google Scholar] [CrossRef]
  7. Konzen, E.A.; Alvarenga, R.C. Manejo e Utilização de Dejetos Animais: Aspectos Agronômicos e Ambientais; Embrapa Milho e Sorgo: Sete Lagoas, Brasil, 2005. [Google Scholar]
  8. Konzen, E.A. Fertilização de Lavoura e Pastagem com Dejetos de Suínos e Cama de Aves; Embrapa Milho e Sorgo: Sete Lagoas, Brasil, 2003; 19p, Informe Técnico. [Google Scholar]
  9. Loss, A.; Couto, R.R.; Brunetto, G.; Veiga, M.; Toselli, M.; Baldi, E. Animal Manure As Fertilizer: Changes In Soil Attributes, Productivity And Food Composition. Int. J. Res. Granthaalayah 2019, 7, 307–331. [Google Scholar] [CrossRef]
  10. Scherer, E.E.; Nesi, C.N.; Massotti, Z. Atributos químicos do solo influenciados por sucessivas aplicações de dejetos suínos em áreas agrícolas da Região Oeste Catarinense. Rev. Bras. Ciên. Solo 2010, 34, 1375–1383. [Google Scholar] [CrossRef]
  11. CQFS-RS/SC—Comissão de Química e Fertilidade do Solo—RS/SC. Manual de Calagem e Adubação para os Estados do Rio Grande do Sul e de Santa Catarina; Sociedade Brasileira de Ciência do Solo: Porto Alegre, Brasil, 2016; 376p. [Google Scholar]
  12. Moraes, M.T.; Arnuti, F.; Silva, V.R.; Silva, R.F.; Basso, C.J.; Ros, C.O. Dejetos líquidos de suínos como alternativa a adubacão mineral na cultura do milho. Semina: Ciên. Agrá. 2014, 35, 2945–2954. [Google Scholar] [CrossRef]
  13. Balota, E.L.; Machineski, O.; Hamid, K.I.A.; Yada, I.F.U.; Barbosa, G.M.C.; Nakatani, A.S.; Coyne, M.S. Soil microbial properties after long-term swine slurry application to conventional and no-tillage systems in Brazil. Sci. Total Environ. 2014, 490, 397–404. [Google Scholar] [CrossRef] [PubMed]
  14. Giacomini, S.J.; Aita, C.; Pujol, S.B.; Miola, E.C.C. Transformações do nitrogênio no solo após adição de dejeto líquido e cama sobreposta de suínos. Pesqui. Agropecuária Bras. 2013, 48, 211–219. [Google Scholar] [CrossRef]
  15. Loss, A.; Ventura, B.S.; Muller Junior, V.; Gonzatto, R.; Battisti, L.F.Z.; Lintemani, M.G.; Erthal, M.E.C.; Vidal, R.F.; Scopel, G.; Lourenzi, C.R.; et al. Carbon, nitrogen and aggregation index in Ultisol with 11 years of application of animal manures and mineral fertilizer. J. Soil Water Conserv. 2021, 76, 00165. [Google Scholar] [CrossRef]
  16. Navroski, D.; Filho, A.C.; Barbosa, G.M.C.; Moreira, A. Soil attributes and microbial diversity on 28 years of continuous and interrupted for 12 months of pig slurry application. Chil. J. Agric. Res. 2021, 81, 27–38. [Google Scholar] [CrossRef]
  17. Santos, A.R.; Monteiro, F.A. Produção e perfilhamento de Brachiaria decumbens Stapf. em função de doses de enxofre. Sci. Agric. Piracicaba 1999, 56, 689–692. [Google Scholar] [CrossRef]
  18. Oliveira, J.G.R.; Tavares Filho, J.; Barbosa, G.M.C. Alterações na física do solo com a aplicação de dejetos animais. Geogr. Opportuno Tempore 2016, 2, 66–80. [Google Scholar]
  19. Scheffer-Basso, S.M.; Scherer, C.V.; Ellwanger, M.F. Resposta de pastagens perenes à adubação com chorume suíno: Pastagem natural. Rev. Bras. Zootec. 2008, 37, 221–227. [Google Scholar] [CrossRef]
  20. Dias, V.V.; Talamini, E.; Revillion, J.P.P.; Schuster, M.S. Scale of consumer loyalty for organic food. Br. Food J. Inf. 2016, 118, 697–713. [Google Scholar] [CrossRef]
  21. Dias-Filho, M.B. Diagnóstico das Pastagens no Brasil; Documentos, 402; Embrapa Amazônia Oriental: Belém, Brazil, 2014. [Google Scholar]
  22. IBGE—Instituto Brasileiro de Geografia e Estatistica. Censo Agropecuário 2017—Resultados Preliminares. Brasília: IBGE. 2018. Available online: https://biblioteca.ibge.gov.br/visualizacao/periodicos/3093/agro_2017_resultados_preliminares.pdf (accessed on 22 June 2021).
  23. Castro, C.S.; Lobo, U.G.M.; Rodrigues, L.M.; Backes, C.; Santos, A.J.M. Eficiência de utilização de adubação orgânica em forrageiras tropicais. Rev. Agric. Neotrop. 2016, 3, 48–54. [Google Scholar] [CrossRef]
  24. Macêdo, A.J.S.; Edvan, R.L.; Santos, E.M.; Soares, M.N. Adubação orgânica em pastagens tropicais: Revisão. Rev. Electrónica De Vet. 2018, 19, 1–19. [Google Scholar]
  25. Severiano, E.C.; Oliveira, G.C.; Dias Junior, M.S.; Costa, K.A.P.; Castro, M.B.; Magalhães, E.N. Potencial de descompactação de um Argissolo promovido pelo capim-tifton 85. Rev. Bras. Eng. Agric. Amb. 2010, 14, 39–45. [Google Scholar] [CrossRef]
  26. Park, S.H.; Lee, B.R.; Cho, W.M.; Kim, T.H. Comparative nitrogen use efficiency of urea and pig slurry for regrowth yield and nutritive value in perennial ryegrass sward. Asian-Australas J. Anim. Sci. 2017, 30, 514–522. [Google Scholar] [CrossRef] [PubMed]
  27. Albuquerque, D.C.K.; Scheffer-Basso, S.M.; Escosteguy, P.A.V.; Brustolin-Golin, K.; Zabot, V.; Miranda, M. Residual effect of pig slurry on common carpet grass pasture. Agriambi 2017, 21, 374–378. [Google Scholar] [CrossRef]
  28. Brustolin-Golin, K.D.; Scheffer-Basso, S.M.; Escosteguy, P.A.V.; Miranda, M.; Travi, M.R.L.; Zabot, V. Pig slurry in carpet grass pasture: Yield and plant-available nitrogen. Rev. Bras. De Eng. Agrícola E Ambient. 2016, 20, 795–799. [Google Scholar] [CrossRef]
  29. Brunetto, G.; Comin, J.J.; Schmitt, D.E.; Guardini, R.; Mezzari, C.P.; Oliveira, B.S.; Moraes, M.P.; Gatiboni, L.C.; Lovato, P.E.; Ceretta, C.A. Changes in soil acidity and organic carbon in a sandy Typic Hapludalf after medium-term pig slurry and deep-litter application. Rev. Bras. Ciên. Solo 2012, 36, 1620–1628. [Google Scholar] [CrossRef]
  30. Comin, J.J.; Loss, A.; Veiga, M.; Guardini, R.; Schmitt, D.E.; Oliveira, P.A.V.; Belli Filho, P.; Couto, R.D.A.R.; Benedet, L.; Muller Júnior, V.; et al. Physical properties and organic carbon content of a Typic Hapludult soil fertilized with pig slurry and pig litter in a no-tillage system. Soil Res. 2013, 51, 459–470. [Google Scholar] [CrossRef]
  31. He, Y.T.; Zhang, W.J.; Xu, M.G.; Tong, X.G.; Sun, F.X.; Wang, J.Z.; Huang, S.M.; Zhu, P.; He, X.H. Long-term combined chemical and manure fertilizations increase soil organic carbon and total nitrogen in aggregate fractions at three typical cropland soils in China. Sci. Total Environ. 2015, 532, 635–644. [Google Scholar] [CrossRef] [PubMed]
  32. Mafra, M.S.H.; Cassol, P.C.; Albuquerque, J.A.; Correa, J.C.; Grohskopf, M.A.; Panisson, J. Acúmulo de carbono em Latossolo adubado com dejeto líquido de suínos e cultivado em plantio direto. Pesqui. Agropecuária Bras. 2014, 49, 630–638. [Google Scholar] [CrossRef]
  33. Rodrigues, L.A.T.; Giacomini, S.J.; Aita, C.; Lourenzi, C.R.; Brunetto, G.; Bacca, A.; Ceretta, C.A. Short- and long-term effects of animal manures and mineral fertilizer on carbon stocks in subtropical soil under no-tillage. Geoderma 2021, 386, 114913. [Google Scholar] [CrossRef]
  34. Ferreira, G.W.; Benedet, L.; Trapp, T.; Lima, A.P.; Muller Junior, V.; Loss, A.; Lourenzi, C.R.; Comin, J.J. Soil aggregation indexes and chemical and physical attributes of aggregates in a Typic Hapludult fertilized with swine manure and mineral fertilizer. Int. J. Recycl. Org. Waste Agric. 2021, 10, 1–17. [Google Scholar] [CrossRef]
  35. Francisco, C.A.L.; Loss, A.; Brunetto, G.; Gonzatto, R.; Giacomini, S.J.; Aita, C.; Piccolo, M.C.; Marquezan, C.; Scopel, G.E.; Vidal, R.F. Aggregation, carbon, nitrogen, and natural abundance of 13C and 15N in soils under no-tillage system fertilized with injection and surface application of pig slurry for five years. Carbon Manag. 2021, 12, 257–268. [Google Scholar] [CrossRef]
  36. Giacomini, S.J.; Aita, C. Cama sobreposta e dejetos líquidos de suínos como fonte de nitrogênio ao milho. Rev. Bras. Ciên. Solo 2008, 32, 195–205. [Google Scholar] [CrossRef]
  37. Loss, A.; Lourenzi, C.R.; Santos Junior, E.; Mergen Junior, C.A.; Benedet, L.; Pereira, M.G.; Piccolo, M.C.; Brunetto, G.; Lovato, P.E.; Comin, J.J. Carbon, nitrogen and natural abundance of 13C and 15N in biogenic and physicogenic aggregates in a soil with 10 years of pig manure application. Soil Tillage Res. 2017, 166, 52–58. [Google Scholar] [CrossRef]
  38. West, T.O.; Post, W.M. Soil organic carbon sequestration rates by tillage and crop rotation: A global data analysis. Soil Sci. Soc. Am. J. 2002, 66, 1930–1946. [Google Scholar] [CrossRef]
  39. Quadro, M.S.; Castilhos, D.D.; Castilhos, R.M.V.; Vivian, G. Biomassa e atividade microbiana em solo acrescido de dejeto suíno. Rev. Bras. Agrociên. 2011, 17, 85–93. [Google Scholar] [CrossRef]
  40. Rayne, N.; Aula, L. Livestock manure and the impacts on soil health: A review. Soil Syst. 2020, 4, 64. [Google Scholar] [CrossRef]
  41. Silva, A.A.; Lana, A.M.Q.; Lana, R.M.Q.; Costa, A.M. Fertilização com dejetos suínos: Influência nas características bromatológicas da Brachiaria decumbens e alterações no solo. Eng. Agric. 2015, 35, 254–265. [Google Scholar] [CrossRef] [Green Version]
  42. Sacomori, W.; Casso, P.C.; Mafra, M.S.H.; Erdemann, L.F.; Almeida, J.A. Accumulation of humic substances in an Oxisol fertilized with pig slurry for 15 years. Rev. Bras. Eng. Agric. Amb. 2021, 25, 109–115. [Google Scholar] [CrossRef]
  43. Mafra, M.S.H.; Albuquerquer, J.A.; Grohskopf, M.A.; Andrade, A.P.; Rauber, L.P.; Friederichs, A. Organic Carbon Contents and Stocks in Particle Size Fractions of a Typic Hapludox Fertilized with Pig Slurry and Soluble Fertilizer. Rev. Bras. Cienc. Solo 2015, 39, 1161–1171. [Google Scholar] [CrossRef]
  44. Santos, C.; Loss, A.; Piccolo, M.d.C.; Girotto, E.; Ludwig, M.P.; Decarli, J.; Torres, J.L.R.; Brunetto, G. Aggregation Index and Carbon and Nitrogen Contents in Aggregates of Pasture Soils under Successive Applications of Pig Slurry in Southern Brazil. Agronomy 2022, 12, 320. [Google Scholar] [CrossRef]
  45. USDA—United States Department of Agriculture. Soil Nitrogen, Soil Quality Guide for Educators; USDA: Washington, DC, USA, 2014.
  46. Lourenzi, C.R.; Ceretta, C.A.; Silva, L.S.; Trentin, G.; Girotto, E.; Lorensini, F.; Tiecher, T.L.; Brunetto, G. Soil chemical properties related to acidity under successive pig slurry applications. Rev. Bras. Ciên. Solo 2011, 35, 1827–1836. [Google Scholar] [CrossRef]
  47. Batista, K.; Monteiro, F.A. Sistema radicular do capim-Marandu considerando as combinações de doses de nitrogênio e de enxofre. Rev. Bras. Cienc. Solo 2006, 30, 821–828. [Google Scholar] [CrossRef]
  48. Mattos, W.T.; Monteiro, F.A. Produção e nutrição de capim braquiária em função de doses de nitrogênio e enxofre. Bol. Ind. Anim. 2003, 60, 1–10. [Google Scholar]
  49. Ceretta, C.A.; Durigon, R.; Basso, C.J.; Barcellos, L.A.R.; Vieira, F.C.B. Características químicas de solo sob aplicação de esterco líquido de suínos em pastagem natural. Pesqui. Agropecu. Bras. 2003, 38, 729–735. [Google Scholar] [CrossRef]
  50. Cabral, J.R.; Freitas, P.S.L.; Rezende, R.; Muniz, A.S.; Bertonha, A. Impacto da água residuária de suinocultura no solo e na produção de capim-elefante. Rev. Bras. Eng. Agric. Amb. 2011, 15, 823–831. [Google Scholar] [CrossRef]
  51. Castro, R.; Mera, C.M.P.; Fiorin, J.E. Cenários produtivos em solos recuperados com a adubação de dejetos líquidos de suínos. Rev. Científica Rural 2017, 19, 145–160. [Google Scholar]
  52. Barbosa, G.M.C.; Oliveira, J.F.; Miyazawa, M.; Ruiz, D.B.; Tavares Filho, J. Aggregation and clay dispersion of an Oxisol treated with swine and poultry manures. Soil Tillage Res. 2015, 146, 279–285. [Google Scholar] [CrossRef]
  53. Girotto, E.; Ceretta, C.A.; Lourenzi, C.R.; Lorensini, F.; Tiecher, T.L.; Vieira, R.C.B.; Trentin, G.; Basso, C.J.; Miotto, A.; Brunetto, G. Nutrient transfer by leaching in a no-tillage system through soil treated with repeated pig slurry applications. Nutr. Cycl. Agroecosys 2013, 95, 115–131. [Google Scholar] [CrossRef]
  54. Veiga, M.; Pandolfo, C.M.; Dortzbach, D.; Araujo, I.S. Atributos físicos do solo em glebas com aplicação continuada de dejeto líquido de suínos. Agropecuária Catarin. 2012, 25, 74–78. [Google Scholar]
  55. Corrêa, J.C.; Barilli, J.; Rebellatto, A.; Veiga, M. Aplicações de Dejetos de Suínos e as Propriedades do Solo; Circular Técnica 58; Embrapa: Concórdia, Brazil, 2011. [Google Scholar]
  56. Benedet, L.; Ferreira, G.W.; Brunetto, G.; Loss, A.; Lovato, P.E.; Lourenzi, C.R.; Silva, H.G.; Curi, N.; Comin, J.J. Use of Swine Manure in Agriculture in Southern Brazil: Fertility or Potential Contamination? J. Soil Contam. 2020, 1, 1–27. [Google Scholar] [CrossRef]
  57. INMET. Instituto Nacional de Meteorologia. Normais Climatológicas do Brasil, 1981–2010, Brasília. 2020. Available online: https://portal.inmet.gov.br/normais (accessed on 15 September 2021).
  58. United States Department of Agriculture, Soil Survey Staff. Keys to Soil Taxonomy, 12th ed.; United States Department of Agriculture: Washington, DC, USA, 2014.
  59. WRB—IUSS Working Group. World Reference Base for Soil Resources 2014, Update 2015; International Soil Classification System for Naming Soils and Creating Legends for Soil Maps; FAO: Rome, Italy, 2015; World Soil Resources Reports, 106. [Google Scholar]
  60. Santos, H.G.; Jacomine, P.K.T.; Anjos, L.H.C.; Oliveira, V.A.; Lumbreras, J.F.; Coelho, M.R.; Almeida, J.A.; Araujo Filho, J.C.; Oliveira, J.B.; Cunha, T.J.F. Sistema Brasileiro de Classificação de Solos, 5th ed.; Embrapa: Brasília, Brasil, 2018. [Google Scholar]
  61. Tedesco, M.J.; Gianello, C.; Bissani, C.A.; Bohnen, H.; Volkweiss, S.J. Análise de Solo, Plantas e Outros Materiais, 2nd ed.; Universidade Federal do Rio Grande do Sul, Departamento de Solos: Porto Alegre, Brasil, 1995; 118p, (UFRGS. Boletim Técnico, 5). [Google Scholar]
  62. Embrapa—Empresa Brasileira de Pesquisa Agropecuária. Manual de Métodos de Análises de Solo, 2nd ed.; Rio de Janeiro; Ministério da Agricultura, Pecuária e Abastecimento: Rio de Janeiro, Brasil, 1997; 212p. [Google Scholar]
  63. Sisti, C.P.J.; Santos, H.P.; Kohhan, R.; Alves, B.J.R.; Urquiaga, S.; Bodey, R.M. Change in carbon and nitrogen stocks in soil under 13 years of conventional or zero tillage in Southern Brazil. Soil Tillage Res. 2004, 76, 39–58. [Google Scholar] [CrossRef]
  64. Ferreira, D.F. SISVAR: Um sistema de análise de computador para efeitos fixos projetos de tipo de partida dividida. Rev. Bras. De Biom. 2019, 37, 529–535. [Google Scholar] [CrossRef]
  65. R Core Team. R: A Language and Environment for Statistical Computing; R. Foundation Statistical Computing: Vienna, Austria, 2020; Available online: https://www.R-project.org (accessed on 15 July 2022).
  66. Adeli, A.; Bolster, C.H.; Rowe, D.E.; Mclaughlin, M.R.; Brink, G.E. Effect of long-term swine effluent application on selected soil properties. Soil Sci. 2008, 173, 223–235. [Google Scholar] [CrossRef]
  67. Basso, C.J.; Ceretta, C.A.; Durigon, R.; Poletto, N.; Girotto, E. Dejeto líquido de suínos: II—perdas de nitrogênio e fósforo por percolação no solo sob plantio direto. Ciência Rural 2005, 35, 1305–11312. [Google Scholar] [CrossRef]
  68. Grohskopf, M.A.; Cassol, P.C.; Correa, J.C.; Mafra, M.S.H.; Panisson, J. Organic nitrogen in a Typic Hapludox fertilized with pig slurry. Rev. Bras. Ciên. Solo 2015, 39, 127–139. [Google Scholar] [CrossRef]
  69. Ceretta, C.A.; Girotto, E.; Lourenzi, C.R.; Trentin, G.; Vieira, R.C.B.; Brunetto, G. Nutrient transfer by runoff under no tillage in a soil treated with successive applications of pig slurry. Agric. Ecosyst. Environ. 2010, 139, 689–699. [Google Scholar] [CrossRef]
  70. Lourenzi, C.R.; Ceretta, C.A.; Brunetto, G.; Girotto, E.; Tiecher, T.L.; Vieira, R.C.; Cancian, A.; Ferreira, P.A. Pig slurry and nutrient accumulation and dry matter and grain yield in various crops. Rev. Bras. Cienc. Solo 2014, 38, 949–958. [Google Scholar] [CrossRef]
  71. Lourenzi, C.R.; Ceretta, C.A.; Silva, L.S.; Girotto, E.; Lorensini, F.; Tiecher, T.L.; De Conti, L.; Trentin, G.; Brunetto, G. Nutrients in soil layers under no-tillage after successive pig slurry applications. Rev. Bras. Cienc. Solo 2013, 37, 157–167. [Google Scholar] [CrossRef]
  72. Arruda, C.A.O.; Alves, M.V.; Mafra, A.L.; Cassol, P.C.; Albuquerque, J.A.; Santos, J.C.P. Aplicação de dejeto suíno e estrutura de um Latossolo Vermelho sob semeadura direta. Ciên. Agrárias 2010, 34, 804–809. [Google Scholar] [CrossRef]
  73. Oliveira, D.A.; Pinheiro, A.; Veiga, M. Effects of pig slurry application on soil physical and chemical properties and glyphosate mobility. Rev. Bras. Cienc. Solo 2014, 38, 1421–1431. [Google Scholar] [CrossRef] [Green Version]
  74. Mallmann, F.J.K.; Dos Santos, D.R.; Bender, M.A.; Gubiani, E.; Da Viega, M.; Minella, J.P.G.; Van Oort, F.; Šimůnek, J. Modeling zinc and copper movement in an Oxisol under longterm pig slurry amendments. Vadose Zone J. 2017, 16. [Google Scholar] [CrossRef]
  75. Andrade, A.P.; Rauber, L.P.; Mafra, A.L.; Baretta, D.; Rosa, M.G.; Friederichs, A.; Mafra, M.S.H.; Casara, A.C. Changes in physical properties and organic carbon of a Kandiudox fertilized with manure. Cienc. Rural 2016, 46, 809–814. [Google Scholar] [CrossRef]
  76. Bandeira, D.H.; Bertol, I.; Vázquez, E.V.; Ramos, J.C.; Bertol, C. Impact of pig slurry application on soil and water losses: Comparison with a historical series. Rev. Bras. Eng. Agric. Amb. 2019, 23, 425–431. [Google Scholar] [CrossRef]
  77. Reichert, J.M.; Suzuki, L.E.A.S.; Reinert, D.J.; Horn, R.; Hakansson, I. Reference bulk density and critical degree-of-compactness for no-till crop production in subtropical highly weathered soils. Soil Tillage Res. 2009, 102, 242–254. [Google Scholar] [CrossRef]
  78. MANITOBA—Agriculture, Food, and Rural Initiatives. Effects of Manure and Fertilizer on Soil Fertility and Soil Quality; Manitoba Agriculture, Food and Rural Initiatives: Dugald, MB, Canada, 2013. [Google Scholar]
  79. Peu, P.; Dourmad, J.Y.; Picard, S.; Dabert, P. Contrôler les formes soufrées présentes dans les lisiers de porcs en utilisant l’approche alimentaire. Journées Rech. Porc. 2012, 44, 127–132. [Google Scholar]
  80. Mikkelsen, R.; Norton, R. Soil and Fertilizer Sulfur. Better Crops 2013, 97, 7–9. [Google Scholar]
  81. Balieiro Neto, G.; Cruz, M.C.P.; Ferreira, M.E.; Franco, A.C.B.J.; Nobile, F.O.; Nascimento, R.C. Doses de enxofre na produção de massa seca e concentração de enxofre no capim-tanzânia e capim-Tifton-851. Bol. Ind. Anim. 2008, 65, 63–70. [Google Scholar]
  82. Sileshi, G.W.; Nhamo, N.; Mafongoya, P.L.; Tanimu, J. Stoichiometry of animal manure and implications for nutrient cycling and agriculture in sub-Saharan Africa. Nutr. Cycl. Agroecosys 2017, 107, 91–105. [Google Scholar] [CrossRef]
  83. Bonfim-Silva, E.M.; Monteiro, F.A.; Silva, T.J.A. Nitrogênio e enxofre na produção e no uso de água pelo capim-braquiária em degradação. Rev. Bras. Cienc. Solo 2007, 31, 309–317. [Google Scholar] [CrossRef]
  84. Gomes, J.B.V.; Silva, C.A.; Ferreira, T.L.A.; Ferreira, M.M.; Inda, A.V.; Curi, N. Carbon Stocks and Pools in Relation to the Texture of Kaolinitic Soils from the Brazilian East Coast. Rev. Bras. Cienc. Solo 2018, 42, 1–15. [Google Scholar] [CrossRef]
  85. Plante, A.F.; Conant, R.T.; Stewart, C.E.; Paustian, K.; Six, J. Impact of soil texture on the distribution of soil organic matter in physical and chemical fractions. Soil Sci. Soc. Am. J. 2006, 70, 287–296. [Google Scholar] [CrossRef]
  86. Yagüe, M.R.; Bosch-Serra, A.D.; Antúnez, M.; Boixadera, J. Pig slurry and mineral fertilization strategies’ effects on soil quality: Macroaggregate stability and organic matter fractions. Sci. Total Environ. 2012, 438, 218–224. [Google Scholar] [CrossRef]
  87. Dortzbach, D.; Araujo, I.S.; Pandolfo, C.M.; Da Viega, M. Carbono e nitrogênio no solo e na biomassa microbiana em glebas com diferentes usos e períodos de aplicação de dejetos líquidos de suínos. Rev. Agropecuária Catarin. 2013, 26, 69–73. [Google Scholar]
  88. Venglovsky, J.; Sasakova, N.; Gregova, G.; Papajova, I.; Toth, F.; Szaboova, T. Devitalisation of pathogens in stored pig slurry and potential risk related to its application to agricultural soil. Environ. Sci. Pollut. Res. 2018, 25, 21412–21419. [Google Scholar] [CrossRef] [Green Version]
  89. Andrade, A.P. Estoque e Frações de Carbono e Atributos Físicos em Nitossolo Vermelho Relacionados à Aplicação de Esterco em Sistemas de Produção. Master’s Thesis, Universidade do Estado de Santa Catarina, Florianópolis, Brazil, 2013. [Google Scholar]
  90. Bergström, L.; Kirchmann, H. Leaching and crop uptake of nitrogen and phosphorus from pig slurry as affected by different application rates. J. Environ. Qual. 2006, 35, 1803–1811. [Google Scholar] [CrossRef]
  91. Basso, C.J.; Ceretta, C.A.; Pavinato, O.S.; Silveira, M.J. Perdas de nitrogênio de dejeto líquido de suínos por volatilização de amônia. Ciên. Rural 2004, 34, 1773–1778. [Google Scholar] [CrossRef]
  92. Aita, C.; Giacomini, S.J. Plantas de cobertura de solo em sistemas agrícolas. In Manejo de Sistemas Agrícolas: Impacto no Sequestro de C e nas Emissões de gases de Efeito Estufa; Alves, B.J.R., Urquiaga, S., Aita, C., Boddey, R.M., Jantalia, C.P., Camargo, F.A.O., Eds.; Genesis: Porto Alegre, Brazil, 2006; pp. 59–79. [Google Scholar]
  93. Aita, C.; Chiapinotto, I.C.; Giacomini, S.J.; Hübner, A.P.; Marques, M.G. Decomposição de palha de aveia preta e dejetos de suínos em solo sob plantio direto. Rev. Bras. Cienc. Solo 2006, 30, 149–161. [Google Scholar] [CrossRef]
  94. Ndegwa, P.M.; Hristov, A.N.; Arogo, J.; Sheffield, R.E. A review of ammonia emission mitigation techniques for concentrated animal feeding operations. Biosyst. Eng. 2008, 100, 453–469. [Google Scholar] [CrossRef]
Figure 1. Total dry matter production of Tifton-85 (Cynodon sp.) grown under applications of increasing doses of pig slurry applications (PS) and urea in the 2012/2013 to 2017/2018 agricultural year. Ibirubá, RS, Brazil, 100 = 100 kg ha−1 of N using pig slurry (PS); 200 = 200 kg ha−1 of N using PS; 300 = 300 kg ha−1 of N using PS; 400 = 400 kg ha−1 of N using PS; urea = 200 kg ha−1 of N using urea; 0 = control, no fertilizer application.
Agronomy 12 02058 g001
Figure 2. Relationship between principal component 1 (PC1) and principal component 2 (PC2) for dry matter total (DMP) and C, N, and S stocks. C5, N5, and S5 = stocks in the 0–5 m layer; C10, N10, and S10 = stocks in the 5–10 cm layer; C30, N30, and S30 = stocks in the 10–30 cm layer; C0-30, N0-30, and S0-30 = stocks in the 0–30 cm layer.
Agronomy 12 02058 g002
Table 1. Annual mean minimum and maximum temperature and rainfall depths (mean of 2012/2013 to 2017/2018) in Ibirubá, RS, Brazil.
2012/20132013/20142014/20152015/20162016/20172017/2018
Mean minimum temperature (°C)
18.818.918.717.718.618.0
Mean maximum temperature (°C)
20.220.119.919.019.919.3
Mean rainfall depth (mm)
1479.402048.002421.002034.601515.601963.20
Table 2. Chemical and physical attributes of the 0–10 and 10–20 cm layers of the topsoil (Typic Hapludox) of the experiment area. Ibirubá, RS, Brazil.
Layer (cm)pH (H2O)pH (SMP)CaMgAlH+AlPKSOC
(%)
Clay
(%)
Silt (%)Sand (%)
(cmolc kg−1)(mg kg−1)
0–105.86.09.85.90.04.4502884.3462034
10–205.25.74.93.10.56.2232322.6591526
pH H2O determined in a soil to water ratio of 1:1; pH SMP was determined in Ca acetate buffer pH 7.5; H + Al determined based on the SMP index; SOC (soil organic carbon) determined by the dry combustion method, using an autoanalyzer (LECO TruSpec CHNS); P available and K exchangeable was extracted with Mehlich-1.
Table 3. Characteristics of the pig slurry (PS) used (mean of evaluations from 2012 to 2019); data expressed on a wet basis). Ibirubá, RS, Brazil.
Dry Matter (%)pHC
(g kg−1)
Total N
(g kg−1)
TAN
(g kg−1)
C to N
ratio
Total P
(g kg−1)
K
(g kg−1)
2.717.3030.103.232.389.320.0100.049
TAN = total ammonia N (NH3, NH4+).
Table 4. Soil bulk density, and carbon, nitrogen, and sulfur contents after application of organic (pig slurry; PS) and mineral (urea; Min200) fertilizers. Ibirubá, Rio Grande do Sul, Brazil.
TreatmentSoil Layers (cm)
0 to 55 to 1010 to 30
Soil bulk density (g cm−3)
PS1001.09 a1.27 a1.27 a
PS2001.01 a1.22 a0.95 b
PS3000.99 a1.17 a1.13 a
PS4001.04 a1.22 a1.12 a
Min2001.04 a1.34 a1.20 a
Control1.07 a1.24 a1.18 a
CV (%)7.908.686.34
Soil organic carbon (g kg−1)
PS10035.87 b22.25 b15.86 a
PS20039.06 a21.06 b15.49 a
PS30035.82 b22.78 b16.79 a
PS40040.82 a31.29 a16.88 a
Min20030.07 c22.50 b16.93 a
Control25.98 c21.45 b16.97 a
CV (%)8.3512.216.26
Soil total nitrogen (g kg−1)
PS1002.70 b2.17 b1.63 b
PS2003.51 a2.24 b1.46 b
PS3003.07 a2.14 b1.77 a
PS4003.24 a2.84 a1.76 a
Min2003.48 a2.07 b1.63 b
Control2.50 b2.09 b1.75 a
CV (%)14.0211.736.85
Soil total sulfur (g kg−1)
PS1000.43 b0.29 b0.43 a
PS2000.48 b0.29 b0.32 b
PS3000.59 a0.46 a0.46 a
PS4000.67 a0.51 a0.28 b
Min2000.43 b0.25 b0.21 b
Control0.48 b0.28 b0.22 b
CV (%)21.2936.5826.16
Means followed by the same letter in the columns within each variable are not different from each other by the Scott–Knott test (p < 0.05). PS100 = 100 kg ha−1 of N using pig slurry (PS); PS200 = 200 kg ha−1 of N using PS; PS300 = 300 kg ha−1 of N using PS; PS400 = 400 kg ha−1 of N using PS; Min200 = 200 kg ha−1 of N using urea; Control = no fertilizer application.
Table 5. Soil carbon, nitrogen, and sulfur stocks after application of organic (pig slurry; PS) and mineral (urea; Min200) fertilizers. Ibirubá, Rio Grande do Sul, Brazil.
TreatmentSoil Layers (cm)
0 to 55 to 1010 to 300 to 30
Soil organic carbon stocks (Mg ha−1)
PS10019.57 a14.14 b40.10 a73.80 a
PS20019.79 a12.85 b39.47 a72.11 a
PS30019.76 a13.34 b37.86 a70.95 a
PS40021.18 a19.33 a37.81 a78.32 a
Min20015.69 b15.16 b40.67 a71.52 a
Control13.83 b13.38 b37.01 a64,22 b
CV (%)8.7419.186.908.78
Soil total nitrogen stocks (Mg ha−1)
PS1001.57 a1.38 b4.11 a7.06 a
PS2001.78 a1.36 b3.88 a7.02 a
PS3001.52 a1.26 b3.98 a6.76 a
PS4001.68 a1.75 a3.94 a7.37 a
Min2001.81 a1.28 b3.90 a6.99 a
Control1.24 b1.30 b4.25 a6.79 a
CV (%)9.0214,237.259.28
Soil total sulfur stocks (Mg ha−1)
PS1000.23 a0.19 b1.09 a1.51 a
PS2000.29 a0.18 b1.04 a1.51 a
PS3000.29 a0.27 a1.03 a1.59 a
PS4000.35 a0.31 a0.63 b1.29 a
Min2000.22 a0.17 b0.51 b0.90 b
Control0.26 a0.17 b0.53 b0.96 b
CV (%)22.8223.8621.3320.68
Means followed by the same letter in the columns within each variable are not different from each other by the Scott–Knott test (p < 0.05). PS100 = 100 kg ha−1 of N using pig slurry (PS); PS200 = 200 kg ha−1 of N using PS; PS300 = 300 kg ha−1 of N using PS; PS400 = 400 kg ha−1 of N using PS; Min200 = 200 kg ha−1 of N using urea; Control = no fertilizer application.
Publisher’s Note: MDPI stays neutral with regard to jurisdictional claims in published maps and institutional affiliations.

