
Effective Practical Solutions for De-Icing of Automotive Component

 ,
,  , , ,
, , , 
Abstract
:1. Introduction
2. Materials and Methods
2.1. Materials
2.2. Production of Nano-Composites
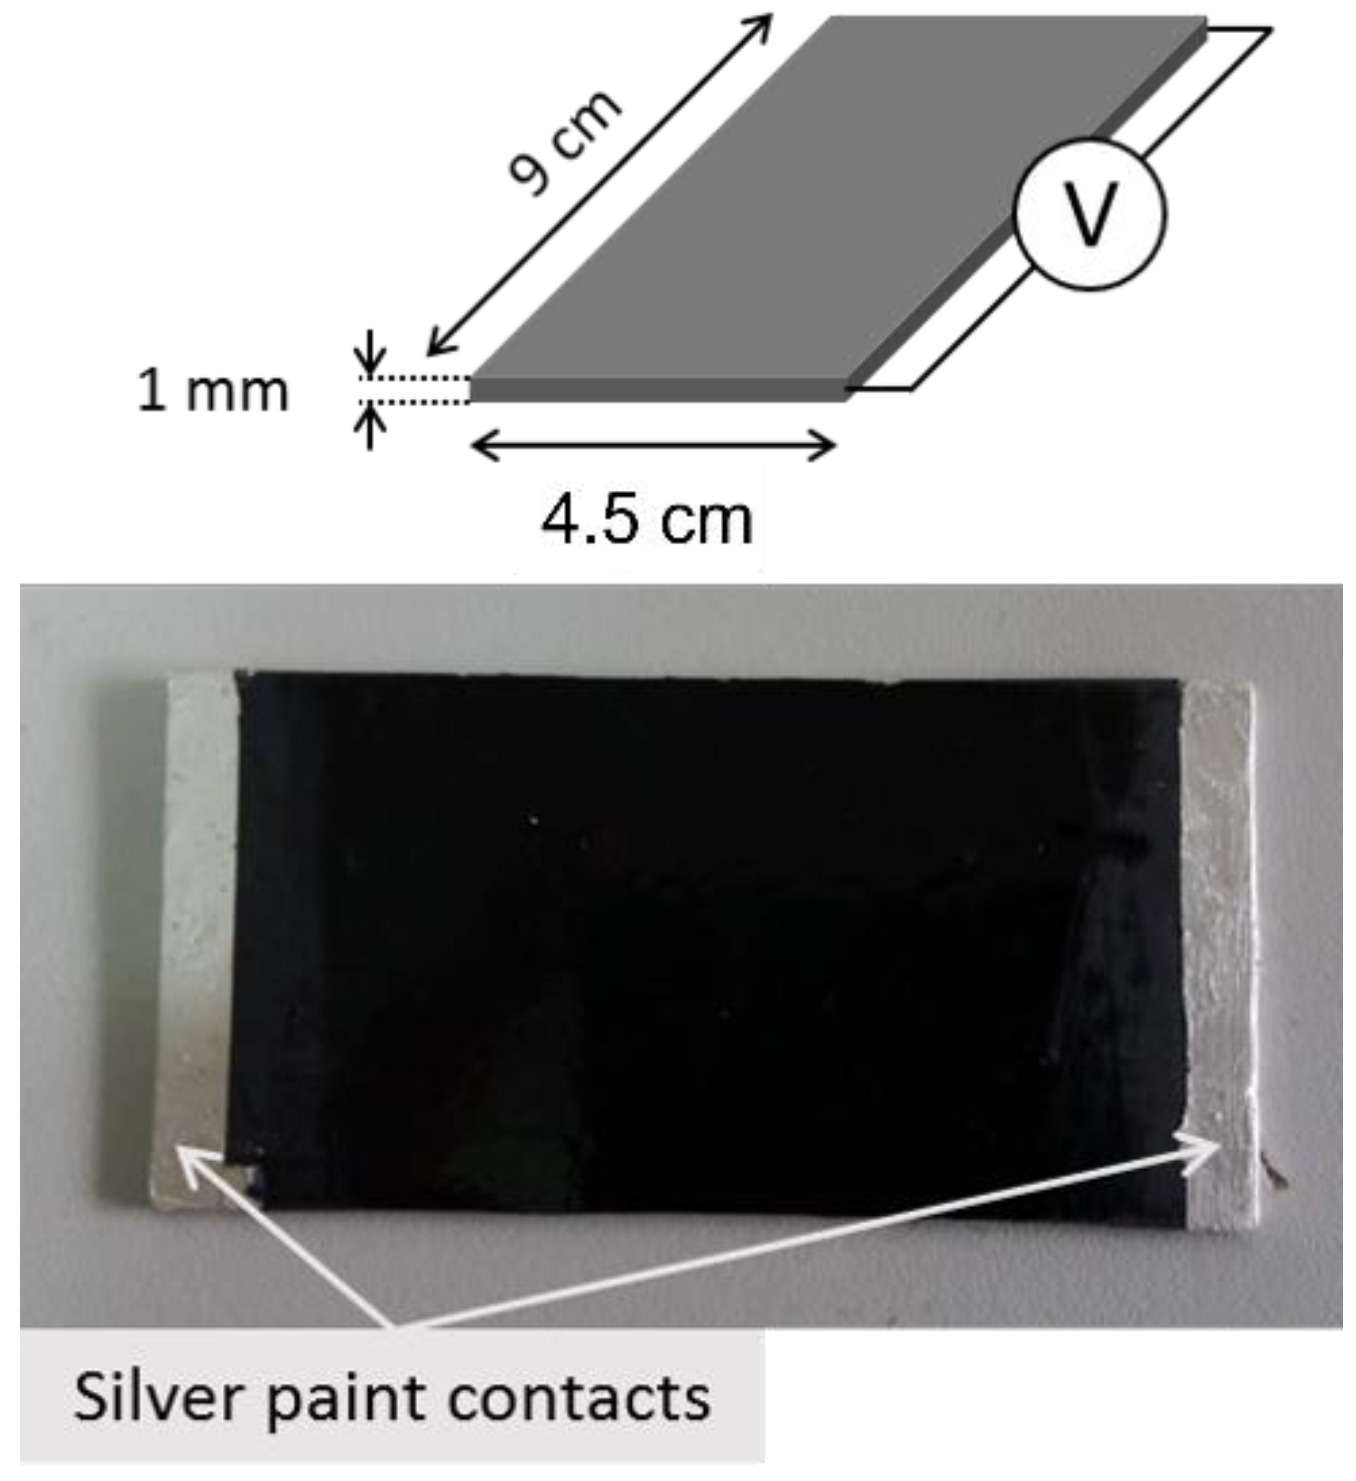
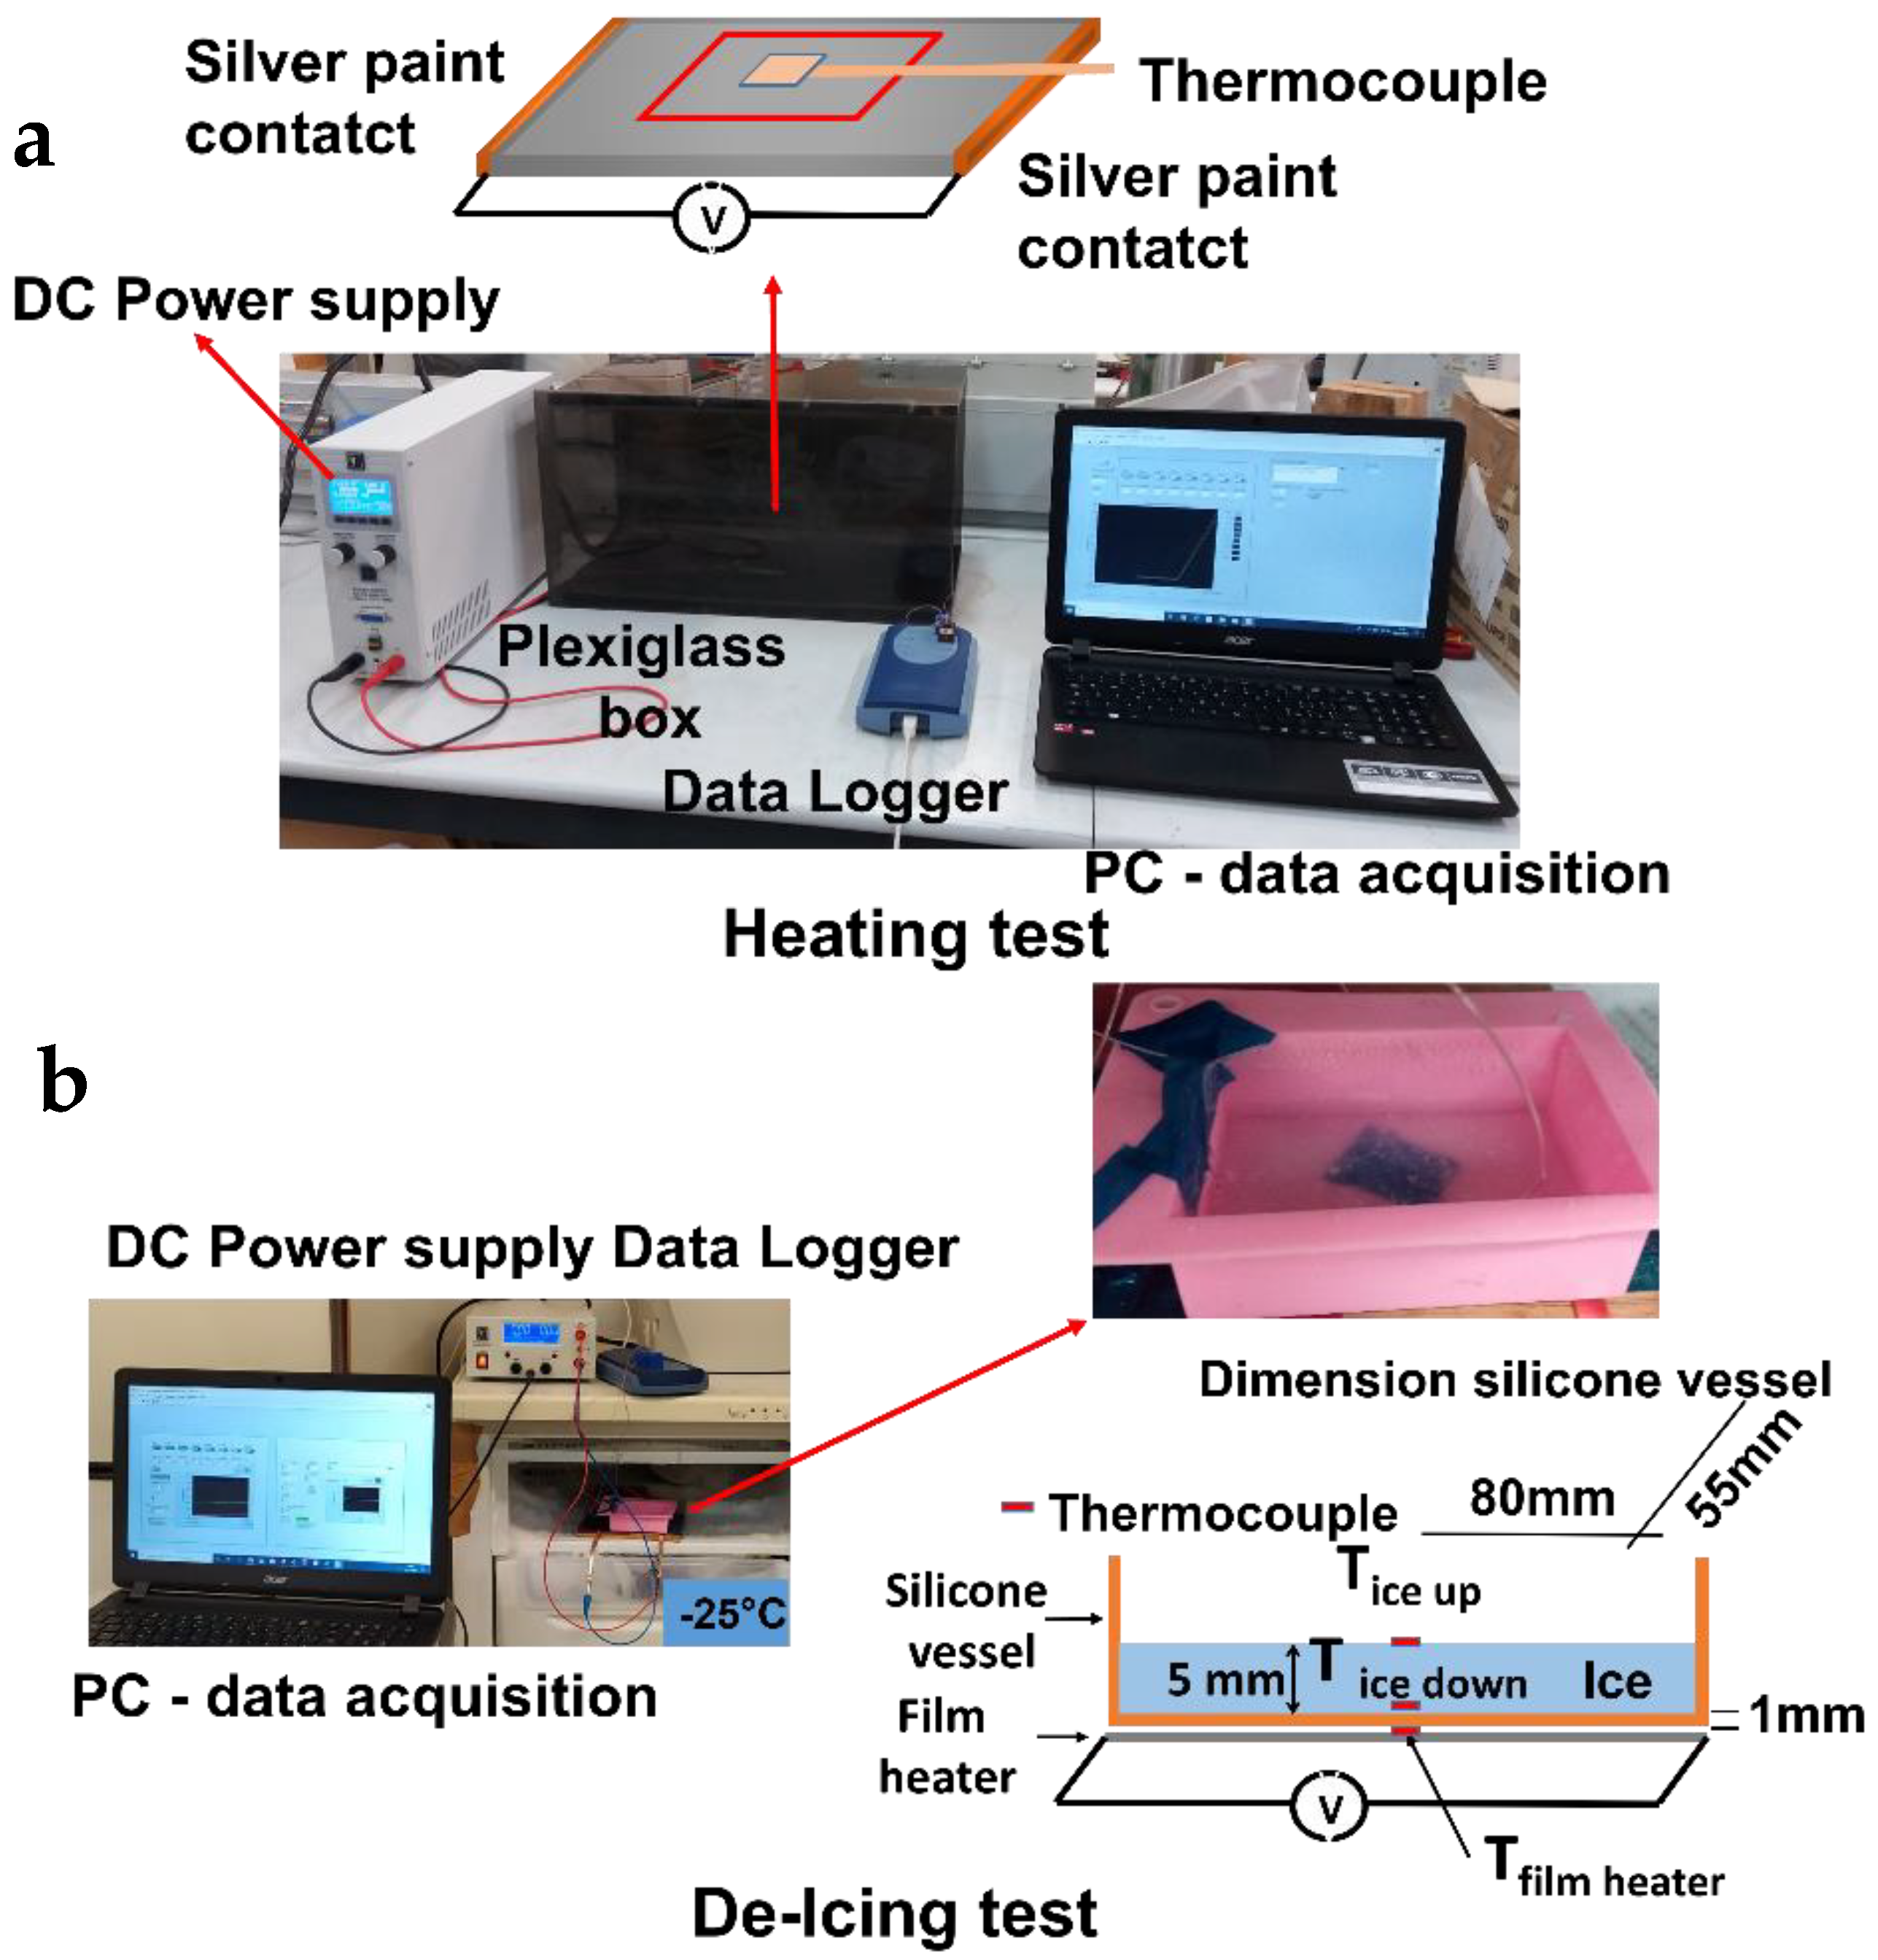
2.3. Methods
3. Results
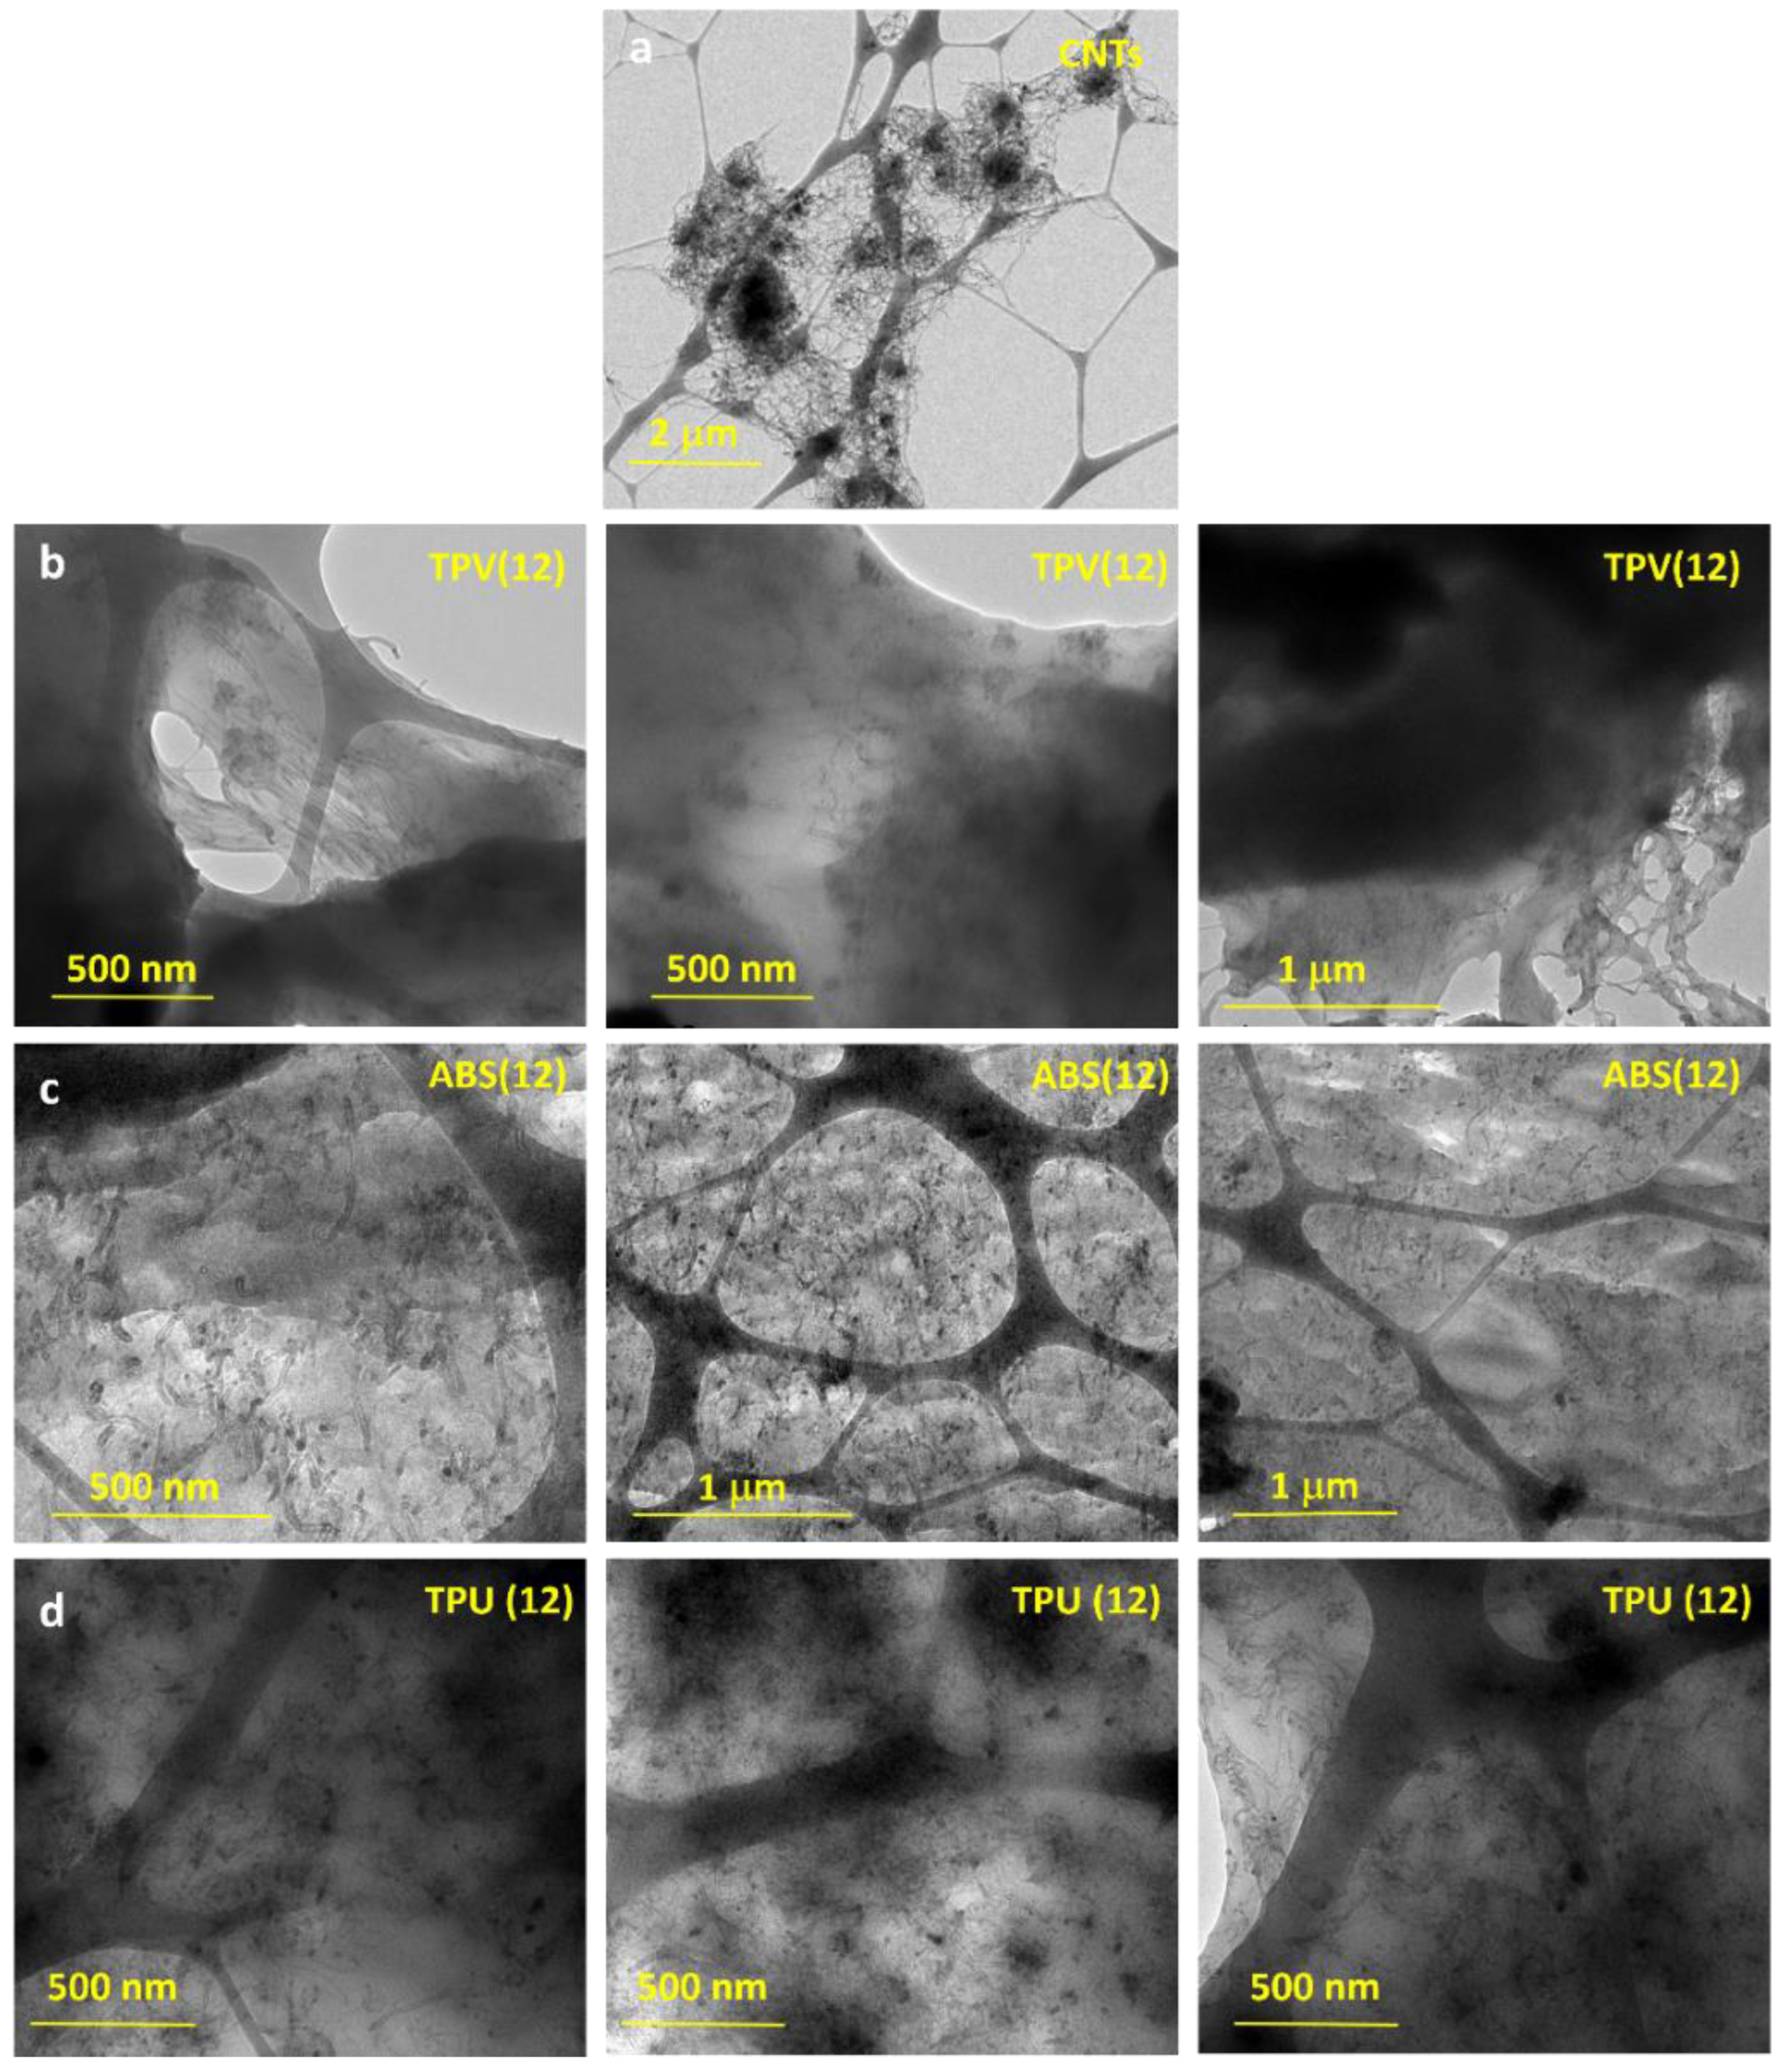
3.1. TEM Micrographs
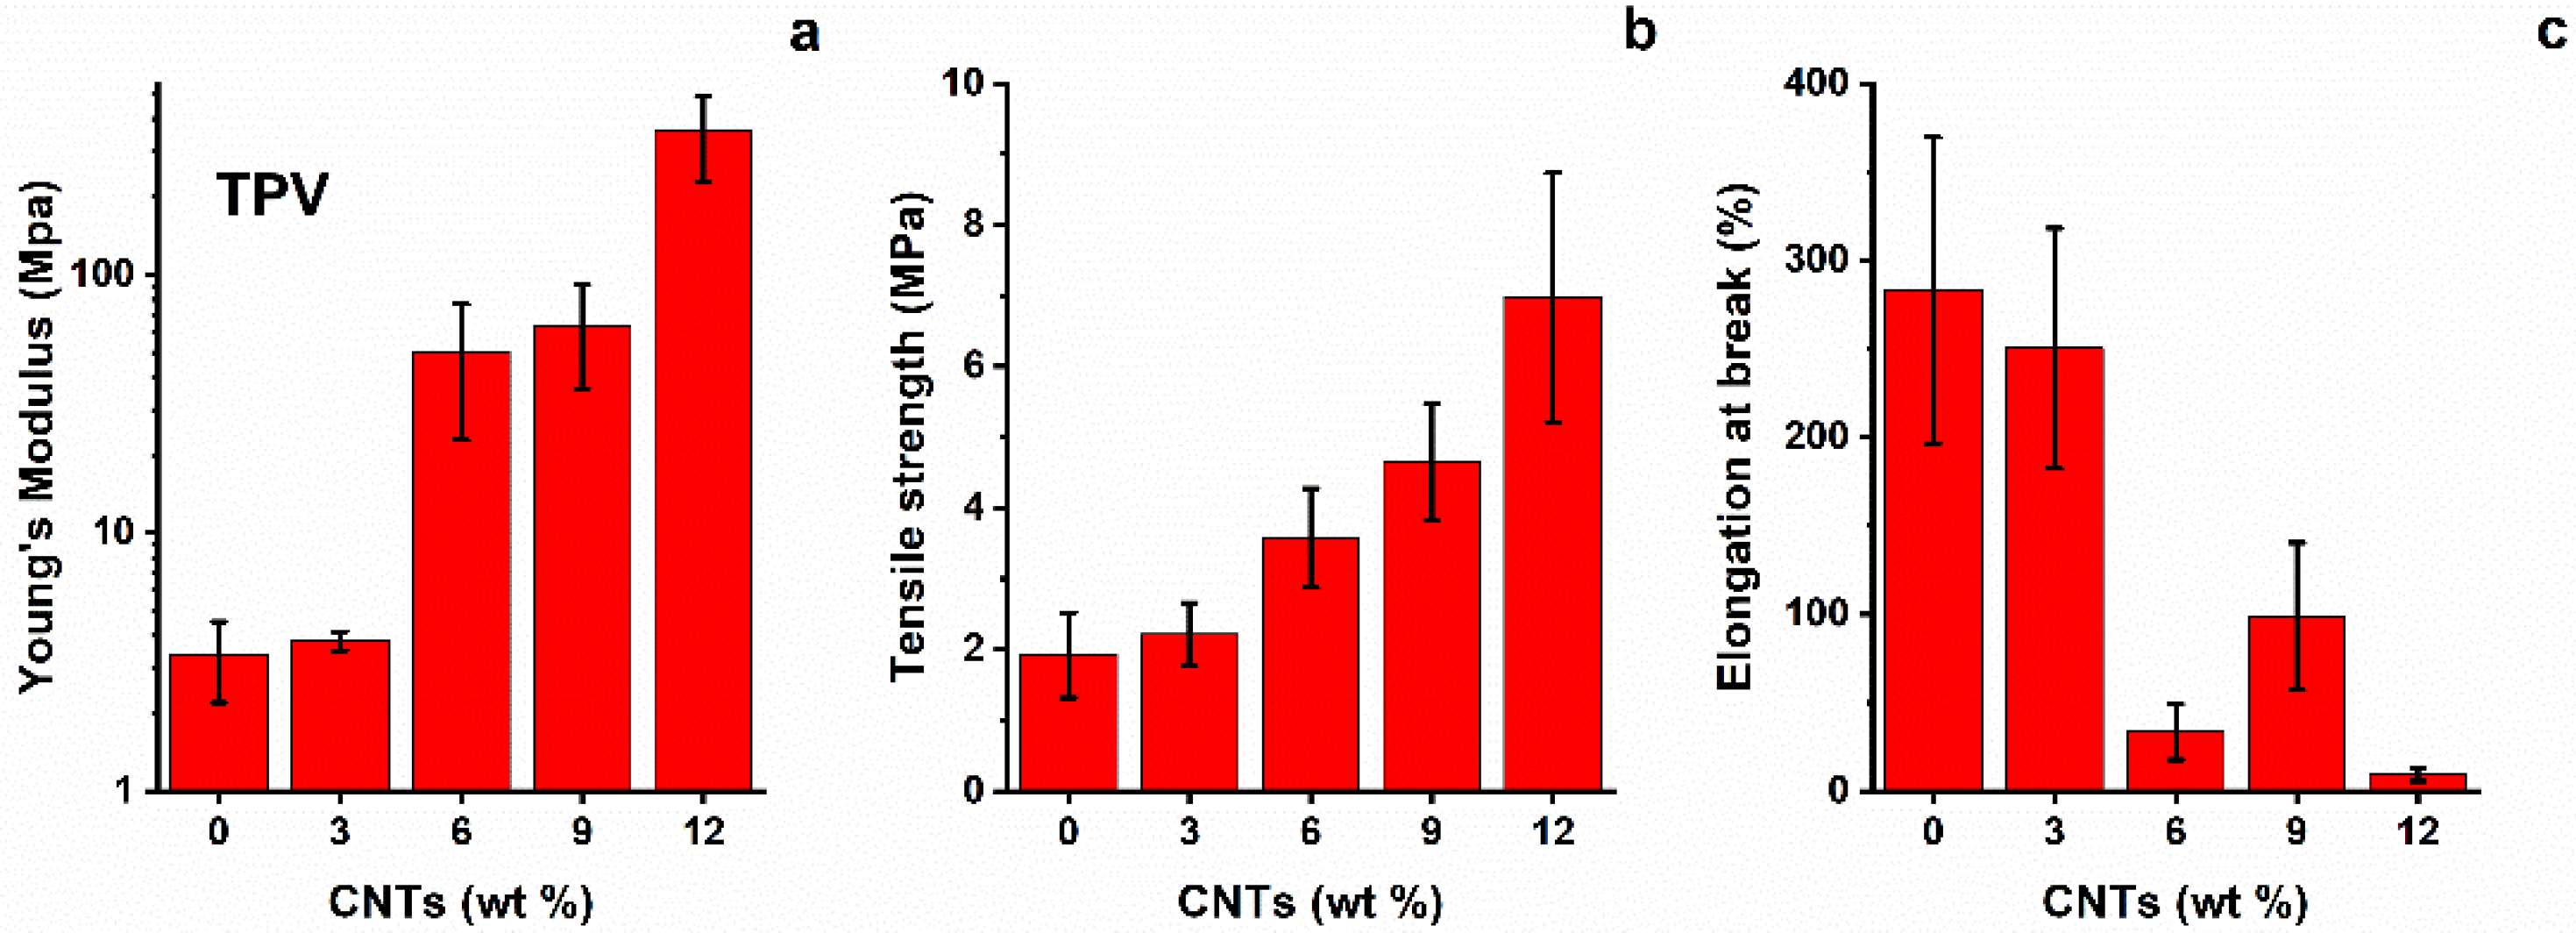
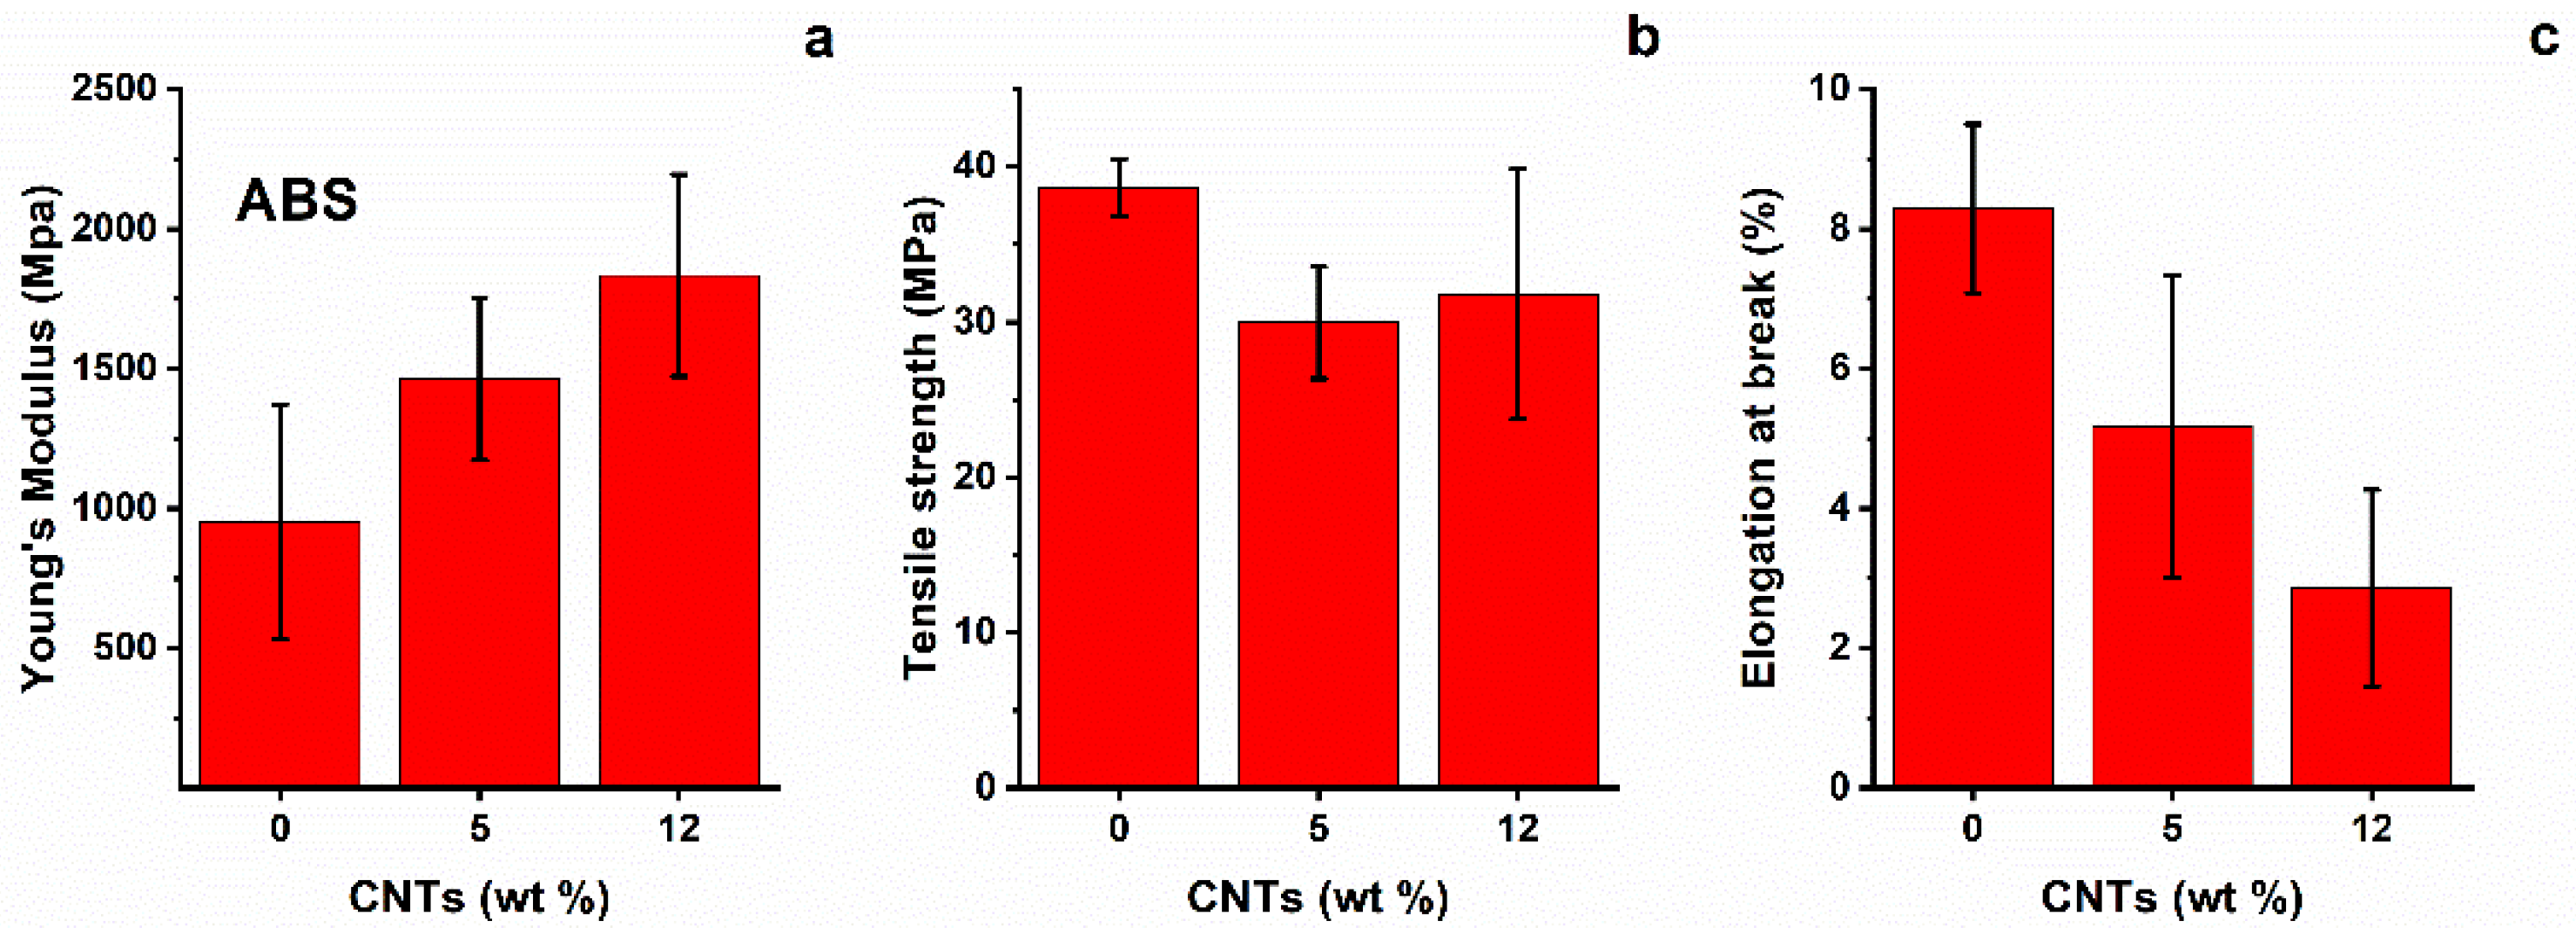
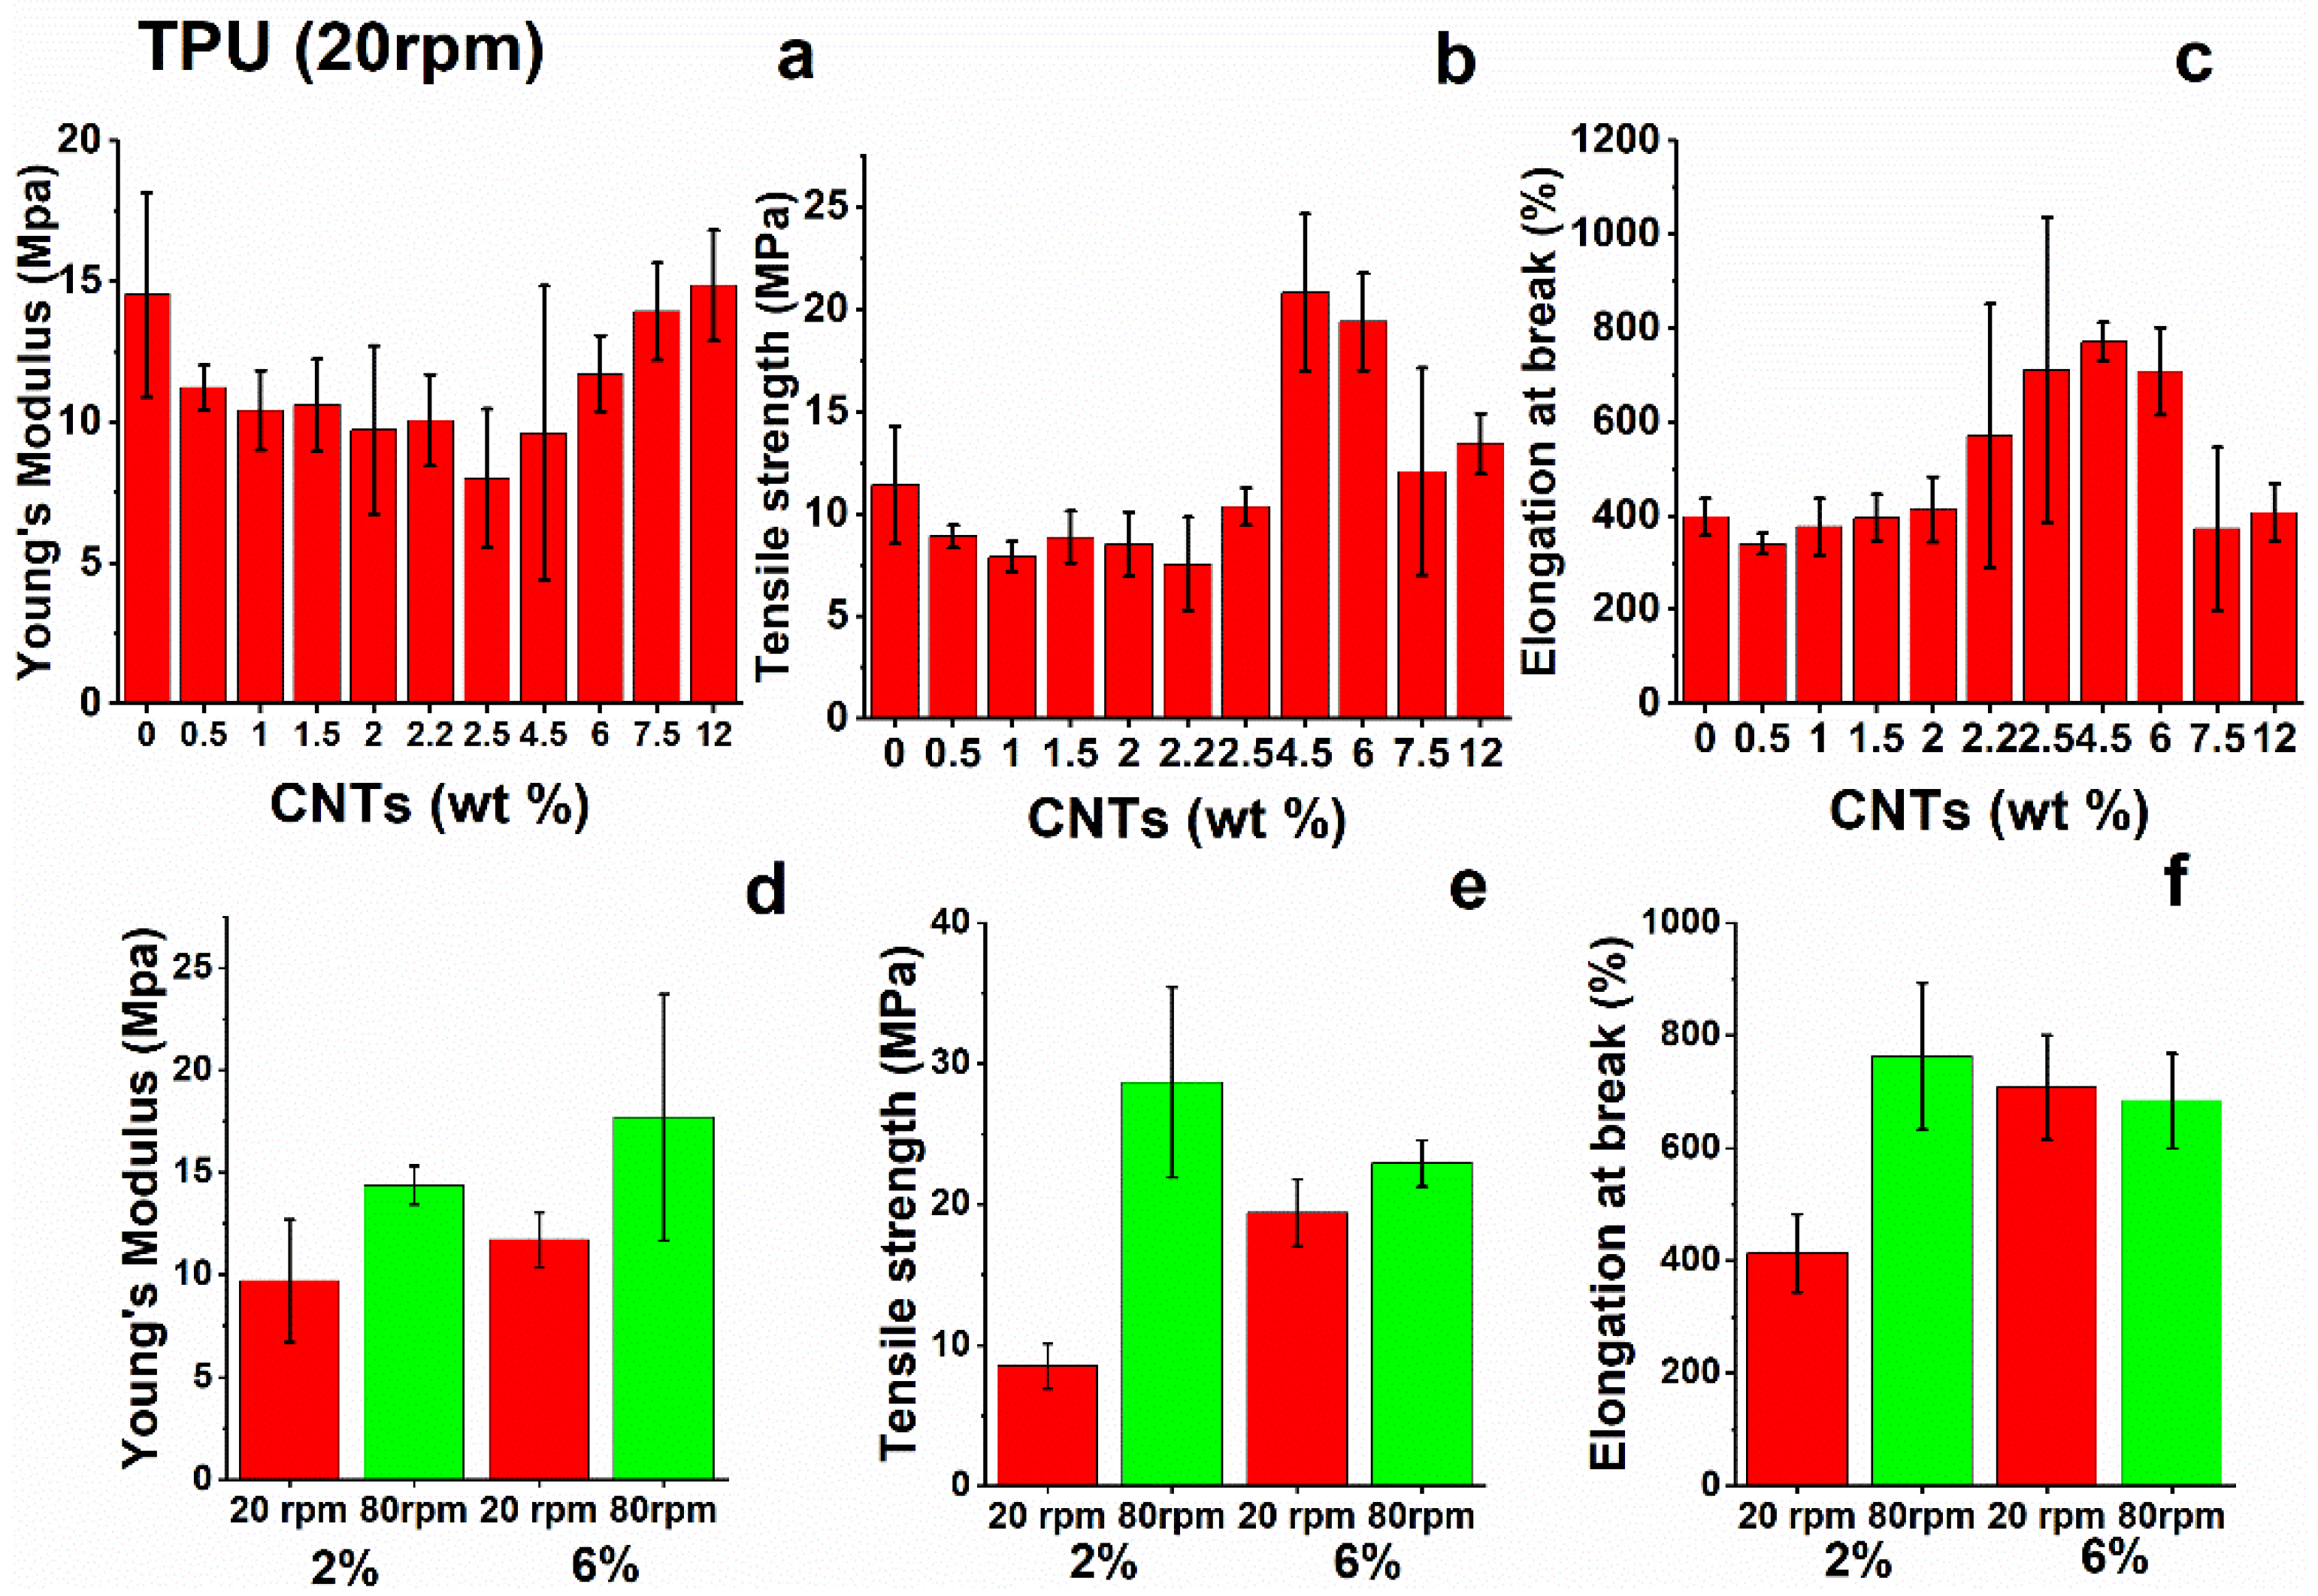
3.2. Tensile Tests
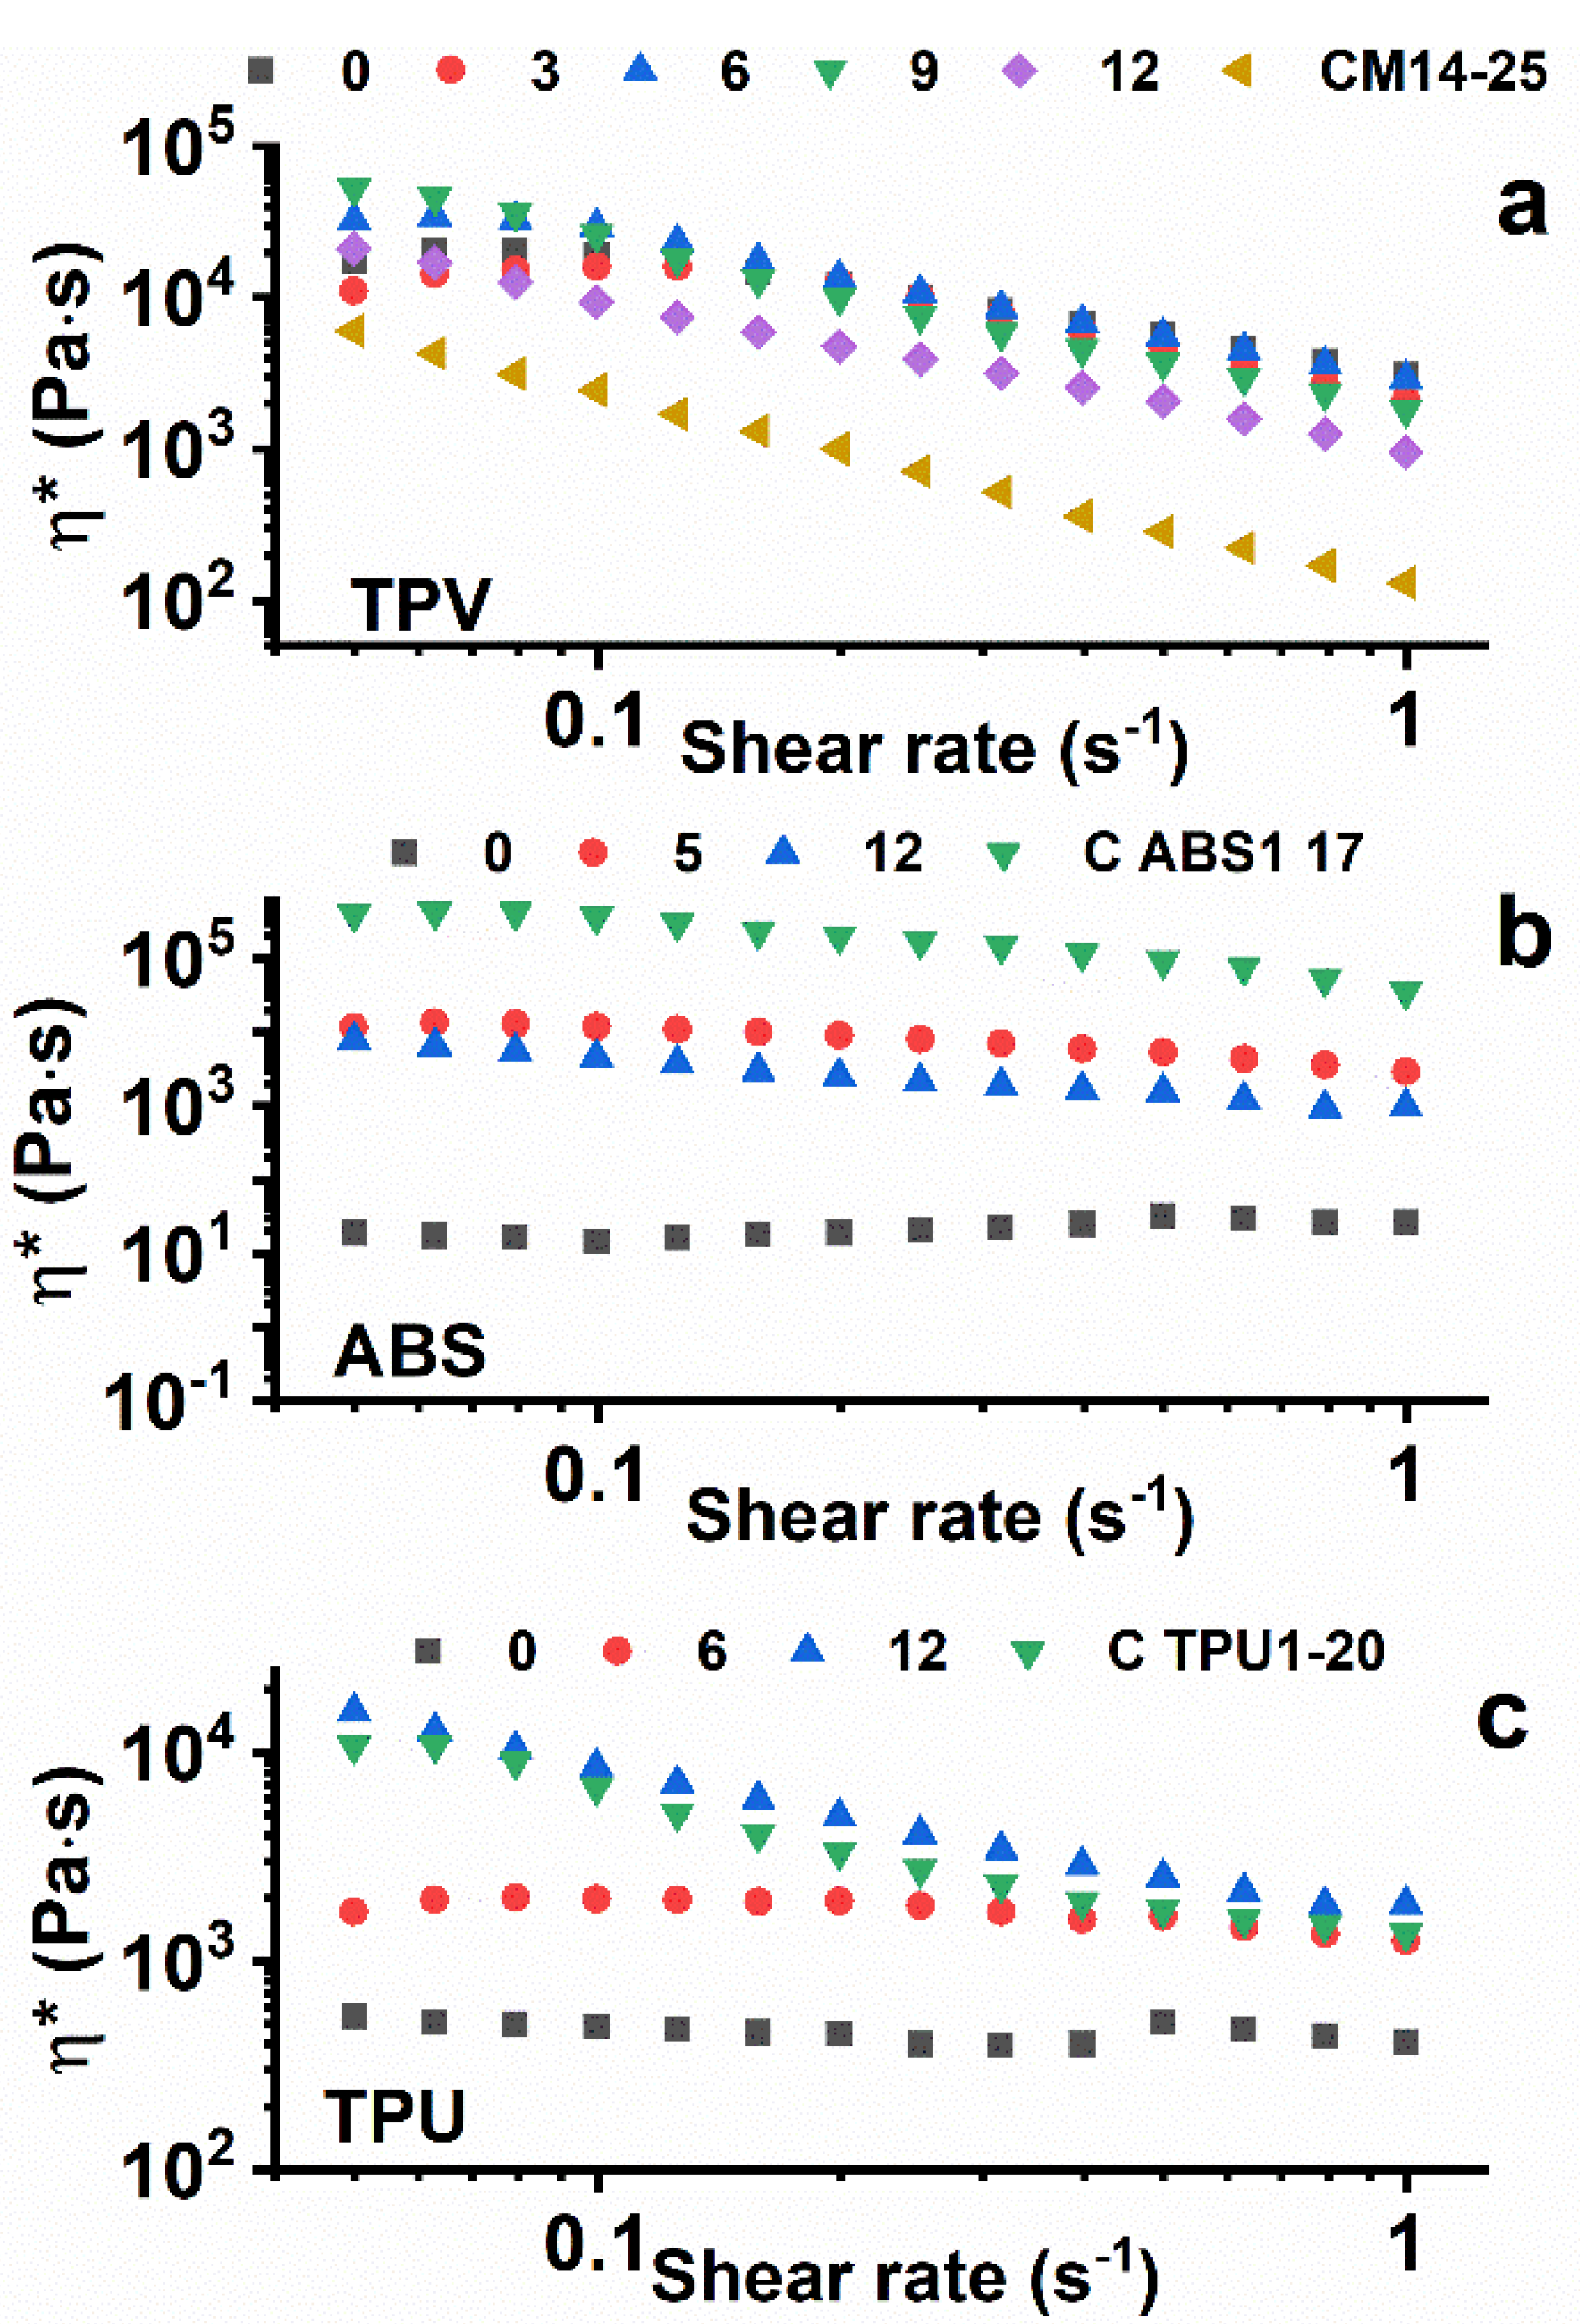
3.3. Rheological Measurements
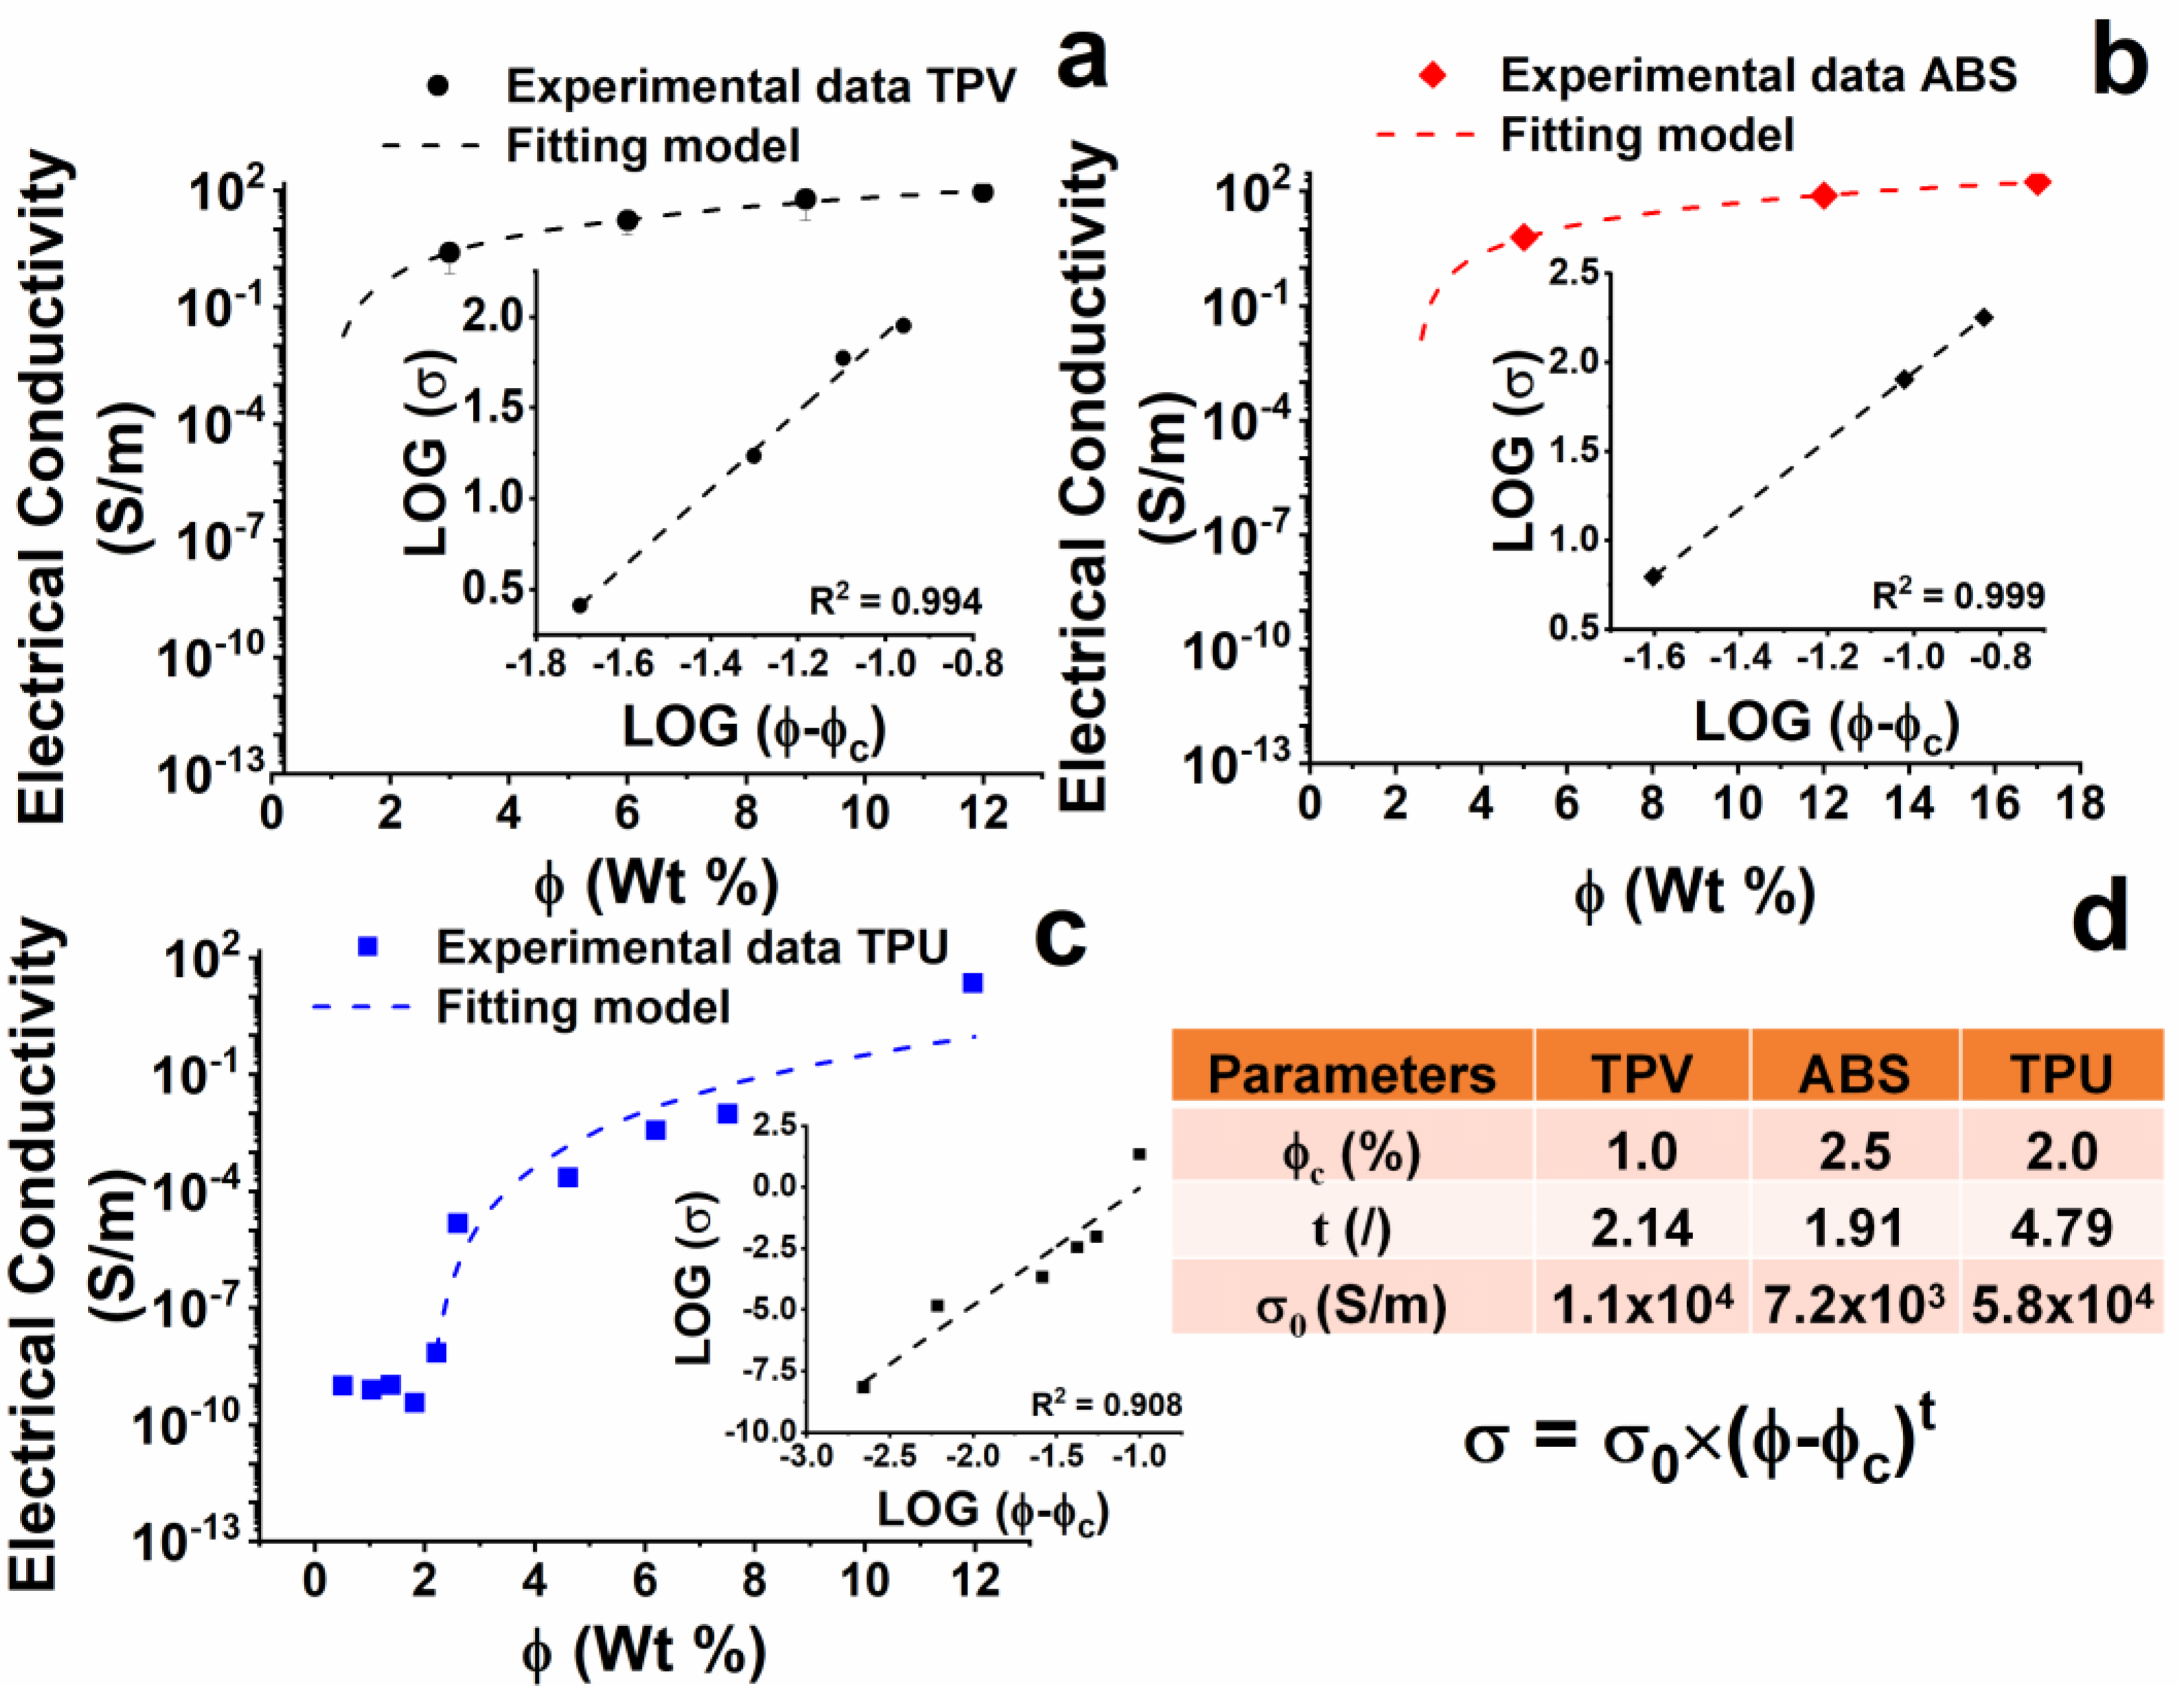
3.4. Electrical Conductivity Measurements
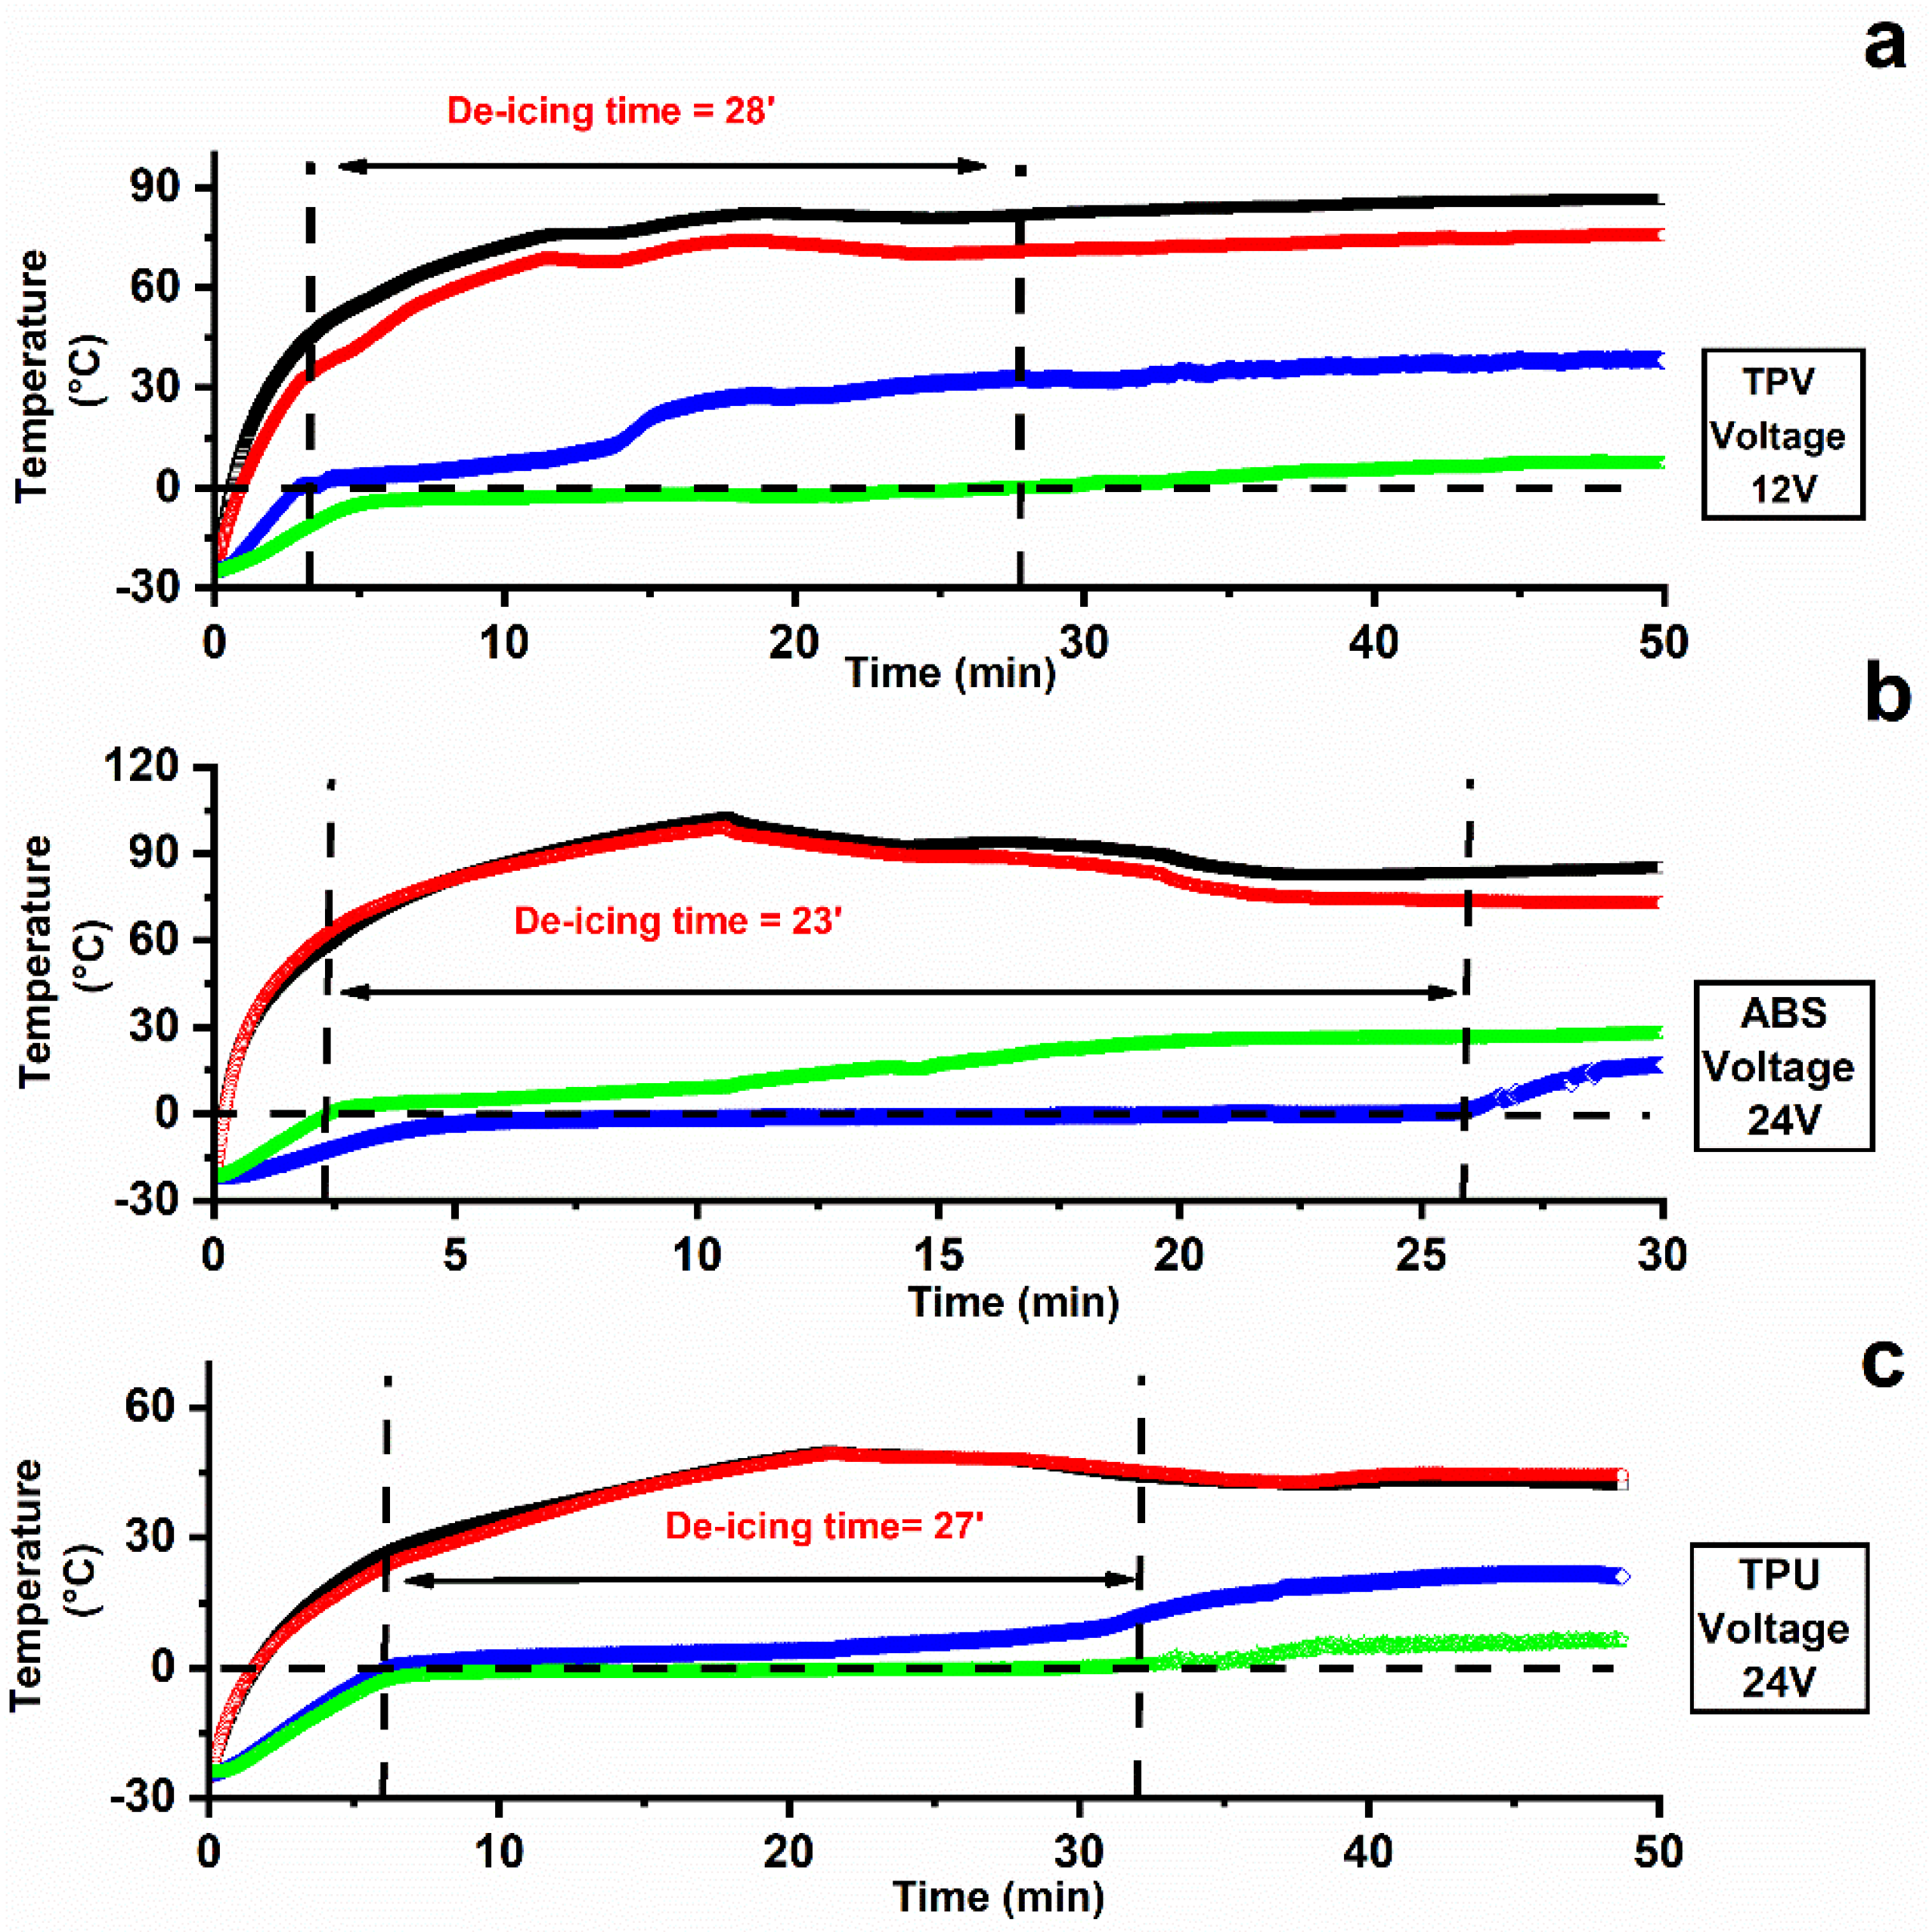
3.5. Heating and De-Icing Tests
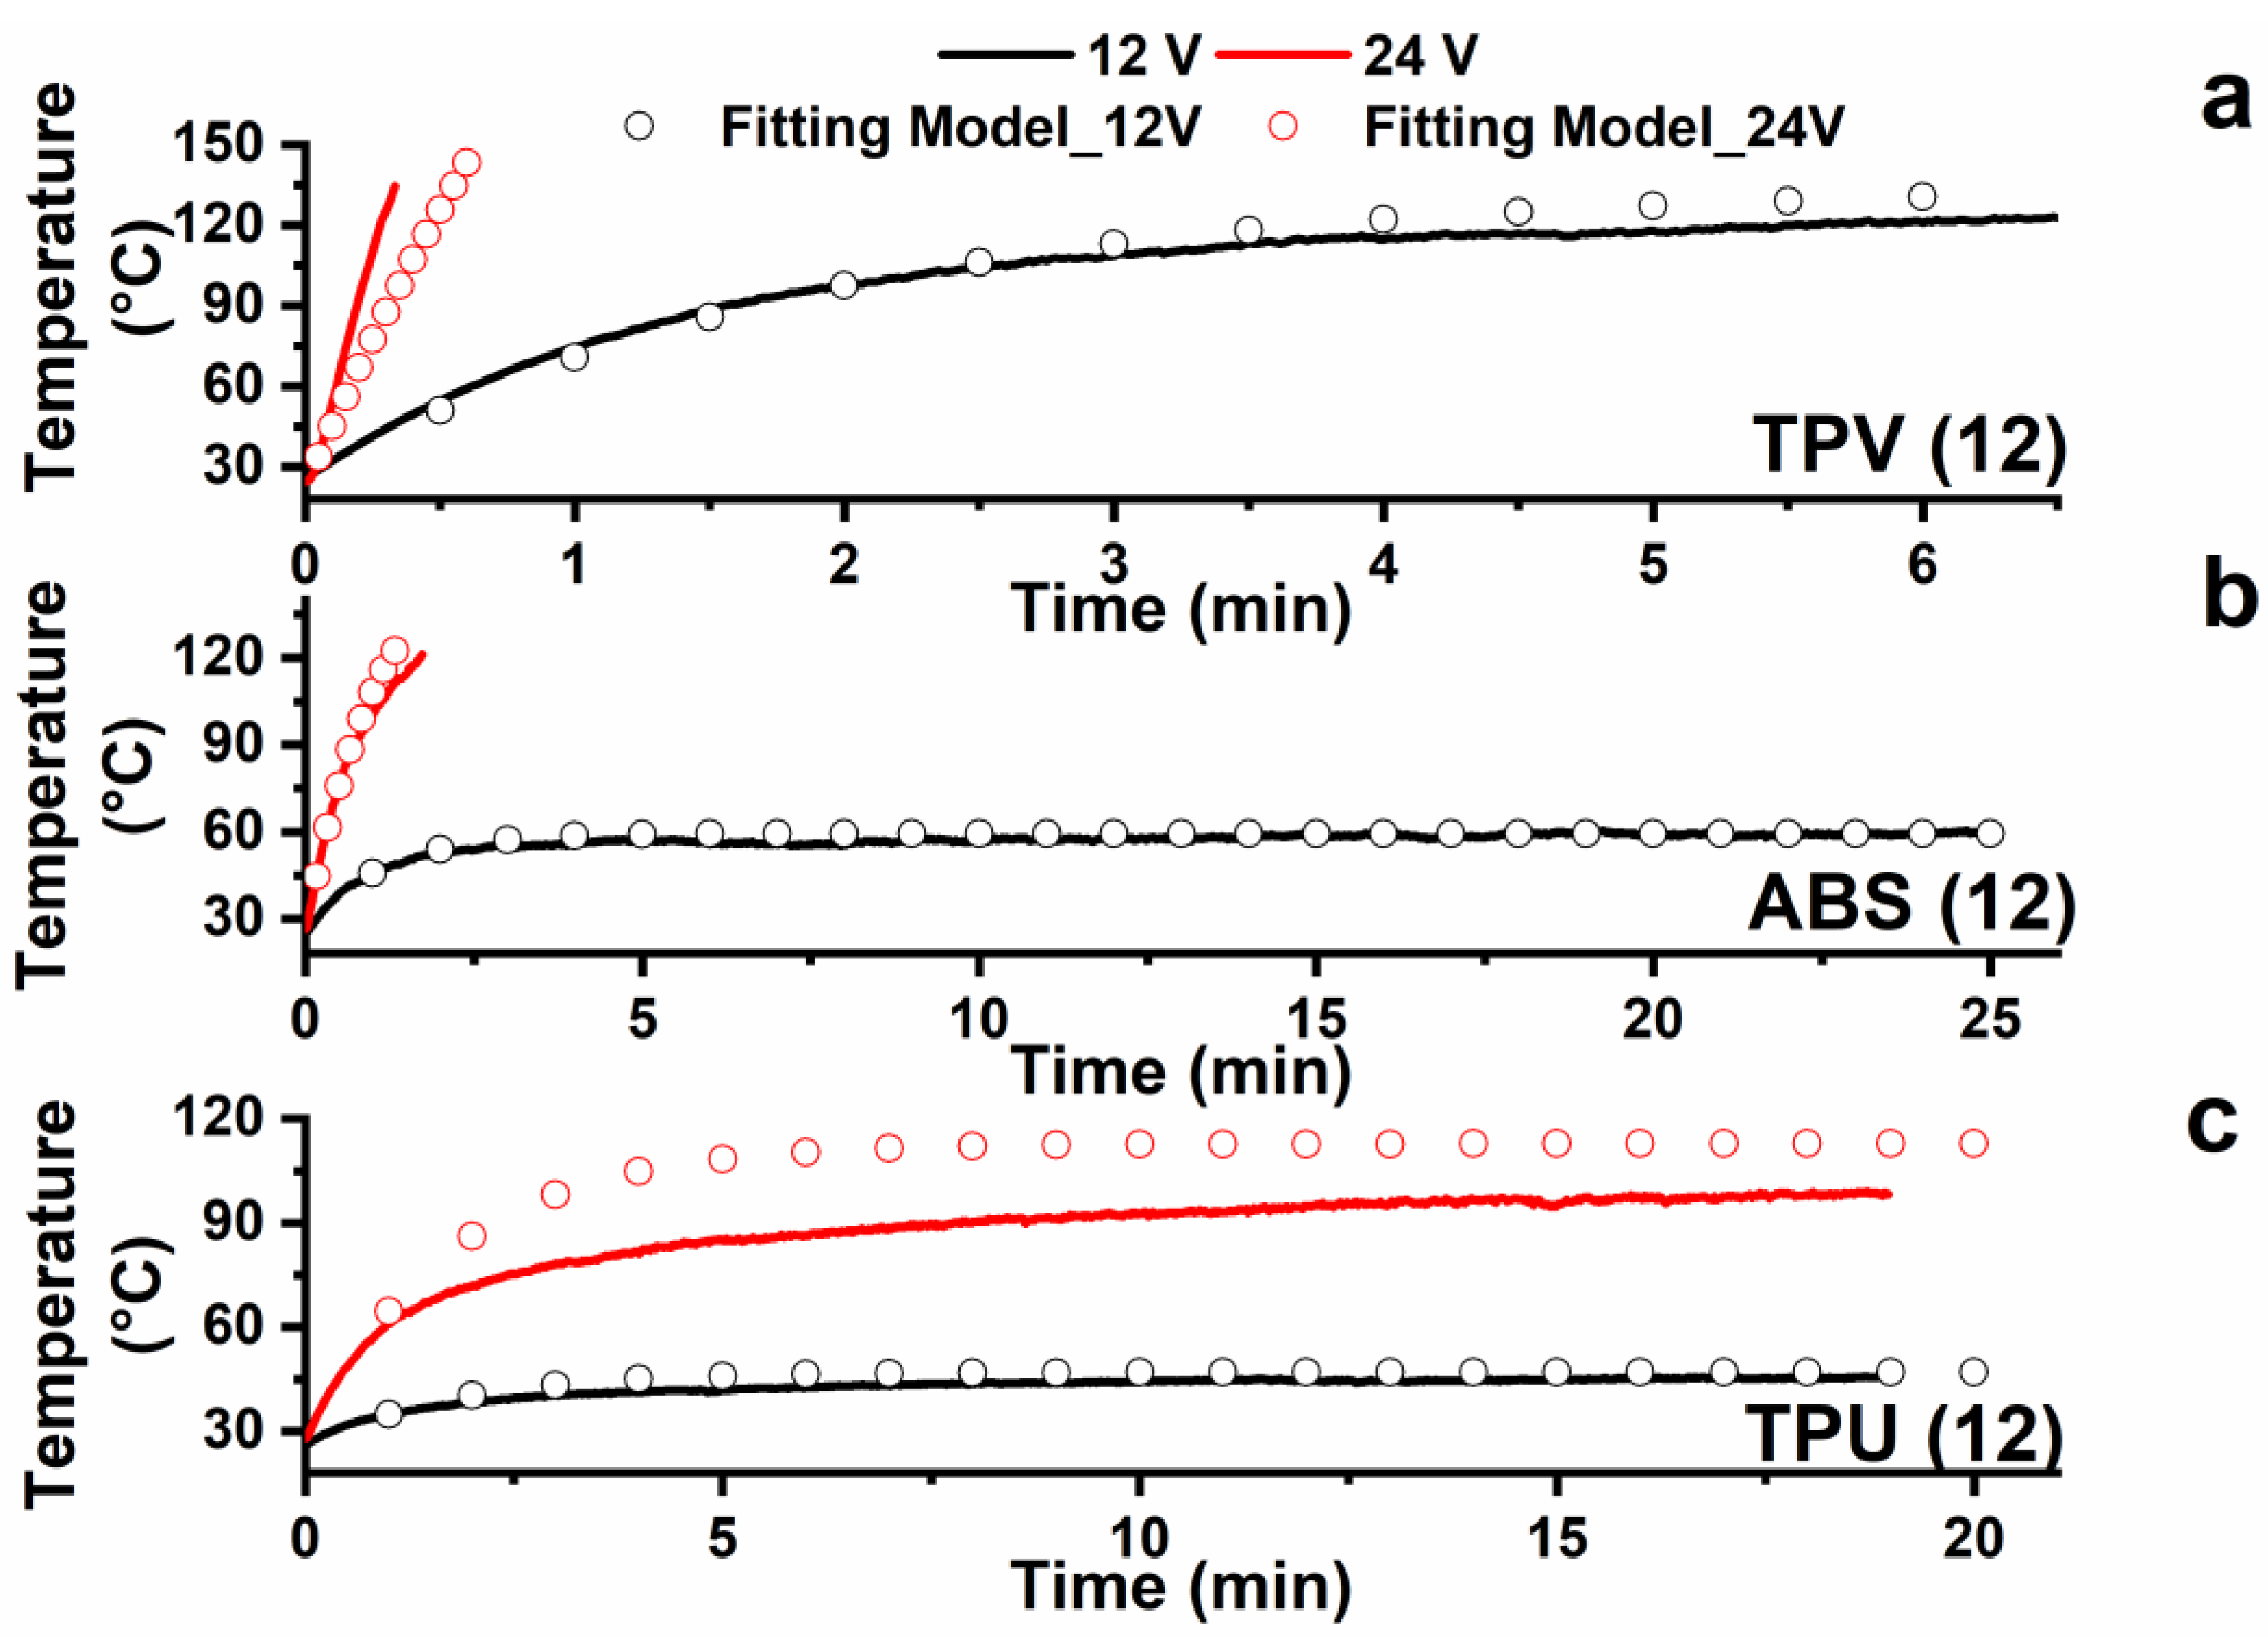
3.5.1. Simplified Analytical Model of Joule Effect
3.5.2. Experimental Data and Comparison with the Model
4. Conclusions
Supplementary Materials
Author Contributions
Funding
Institutional Review Board Statement
Informed Consent Statement
Data Availability Statement
Acknowledgments
Conflicts of Interest
References
- Guadagno, L.; Foglia, F.; Pantani, R.; Romero-Sanchez, M.D.; Calderón, B.; Vertuccio, L. Low-voltage icing protection film for automotive and aeronautical industries. Nanomaterials 2020, 10, 1343. [Google Scholar] [CrossRef] [PubMed]
- Vertuccio, L.; de Santis, F.; Pantani, R.; Lafdi, K.; Guadagno, L. Effective de-icing skin using graphene-based flexible heater. Compos. B Eng. 2019, 162, 600–610. [Google Scholar] [CrossRef]
- Vertuccio, L.; Foglia, F.; Pantani, R.; Romero-Sánchez, M.; Calderón, B.; Guadagno, L. Carbon nanotubes and expanded graphite based bulk nanocomposites for de-icing applications. Compos. B Eng. 2021, 207, 108583. [Google Scholar] [CrossRef]
- Donati, G.; de Nicola, A.; Munaò, G.; Byshkin, M.; Vertuccio, L.; Guadagno, L.; Le Goff, R.; Milano, G. Simulation of self-heating process on the nanoscale: A multiscale approach for molecular models of nanocomposite materials. Nanoscale Adv. 2020, 2, 3164–3180. [Google Scholar] [CrossRef]
- Alexandra, V. Electric Power Systems: A Conceptual Introduction; John Wiley & Sons: Hoboken, NJ, USA, 2006. [Google Scholar]
- Meng, X.; Chen, T.; Li, Y.; Liu, S.; Pan, H.; Ma, Y.; Chen, Z.; Zhang, Y.; Zhu, S. Assembly of carbon nanodots in graphene-based composite for flexible electro-thermal heater with ultrahigh efficiency. Nano Res. 2019, 12, 2498–2508. [Google Scholar] [CrossRef]
- Rutherford, R.B. De-ice and Anti-Ice System and Method for Aircraft Surfaces. U.S. Patent No. 6,194,685, 27 February 2001. [Google Scholar]
- Guadagno, L.; Raimondo, M.; Naddeo, C.; Di Bartolomeo, A.; Lafdi, K. Influence of multiwall carbon nanotubes on morphological and structural changes during UV irradiation of syndiotactic polypropylene films. J. Polym. Sci. B Polym. Phys. 2012, 50, 963–975. [Google Scholar] [CrossRef]
- Naddeo, C.; Guadagno, L.; de Luca, S.; Vittoria, V.; Camino, G. Mechanical and transport properties of irradiated linear low density polyethylene (LLDPE). Polym. Degrad. Stab. 2001, 72, 239–247. [Google Scholar] [CrossRef]
- Naddeo, C.; Guadagno, L.; Vittoria, V. Photooxidation of spherilene linear low-density polyethylene films subjected to environmental weathering. 1. Changes in mechanical properties. Polym. Degrad. Stab. 2004, 85, 1009–1013. [Google Scholar] [CrossRef]
- Naddeo, C.; Vertuccio, L.; Barra, G.; Guadagno, L. Nano-charged polypropylene application: Realistic perspectives for enhancing durability. Materials 2017, 10, 943. [Google Scholar] [CrossRef]
- Acierno, S.; Barretta, R.; Luciano, R.; de Sciarra, F.M.; Russo, P. Experimental evaluations and modeling of the tensile behavior of polypropylene/single-walled carbon nanotubes fibers. Compos. Struct. 2017, 174, 12–18. [Google Scholar] [CrossRef]
- Barra, G.; Vertuccio, L.; Vietri, U.; Naddeo, C.; Hadavinia, H.; Guadagno, L. Toughening of epoxy adhesives by combined interaction of carbon nanotubes and silsesquioxanes. Materials 2017, 10, 1131. [Google Scholar] [CrossRef] [PubMed]
- Kuzhir, P.; Paddubskaya, A.; Plyushch, A.; Volynets, N.; Maksimenko, S.; Macutkevic, J.; Kranauskaite, I.; Banys, J.; Ivanov, E.; Kotsilkova, R. Epoxy composites filled with high surface area-carbon fillers: Optimization of electromagnetic shielding, electrical, mechanical, and thermal properties. J. Appl. Phys. 2013, 114, 164304. [Google Scholar] [CrossRef]
- Plyushch, A.; Macutkevic, J.; Kuzhir, P.; Banys, J.; Bychanok, D.; Lambin, P.; Bistarelli, S.; Cataldo, A.; Micciulla, F.; Bellucci, S. Electromagnetic properties of graphene nanoplatelets/epoxy composites. Compos. Sci. Technol. 2016, 128, 75–83. [Google Scholar] [CrossRef]
- Russo, P.; Patti, A.; Petrarca, C.; Acierno, S. Thermal conductivity and dielectric properties of polypropylene-based hybrid compounds containing multiwalled carbon nanotubes. J. Appl. Polym. Sci. 2018, 135, 46470. [Google Scholar] [CrossRef]
- Simon, D.A.; Bischoff, E.; Buonocore, G.G.; Cerruti, P.; Raucci, M.G.; Xia, H.; Schrekker, H.S.; Lavorgna, M.; Ambrosio, L.; Mauler, R.S. Graphene-based masterbatch obtained via modified polyvinyl alcohol liquid-shear exfoliation and its application in enhanced polymer composites. Mater. Des. 2017, 134, 103–110. [Google Scholar] [CrossRef]
- Wang, J.; Zhang, K.; Hao, S.; Xia, H.; Lavorgna, M. Simultaneous reduction and surface functionalization of graphene oxide and the application for rubber composites. J. Appl. Polym. Sci. 2019, 136, 47375. [Google Scholar] [CrossRef]
- Guadagno, L.; Sorrentino, A.; Delprat, P.; Vertuccio, L. Design of multifunctional composites: New strategy to save energy and improve mechanical performance. Nanomaterials 2020, 10, 2285. [Google Scholar] [CrossRef]
- Guadagno, L.; Sarno, M.; Vietri, U.; Raimondo, M.; Cirillo, C.; Ciambelli, P. Graphene-based structural adhesive to enhance adhesion performance. RSC Adv. 2015, 5, 27874–27886. [Google Scholar] [CrossRef]
- Korayem, A.H.; Li, C.Y.; Zhang, Q.H.; Zhao, X.L.; Duan, W.H. Effect of carbon nanotube modified epoxy adhesive on CFRP-to-steel interface. Compos. B Eng. 2015, 79, 95–104. [Google Scholar] [CrossRef]
- Vertuccio, L.; Guadagno, L.; Spinelli, G.; Russo, S.; Iannuzzo, G. Effect of carbon nanotube and functionalized liquid rubber on mechanical and electrical properties of epoxy adhesives for aircraft structures. Compos. B Eng. 2017, 129, 1–10. [Google Scholar] [CrossRef]
- Jyoti, J.; Basu, S.; Singh, B.P.; Dhakate, S. Superior mechanical and electrical properties of multiwall carbon nanotube reinforced acrylonitrile butadiene styrene high performance composites. Compos. B Eng. 2015, 83, 58–65. [Google Scholar] [CrossRef]
- Prashantha, K.; Soulestin, J.; Lacrampe, M.-F.; Krawczak, P.; Dupin, G.; Claes, M. Masterbatch-based multi-walled carbon nanotube filled polypropylene nanocomposites: Assessment of rheological and mechanical properties. Compos. Sci. Technol. 2009, 69, 1756–1763. [Google Scholar] [CrossRef]
- Guadagno, L.; Raimondo, M.; Vertuccio, L.; Naddeo, C.; Barra, G.; Longo, P.; Lamberti, P.; Spinelli, G.; Nobile, M. Morphological, rheological and electrical properties of composites filled with carbon nanotubes functionalized with 1-pyrenebutyric acid. Compos. Part B Eng. 2018, 147, 12–21. [Google Scholar] [CrossRef]
- Raimondo, M.; Guadagno, L.; Vertuccio, L.; Naddeo, C.; Barra, G.; Spinelli, G.; Lamberti, P.; Tucci, V.; Lafdi, K. Electrical conductivity of carbon nanofiber reinforced resins: Potentiality of Tunneling Atomic Force Microscopy (TUNA) technique. Compos. B Eng. 2018, 143, 148–160. [Google Scholar] [CrossRef]
- Spinelli, G.; Lamberti, P.; Tucci, V.; Guadagno, L.; Vertuccio, L. Damage monitoring of structural resins loaded with carbon fillers: Experimental and theoretical study. Nanomaterials 2020, 10, 434. [Google Scholar] [CrossRef]
- Al-Saleh, M.H.; Al-Anid, H.K.; Hussain, Y.A. CNT/ABS nanocomposites by solution processing: Proper dispersion and selective localization for low percolation threshold. Compos. Part A Appl. Sci. Manuf. 2013, 46, 53–59. [Google Scholar] [CrossRef]
- Ma, Y.; Wu, D.; Liu, Y.; Li, X.; Qiao, H.; Yu, Z.-Z. Electrically conductive and super-tough polypropylene/carbon nanotube nanocomposites prepared by melt compounding. Compos. B Eng. 2014, 56, 384–391. [Google Scholar] [CrossRef]
- Wang, J.; Kazemi, Y.; Wang, S.; Hamidinejad, M.; Mahmud, M.B.; Pötschke, P.; Park, C.B. Enhancing the electrical conductivity of PP/CNT nanocomposites through crystal-induced volume exclusion effect with a slow cooling rate. Compos. B Eng. 2020, 183, 107663. [Google Scholar] [CrossRef]
- Ansari, M.Z.; Cho, C. An analytical model of joule heating in piezoresistive microcantilevers. Sensors 2010, 10, 9668. [Google Scholar] [CrossRef]
- Mansor, M.; Fadzullah, S.; Masripan, N.; Omar, G.; Akop, M. Comparison between functionalized graphene and carbon nanotubes: Effect of morphology and surface group on mechanical, electrical, and thermal properties of nanocomposites. In Functionalized Graphene Nanocomposites and Their Derivatives; Elsevier: Amsterdam, The Netherlands, 2019; pp. 177–204. [Google Scholar]
- Battisti, A.; Skordos, A.A.; Partridge, I.K. Percolation threshold of carbon nanotubes filled unsaturated polyesters. Compos. Sci. Technol. 2010, 70, 633–637. [Google Scholar] [CrossRef] [Green Version]


| Material | Neat Polymer Grade | CNT-Based Masterbatch Graphistrength® | Automotive Application |
|---|---|---|---|
| TPV (PP/EPDM) | Santoprene 121-58W175 | C M14-25 (PP + 25% CNT) | Door gaskets |
| ABS | Starex SV-0167 | C ABS1-17 (ABS + 17% CNT) | Windshield cowl, glass covers |
| TPU | Elastollan 1180 A 10 | C TPU1-20 (TPU + 20% CNT) | Water circuit pipelines |
| Parameter | TPV 12% CNT | ABS 12% CNT | TPU 12% CNT |
|---|---|---|---|
| Text [K] | 298 | 298 | 298 |
| hc [W/m2∙K] | 10 | 10 | 10 |
| ρ [kg/m3] | 970 (TPV) | 1040 (ABS) | 1100 (TPU) |
| V [V] | 12 or 24 | 12 or 24 | 12 or 24 |
| σ [S/m] | 89 | 51 | 23 |
| cp [J/kg∙K] | 1700 (polymers) | 1700 (polymers) | 1700 (polymers) |
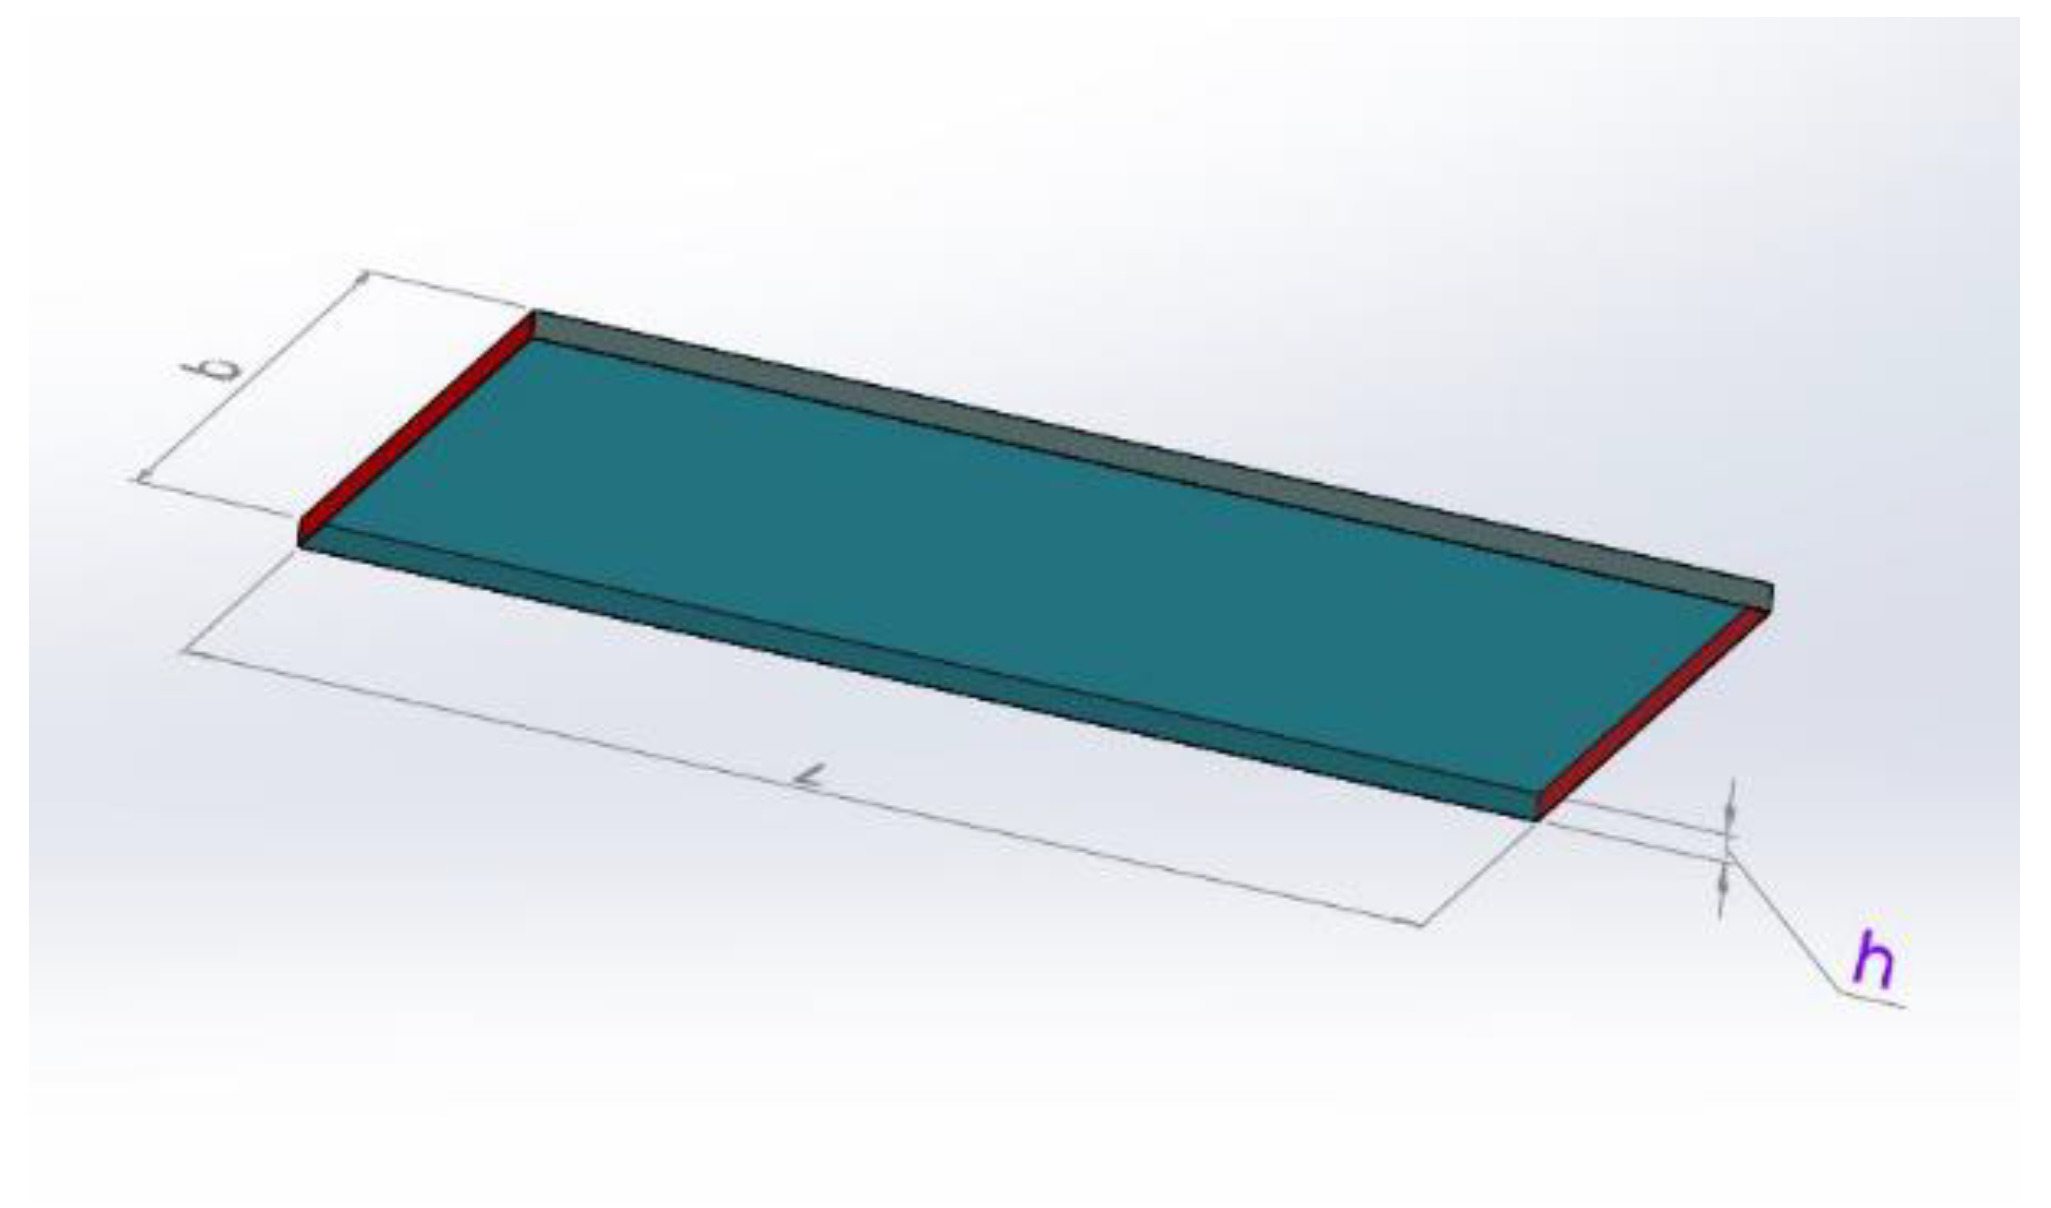
| L [m] | 0.089 | 0.089 | 0. 089 |
| b [m] | 0.044 | 0.044 | 0.044 |
| h [m] | 0.001416 | 0.000756 | 0.001116 |
Publisher’s Note: MDPI stays neutral with regard to jurisdictional claims in published maps and institutional affiliations. |
© 2022 by the authors. Licensee MDPI, Basel, Switzerland. This article is an open access article distributed under the terms and conditions of the Creative Commons Attribution (CC BY) license (https://creativecommons.org/licenses/by/4.0/).
Share and Cite
Tinti, A.; Carallo, G.A.; Greco, A.; Romero-Sánchez, M.D.; Vertuccio, L.; Guadagno, L. Effective Practical Solutions for De-Icing of Automotive Component. Nanomaterials 2022, 12, 2979. https://doi.org/10.3390/nano12172979
Tinti A, Carallo GA, Greco A, Romero-Sánchez MD, Vertuccio L, Guadagno L. Effective Practical Solutions for De-Icing of Automotive Component. Nanomaterials. 2022; 12(17):2979. https://doi.org/10.3390/nano12172979
Chicago/Turabian StyleTinti, Andrea, Gloria Anna Carallo, Antonio Greco, María Dolores Romero-Sánchez, Luigi Vertuccio, and Liberata Guadagno. 2022. "Effective Practical Solutions for De-Icing of Automotive Component" Nanomaterials 12, no. 17: 2979. https://doi.org/10.3390/nano12172979
APA StyleTinti, A., Carallo, G. A., Greco, A., Romero-Sánchez, M. D., Vertuccio, L., & Guadagno, L. (2022). Effective Practical Solutions for De-Icing of Automotive Component. Nanomaterials, 12(17), 2979. https://doi.org/10.3390/nano12172979