
Design and Planning of a Transdisciplinary Investigation into Farmland Pollinators: Rationale, Co-Design, and Lessons Learned

 ,
,  , , ,
, , ,  , , ,
, , ,  , , , , , , , , , , , , , , add
Show full author list
, , , , , , , , , , , , , , add
Show full author list
Abstract
1. Introduction
2. Partner Organisations and Method Development
- (i)
- the evolution and adoption of a co-design process acceptable to all study partners that allowed fair discussion and contributions from different sources to be assimilated into final design decisions;
- (ii)
- selecting sub-sets of partners to assist with development of distinct aspects of the field study (e.g., site selection, sampling protocols, landscape analysis, laboratory analysis, social engagement);
- (iii)
- the collaborative production of standardised protocols for each component of the study that met the objectives of the different stakeholders, remained integrated with overall project aims, and were acceptable to all partners;
- (iv)
- capacity building of the partner institutes in terms of network creation, acquisition of new skills and techniques, and development of logistical awareness.

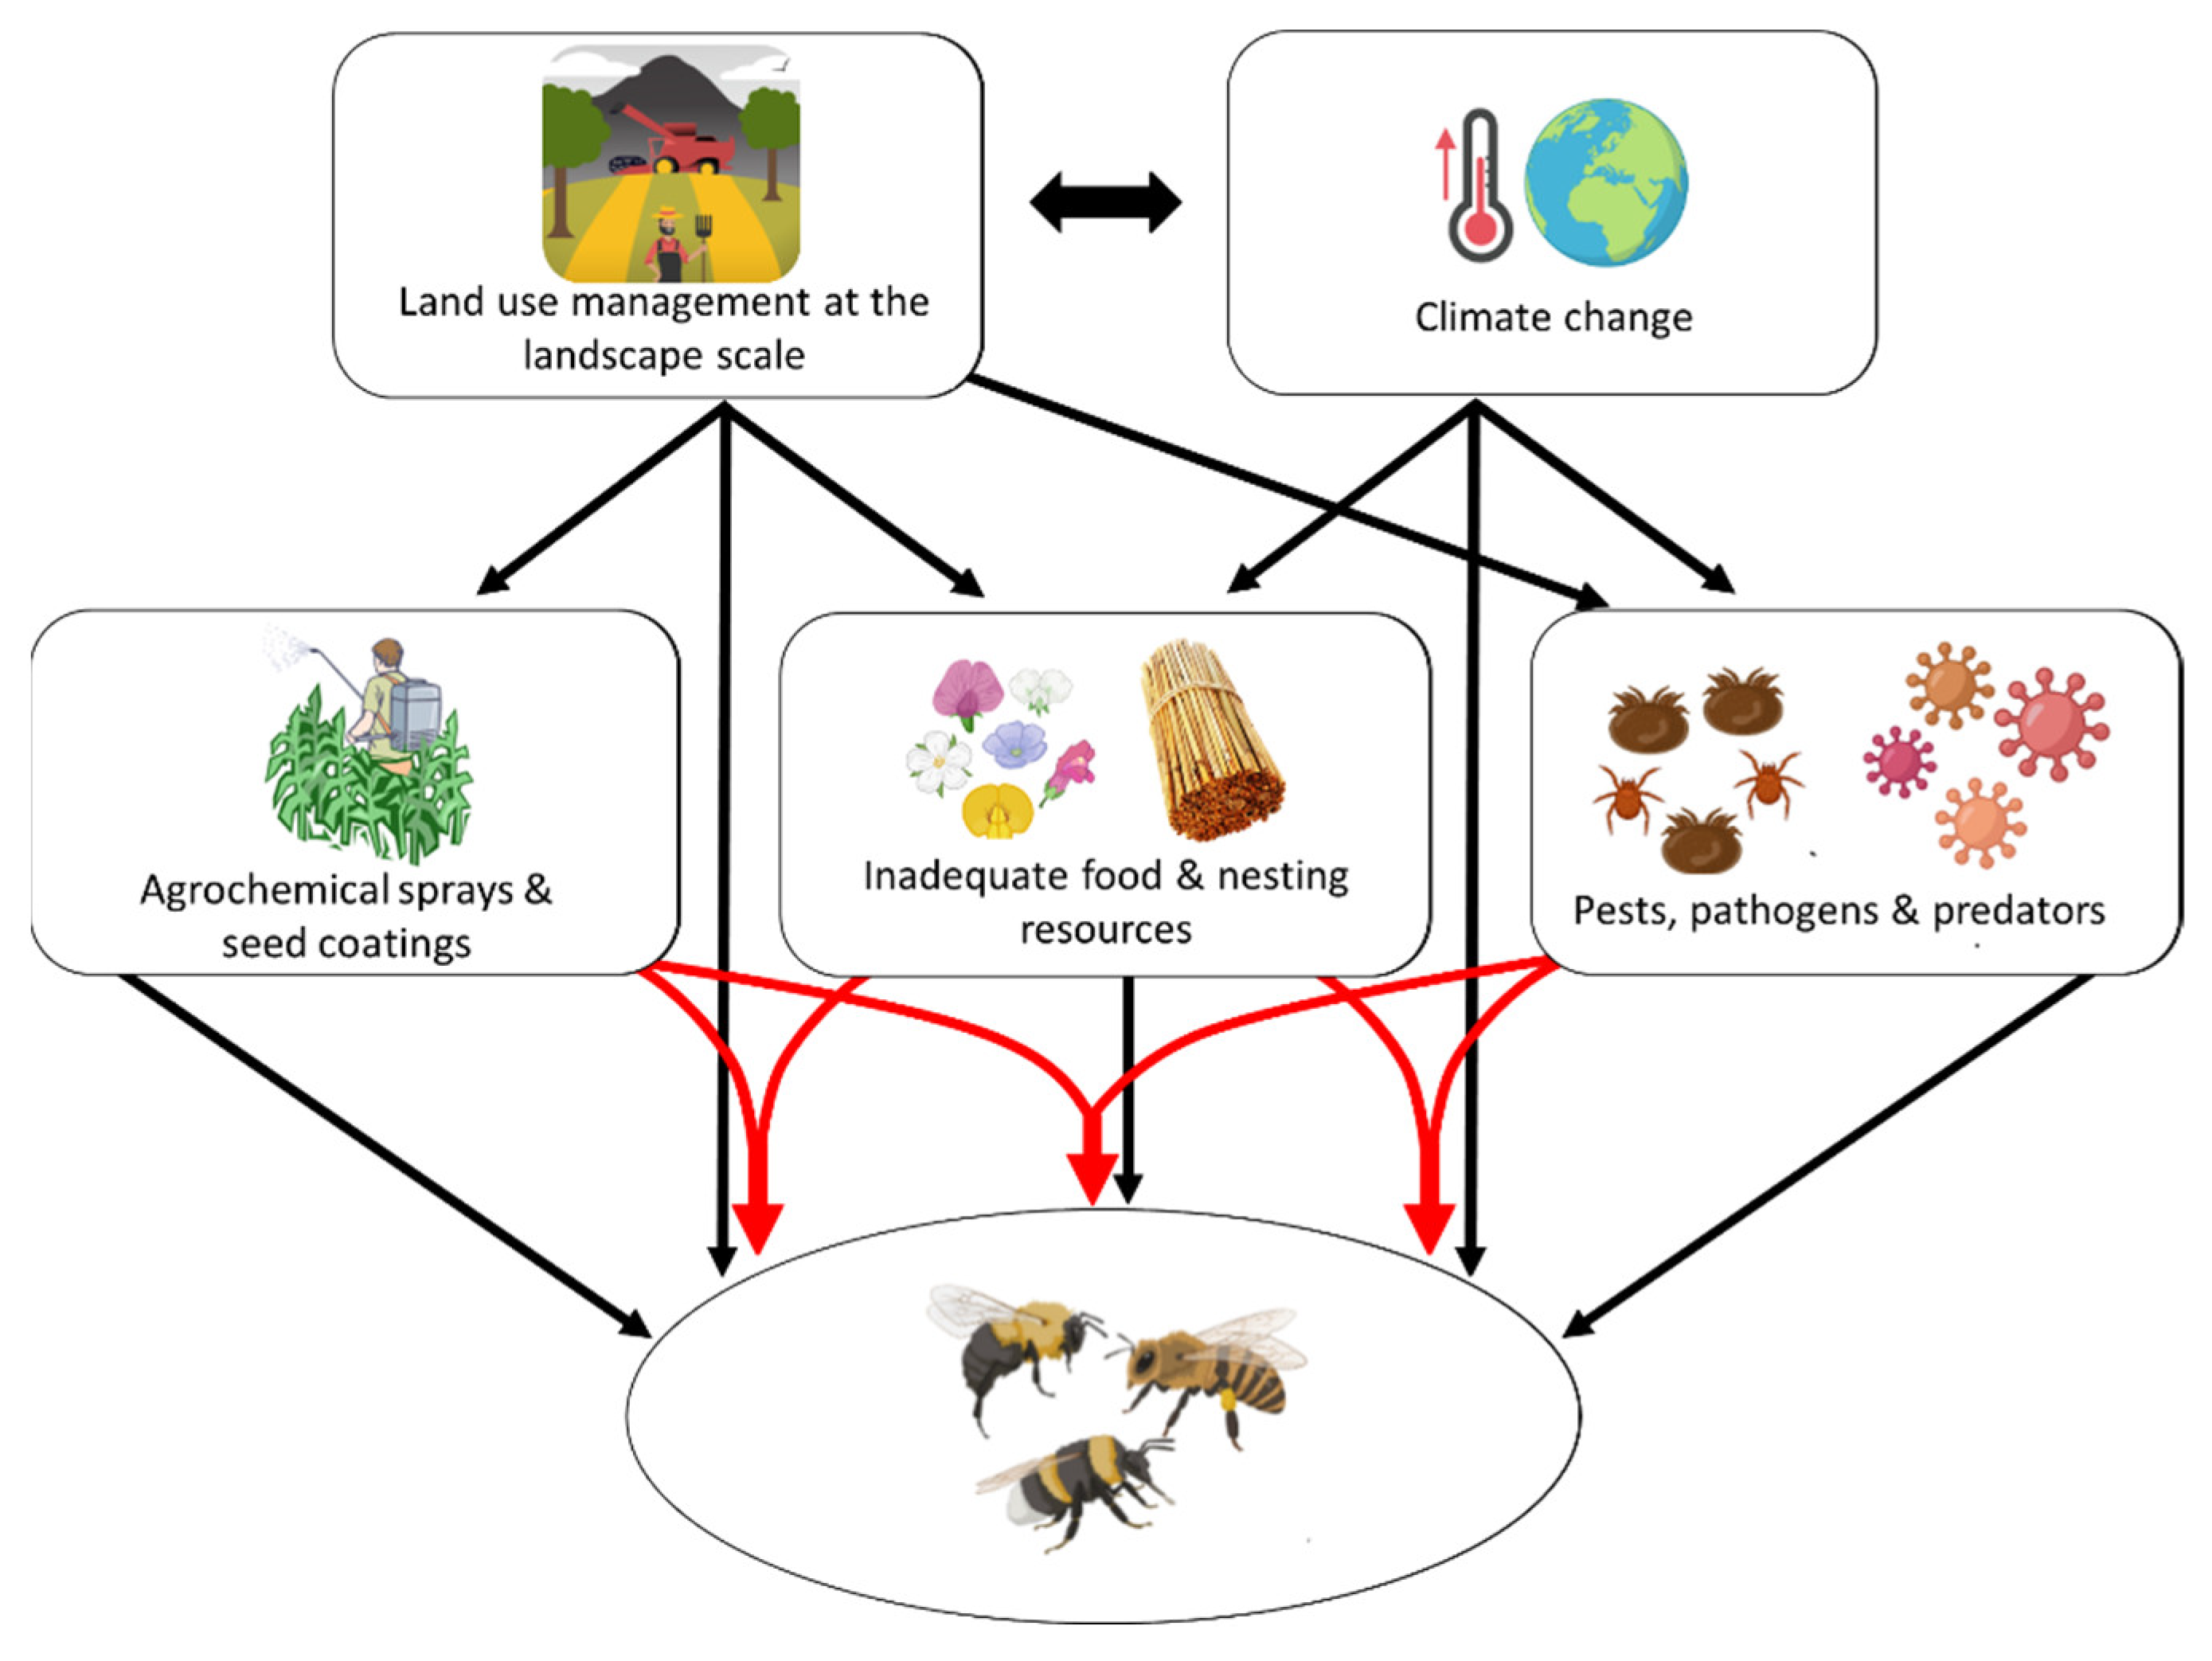
3. Overall Aims and Rationale behind Study Components
3.1. The Sentinel Bee Species

| Section | Issue to Be Considered | Resolution | Details |
|---|---|---|---|
| Section 3.1 | Bee species vary in their response to stressors. Bee exposure to agrochemicals linked to foraging range. Bee species affected by different pests and diseases. | Use more than one species of sentinel bee species. Use bee species with different typical foraging distances. Use bee species with different social structures. | Three species of sentinel bees used: Apis mellifera, Bombus terrestris, Osmia bicornis |
| Section 3.2 | Study requires same crops in all partner countries. Stress-pollinator responses vary on different crops. Agrochemical use differs on perennial and annual crops. | Adopt widely grown, economically important, European crops. Use crops that typically involve use of PPPs. Use one perennial and one annual crop. | Two study crops used:
|
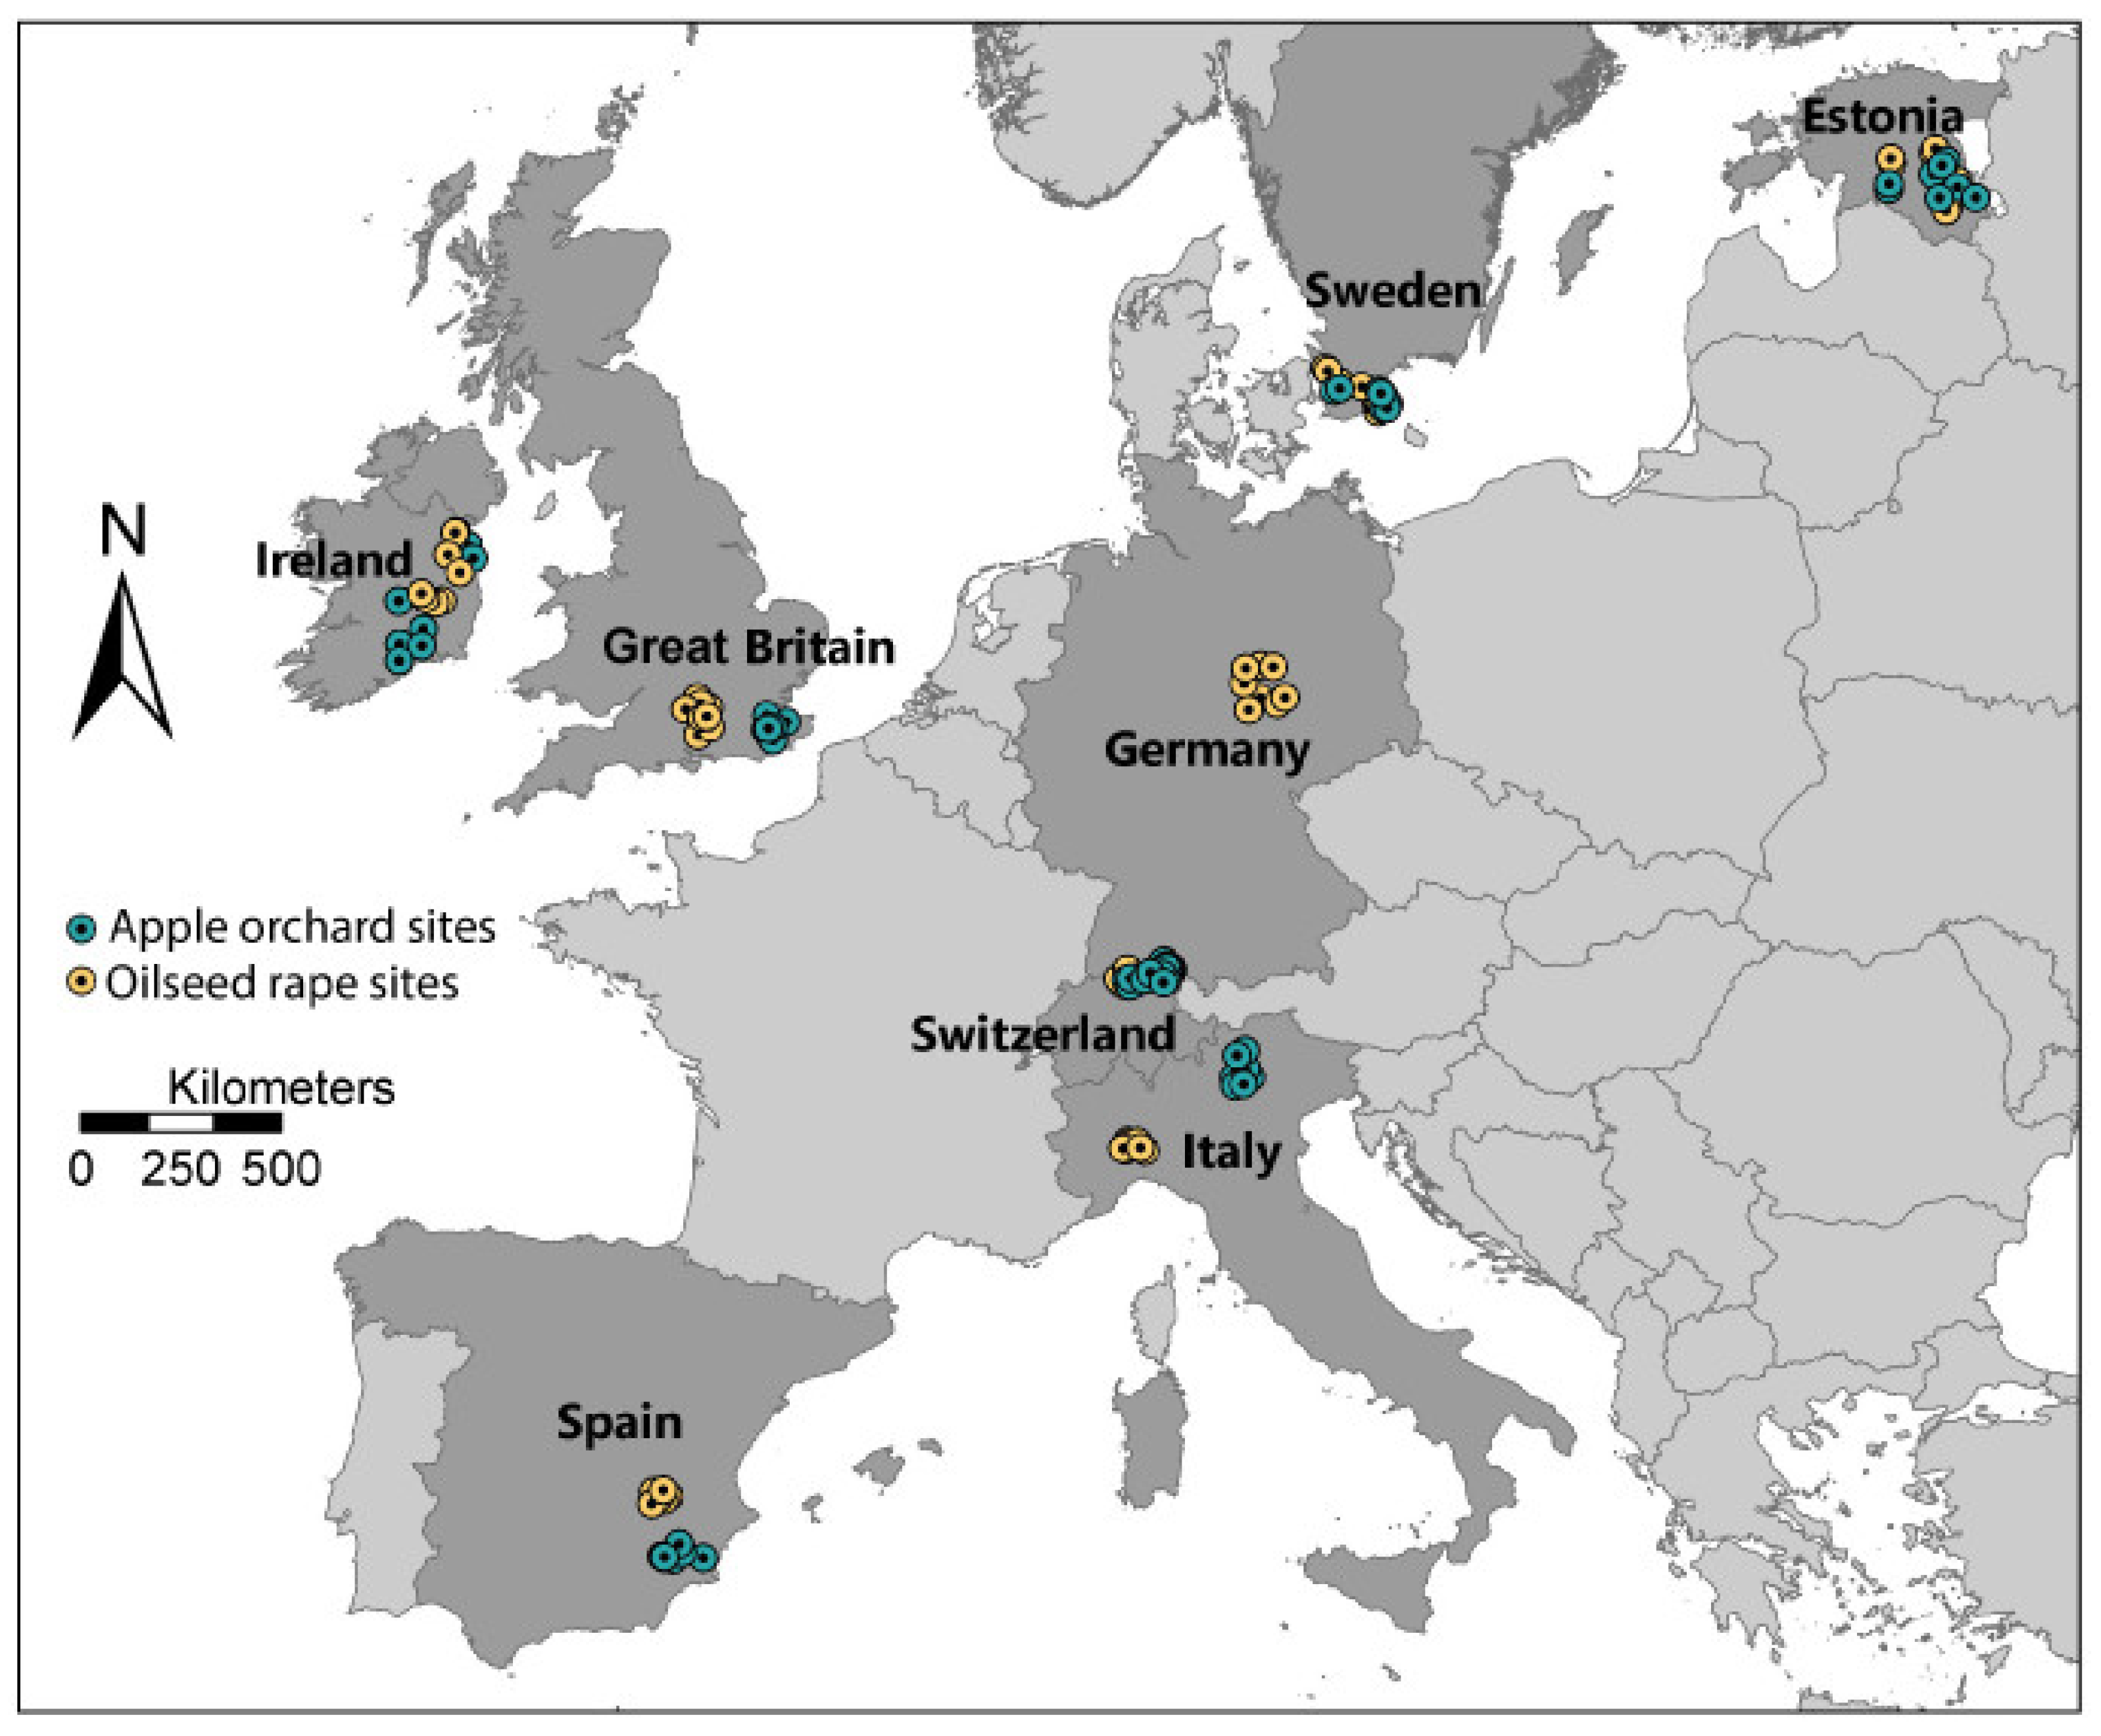
| Section 3.2 | Geographical variation in intensity of bee stressors. Bee health and responses to stressors affected by climate. Bees exposed to multiple stressors simultaneously. Different stressors may/may not be correlated. Honey bee husbandry practices vary among countries. | Include multiple countries in study design. Use sites that offer a range of climatic conditions. Select sites that provide range of land use intensities. Accept variation due to local crops and honey bee management. Attempt to standardize other variables as much as possible. | Eight European countries involved in field study: CHE, ESP, EST, GBR, GER, IRL, ITA, SWE |
| Section 3.2 | Field studies can have low statistical power. Proximal sites not considered statistically independent. Between-site variation required for meaningful results. | Use large number of independent replicate sites. Space sites so they can be considered statistically independent. Develop a gradient of land-use intensity. | A total of 128 study sites were used. Sites at least 3 km apart and selected to provide agricultural intensity gradient. |
| Section 3.3 and Section 3.5 | Bee health influenced by available nutritional resources. Bees respond to habitat diversity on a local scale. Bees respond to habitat diversity in wider landscape. | Assess abundance and diversity of local floral resources. Assess local habitat composition. Assess wider landscape context. Assess abundance and diversity of local pollinator communities | Habitat assessed/classified using:
|
| Section 3.4 | Pesticide exposure varies among bee species. Pesticide contamination differs between colony matrices. Pesticide concentration may bioaccumulate in nests. Pesticide exposure will vary depending on which products have been used and when they were applied. | Assess chemicals in foraging (female) bees. Compare chemicals in different components of the nests. Compare pesticides in floral resources with those in bees/nests Obtain information on PPPs use and application dates. | Chemicals assessed in:
|
| Section 3.6 | Diversity of bee pests and pathogens varies spatially. Different bee species may face different pathogens. Commercially produced bees can be infested. | Test for multiple pests and pathogens. Use multiple bee species for pathogen testing. Test bees for pathogens before exposure to field site conditions. | Evaluated bees for multiple pests. Tested all sentinel bees for same suite of multiple pathogens. Test bees prior and post field exposure |
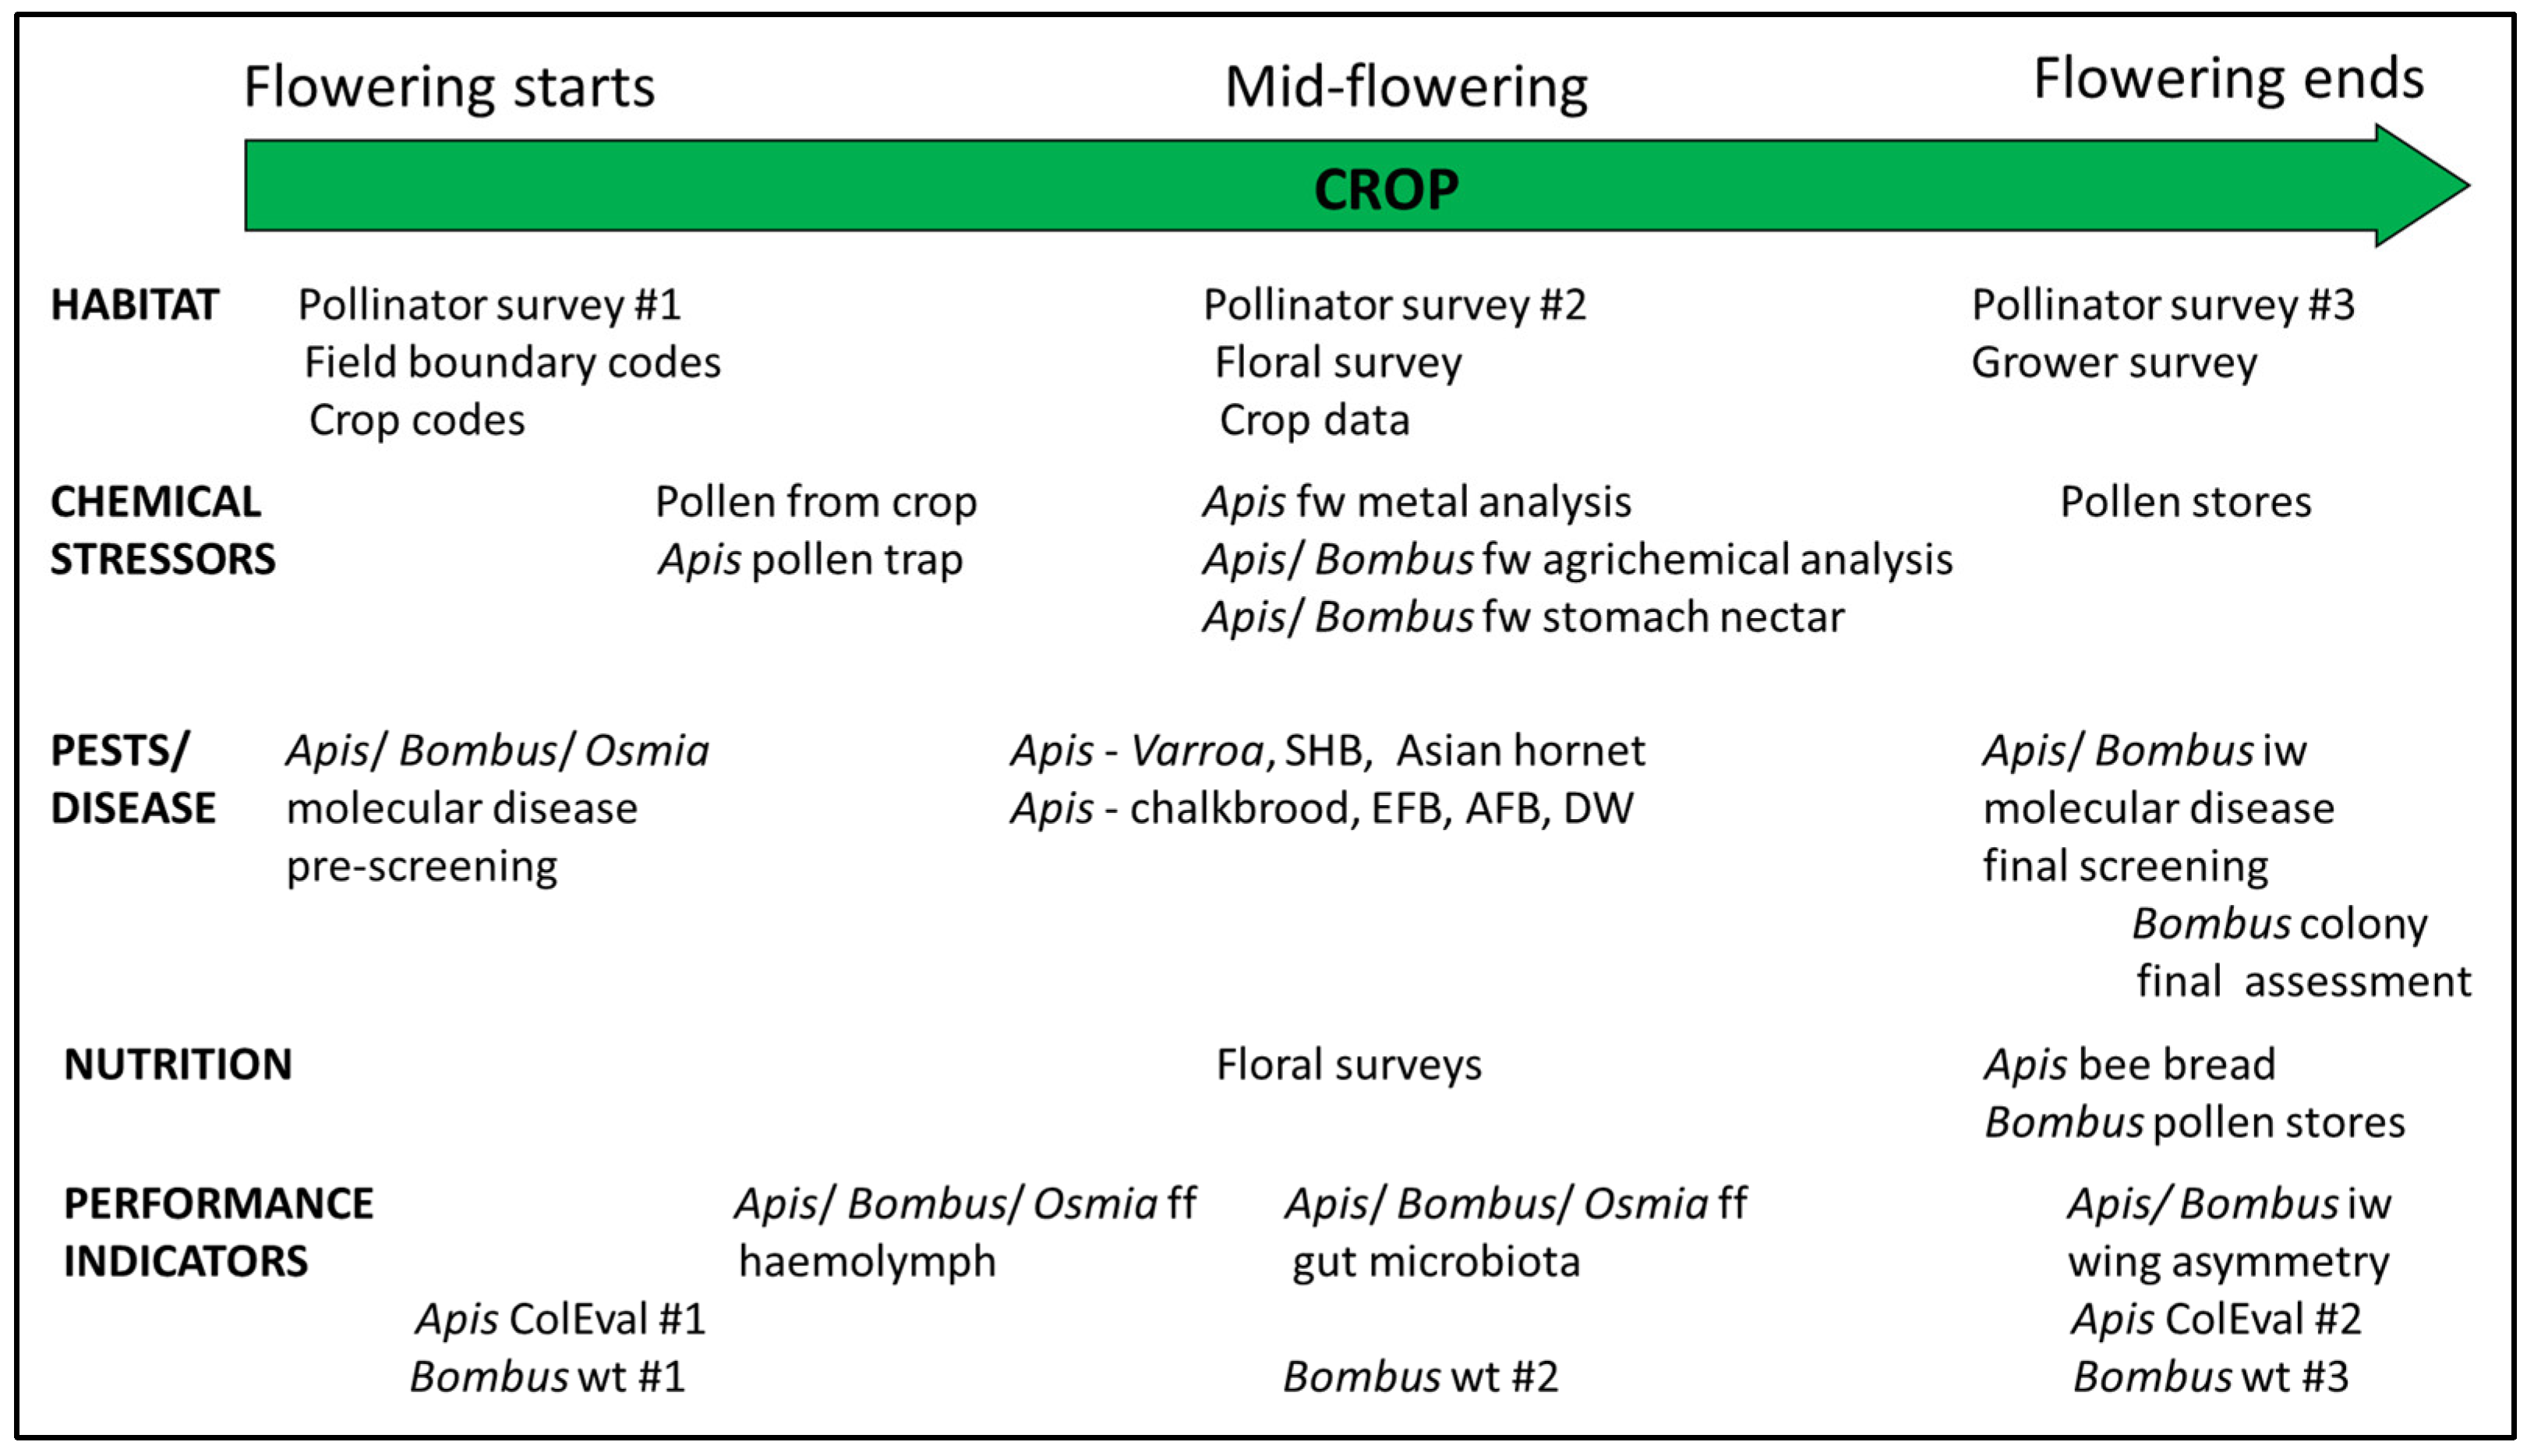
| Section 3.8 | Variation in flowering phenology among countries. Variation in typical methods used different partners. Variation in the range of experience and skill sets of field workers in different partner countries. | Standardize relative sampling times. Standardize all field sample collection and assessment methods. Standardize measurements and form of data collected. Provide training in all field methods. | Sampling based on crop flowering times. Workshop to train field workers. Produced:
|
- (i)
- a suite of bee species rather than a single species;
- (ii)
- species that have previously been used as indicators of abiotic/biotic stress in pollinators;
- (iii)
- species that exhibit variation in life histories, typical colony sizes, and nesting behaviours;
- (iv)
- species that vary in their typical foraging distances;
- (v)
- species that are commercially available in all countries taking part in the study.
3.2. Study Site Selection
- (i)
- include sites in geographically separated European countries to encompass multiple biogeographic zones with differing climates and seasonality;
- (ii)
- involve perennial and annual mass blooming crops that were found in all partner countries and were strongly associated with insect pollinators;
- (iii)
- reflect gradients of agricultural intensification typical of each partner country;
- (iv)
- have sufficient independent replication within and among countries to enable robust statistical analysis of the data obtained.
3.3. Landscape Descriptors
- (i)
- quantify land use patterns in the wider surrounding landscape that would allow the production of agricultural intensity gradients;
- (ii)
- depict local farm habitat quality in terms of features immediately adjacent and/or surrounding to the study site;
- (iii)
- classify local habitat quality in terms of its immediate value to pollinators;
- (iv)
- describe management and stewardship practices taking place at the study site, including agrochemical use and productivity.
3.4. Samples for Detection of Agrochemicals and Heavy Metal Contamination
- (i)
- elucidate the presence and concentrations of a wide range of chemical contaminants on/in adults of the three sentinel bee species;
- (ii)
- assess different colony and nest matrices to establish the location and possible acquisition chain of contamination;
- (iii)
- establish the most commonly occurring chemicals in each sample matrix, and the frequency of co-occurrence;
- (iv)
- relate chemical contaminant profiles of bees and colony matrices with contaminants occurring in the pollen of the focal crops;
- (v)
- relate chemicals observed in the various samples with products growers reported as being applied to the focal crop.
3.5. Bee Nutrition and Pollen Analysis
- (i)
- quantify the diversity and abundance of non-crop flowers available in the field boundaries;
- (ii)
- determine the botanical origin, diversity, and nutritional quality of pollen in the food stores.
3.6. Bee Pests and Pathogens
- (i)
- record the prevalence of a suite of primary bee pathogens and pests across the site network;
- (ii)
- calculate the frequency of co-occurrence of pests and pathogens to investigate potential ecological associations or synergistic effects;
- (iii)
- compare the pest and disease profiles of three co-occurring sentinel bee species;
- (iv)
- compare field assessment of major pathogens with infection rates obtained by laboratory analysis.
3.7. Indicators of Sentinel Bee ‘Health’ and Performance
- (i)
- gain an insight into honey bee and bumble bee performance at the colony level;
- (ii)
- estimate stressors encountered by developing larvae by examining body morphology of adult bees;
- (iii)
- gain insight into the physiological condition of adult bees;
- (iv)
- examine responses to stressors at the molecular level.
3.8. Logistics, Timing, and Sample Moderation
- (i)
- create a sampling program that met the objectives of the wider field investigation and provided meaningful samples for end users;
- (ii)
- create a timetable that provided each field team with clear guidelines concerning when each sample or measurement should be taken;
- (iii)
- provide guidance on how the time spent and the labour available on each site visit could be optimized.
3.9. Data Collection and Management
- (i)
- collect high value biological data fit for purpose with respect to all project stakeholders;
- (ii)
- ensure efficient and consistent data collection and formatting across all the field study partners;
- (iii)
- produce digital files containing easily comprehensible raw data and meta-data that was amenable to future exploration by both internal and external users;
- (iv)
- consider the practical issues related to data collection and management in terms of overall project logistics and availability of human resources.
4. Discussion
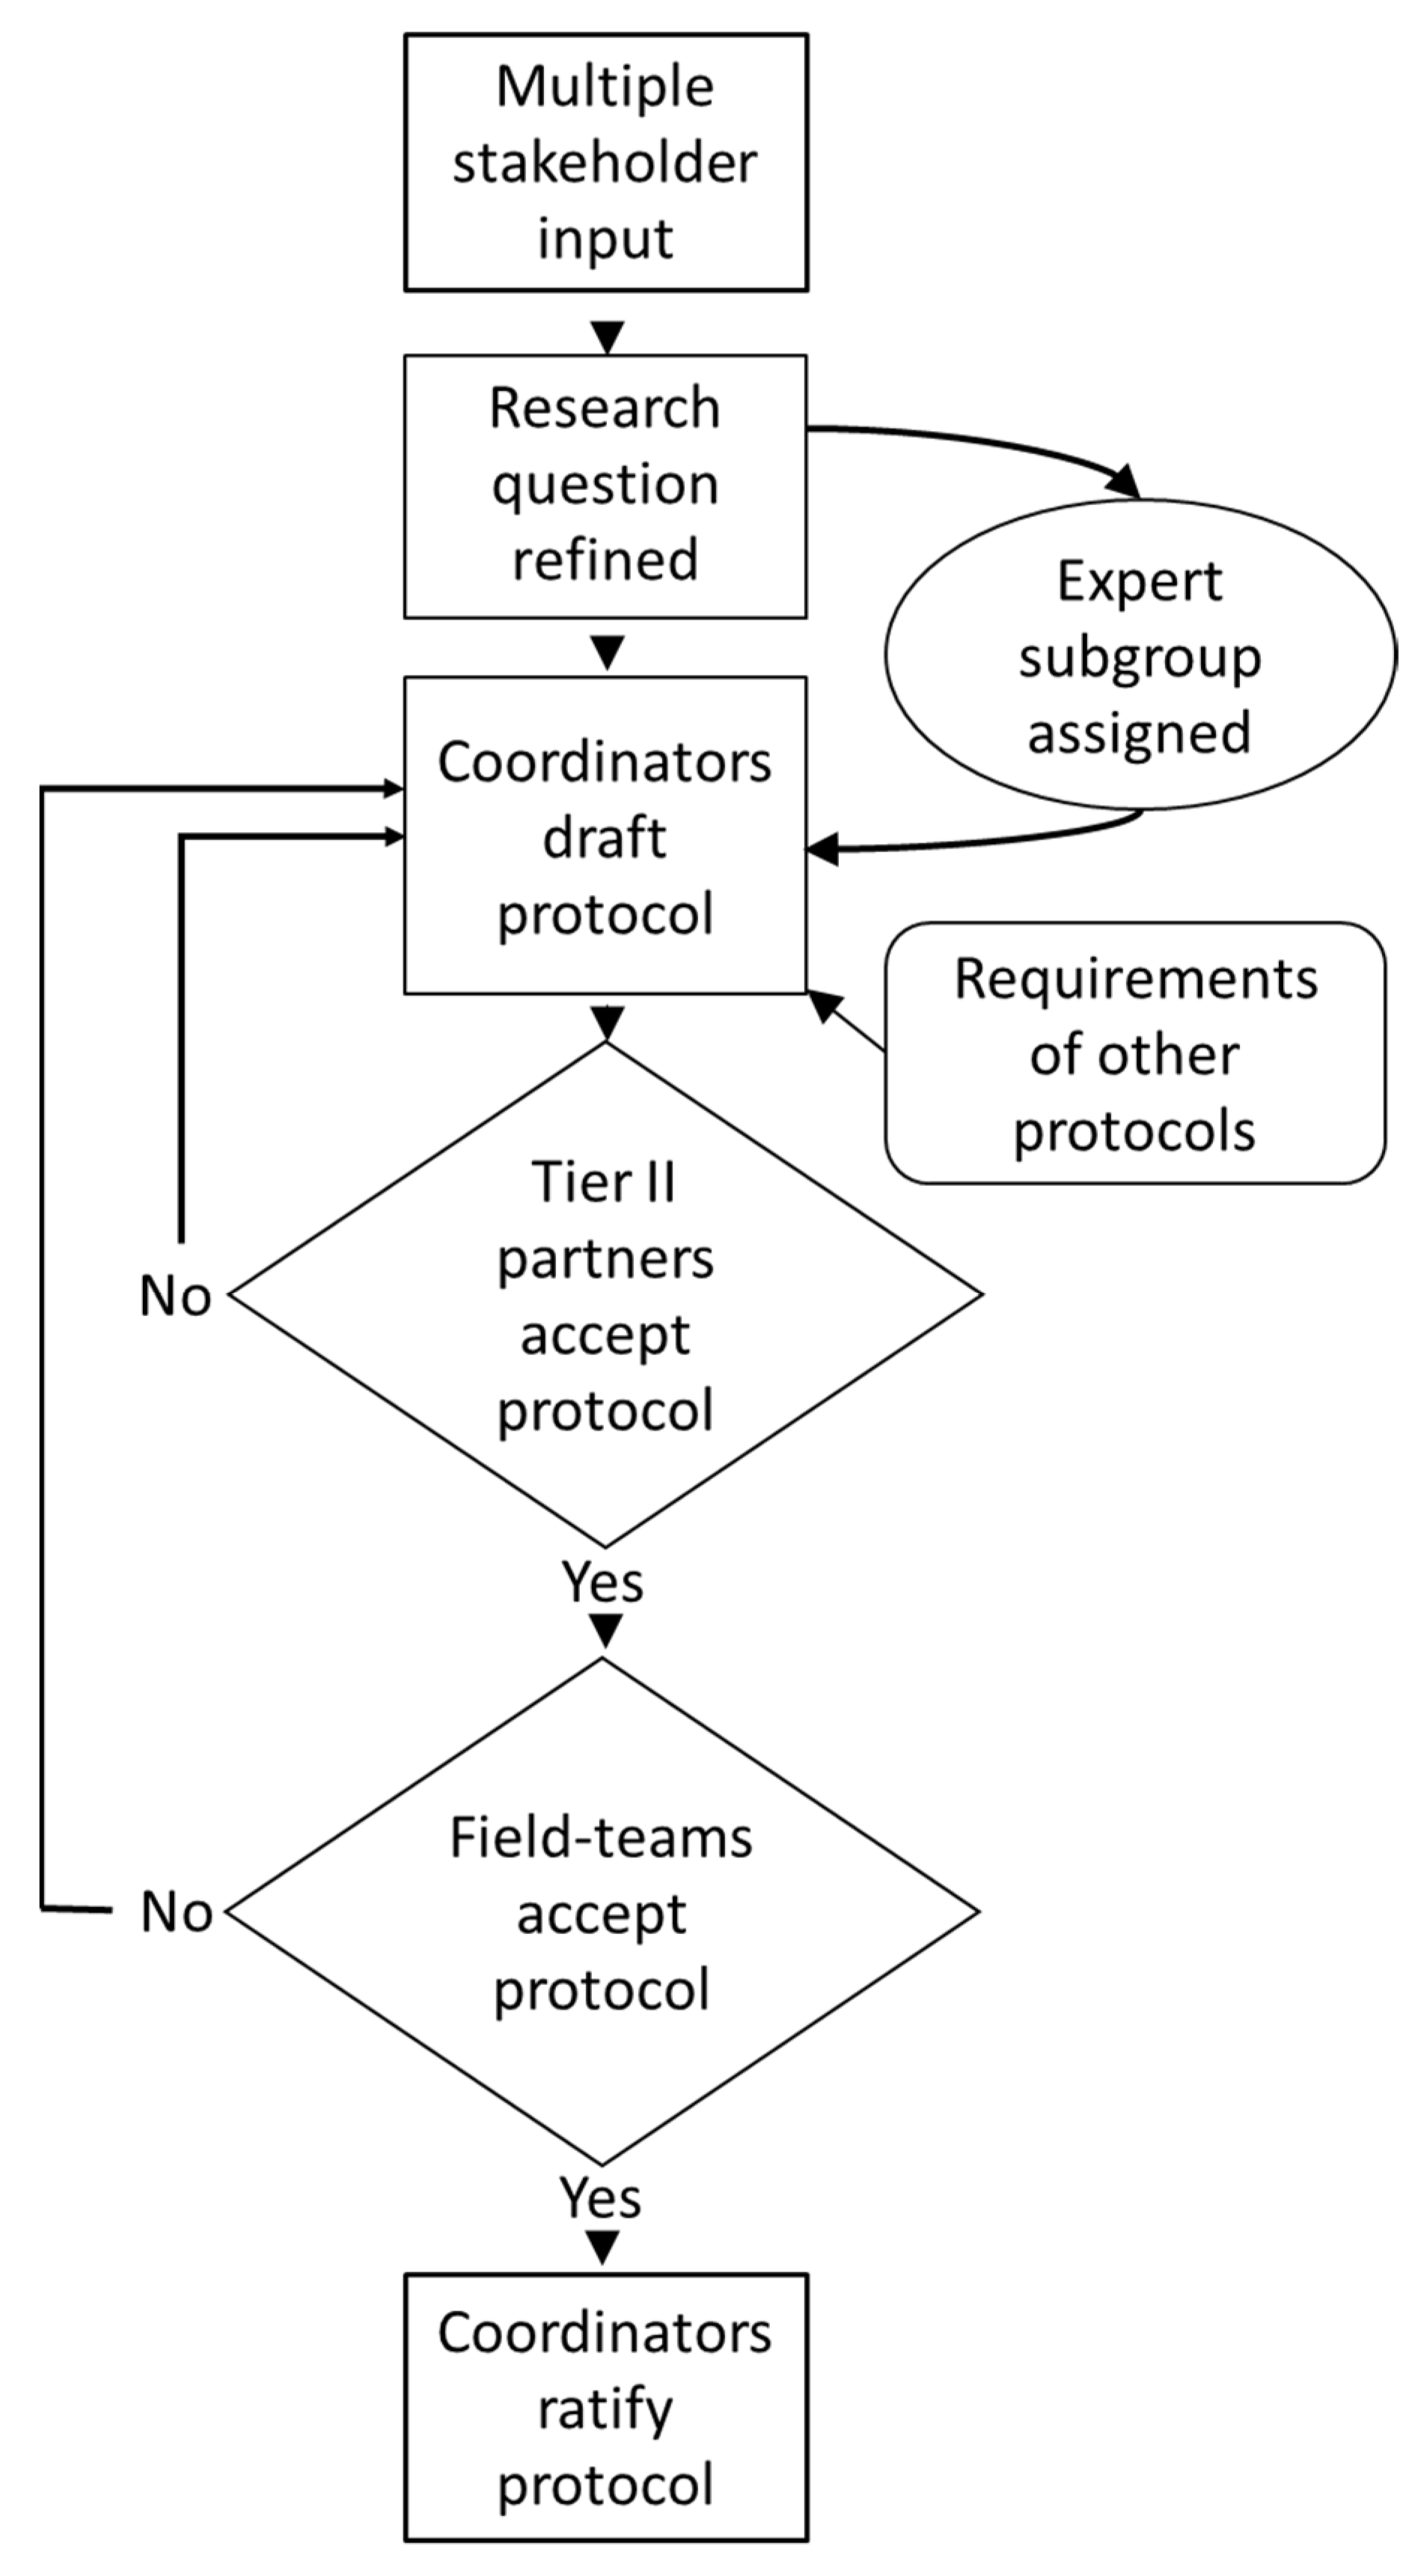
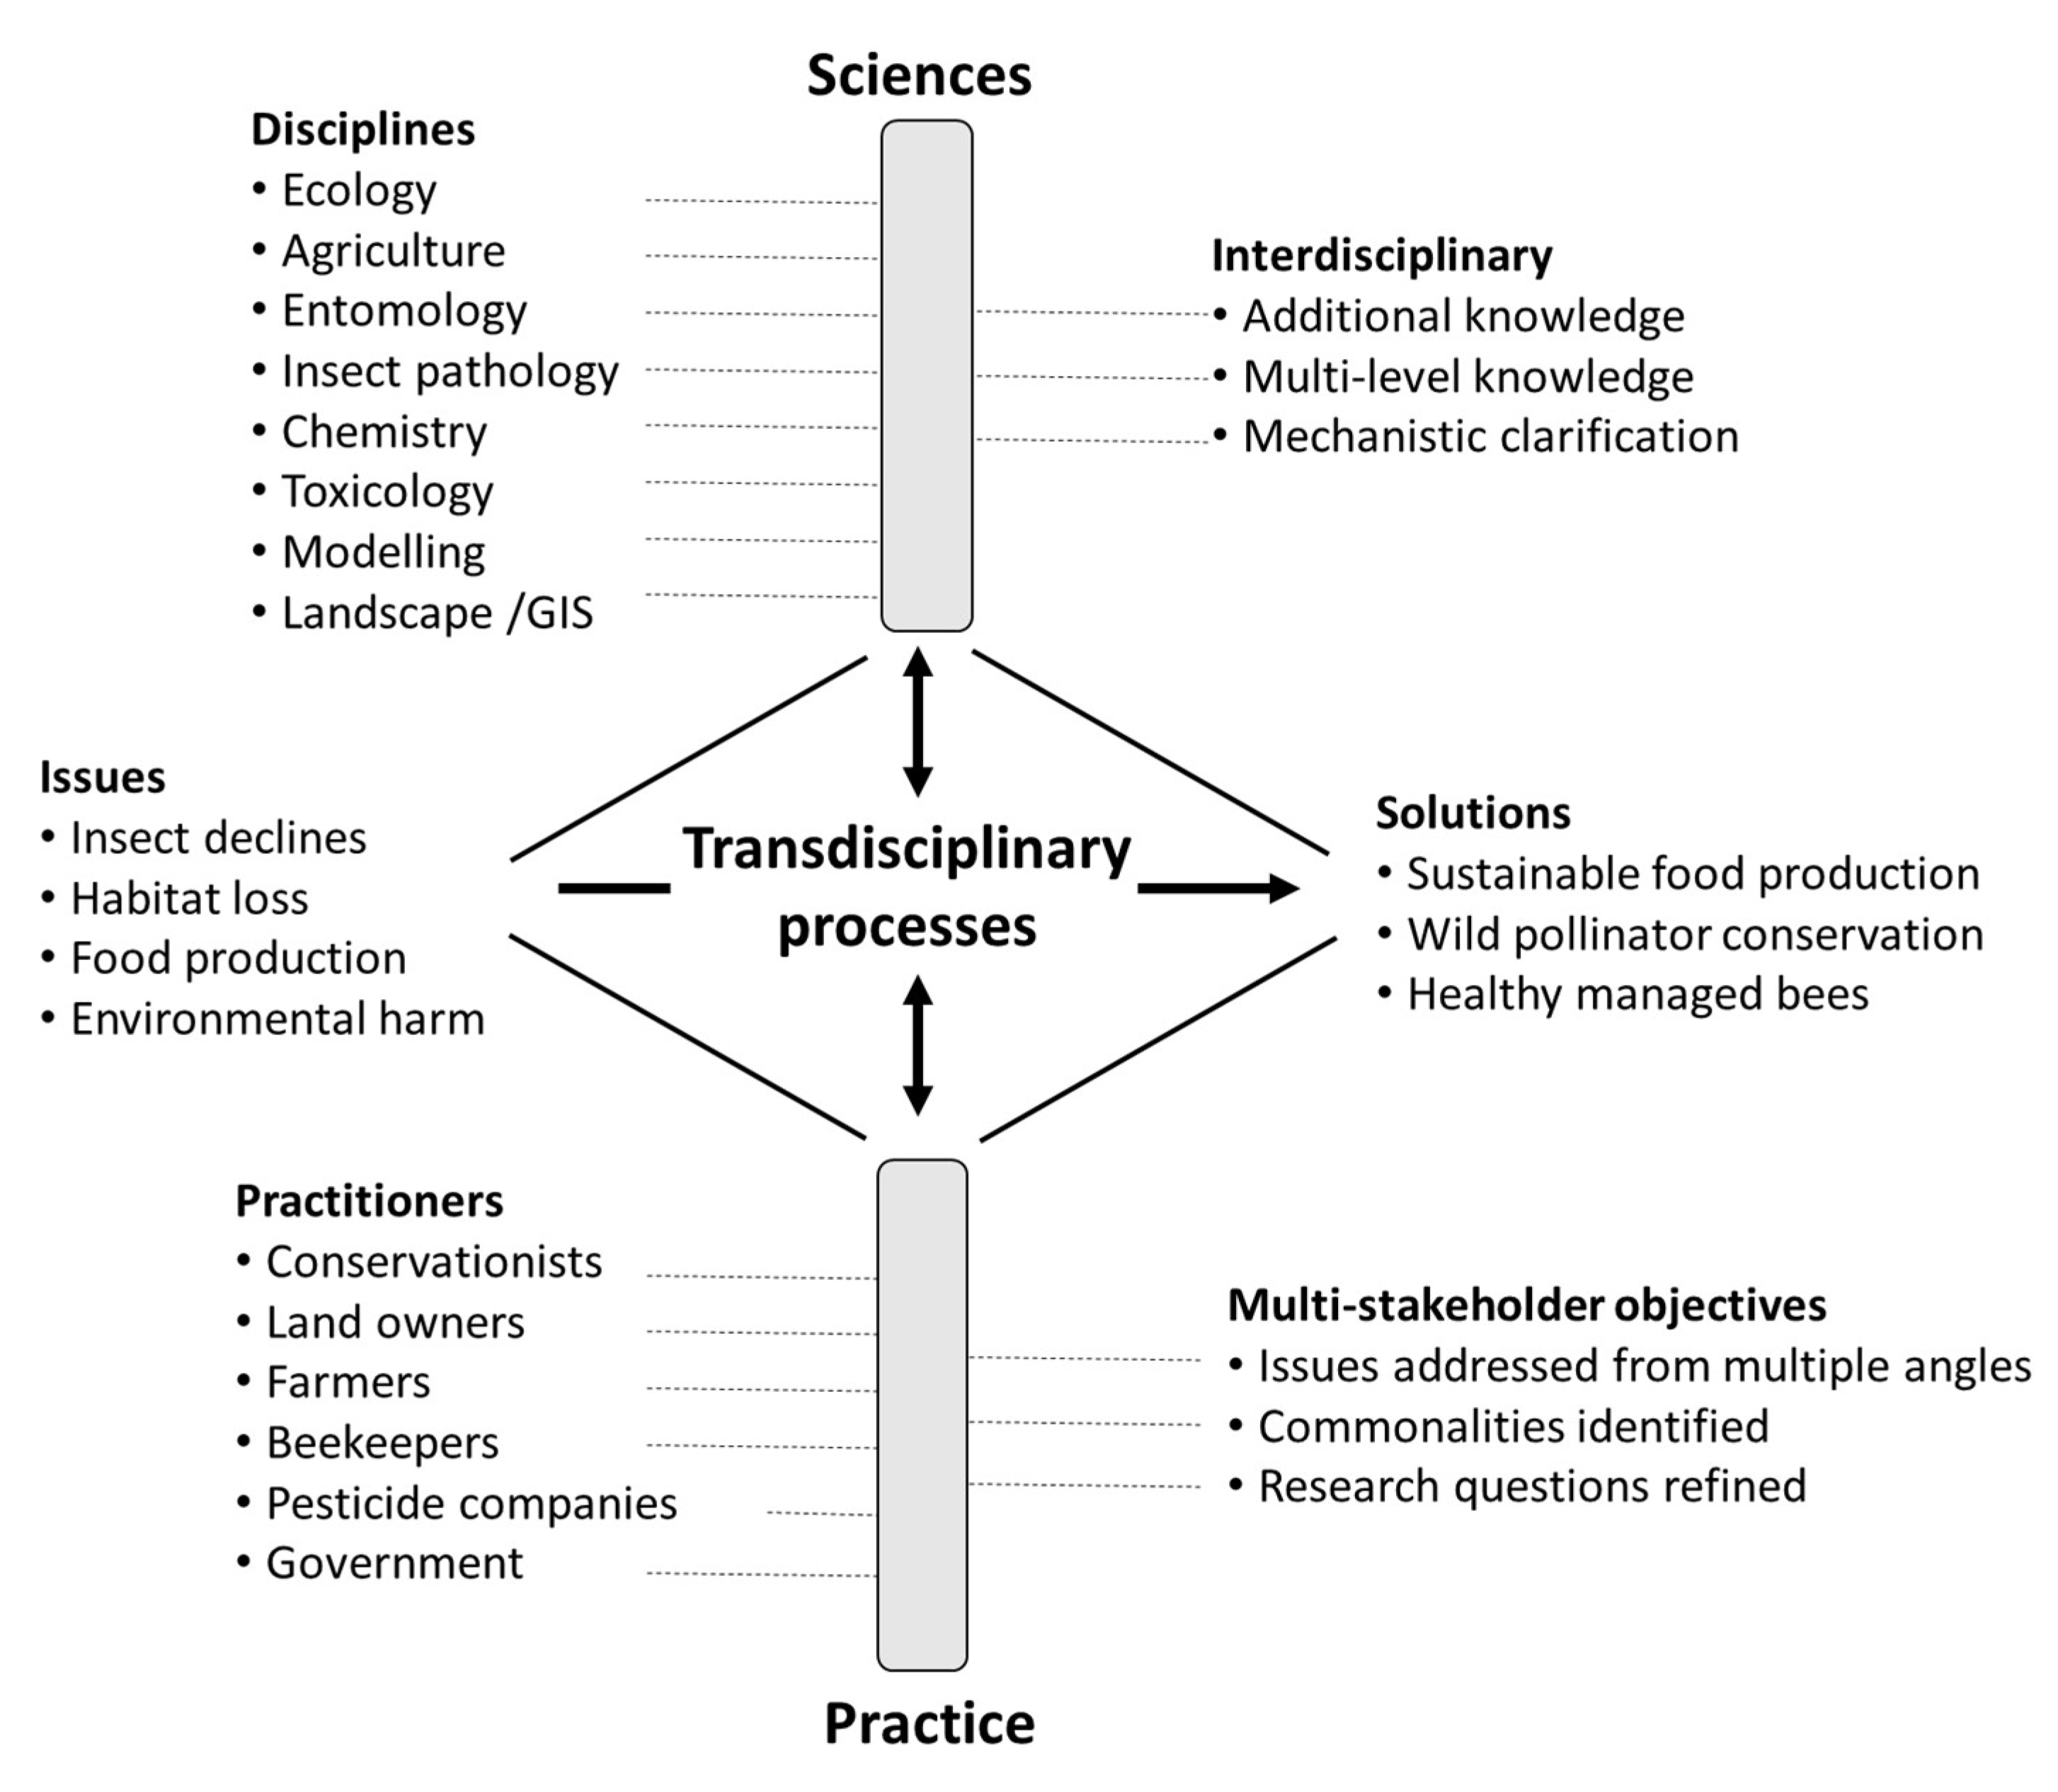
4.1. The Trans-Disciplinary Design Process
4.2. Lessons Learned
- The design process, interactions with collaborators, and communications with on-site stakeholders all require considerable time and resources: initiate these processes as early as possible.
- Produce detailed written protocols and data templates for each element of the study and use wider stakeholder input to ensure these protocols will lead to the collection of data that are fit-for-purpose in terms of overall project aims.
- Accelerate overall study design by delegating method development to sub-groups with appropriate expertise.
- Assign one group as project managers that hold responsibility for method development, overall project planning, and form a hub for communications with all other team members.
- Enhance capacity building and reinforce technical skills of field teams with training workshops and video demonstrations.
- Early in the study design process, amalgamate protocols and logistics into a field timetable. Verify that what has been planned is achievable under the limitations imposed by budget, time, human resources, and typical field conditions. Identify which components of the study are not practicable, and therefore, where compromise or redesign is required.
- During practical work, minimise omissions or errors by regular centralized monitoring of the progress of each field team in terms of sample collection and data recording.
- Problems encountered in the field are very often related to shortages of time and/or personnel: consider how time on site can be maximised and made more efficient.
- No matter how tempting, avoid adding excessive secondary elements to field work outside the scope of the main project, as these can detract from achieving primary aims.
5. Conclusions
Supplementary Materials
Author Contributions
Funding
Institutional Review Board Statement
Informed Consent Statement
Data Availability Statement
Acknowledgments
Conflicts of Interest
References
- FAO. The Importance of Bees and Other Pollinators for Food and Agriculture. 2018. Available online: www.fao.org/3/i9527en/i9527en.pdf (accessed on 11 July 2022).
- Klein, A.-M.; Vaissière, B.E.; Cane, J.H.; Steffan-Dewenter, I.; Cunningham, S.A.; Kremen, C.; Tscharntke, T. Importance of pollinators in changing landscapes for world crops. Proc. R. Soc. Ser. B 2007, 274, 303–313. [Google Scholar] [CrossRef] [PubMed]
- Brittain, C.; Williams, N.; Kremen, C.; Klein, A.-M. Synergistic effects of non-Apis bees and honey bees for pollination services. Proc. R. Soc. B 2013, 280, 20122767. [Google Scholar] [CrossRef] [PubMed]
- Garibaldi, L.A.; Steffan-Dewenter, I.; Winfree, R.; Aizen, M.A.; Bommarco, R.; Cunningham, S.A.; Kremen, C.; Carvalheiro, L.G.; Harder, L.D.; Afik, O.; et al. Wild pollinators enhance fruit set of crops regardless of honey bee abundance. Science 2013, 339, 1608–1611. [Google Scholar] [CrossRef] [PubMed]
- Mallinger, R.E.; Gratton, C. Species richness of wild bees, but not the use of managed honeybees, increases fruit set of a pollinator-dependent crop. J. Appl. Ecol. 2015, 52, 323–330. [Google Scholar] [CrossRef]
- Rader, R.; Bartomeus, I.; Garibaldi, L.A.; Garratt, M.P.D.; Howlett, B.G.; Winfree, R.; Cunningham, S.A.; Mayfield, M.M.; Arthur, A.D.; Andersson, G.K.S.; et al. Non-bee insects are important contributors to global crop pollination. Proc. Natl. Acad. Sci. USA 2016, 113, 146–151. [Google Scholar] [CrossRef]
- Rader, R.; Cunningham, S.; Howlett, B.; Inouye, D. Non-bee insects as visitors and pollinators of crops: Biology, ecology and management. Annu. Rev. Entomol. 2020, 65, 201–217. [Google Scholar] [CrossRef] [PubMed]
- Breeze, T.D.; Vaissière, B.E.; Bommarco, R.; Petanidou, T.; Seraphides, N.; Kozák, L.; Scheper, J.; Biesmeijer, J.C.; Kleijn, D.; Gyldenkaerne, S.; et al. Agricultural policies exacerbate honeybee pollination service supply-demand mismatches across Europe. PLoS ONE 2014, 9, e82996. [Google Scholar] [CrossRef]
- Garratt, M.P.; de Groot, G.A.; Albrecht, M.; Bosch, J.; Breeze, T.D.; Fountain, M.T.; Klein, A.M.; McKerchar, M.; Park, M.; Paxton, R.J.; et al. Opportunities to reduce pollination deficits and production shortfalls in a globally important crop. Ecol. Appl. 2021, 31, e02445. [Google Scholar] [CrossRef]
- Garratt, M.P.D.; Truslove, L.; Coston, D.; Evans, R.; Moss, E.; Dodson, C.; Jenner, N.; Biesmeijer, J.; Potts, S. Pollination deficits in UK apple orchards. J. Pollinat. Ecol. 2014, 12, 9–14. [Google Scholar] [CrossRef]
- Gezon, Z.J.; Wyman, E.S.; Ascher, J.M.S.; Inouye, D.W.; Irwin, R.E. The effect of repeated, lethal sampling on wild bee abundance and diversity. Methods Ecol. Evol. 2015, 6, 1044–1054. [Google Scholar] [CrossRef]
- IPBES. The Assessment Report of the Intergovernmental Science-Policy Platform on Biodiversity and Ecosystem Services on Pollinators, Pollination and Food Production; Secretariat of the Intergovernmental Science-Policy Platform on Biodiversity and Ecosystem Services: Bonn, Germany, 2016. [Google Scholar]
- Tucker, E.M.; Rehan, S.M. Farming for bees: Annual variation in pollinator populations across agricultural landscapes. Agric. For. Entomol. 2018, 20, 541–548. [Google Scholar] [CrossRef]
- Hallmann, C.A.; Sorg, M.; Jongejans, E.; Siepel, H.; Hofland, N.; Schwan, H.; Stenmans, W.; Müller, A.; Sumser, H.; Hörren, T.; et al. More than 75 percent decline over 27 years in total flying insect biomass in protected areas. PLoS ONE 2017, 12, e0185809. [Google Scholar] [CrossRef]
- Lister, B.C.; Garcia, A. Climate-driven declines in arthropod abundance restructure a rainforest food web. Proc. Natl. Acad. Sci. USA 2018, 115, E10397–E10406. [Google Scholar] [CrossRef]
- Vogel, G. Where have all the insects gone? Science 2017, 356, 576–579. [Google Scholar] [CrossRef]
- Zattara, E.E.; Aizen, M.A. Worldwide occurrence records suggest a global decline in bee species richness. One Earth 2021, 4, 114–123. [Google Scholar] [CrossRef]
- Cardoso, P.; Branco, V.V.; Chichorro, F.; Fukushima, C.S.; Macías-Hernández, N. Can we really predict a catastrophic worldwide decline of entomofauna and its drivers? Glob. Ecol. Conserv. 2019, 20, e00621. [Google Scholar] [CrossRef]
- Hodge, S. When I’m sixty-four: Long-term monitoring and the (missing?) New Zealand insect apocalypse. Wētā 2020, 53, 1–11. [Google Scholar]
- Mupepele, A.C.; Bruelheide, H.; Dauber, J.; Krüß, A.; Potthast, T.; Wägele, W.; Klein, A.M. Insect decline and their drivers: Unsupported conclusions in a poorly performed meta-analysis on trends—A critique of Sánchez-Bayo and Wyckhuys. Basic Appl. Ecol. 2019, 37, 20–23. [Google Scholar] [CrossRef]
- Thomas, C.D.; Jones, T.H.; Hartley, S.E. “Insectageddon”: A call for more robust data and rigorous analyses. Glob. Chang. Biol. 2019, 25, 1891–1892. [Google Scholar] [CrossRef]
- van Klink, R.; Bowler, D.E.; Gongalsky, K.B.; Swengel, A.B.; Gentile, A.; Chase, J.M. Meta-analysis reveals declines in terrestrial but increases in freshwater insect abundances. Science 2020, 368, 417–420. [Google Scholar] [CrossRef]
- Wagner, D.L. Insect declines in the Anthropocene. Annu. Rev. Entomol. 2020, 65, 23.1–23.24. [Google Scholar] [CrossRef] [PubMed]
- Finley, J.; Camazine, S.; Frazier, M. The epidemic of honey bee colony losses during the 1995-1996 season. Am. Bee J. 1996, 136, 805–808. [Google Scholar]
- Ippolito, A.; Aguila, M.D.; Aiassa, E.; Guajardo, I.M.; Neri, F.M.; Alvarez, F.; Mosbach-Schulz, O.; Szentes, C. Review of the evidence on bee background mortality. EFSA Supporting Publ. 2020, 17, 1880E. [Google Scholar]
- Oldroyd, B.P. What’s killing American honey bees? PLoS Biol. 2007, 5, e168. [Google Scholar] [CrossRef]
- Grozinger, C.M.; Flenniken, M.L. Bee viruses: Ecology, pathogenicity, and impacts. Annu. Rev. Entomol. 2019, 64, 205–226. [Google Scholar] [CrossRef]
- Rosenkranz, P.; Aumeier, P.; Ziegelmann, B. Biology and control of Varroa destructor. J. Invertebr. Pathol. 2010, 103, S96–S119. [Google Scholar] [CrossRef]
- Bruckner, S.; Steinhauer, N.; Engelsma, J.; Fauvel, A.M.; Kulhanek, K.; Malcolm, E.; Meredith, A.; Milbrath, M.; Niño, E.L.; Rangel, J.; et al. 2019–2020 Honey Bee Colony Losses in the United States: Preliminary Results. 2020. Available online: beeinformed.org (accessed on 1 August 2021).
- Balfour, N.J.; Ollerton, J.; Castellanos, M.C.; Ratnieks, F.L. British phenological records indicate high diversity and extinction rates among late-summer-flying pollinators. Biol. Conserv. 2018, 222, 278–283. [Google Scholar] [CrossRef]
- Biesmeijer, J.C.; Roberts, S.P.M.; Reemer, M.; Ohlemüller, R.; Edwards, M.; Peeters, T.; Schaffers, A.P.; Potts, S.G.; Kleukers, R.; Thomas, C.D.; et al. Parallel declines in pollinators and insect pollinated plants in Britain and the Netherlands. Science 2006, 313, 351–354. [Google Scholar] [CrossRef]
- Brown, M.J.; Dicks, L.V.; Paxton, R.J.; Baldock, K.C.; Barron, A.B.; Chauzat, M.P.; Freitas, B.M.; Goulson, D.; Jepsen, S.; Kremen, C.; et al. A horizon scan of future threats and opportunities for pollinators and pollination. PeerJ 2016, 4, e2249. [Google Scholar] [CrossRef]
- Dicks, L.V.; Breeze, T.D.; Ngo, H.T.; Senapathi, D.; An, J.; Aizen, M.A.; Basu, P.; Buchori, D.; Galetto, L.; Garibaldi, L.A.; et al. A global assessment of drivers and risks associated with pollinator decline. Nat. Ecol. Evol. 2021, 5, 1453–1461. [Google Scholar] [CrossRef]
- González-Varo, J.P.; Biesmeijer, J.C.; Bommarco, R.; Potts, S.G.; Schweiger, O.; Smith, H.G.; Steffan-Dewenter, I.; Szentgyörgyi, H.; Woyciechowski, M.; Vilà, M. Combined effects of global change pressures on animal-mediated pollination. Trends Ecol. Evol. 2013, 28, 524–530. [Google Scholar] [CrossRef]
- Potts, S.G.; Roberts, S.P.; Dean, R.; Marris, G.; Brown, M.A.; Jones, R.; Neumann, P.; Settele, J. Declines of managed honeybees and beekeepers in Europe. J. Apic. Res. 2010, 49, 15–22. [Google Scholar] [CrossRef]
- Potts, S.G.; Biesmeijer, J.C.; Kremen, C.; Neumann, P.; Schweiger, O.; Kunin, W.E. Global pollinator declines: Trends, impacts and drivers. Trends Ecol. Evol. 2010, 25, 345–353. [Google Scholar] [CrossRef]
- Gérard, M.; Vanderplanck, M.; Wood, T.; Michez, D. Global warming and plant–pollinator mismatches. Emerg. Top. Life Sci. 2020, 4, 77–86. [Google Scholar]
- Phillips, B.B.; Shaw, R.F.; Holland, M.J.; Fry, E.L.; Bardgett, R.D.; Bullock, J.M.; Osborne, J.L. Drought reduces floral resources for pollinators. Glob. Chang. Biol. 2018, 24, 3226–3235. [Google Scholar] [CrossRef]
- Soroye, P.; Newbold, T.; Kerr, J. Climate change contributes to widespread declines among bumble bees across continents. Science 2020, 367, 685–688. [Google Scholar] [CrossRef]
- Calatayud-Vernich, P.; Calatayud, F.; Simó, E.; Picó, Y. Pesticide residues in honey bees, pollen and beeswax: Assessing beehive exposure. Environ. Pollut. 2018, 241, 106–114. [Google Scholar] [CrossRef]
- Lindström, S.A.; Klatt, B.K.; Smith, H.G.; Bommarco, R. Crop management affects pollinator attractiveness and visitation in oilseed rape. Basic Appl. Ecol. 2018, 26, 82–88. [Google Scholar] [CrossRef]
- Rundlöf, M.; Andersson, G.; Bommarco, R.; Fries, I.; Hederström, V.; Herbertsson, L.; Jonsson, O.; Klatt, B.; Pedersen, T.R.; Yourstone, J.; et al. Seed coating with a neonicotinoid insecticide negatively affects wild bees. Nature 2015, 521, 77–80. [Google Scholar] [CrossRef]
- Stanley, D.A.; Smith, K.E. Raine NE Bumblebee learning and memory is impaired by chronic exposure to a neonicotinoid pesticide. Sci. Rep. 2015, 5, 16508. [Google Scholar] [CrossRef]
- Tamburini, G.; Pereira-Peixoto, M.-H.; Borth, J.; Lotz, S.; Wintermantel, D.; Allan, M.J.; Dean, R.; Schwarz, J.M.; Knauer, A.; Albrecht, M.; et al. Fungicide and insecticide exposure adversely impacts bumblebees and pollination services under semi-field conditions. Environ. Int. 2021, 157, 106813. [Google Scholar] [CrossRef]
- Cullen, M.G.; Thompson, L.J.; Carolan, J.C.; Stout, J.C.; Stanley, D.A. Fungicides, herbicides and bees: A systematic review of existing research and methods. PLoS ONE 2019, 14, e0225743. [Google Scholar] [CrossRef]
- Motta, E.V.S.; Raymann, K.; Moran, N.A. Glyphosate perturbs the gut microbiota of honey bees. Proc. Natl. Acad. Sci. USA 2018, 115, 10305–10310. [Google Scholar] [CrossRef]
- Sgolastra, F.; Arnan, X.; Cabbri, R.; Isani, G.; Medrzycki, P.; Teper, D.; Bosch, J. Combined exposure to sublethal concentrations of an insecticide and a fungicide affect feeding, ovary development and longevity in a solitary bee. Proc. R. Soc. B 2018, 285, 20180887. [Google Scholar] [CrossRef]
- Tomé, H.V.; Schmehl, D.R.; Wedde, A.E.; Godoy, R.S.; Ravaiano, S.N.V.; Guedes, R.N.; Martins, G.F.; Ellis, J.D. Frequently encountered pesticides can cause multiple disorders in developing worker honey bees. Environ. Pollut. 2020, 256, 113420. [Google Scholar] [CrossRef]
- Bottero, I.; Hodge, S.; Stout, J. Taxon-specific temporal shifts in pollinating insects in mass-flowering crops and field margins in Ireland. J. Pollinat. Ecol. 2021, 28, 90–107. [Google Scholar] [CrossRef]
- Kaluza, B.F.; Wallace, H.; Heard, T.; Minden, V.; Klein, A.; Leonhardt, S.D. Social bees are fitter in more biodiverse environments. Sci. Rep. 2018, 8, 12353. [Google Scholar] [CrossRef]
- Papanikolaou, A.D.; Kühn, I.; Frenzel, M.; Schweiger, O. Semi-natural habitats mitigate the effects of temperature rise on wild bees. J. Appl. Ecol. 2017, 54, 527–536. [Google Scholar] [CrossRef]
- Sprague, R.; Boyer, S.; Stevenson, G.M.; Wratten, S.D. Assessing pollinators’ use of floral resource subsidies in agri-environment schemes: An illustration using Phacelia tanacetifolia and honeybees. PeerJ 2016, 4, e2677. [Google Scholar] [CrossRef]
- Albrecht, M.; Kleijn, D.; Williams, N.; Tschumi, M.; Blaauw, B.; Bommarco, R.; Campbell, A.; Dainese, M.; Drummond, F.; Entling, M.; et al. Global synthesis of the effectiveness of flower strips and hedgerows on pest control, pollination services and crop yield. Ecol. Lett. 2020, 23, 1488–1498. [Google Scholar] [CrossRef]
- Von Königslöw, V.; Fornoff, F.; Klein, A.M. Pollinator enhancement in agriculture: Comparing sown flower strips, hedges and sown hedge herb layers in apple orchards. Biodivers. Conserv. 2022, 31, 433–451. [Google Scholar] [CrossRef]
- Ekroos, J.; Kleijn, D.; Batáry, P.; Albrecht, M.; Báldi, A.; Blüthgen, N.; Knop, E.; Kovács-Hostyánszki, A.; Smith, H.G. High land-use intensity in grasslands constrains wild bee species richness in Europe. Biol. Conserv. 2020, 241, 108255. [Google Scholar] [CrossRef]
- Wintermantel, D.; Odoux, J.-F.; Chadœuf, J.; Bretagnolle, V. Organic farming positively affects honeybee colonies in a flower-poor period in agricultural landscapes. J. Appl. Ecol. 2019, 56, 1960–1969. [Google Scholar] [CrossRef]
- Connelly, H.; Poveda, K.; Loeb, G. Landscape simplification decreases wild bee pollination services to strawberry. Agric. Ecosyst. Environ. 2015, 211, 51–56. [Google Scholar] [CrossRef]
- Porcel, M.; Andersson, G.K.S.; Pålsson, J.; Tasin, M. Organic management in apple orchards: Higher impacts on biological control than on pollination. J. Appl. Ecol. 2018, 55, 2779–2789. [Google Scholar] [CrossRef]
- St. Clair, A.L.; Zhang, G.; Dolezal, A.G.; O’Neal, M.E.; Toth, A.L. Diversified farming in a monoculture landscape: Effects on honey bee health and wild bee communities. Environ. Entomol. 2020, 49, 753–764. [Google Scholar] [CrossRef]
- Straub, L.; Minnameyer, A.; Strobl, V.; Kolari, E.; Friedli, A.; Kalbermatten, I.; Merkelbach, A.J.W.M.; Yanez, O.; Neumann, P. From antagonism to synergism: Extreme differences in stressor interactions in one species. Sci. Rep. 2020, 10, 4667. [Google Scholar] [CrossRef]
- Centrella, M.; Russo, L.; Ramírez, N.M.; Eitzer, B.; Van Dyke, M.; Danforth, B.; Poveda, K. Diet diversity and pesticide risk mediate the negative effects of land use change on solitary bee offspring production. J. Appl. Ecol. 2020, 57, 1031–1042. [Google Scholar] [CrossRef]
- Dance, C.; Botías, C.; Goulson, D. The combined effects of a monotonous diet and exposure to thiamethoxam on the performance of bumblebee micro-colonies. Ecotoxicol. Environ. Saf. 2017, 139, 194–201. [Google Scholar] [CrossRef]
- Alaux, C.; Ducloz, F.; Crauser, D.; Le Conte, Y. Diet effects on honeybee immunocompetence. Biol. Lett. 2010, 6, 562–565. [Google Scholar] [CrossRef]
- Harwood, G.P.; Dolezal, A.G. Pesticide-virus interactions in honey bees: Challenges and opportunities for understanding drivers of bee declines. Viruses 2020, 12, 566. [Google Scholar] [CrossRef]
- O’Neal, S.T.; Anderson, T.D.; Wu-Smart, J.Y. Interactions between pesticides and pathogen susceptibility in honey bees. Curr. Opin. Insect Sci. 2018, 26, 57–62. [Google Scholar] [CrossRef]
- Sanchez-Bayo, F.; Goulson, D.; Pennacchio, F.; Nazzi, F.; Goka, K.; Desneux, N. Are bee diseases linked to pesticides?—A brief review. Environ. Int. 2016, 89–90, 7–11. [Google Scholar] [CrossRef]
- Graystock, P.; Ng, W.H.; Parks, K.; Tripodi, A.D.; Muñiz, P.A.; Fersch, A.A.; Myers, C.R.; McFrederick, Q.S.; McArt, S.H. Dominant bee species and floral abundance drive parasite temporal dynamics in plant-pollinator communities. Nat. Ecol. Evol. 2020, 4, 1358–1367. [Google Scholar] [CrossRef]
- Siviter, H.; Bailes, E.J.; Martin, C.D.; Oliver, T.R.; Koricheva, J.; Leadbeater, E.; Brown, M.J.F. Agrochemicals interact synergistically to increase bee mortality. Nature 2021, 596, 7872. [Google Scholar] [CrossRef]
- Mayer, C.; Adler, L.; Armbruster, W.S.; Dafni, A.; Eardley, C.; Huang, S.Q.; Kevan, P.G.; Ollerton, J.; Packer, L.; Ssymank, A.; et al. Pollination ecology in the 21st century: Key questions for future research. J. Pollinat. Ecol. 2011, 3, 8–23. [Google Scholar] [CrossRef]
- Carré, G.; Roche, P.; Chifflet, R.; Morison, N.; Bommarco, R.; Harrison-Cripps, J.; Krewenka, K.; Potts, S.G.; Roberts, S.P.; Rodet, G.; et al. Landscape context and habitat type as drivers of bee diversity in European annual crops. Agric. Ecosyst. Environ. 2009, 133, 40–47. [Google Scholar] [CrossRef]
- Firbank, L.G.; Heard, M.S.; Woiwod, I.P.; Hawes, C.; Haughton, A.J.; Champion, G.T.; Scott, R.J.; Hill, M.O.; Dewar, A.M.; Squire, G.R.; et al. An introduction to the Farm-Scale Evaluations of genetically modified herbicide-tolerant crops. J. Appl. Ecol. 2003, 40, 2–16. [Google Scholar] [CrossRef]
- Roquer-Beni, L.; Alins, G.; Arnan, X.; Boreux, V.; García, D.; Hambäck, P.A.; Happe, A.K.; Klein, A.M.; Miñarro, M.; Mody, K.; et al. Management-dependent effects of pollinator functional diversity on apple pollination services: A response-effect trait approach. J. Appl. Ecol. 2021, 58, 2843–2853. [Google Scholar] [CrossRef]
- Samnegård, U.; Alins, G.; Boreux, V.; Bosch, J.; García, D.; Happe, A.; Klein, A.; Miñarro, M.; Mody, K.; Porcel, M.; et al. Management trade-offs on ecosystem services in apple orchards across Europe: Direct and indirect effects of organic production. J. Appl. Ecol. 2019, 56, 802–811. [Google Scholar] [CrossRef]
- Scheper, J.; Holzschuh, A.; Kuussaari, M.; Potts, S.G.; Rundlöf, M.; Smith, H.G.; Kleijn, D. Environmental factors driving the effectiveness of European agri-environmental measures in mitigating pollinator loss—A meta-analysis. Ecol. Lett. 2013, 16, 912–920. [Google Scholar] [CrossRef]
- Woodcock, B.A.; Heard, M.S.; Jitlal, M.S.; Rundlöf, M.; Bullock, J.M.; Shore, R.F.; Pywell, R.F. Replication, effect sizes and identifying the biological impacts of pesticides on bees under field conditions. J. Appl. Ecol. 2016, 53, 1358–1362. [Google Scholar] [CrossRef]
- Gillespie, M.A.K.; Baude, M.; Biesmeijer, J.; Boatman, N.; Budge, G.E.; Crowe, A.; Memmott, J.; Morton, R.D.; Pietravalle, S.; Potts, S.G.; et al. A method for the objective selection of landscape-scale study regions and sites at the national level. Methods Ecol. Evol. 2017, 8, 1468–1476. [Google Scholar] [CrossRef]
- Lang, D.J.; Wiek, A.; Bergmann, M. Transdisciplinary research in sustainability science: Practice, principles, and challenges. Sustain. Sci. 2012, 7, 25–43. [Google Scholar] [CrossRef]
- Brown, M.; Breeze, T.; Bulet, P.; Chauzat, M.P.; Demirova, I.; de Miranda, J.; Klein, A.M.; Mand, M.; Metodiev, T.; Michez, D.; et al. PoshBee: Pan-European Assessment, Monitoring, and Mitigation of Stressors on the Health of Bees. RIO 2021, preprint. [Google Scholar] [CrossRef]
- Mishra, A.; Chandrasekaran, A.; MacCormack, A. Collaboration in multi-partner R&D projects: The impact of partnering scale and scope. J. Oper. Manag. 2015, 33–34, 1–14. [Google Scholar]
- Scholz, R.W.; Steiner, G. The real type and ideal type of transdisciplinary processes: Part II—What constraints and obstacles do we meet in practice? Sustain. Sci. 2015, 10, 653–671. [Google Scholar] [CrossRef]
- Geldmann, J.; Gonzalez-Varo, J.P. Conserving honey bees does not help wildlife. Science 2018, 359, 392–393. [Google Scholar] [CrossRef]
- Lindström, S.A.M.; Herbertsson, L.; Rundlöf, M.; Bommarco, R.; Smith, H.G. Experimental evidence that honeybees depress wild insect densities in a flowering crop. Proc. R. Soc. Ser. B 2016, 283, 20161641. [Google Scholar] [CrossRef]
- Stanley, D.A.; Stout, J.C. Pollinator sharing between mass-flowering oilseed rape and co-flowering wild plants: Implications for wild plant pollination. Plant Ecol. 2014, 215, 315–325. [Google Scholar] [CrossRef]
- Furst, M.A.; McMahon, D.P.; Osborne, J.L.; Paxton, R.J.; Brown, M.J.F. Disease associations between honeybees and bumblebees as a threat to wild pollinators. Nature 2014, 506, 364. [Google Scholar] [CrossRef] [PubMed]
- Yang, S.; Gayral, P.; Zhao, H.; Wu, Y.; Jiang, X.; Wu, Y.; Bigot, D.; Wang, X.; Yang, D.; Herniou, E.A.; et al. Occurrence and molecular phylogeny of honey bee viruses in vespids. Viruses 2020, 12, 6. [Google Scholar] [CrossRef] [PubMed]
- Wood, T.J.; Michez, D.; Paxton, R.J.; Drossart, M.; Neumann, P.; Gerard, M.; Vanderplanck, M.; Barraud, A.; Martinet, B.; Leclercq, N.; et al. Managed honey bees as a radar for wild bee decline? Apidologie 2020, 51, 1100–1116. [Google Scholar] [CrossRef]
- Ghini, S.; Fini, F.; Girotti, S.; Fernández, M.; Pico, Y.; Marín, R.; Mañes, J. Occurrence and distribution of pesticides in the province of Bologna, Italy, using honeybees as bioindicators. Arch. Environ. Contam. Toxicol. 2004, 47, 479–488. [Google Scholar] [CrossRef]
- European Food Safety Authority. Guidance on the risk assessment of plant protection products on bees (Apis mellifera, Bombus spp. and solitary bees). EFSA J. 2013, 11, 3295. [Google Scholar]
- Gathmann, A.; Tscharntke, T. Foraging ranges of solitary bees. J. Anim. Ecol. 2002, 71, 757–764. [Google Scholar] [CrossRef]
- Hofmann, M.M.; Fleischmann, A.; Renner, S.S. Foraging distances in six species of solitary bees with body lengths of 6 to 15 mm, inferred from individual tagging, suggest 150 m-rule-of-thumb for flower strip distances. J. Hymenopt. Res. 2020, 77, 105–117. [Google Scholar] [CrossRef]
- Zurbuchen, A.; Landert, L.; Klaiber, J.; Müller, A.; Hein, S.; Dorn, S. Maximum foraging ranges in solitary bees: Only few individuals have the capability to cover long foraging distances. Biol. Conserv. 2010, 143, 669–676. [Google Scholar] [CrossRef]
- Beekman, M.; Ratnieks, F.L.W. Long-range foraging by the honey-bee, Apis mellifera L. Funct. Ecol. 2000, 14, 490–496. [Google Scholar] [CrossRef]
- Hagler, J.R.; Mueller, S.; Teuber, L.R.; Machtley, S.A.; Van Deynze, A. Foraging range of honey bees, Apis mellifera, in alfalfa seed production fields. J. Insect Sci. 2011, 11, 144. [Google Scholar] [CrossRef]
- Steffan-Dewenter, I.; Kuhn, A. Honeybee foraging in differentially structured landscapes. Proc. R. Soc. B 2003, 270, 569–575. [Google Scholar] [CrossRef]
- Osborne, J.L.; Martin, A.P.; Carreck, N.L.; Swain, J.L.; Knight, M.E.; Goulson, D.; Hale, R.J.; Sanderson, R.A. Bumblebee flight distances in relation to the forage landscape. J. Anim. Ecol. 2008, 77, 406–415. [Google Scholar] [CrossRef]
- Walther-Hellwig, K.; Frankl, R. Foraging habitats and foraging distances of bumblebees, Bombus spp. (Hym., Apidae), in an agricultural landscape. J. Appllied Entomol. 2000, 124, 299–306. [Google Scholar] [CrossRef]
- Hagen, M.; Wikelski, M.; Kissling, W.D. Space use of bumblebees (Bombus spp.) revealed by radio-tracking. PLoS ONE 2011, 6, e19997. [Google Scholar] [CrossRef]
- Goulson, D.; Stout, J.C. Homing ability of the bumblebee Bombus terrestris. (Hymenoptera: Apidae). Apidologie 2001, 32, 105–111. [Google Scholar] [CrossRef]
- Hodge, S.; Stout, J. Protocols for Methods of Field Sampling. Deliverable D1.1 PoshBee Project, Grant agreement No. 773921. 2019. Available online: Poshbee.eu (accessed on 11 July 2022).
- Perrot, T.; Gaba, S.; Roncoroni, M.; Gautier, J.-L.; Bretagnolle, V. Bees increase oilseed rape yield under real field conditions. Agric. Ecosyst. Environ. 2018, 266, 39–48. [Google Scholar] [CrossRef]
- Holzschuh, A.; Dormann, C.F.; Tscharntke, T.; Steffan-Dewenter, I. Mass-flowering crops enhance wild bee abundance. Oecologia 2013, 172, 477–484. [Google Scholar] [CrossRef]
- Wix, N.; Reich, M.; Schaarschmidt, F. Butterfly richness and abundance in flower strips and field margins: The role of local habitat quality and landscape context. Heliyon 2019, 5, e01636. [Google Scholar] [CrossRef]
- Ahmed, K.S.D.; Volpato, A.; Day, M.F.; Mulkeen, C.J.; O’Hanlon, A.; Carey, J.; Williams, C.; Ruas, S.; Moran, J.; Rotchés-Ribalta, R.; et al. Linear habitats across a range of farming intensities contribute differently to dipteran abundance and diversity. Insect Conserv. Divers. 2021, 14, 335–347. [Google Scholar] [CrossRef]
- Szigeti, V.; Kőrösi, Á.; Harnos, A.; Nagy, J.; Kis, J. Measuring floral resource availability for insect pollinators in temperate grasslands—A review. Ecol. Entomol. 2016, 41, 231–240. [Google Scholar] [CrossRef]
- Westphal, C.; Bommarco, R.; Carré, G.; Lamborn, E.; Morison, N.; Petanidou, T.; Potts, S.G.; Roberts, S.P.M.; Szentgyörgyi, H.; Tscheulin, T.; et al. Measuring bee diversity in different European habitats and biogeographical regions. Ecol. Monogr. 2008, 78, 653–671. [Google Scholar] [CrossRef]
- Daniele, G.; Giroud, B.; Jabot, C.; Vulliet, E. Exposure assessment of honeybees through study of hive matrices: Analysis of selected pesticide residues in honeybees, beebread, and beeswax from French beehives by LC-MS/MS. Environ. Sci. Pollut. Res. 2018, 25, 6145–6153. [Google Scholar] [CrossRef]
- Mitchell, E.A.D.; Mulhauser, B.; Mulot, M.; Mutabazi, A.; Glauser, G.; Aebi, A. A worldwide survey of neonicotinoids in honey. Science 2017, 358, 109–111. [Google Scholar] [CrossRef]
- Ostiguy, N.; Drummond, F.A.; Aronstein, K.; Eitzer, B.; Ellis, J.D.; Spivak, M.; Sheppard, W.S. Honey bee exposure to pesticides: A four-year nationwide study. Insects 2019, 10, 13. [Google Scholar] [CrossRef]
- Raimets, R.; Bontšutšnaja, A.; Bartkevics, V.; Pugajeva, I.; Kaart, T.; Puusepp, L.; Pihlik, P.; Keres, I.; Viinalass, H.; Mänd, M.; et al. Pesticide residues in beehive matrices are dependent on collection time and matrix type but independent of proportion of foraged oilseed rape and agricultural land in foraging territory. Chemosphere 2020, 238, 124555. [Google Scholar] [CrossRef]
- Belsky, J.; Joshi, N.K. Effects of fungicide and herbicide chemical exposure on Apis and non-Apis bees in agricultural landscape. Front. Environ. Sci. 2020, 8, 81. [Google Scholar] [CrossRef]
- Azpiazu, C.; Bosch, J.; Bortolotti, L.; Medrzycki, P.; Teper, D.; Molowny-Horas, R.; Sgolastra, F. Toxicity of the insecticide sulfoxaflor alone and in combination with the fungicide fluxapyroxad in three bee species. Sci. Rep. 2021, 11, 6821. [Google Scholar] [CrossRef]
- Zhu, Y.C.; Yao, J.; Adamczyk, J. Synergistic toxicity and physiological impact of imidacloprid alone and binary mixtures with seven representative pesticides on honey bee (Apis mellifera). PLoS ONE 2017, 12, e0176837. [Google Scholar] [CrossRef]
- Burden, C.M.; Morgan, M.O.; Hladun, K.R.; Amdam, G.V.; Trumble, J.J.; Smith, B.H. Acute sublethal exposure to toxic heavy metals alters honey bee (Apis mellifera) feeding behavior. Sci. Rep. 2019, 9, 4253. [Google Scholar] [CrossRef]
- Goretti, E.; Pallottini, M.; Rossi, R.; La Porta, G.; Gardi, T.; Goga, B.C.; Elia, A.; Galletti, M.; Moroni, B.; Petroselli, C.; et al. Heavy metal bioaccumulation in honey bee matrix, an indicator to assess the contamination level in terrestrial environments. Environ. Pollut. 2020, 256, 113388. [Google Scholar] [CrossRef]
- Rodrigues, C.G.; Krüger, A.P.; Barbosa, W.F.; Guedes, R.N.C. Leaf fertilizers affect survival and behavior of the Neotropical stingless bee Friesella schrottkyi (Meliponini: Apidae: Hymenoptera). J. Econ. Entomol. 2016, 109, 1001–1008. [Google Scholar] [CrossRef] [PubMed]
- Katsoulas, N.; Løes, A.-K.; Andrivon, D.; Cirvilleri, G.; de Cara, M.; Kir, A.; Knebl, L.; Malińska, K.; Oudshoorn, F.W.; Willer, H.; et al. Current use of copper, mineral oils and sulphur for plant protection in organic horticultural crops across 10 European countries. Org. Agric. 2020, 10, S159–S171. [Google Scholar] [CrossRef]
- Botías, C.; David, A.; Hill, E.M.; Goulson, D. Contamination of wild plants near neonicotinoid seed-treated crops, and implications for non-target insects. Sci. Total Environ. 2016, 56, 269–278. [Google Scholar] [CrossRef] [PubMed]
- Botías, C.; David, A.; Horwood, J.; Abdulsada, A.K.; Nicholls, E.; Hill, E.M.; Goulson, D. Neonicotinoid residues in wildflowers, a potential route of chronic exposure for bees. Environ. Sci. Technol. 2015, 49, 12731–12740. [Google Scholar] [CrossRef]
- David, A.; Botías, C.; Abdul-Sada, A.; Nicholls, E.; Rotheray, E.L.; Hill, E.M.; Goulson, D. Widespread contamination of wildflower and bee-collected pollen with complex mixtures of neonicotinoids and fungicides commonly applied to crops. Environ. Int. 2016, 88, 169–178. [Google Scholar] [CrossRef]
- Zioga, E.; Kelly, R.; White, B.; Stout, J.C. Plant protection product residues in plant pollen and nectar: A review of current knowledge. Environ. Res. 2020, 189, 109873. [Google Scholar] [CrossRef]
- Russo, L.; Danfort, B. Pollen preferences among the bee species visiting apple (Malus pumila) in New York. Apidologie 2017, 48, 806–820. [Google Scholar] [CrossRef]
- Stanley, D.A.; Stout, J.C. Quantifying the impacts of bioenergy crops on pollinating insect abundance and diversity: A field-scale evaluation reveals taxon-specific responses. J. Appl. Ecol. 2013, 50, 335–344. [Google Scholar] [CrossRef]
- di Pasquale, G.; Alaux, C.; Le Conte, Y.; Odoux, J.F.; Pioz, M.; Vaissière, B.E.; Belzunces, L.P.; Decourtye, A. Variations in the availability of pollen resources affect honey bee health. PLoS ONE 2016, 11, e0162818. [Google Scholar]
- Goulson, D.; Nicholls, E.; Botías, C.; Rotheray, E.L. Bee declines driven by combined stress from parasites, pesticides, and lack of flowers. Science 2015, 347, 1255957. [Google Scholar] [CrossRef]
- Hicks, D.M.; Ouvrard, P.; Baldock, K.; Baude, M.; Goddard, M.; Kunin, W.E.; Mitschunas, N.; Memmott, J.; Morse, H.; Nikolitsi, M.; et al. Food for pollinators: Quantifying the nectar and pollen resources of urban flower meadows. PLoS ONE 2016, 11, e0158117. [Google Scholar] [CrossRef]
- Coudrain, V.; Rittiner, S.; Herzog, F.; Tinner, W.; Entling, M.H. Landscape distribution of food and nesting sites affect larval diet and nest size, but not abundance of Osmia bicornis. Insect Sci. 2016, 23, 746–753. [Google Scholar] [CrossRef]
- Beaurepaire, A.; Piot, N.; Doublet, V.; Antunez, K.; Campbell, E.; Chantawannakul, P.; Chejanovsky, N.; Gajda, A.; Heerman, M.; Panziera, D.; et al. Diversity and global distribution of viruses of the Western Honey Bee. Insects 2020, 11, 239. [Google Scholar] [CrossRef]
- Budge, G.E.; Simcock, N.K.; Holder, P.J.; Shirley, M.D.F.; Brown, M.A.; Van Weymers, P.S.M.; Evans, D.J.; Rushton, S.P. Chronic bee paralysis as a serious emerging threat to honey bees. Nat. Commun. 2020, 11, 2164. [Google Scholar] [CrossRef]
- Paxton, R.J.; Schäfer, M.O.; Nazzi, F.; Zanni, V.; Annoscia, D.; Marroni, F.; Bigot, D.; Laws-Quinn, E.R.; Panziera, D.; Jenkins, C.; et al. Epidemiology of a major honey bee pathogen, deformed wing virus: Potential worldwide replacement of genotype A by genotype B. Int. J. Parasitol. Parasites Wildl. 2022, 18, 157–171. [Google Scholar] [CrossRef]
- Cornelissen, B.; Neumann, P.; Schweiger, O. Global warming promotes biological invasion of a honey bee pest. Glob. Chang. Biol. 2019, 25, 3642–3655. [Google Scholar] [CrossRef]
- European Food Safety Authority. AHAW Panel Scientific opinion on the survival, spread and establishment of the small hive beetle (Aethina tumida). EFSA J. 2015, 13, 4328. [Google Scholar]
- Franklin, D.N.; Brown, M.A.; Datta, S.; Cuthbertson, A.; Budge, G.E.; Keeling, M.J. Invasion dynamics of Asian hornet, Vespa velutina (Hymenoptera: Vespidae): A case study of a commune in south-west France. Appl. Entomol. Zool. 2017, 52, 221–229. [Google Scholar] [CrossRef]
- Keeling, M.J.; Franklin, D.N.; Datta, S.; Brown, M.A.; Budge, G.E. Predicting the spread of the Asian hornet (Vespa velutina) following its incursion into Great Britain. Sci. Rep. 2017, 7, 6240. [Google Scholar] [CrossRef]
- Bosch, L.; Kemp, P. How to Manage the Blue Orchard Bee; Handbook Series Book 5; Sustainable Agriculture Network: Beltsville, MD, USA, 2001; 88p. [Google Scholar]
- Cameron, S.A.; Sadd, B.M. Global trends in bumble bee health. Annu. Rev. Entomol. 2020, 65, 209–232. [Google Scholar] [CrossRef]
- Krunić, M.; Stanisavljević, L.; Pinzauti, M.; Felicioli, A. The accompanying fauna of Osmia cornuta and Osmia rufa and effective measures of protection. Bull. Insectol. 2005, 58, 141–152. [Google Scholar]
- Olgun, T.; Everhart, S.E.; Anderson, T.; Wu-Smart, J. Comparative analysis of viruses in four bee species collected from agricultural, urban, and natural landscapes. PLoS ONE 2020, 15, e0234431. [Google Scholar] [CrossRef] [PubMed]
- Schoonvaere, K.; Smagghe, G.; Francis, F.; De Graaf, D.C. Study of the metatranscriptome of eight social and solitary wild bee species reveals novel viruses and bee parasites. Front. Microbiol. 2018, 9, e177. [Google Scholar] [CrossRef] [PubMed]
- Highfield, A.; Kevill, J.; Mordecai, G.; Hunt, J.; Henderson, S.; Sauvard, D.; Feltwell, J.; Martin, S.J.; Sumner, S.; Schroeder, D.C. Detection and replication of Moku Virus in honey bees and social wasps. Viruses 2020, 12, 607. [Google Scholar] [CrossRef]
- Barroso-Arévalo, S.; Fernández-Carrión, E.; Goyache, J.; Molero, F.; Puerta, F.; Sánchez-Vizcaíno, J.M. High load of Deformed Wing Virus and Varroa destructor infestation are related to weakness of honey bee colonies in Southern Spain. Front. Microbiol. 2019, 10, 1331. [Google Scholar] [CrossRef]
- Budge, G.E.; Pietravalle, S.; Brown, M.; Laurenson, L.; Jones, B.; Tomkies, V.; Delaplane, K.S. Pathogens as predictors of honey bee colony strength in England and Wales. PLoS ONE 2015, 10, e0133228. [Google Scholar]
- Chauzat, M.-P.; EPILOBEE Consortium; Jacques, A.; Laurent, M.; Bougeard, S.; Hendrikx, P.; Ribière-Chabert, M. Risk indicators affecting honeybee colony survival in Europe: One year of surveillance. Apidologie 2016, 47, 348–378. [Google Scholar] [CrossRef]
- Hedtke, K.; Jensen, P.M.; Jensen, A.B.; Genersch, E. Evidence for emerging parasites and pathogens influencing outbreaks of stress-related diseases like chalkbrood. J. Invertebr. Pathol. 2011, 108, 167–173. [Google Scholar] [CrossRef]
- Traynor, K.S.; Mondet, F.; de Miranda, J.R.; Techer, M.; Kowallik, V.; Oddie, M.A.; Chantawannakul, P.; McAfee, A. Varroa destructor: A complex parasite, crippling honeybees worldwide. Trends Parasitol. 2020, 36, 592–606. [Google Scholar] [CrossRef]
- Bailey, L.; Ball, B.V. Honey Bee Pathology, 2nd ed.; Academic Press: London, UK, 1991; 193p. [Google Scholar]
- Hernandez, J.; Maisonnasse, A.; Cousin, M. ColEval: Honeybee COLony Structure EVALuation for Field Surveys. Insects 2020, 11, 41. [Google Scholar] [CrossRef]
- Requier, F. Bee colony health indicators: Synthesis and future directions. CAB Rev. 2019, 14, 056. [Google Scholar] [CrossRef]
- Abaga, N.O.Z.; Alibert, P.; Dousset, S.; Savadogo, P.W.; Savadogo, M.; Sedogo, M. Insecticide residues in cotton soils of Burkina Faso and effects of insecticides on fluctuating asymmetry in honey bees (Apis mellifera Linnaeus). Chemosphere 2011, 83, 585–592. [Google Scholar] [CrossRef]
- Jones, J.C.; Helliwell, P.; Beekman, M. The effects of rearing temperature on developmental stability and learning and memory in the honey bee, Apis mellifera. J. Comp. Physiol. A 2005, 191, 1121–1129. [Google Scholar] [CrossRef]
- Nunes, L.A.; de Araújo, E.D.; Marchini, L.C. Fluctuating asymmetry in Apis mellifera (Hymenoptera: Apidae) as bioindicator of anthropogenic environments. Rev. Biol. Trop. 2015, 63, 673–682. [Google Scholar] [CrossRef]
- Vanderplanck, M.; Michez, D.; Albrecht, M.; Attridge, E.; Babin, A.; Bottero, I.; Breeze, T.; Brown, M.; Chauzat, M.-P.; Cini, E.; et al. Monitoring bee health in European agroecosystems using wing morphology and fat bodies. One Ecosyst. 2021, 6, e63653. [Google Scholar] [CrossRef]
- Altaye, S.Z.; Meng, L.; Lu, Y.; Li, J. The emerging proteomic research facilitates in-depth understanding of the biology of honeybees. Int. J. Mol. Sci. 2019, 20, 4252. [Google Scholar] [CrossRef]
- Arafah, K.; Voisin, S.N.; Masson, V.; Alaux, C.; Le Conte, Y.; Bocquet, M.; Bulet, P. MALDI-MS profiling to address honey bee health status under bacterial challenge through computational modeling. Proteomics 2019, 19, e1900268. [Google Scholar] [CrossRef]
- Erban, T.; Sopko, B.; Kadlikova, K.; Talacko, P.; Harant, K. Varroa destructor parasitism has a greater effect on proteome changes than the deformed wing virus and activates TGF-β signaling pathways. Sci. Rep. 2019, 9, 9400. [Google Scholar] [CrossRef]
- Kakumanu, M.L.; Reeves, A.M.; Anderson, T.D.; Rodrigues, R.R.; Williams, M.A. Honey bee gut microbiome is altered by in-hive pesticide exposures. Front. Microbiol. 2016, 7, 1255. [Google Scholar] [CrossRef]
- British Ecological Society. A Guide to Data Management in Ecology and Evolution. 2014. Available online: https://www.britishecologicalsociety.org/wp-content/uploads/Publ_Data-Management-Booklet.pdf (accessed on 1 March 2019).
- DalleMule, L.; Davenport, T.H. What’s your data strategy? Harv. Bus. Rev. 2017, 95, 112–121. [Google Scholar]
- Michener, W.K.; Brunt, J.W. (Eds.) Ecological Data: Design, Management and Processing; Blackwell Science Ltd.: Oxford, UK, 2000; 180p. [Google Scholar]
- Brandt, P.; Ernst, A.; Gralla, F. A review of transdisciplinary research in sustainability science. Ecol. Econ. 2013, 92, 1–15. [Google Scholar] [CrossRef]
- Mauser, W.; Klepper, G.; Rice, M. Transdisciplinary global change research: The co-creation of knowledge for sustainability. Curr. Opin. Environ. Sustain. 2013, 5, 420–431. [Google Scholar] [CrossRef]
- Scholz, R.W.; Steiner, G. The real type and ideal type of transdisciplinary processes: Part I—Theoretical foundations. Sustain. Sci. 2015, 10, 527–544. [Google Scholar] [CrossRef]
- Cochrane, L.; Cundill, G. Enabling collaborative synthesis in multi-partner programmes. Dev. Pract. 2018, 28, 922–931. [Google Scholar] [CrossRef]


Publisher’s Note: MDPI stays neutral with regard to jurisdictional claims in published maps and institutional affiliations. |
© 2022 by the authors. Licensee MDPI, Basel, Switzerland. This article is an open access article distributed under the terms and conditions of the Creative Commons Attribution (CC BY) license (https://creativecommons.org/licenses/by/4.0/).
Share and Cite
Hodge, S.; Schweiger, O.; Klein, A.-M.; Potts, S.G.; Costa, C.; Albrecht, M.; de Miranda, J.R.; Mand, M.; De la Rúa, P.; Rundlöf, M.; et al. Design and Planning of a Transdisciplinary Investigation into Farmland Pollinators: Rationale, Co-Design, and Lessons Learned. Sustainability 2022, 14, 10549. https://doi.org/10.3390/su141710549
Hodge S, Schweiger O, Klein A-M, Potts SG, Costa C, Albrecht M, de Miranda JR, Mand M, De la Rúa P, Rundlöf M, et al. Design and Planning of a Transdisciplinary Investigation into Farmland Pollinators: Rationale, Co-Design, and Lessons Learned. Sustainability. 2022; 14(17):10549. https://doi.org/10.3390/su141710549
Chicago/Turabian StyleHodge, Simon, Oliver Schweiger, Alexandra-Maria Klein, Simon G. Potts, Cecilia Costa, Matthias Albrecht, Joachim R. de Miranda, Marika Mand, Pilar De la Rúa, Maj Rundlöf, and et al. 2022. "Design and Planning of a Transdisciplinary Investigation into Farmland Pollinators: Rationale, Co-Design, and Lessons Learned" Sustainability 14, no. 17: 10549. https://doi.org/10.3390/su141710549
APA StyleHodge, S., Schweiger, O., Klein, A.-M., Potts, S. G., Costa, C., Albrecht, M., de Miranda, J. R., Mand, M., De la Rúa, P., Rundlöf, M., Attridge, E., Dean, R., Bulet, P., Michez, D., Paxton, R. J., Babin, A., Cougoule, N., Laurent, M., Martel, A.-C., ... Stout, J. C. (2022). Design and Planning of a Transdisciplinary Investigation into Farmland Pollinators: Rationale, Co-Design, and Lessons Learned. Sustainability, 14(17), 10549. https://doi.org/10.3390/su141710549