
A Design of Experiment Approach for Development of Electron Beam Powder Bed Fusion Process Parameters and Improvement of Ti-6Al-4V As-Built Properties


 and
and
Abstract
:1. Introduction
2. Experimental Methodology
2.1. Design of Experiment
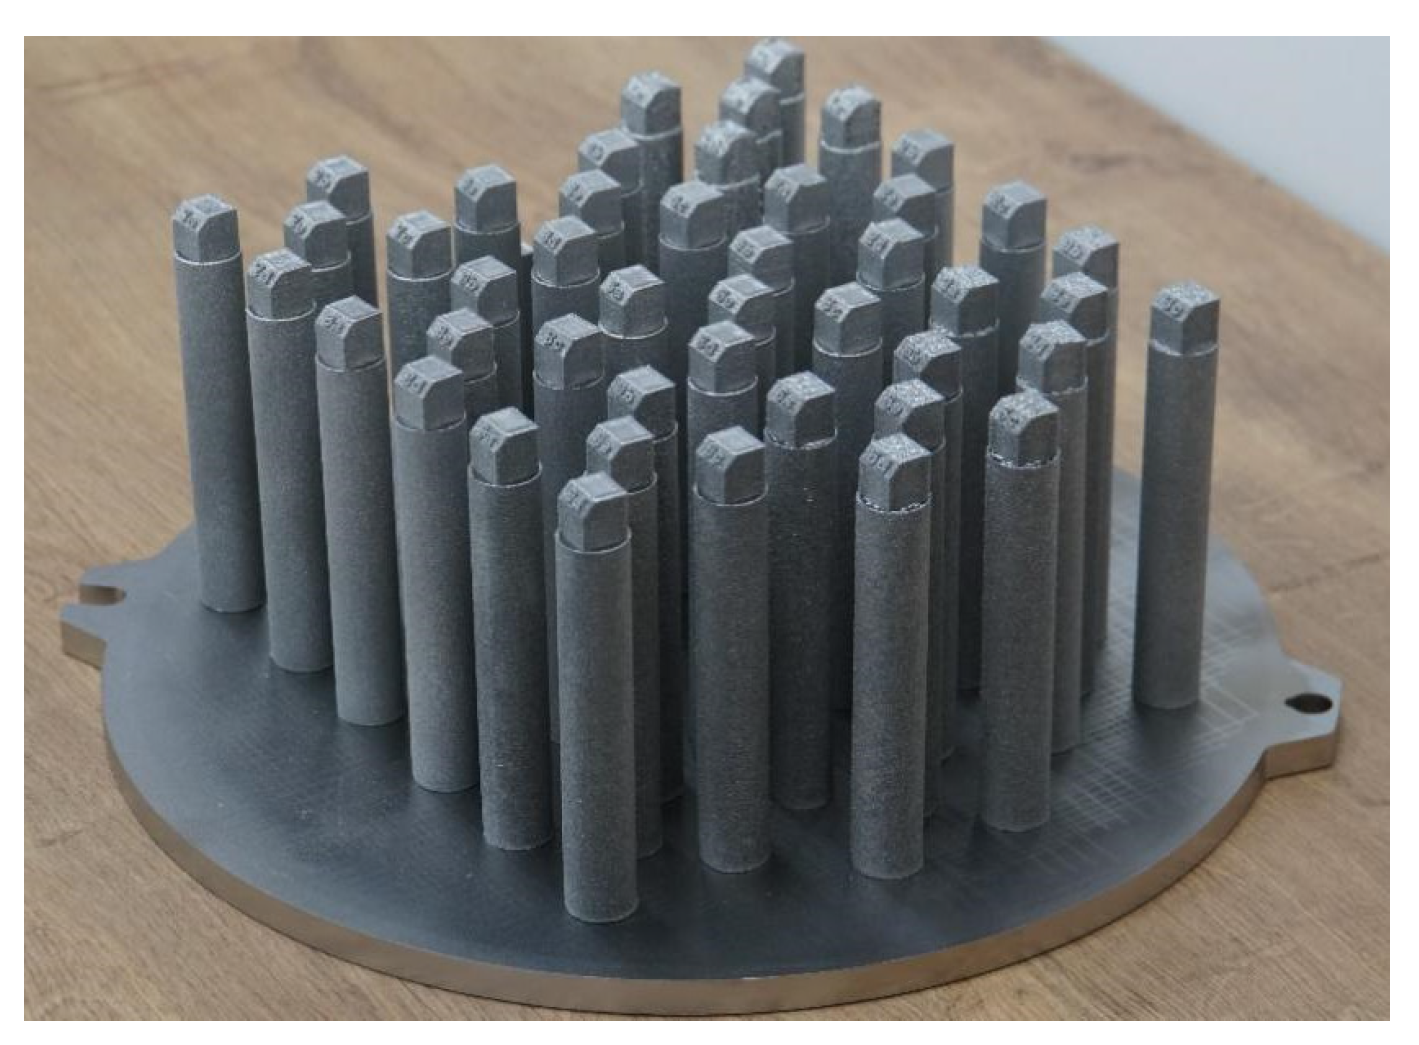
2.2. Sample Preparation
2.3. Sample Characterization
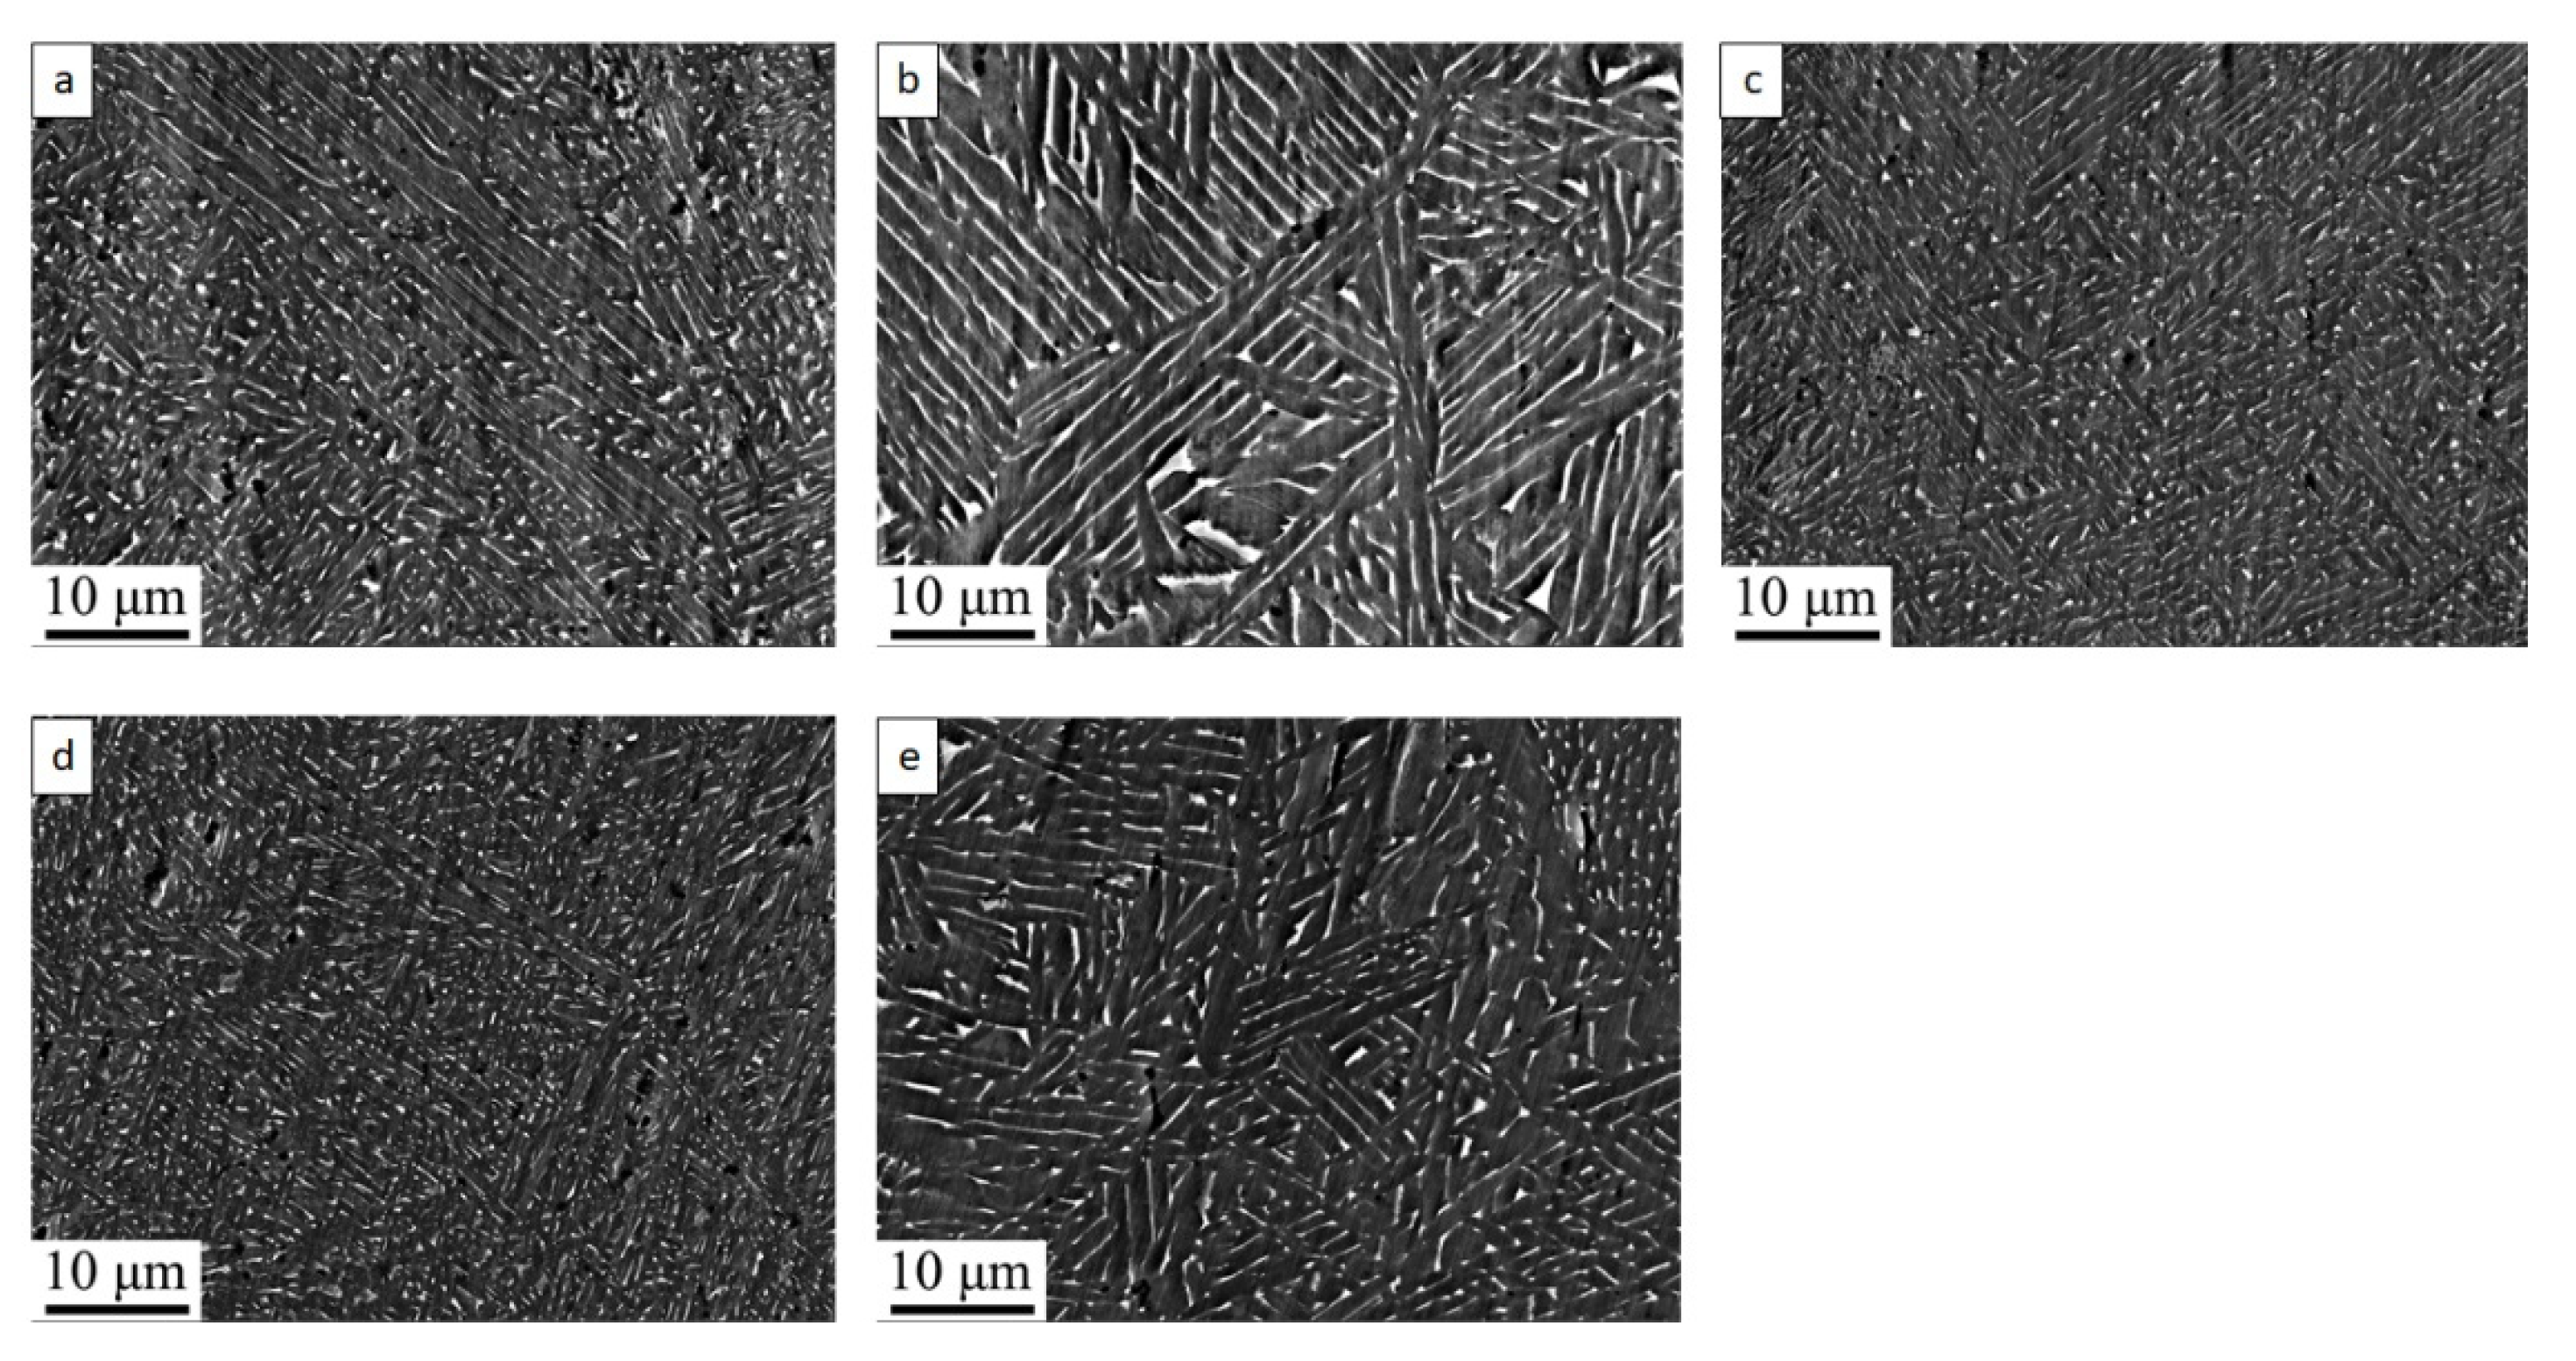
3. Results and Discussion
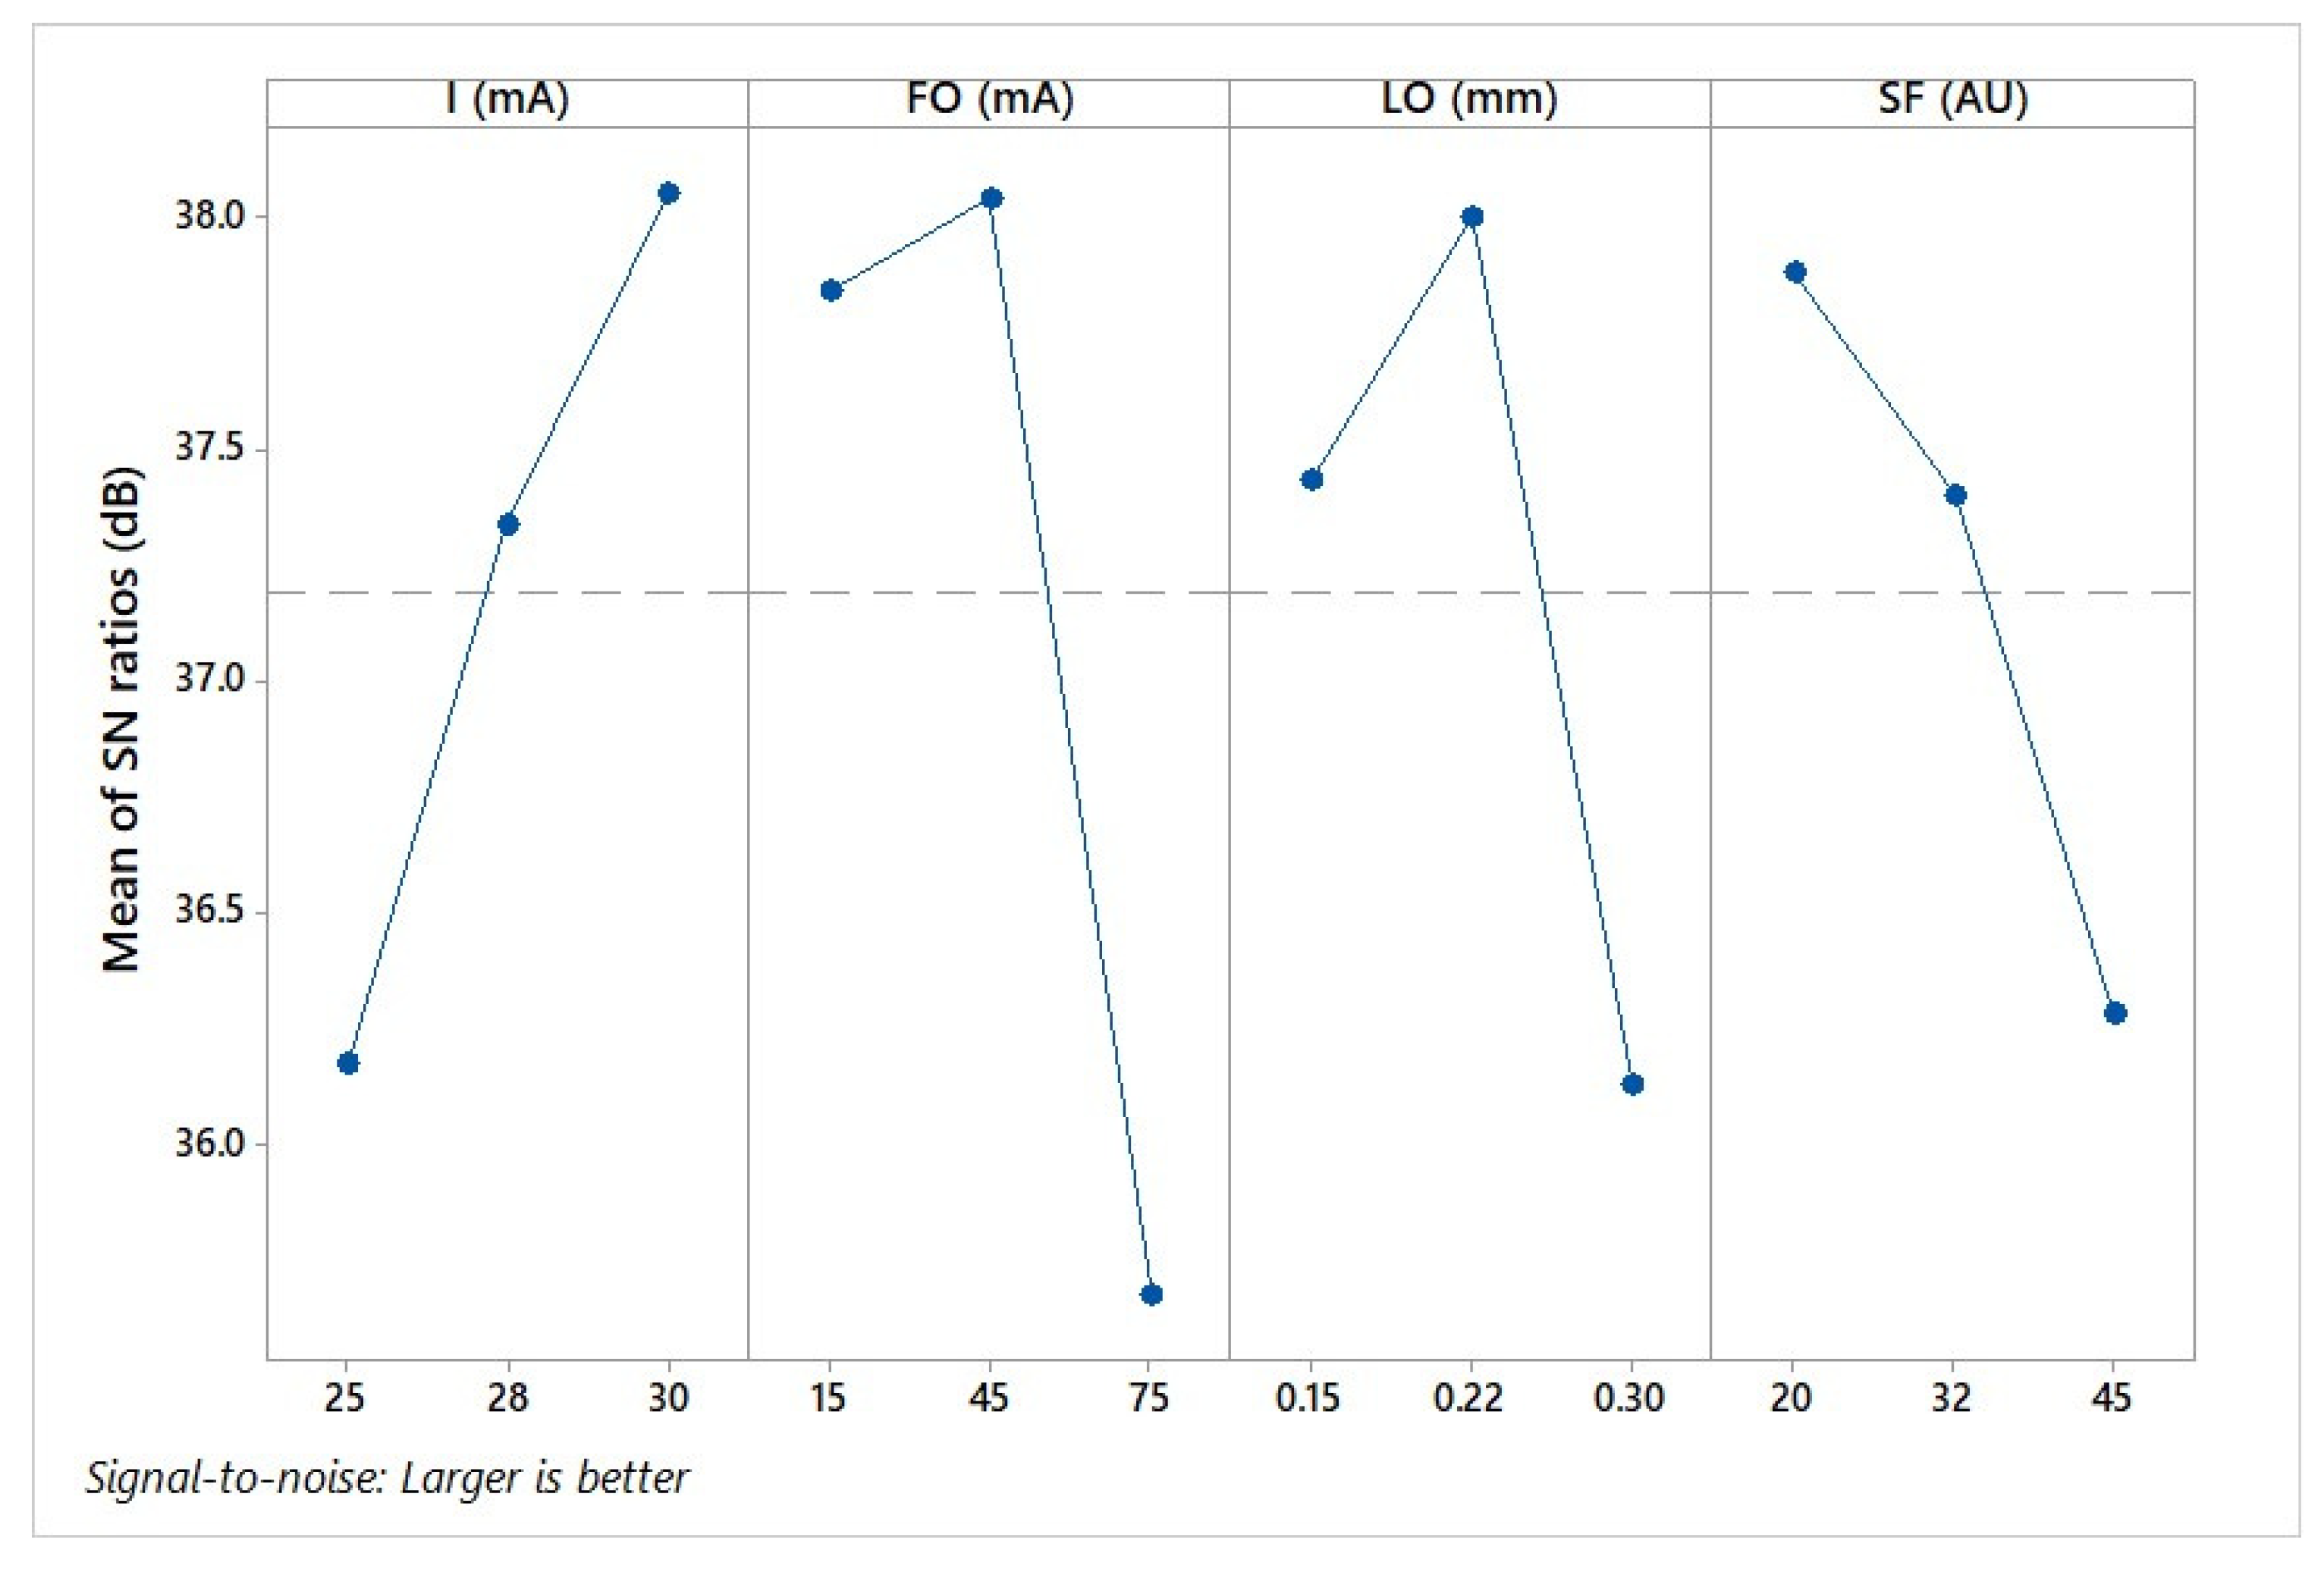
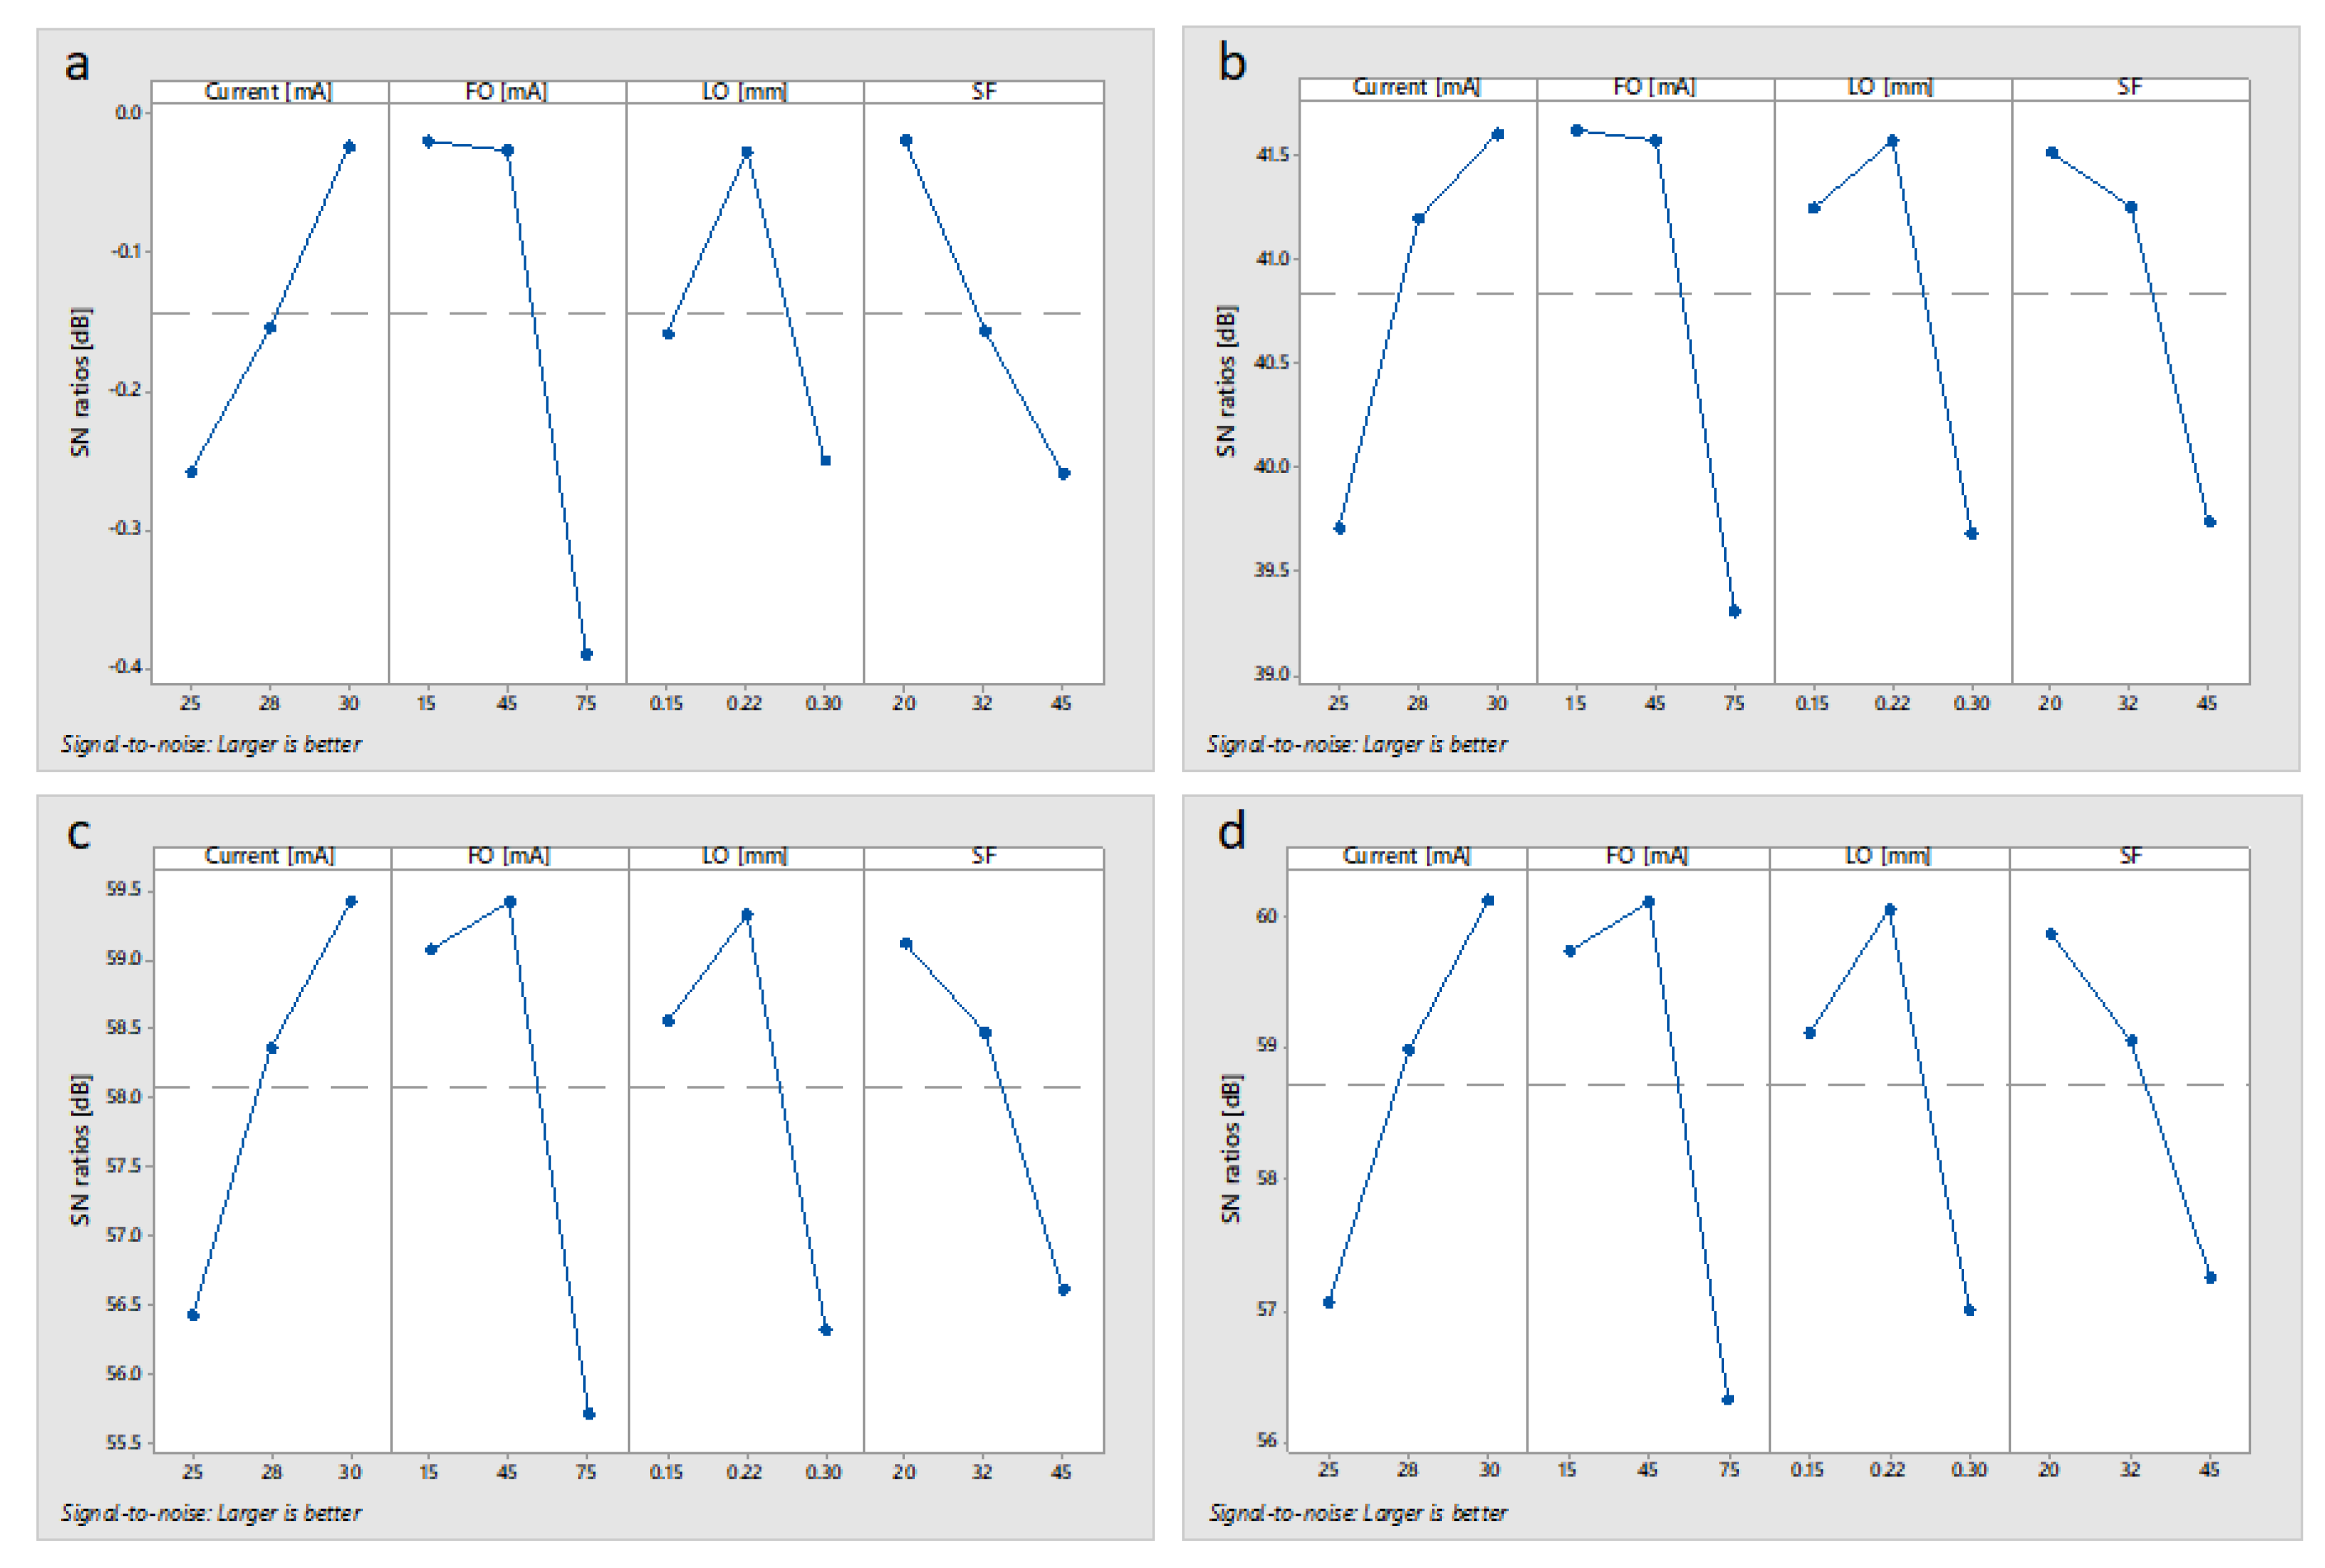
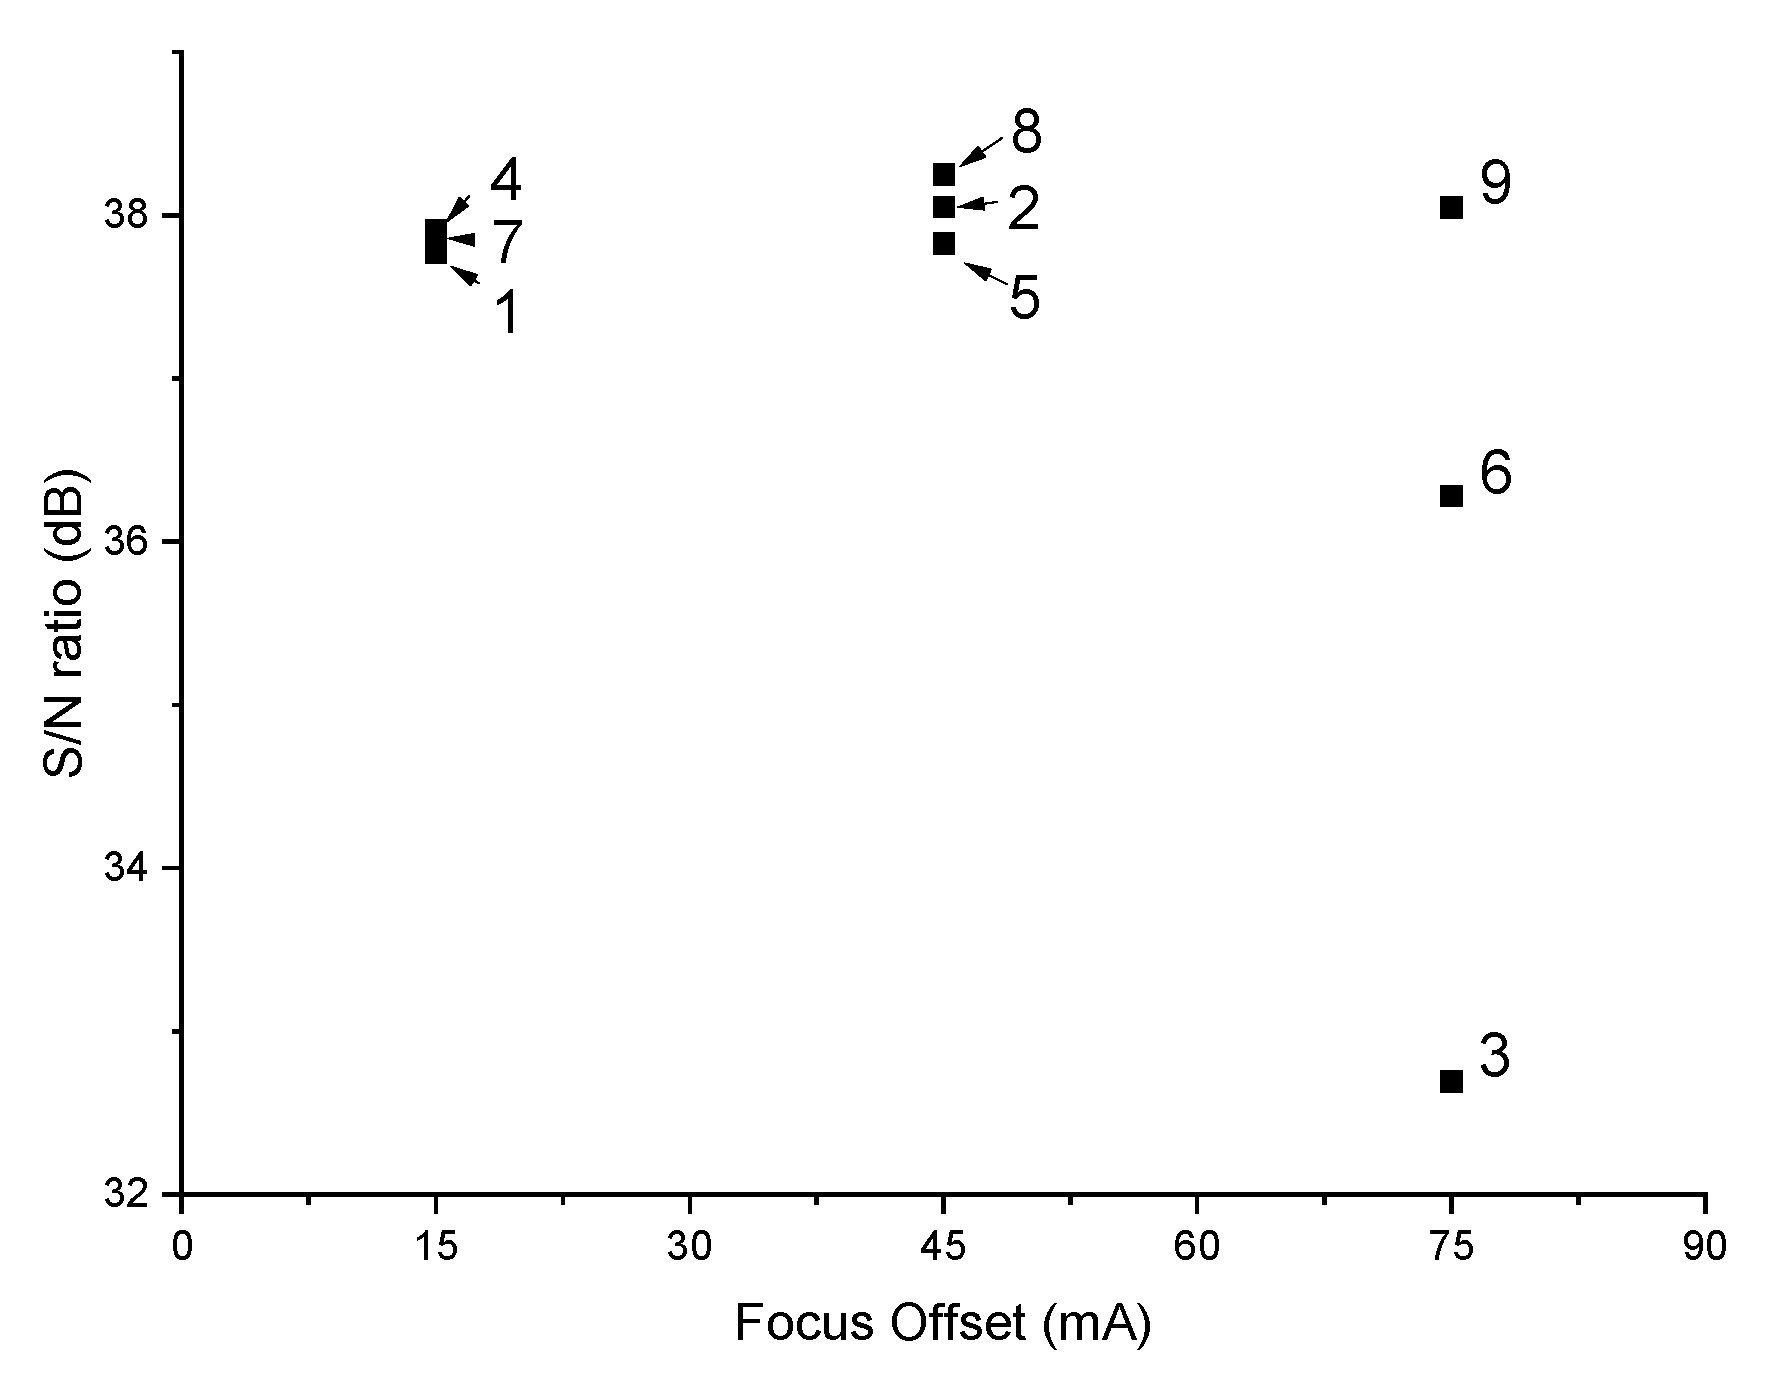
Taguchi Analysis
4. Conclusions and Summary
Author Contributions
Funding
Data Availability Statement
Conflicts of Interest
References
- ASM International. ASM HandBook: Properties and Selection Nonferrous Alloys and Special-Purpose Materials; ASM International: Materials Park, OH, USA, 1990; Volume 2. [Google Scholar]
- Donachie, M.J. Titanium—A Techincal Guide, 2nd ed.; ASM International: Materials Park, OH, USA, 2000; p. 216. [Google Scholar]
- Kaur, M.; Singh, K. Review on titanium and titanium based alloys as biomaterials for orthopaedic applications. Mater. Sci. Eng. C 2019, 102, 844–862. [Google Scholar] [CrossRef] [PubMed]
- Liu, S.; Shin, Y.C. Additive manufacturing of Ti6Al4V alloy: A review. Mater. Des. 2019, 164, 107552. [Google Scholar] [CrossRef]
- Gibson, I.; Rosen, D.; Stucker, B.; Khorasani, M. Additive Manufacturing Technologies: 3D Printing, Rapid Prototyping and Direct Digital Manufacturing, 3rd ed.; Springer: Berlin/Heidelberg, Germany, 2021; ISBN 9783030561260. [Google Scholar]
- Mahamood, R.M. Laser Metal Deposition Process of Metals, Alloys, and Composite Materials; Springer: Berlin/Heidelberg, Germany, 2018; ISBN 9783319649849. [Google Scholar]
- DebRoy, T.; Wei, H.L.; Zuback, J.S.; Mukherjee, T.; Elmer, J.W.; Milewski, J.O.; Beese, A.M.; Wilson-Heid, A.; De, A.; Zhang, W. Additive manufacturing of metallic components—Process, structure and properties. Prog. Mater. Sci. 2017, 92, 112–224. [Google Scholar] [CrossRef]
- Sames, W.J.; List, F.A.; Pannala, S.; Dehoff, R.R.; Babu, S.S. The metallurgy and processing science of metal additive manufacturing. Int. Mater. Rev. 2016, 61, 315–360. [Google Scholar] [CrossRef]
- Galati, M.; Iuliano, L. A literature review of powder-based electron beam melting focusing on numerical simulations. Addit. Manuf. 2018, 19, 1–20. [Google Scholar] [CrossRef]
- Ladani, L. Additive Manufacturing of Metals: Materials, Processes, Tests, and Standards; DEStech Publications, Incorporated: Lancaster, PA, USA, 2021; ISBN 9781605956008. [Google Scholar]
- Körner, C. Additive manufacturing of metallic components by selective electron beam melting—A review. Int. Mater. Rev. 2016, 61, 361–377. [Google Scholar] [CrossRef]
- Herzog, D.; Seyda, V.; Wycisk, E.; Emmelmann, C. Additive manufacturing of metals. Acta Mater. 2016, 117, 371–392. [Google Scholar] [CrossRef]
- Landau, E.; Tiferet, E.; Ganor, Y.I.; Ganeriwala, R.K.; Matthews, M.J.; Braun, D.; Chonin, M.; Ziskind, G. Thermal characterization of the build chamber in electron beam melting. Addit. Manuf. 2020, 36, 101535. [Google Scholar] [CrossRef]
- Fousová, M.; Vojtěch, D.; Doubrava, K.; Daniel, M.; Lin, C.F. Influence of inherent surface and internal defects on mechanical properties of additively manufactured Ti6Al4V alloy: Comparison between selective laser melting and electron beam melting. Materials 2018, 11, 537. [Google Scholar] [CrossRef]
- Rafi, H.K.; Karthik, N.V.; Gong, H.; Starr, T.L.; Stucker, B.E. Microstructures and mechanical properties of Ti6Al4V parts fabricated by selective laser melting and electron beam melting. J. Mater. Eng. Perform. 2013, 22, 3872–3883. [Google Scholar] [CrossRef]
- Vogel, S.C.; Takajo, S.; Kumar, M.A.; Caspi, E.N.; Pesach, A.; Tiferet, E.; Yeheskel, O. Ambient and High-Temperature Bulk Characterization of Additively Manufactured Ti-6Al-4V Using Neutron Diffraction. Jom 2018, 70, 1714–1722. [Google Scholar] [CrossRef]
- Tiferet, E.; Ganor, M.; Zolotaryov, D.; Garkun, A.; Hadjadj, A.; Chonin, M.; Ganor, Y.; Noiman, D.; Halevy, I.; Tevet, O.; et al. Mapping the tray of electron beam melting of Ti-6Al-4V: Properties and microstructure. Materials 2019, 12, 1470. [Google Scholar] [CrossRef] [PubMed]
- Pesach, A.; Tiferet, E.; Vogel, S.C.; Chonin, M.; Diskin, A.; Zilberman, L.; Rivin, O.; Yeheskel, O.; Caspi, E.N. Texture analysis of additively manufactured Ti-6Al-4V using neutron diffraction. Addit. Manuf. 2018, 23, 394–401. [Google Scholar] [CrossRef]
- Takajo, S.; Tomida, T.; Caspi, E.N.; Pesach, A.; Tiferet, E.; Vogel, S.C. Property improvement of additively manufactured Ti64 by heat treatment characterized by in situ high temperature EBSD and neutron diffraction. Metals 2021, 11, 1661. [Google Scholar] [CrossRef]
- Tiferet, E.; Rivin, O.; Ganor, M.; Ettedgui, H.; Ozeri, O.; Caspi, E.N.; Yeheskel, O. Structural investigation of selective laser melting and electron beam melting of Ti-6Al-4V using neutron diffraction. Addit. Manuf. 2016, 10, 43–46. [Google Scholar] [CrossRef]
- Ganor, Y.I.; Tiferet, E.; Vogel, S.C.; Brown, D.W.; Chonin, M.; Pesach, A.; Hajaj, A.; Garkun, A.; Samuha, S.; Shneck, R.Z.; et al. Tailoring microstructure and mechanical properties of additively-manufactured ti6al4v using post processing. Materials 2021, 14, 658. [Google Scholar] [CrossRef]
- Lewandowski, J.J.; Seifi, M. Metal Additive Manufacturing: A Review of Mechanical Properties. Annu. Rev. Mater. Res. 2016, 46, 151–186. [Google Scholar] [CrossRef]
- Zhang, L.C.; Liu, Y.; Li, S.; Hao, Y. Additive Manufacturing of Titanium Alloys by Electron Beam Melting: A Review. Adv. Eng. Mater. 2018, 20, 1–16. [Google Scholar] [CrossRef]
- Zuback, J.S.; Palmer, T.A.; Debroy, T. Additive manufacturing of functionally graded transition joints between ferritic and austenitic alloys. J. Alloys Compd. 2019, 770, 995–1003. [Google Scholar] [CrossRef]
- Kirchner, A.; Klöden, B.; Luft, J.; Weißgärber, T.; Kieback, B. Process window for electron beam melting of Ti-6Al-4V. Powder Metall. 2015, 58, 246–249. [Google Scholar] [CrossRef]
- Gong, X.; Lydon, J.; Cooper, K.; Chou, K. Beam speed effects on Ti-6Al-4V microstructures in electron beam additive manufacturing. J. Mater. Res. 2014, 29, 1951–1959. [Google Scholar] [CrossRef]
- Wang, X.; Gong, X.; Chou, K. Scanning Speed Effect on Mechanical Properties of Ti-6Al-4V Alloy Processed by Electron Beam Additive Manufacturing. Procedia Manuf. 2015, 1, 287–295. [Google Scholar] [CrossRef]
- Guo, C.; Ge, W.; Lin, F. Effects of scanning parameters on material deposition during Electron Beam Selective Melting of Ti-6Al-4V powder. J. Mater. Process. Technol. 2015, 217, 148–157. [Google Scholar] [CrossRef]
- Puebla, K.; Murr, L.E.; Gaytan, S.M.; Martinez, E.; Medina, F.; Wicker, R.B. Effect of Melt Scan Rate on Microstructure and Macrostructure for Electron Beam Melting of Ti-6Al-4V. Mater. Sci. Appl. 2012, 3, 259–264. [Google Scholar] [CrossRef]
- Juechter, V.; Scharowsky, T.; Singer, R.F.; Körner, C. Processing window and evaporation phenomena for Ti-6Al-4V produced by selective electron beam melting. Acta Mater. 2014, 76, 252–258. [Google Scholar] [CrossRef]
- Scharowsky, T.; Bauereiß, A.; Körner, C. Influence of the hatching strategy on consolidation during selective electron beam melting of Ti-6Al-4V. Int. J. Adv. Manuf. Technol. 2017, 92, 2809–2818. [Google Scholar] [CrossRef]
- Scharowsky, T.; Juechter, V.; Singer, R.F.; Körner, C. Influence of the Scanning Strategy on the Microstructure and Mechanical Properties in Selective Electron Beam Melting of Ti-6Al-4V. Adv. Eng. Mater. 2015, 17, 1573–1578. [Google Scholar] [CrossRef]
- Pobel, C.R.; Osmanlic, F.; Lodes, M.A.; Wachter, S.; Körner, C. Processing windows for Ti-6Al-4V fabricated by selective electron beam melting with improved beam focus and different scan line spacings. Rapid Prototyp. J. 2019, 25, 665–671. [Google Scholar] [CrossRef]
- Wang, X.; Chou, K. EBSD study of beam speed effects on Ti-6Al-4V alloy by powder bed electron beam additive manufacturing. J. Alloys Compd. 2018, 748, 236–244. [Google Scholar] [CrossRef]
- Ge, W.; Lin, F.; Guo, C. Effect of energy input on microstructure and mechanical properties in EBSM Ti6Al4V. Mater. Manuf. Process. 2018, 33, 1708–1713. [Google Scholar] [CrossRef]
- Ghani, J.A.; Choudhury, I.A.; Hassan, H.H. Application of Taguchi method in the optimization of end milling parameters. J. Mater. Process. Technol. 2004, 145, 84–92. [Google Scholar] [CrossRef]
- Cetin, M.H.; Ozcelik, B.; Kuram, E.; Demirbas, E. Evaluation of vegetable based cutting fluids with extreme pressure and cutting parameters in turning of AISI 304L by Taguchi method. J. Clean. Prod. 2011, 19, 2049–2056. [Google Scholar] [CrossRef]
- Oktem, H.; Erzurumlu, T.; Uzman, I. Application of Taguchi optimization technique in determining plastic injection molding process parameters for a thin-shell part. Mater. Des. 2007, 28, 1271–1278. [Google Scholar] [CrossRef]
- Sahu, S.; Choudhury, B.B. Optimization of Surface Roughness Using Taguchi Methodology & Prediction of Tool Wear in Hard Turning Tools. Mater. Today Proc. 2015, 2, 2615–2623. [Google Scholar] [CrossRef]
- Shafee, S.; Naik, B.B.; Sammaiah, K. Resistance Spot Weld Quality Characteristics Improvement By Taguchi Method. Mater. Today Proc. 2015, 2, 2595–2604. [Google Scholar] [CrossRef]
- Mia, M.; Dey, P.R.; Hossain, M.S.; Arafat, M.T.; Asaduzzaman, M.; Shoriat Ullah, M.; Tareq Zobaer, S.M. Taguchi S/N based optimization of machining parameters for surface roughness, tool wear and material removal rate in hard turning under MQL cutting condition. Meas. J. Int. Meas. Confed. 2018, 122, 380–391. [Google Scholar] [CrossRef]
- Chamoli, S. A Taguchi approach for optimization of flow and geometrical parameters in a rectangular channel roughened with V down perforated baffles. Case Stud. Therm. Eng. 2015, 5, 59–69. [Google Scholar] [CrossRef]
- ASTM F3001-14; ASTM International Standard Specification for Additive Manufacturing Titanium-6 Aluminum-4 Vanadium ELI (Extra Low Interstitial) with Powder Bed Fusion. ASTM International: West Conshohocken, PA, USA, 2012; Volume i, pp. 1–8. [CrossRef]
- Yeheskel, O.; Shokhat, M.; Salhov, S.; Tevet, O. Effect of initial particle and agglomerate Size on the elastic moduli of porous yttria Y2O3). J. Am. Ceram. Soc. 2009, 92, 1655–1662. [Google Scholar] [CrossRef]
- ASTM E8/E8M; ASTM International Standard Test Methods for Tension Testing of Metallic Materials. ASTM International: West Conshohocken, PA, USA, 2017; pp. 1–30. [CrossRef]
- ASTM E92; Standard Test Methods for Vickers Hardness and Knoop Hardness of Metallic Materials. ASTM International: West Conshohocken, PA, USA, 2017.
- Yeheskel, O.; Tevet, O. Elastic moduli of transparent yttria. J. Am. Ceram. Soc. 1999, 82, 136–144. [Google Scholar] [CrossRef]
- Sol, T.; Hayun, S.; Noiman, D.; Tiferet, E.; Yeheskel, O.; Tevet, O. Nondestructive ultrasonic evaluation of additively manufactured AlSi10Mg samples. Addit. Manuf. 2018, 22, 700–707. [Google Scholar] [CrossRef]
- Galati, M.; Minetola, P.; Rizza, G. Surface roughness characterisation and analysis of the Electron Beam Melting (EBM) process. Materials 2019, 12, 2211. [Google Scholar] [CrossRef]
- Sidambe, A.T. Three dimensional surface topography characterization of the electron beam melted Ti6Al4V. Met. Powder Rep. 2017, 72, 200–205. [Google Scholar] [CrossRef]
- Nicoletto, G.; Konečná, R.; Frkáň, M.; Riva, E. Surface roughness and directional fatigue behavior of as-built EBM and DMLS Ti6Al4V. Int. J. Fatigue 2018, 116, 140–148. [Google Scholar] [CrossRef]
- Astm F1108-04; ASTM International Standard Specification for Titanium-6Aluminum-4Vanadium Alloy Castings for Surgical Implants (UNS R56406). ASTM International: West Conshohocken, PA, USA, 2010; Volume 4, pp. 1–4. [CrossRef]
- ASTM F1472; ASTM International Standard Specification for Wrought Titanium-6Aluminum-4Vanadium Alloy for Surgical Implant Applications (UNS R56400). ASTM International: West Conshohocken, PA, USA, 2015; Volume 1, pp. 1–5. [CrossRef]
- ASTM F2924; ASTM International Specification for Additive Manufacturing Titanium-6 Aluminum-4 Vanadium with Powder Bed Fusion. ASTM International: West Conshohocken, PA, USA, 2014; Volume 1, pp. 1–9. [CrossRef]
- Razavi, S.M.J.; Van Hooreweder, B.; Berto, F. Effect of build thickness and geometry on quasi-static and fatigue behavior of Ti-6Al-4V produced by Electron Beam Melting. Addit. Manuf. 2020, 36, 101426. [Google Scholar] [CrossRef]
- Koike, M.; Martinez, K.; Guo, L.; Chahine, G.; Kovacevic, R.; Okabe, T. Evaluation of titanium alloy fabricated using electron beam melting system for dental applications. J. Mater. Process. Technol. 2011, 211, 1400–1408. [Google Scholar] [CrossRef]
- Hrabe, N.; Quinn, T. Effects of processing on microstructure and mechanical properties of a titanium alloy (Ti-6Al-4V) fabricated using electron beam melting (EBM), Part 2: Energy input, orientation, and location. Mater. Sci. Eng. A 2013, 573, 271–277. [Google Scholar] [CrossRef]
- Roy, R.K. A Primer on the Taguchi Method; Society of Manufacturing Engineers: Dearborn, MI, USA, 2010; ISBN 9780872638648. [Google Scholar]
- Krishnaiah, K.; Shahabudeen, P. Applied Design of Experiments and Taghuchi Methods; PHI Learning Pvt. Ltd.: Delhi, India, 2012; ISBN 9788120345270. [Google Scholar]
- Scipioni Bertoli, U.; Wolfer, A.J.; Matthews, M.J.; Delplanque, J.P.R.; Schoenung, J.M. On the limitations of Volumetric Energy Density as a design parameter for Selective Laser Melting. Mater. Des. 2017, 113, 331–340. [Google Scholar] [CrossRef]
- Prashanth, K.G.; Scudino, S.; Maity, T.; Das, J.; Eckert, J. Is the energy density a reliable parameter for materials synthesis by selective laser melting? Mater. Res. Lett. 2017, 5, 386–390. [Google Scholar] [CrossRef]
- Shipley, H.; McDonnell, D.; Culleton, M.; Coull, R.; Lupoi, R.; O’Donnell, G.; Trimble, D. Optimisation of process parameters to address fundamental challenges during selective laser melting of Ti-6Al-4V: A review. Int. J. Mach. Tools Manuf. 2018, 128, 1–20. [Google Scholar] [CrossRef]
- Galati, M.; Snis, A.; Iuliano, L. Powder bed properties modelling and 3D thermo-mechanical simulation of the additive manufacturing Electron Beam Melting process. Addit. Manuf. 2019, 30, 100897. [Google Scholar] [CrossRef]


| Levels | 1 | 2 | 3 | |
|---|---|---|---|---|
| Parameters | ||||
| Beam current (I) (mA) | 25 | 28 | 30 | |
| Focus offset (FO) (mA) | 15 | 45 | 75 | |
| Line offset (LO) (mm) | 0.15 | 0.22 | 0.3 | |
| Speed function index (SF) | 20 | 32 | 45 | |
| Experiment # | I (mA) | FO (mA) | LO (mm) | SF (AU) |
|---|---|---|---|---|
| 1 | 25 | 15 | 0.15 | 20 |
| 2 | 25 | 45 | 0.22 | 32 |
| 3 | 25 | 75 | 0.3 | 45 |
| 4 | 28 | 15 | 0.22 | 45 |
| 5 | 28 | 45 | 0.3 | 20 |
| 6 | 28 | 75 | 0.15 | 32 |
| 7 | 30 | 15 | 0.3 | 32 |
| 8 | 30 | 45 | 0.15 | 45 |
| 9 | 30 | 75 | 0.22 | 20 |
| Sample Set # | Bulk Modulus, K (GPa) | Young’s Modulus, E (GPa) | Shear Modulus, G (GPa) | Poisson’s Ratio, ν |
|---|---|---|---|---|
| 1 | 109.38 ± 0.61 | 120.07 ± 0.46 | 45.58 ± 0.23 | 0.3172 ± 0.0016 |
| 2 | 110.99 ± 0.65 | 120.37 ± 0.4 | 45.62 ± 0.2 | 0.3192 ± 0.0013 |
| 3 | 60.47 ± 5.27 | 62.69 ± 2.49 | 23.64 ± 1.06 | 0.3264 ± 0.015 |
| 4 | 108.68 ± 0.41 | 120.61 ± 0.16 | 45.86 ± 0.07 | 0.315 ± 0.0007 |
| 5 | 111.33 ± 0.61 | 118.36 ± 0.23 | 44.74 ± 0.1 | 0.3226 ± 0.0013 |
| 6 | 113.58 ± 7.52 | 106.76 ± 8.16 | 39.81 ± 3.63 | 0.3422 ± 0.0214 |
| 7 | 108.32 ± 0.4 | 121.02 ± 0.21 | 46.06 ± 0.07 | 0.3138 ± 0.0004 |
| 8 | 110.53 ± 0.3 | 121.07 ± 0.31 | 45.95 ± 0.14 | 0.3172 ± 0.0008 |
| 9 | 113.08 ± 1.16 | 118.83 ± 1.61 | 44.85 ± 0.72 | 0.325 ± 0.0037 |
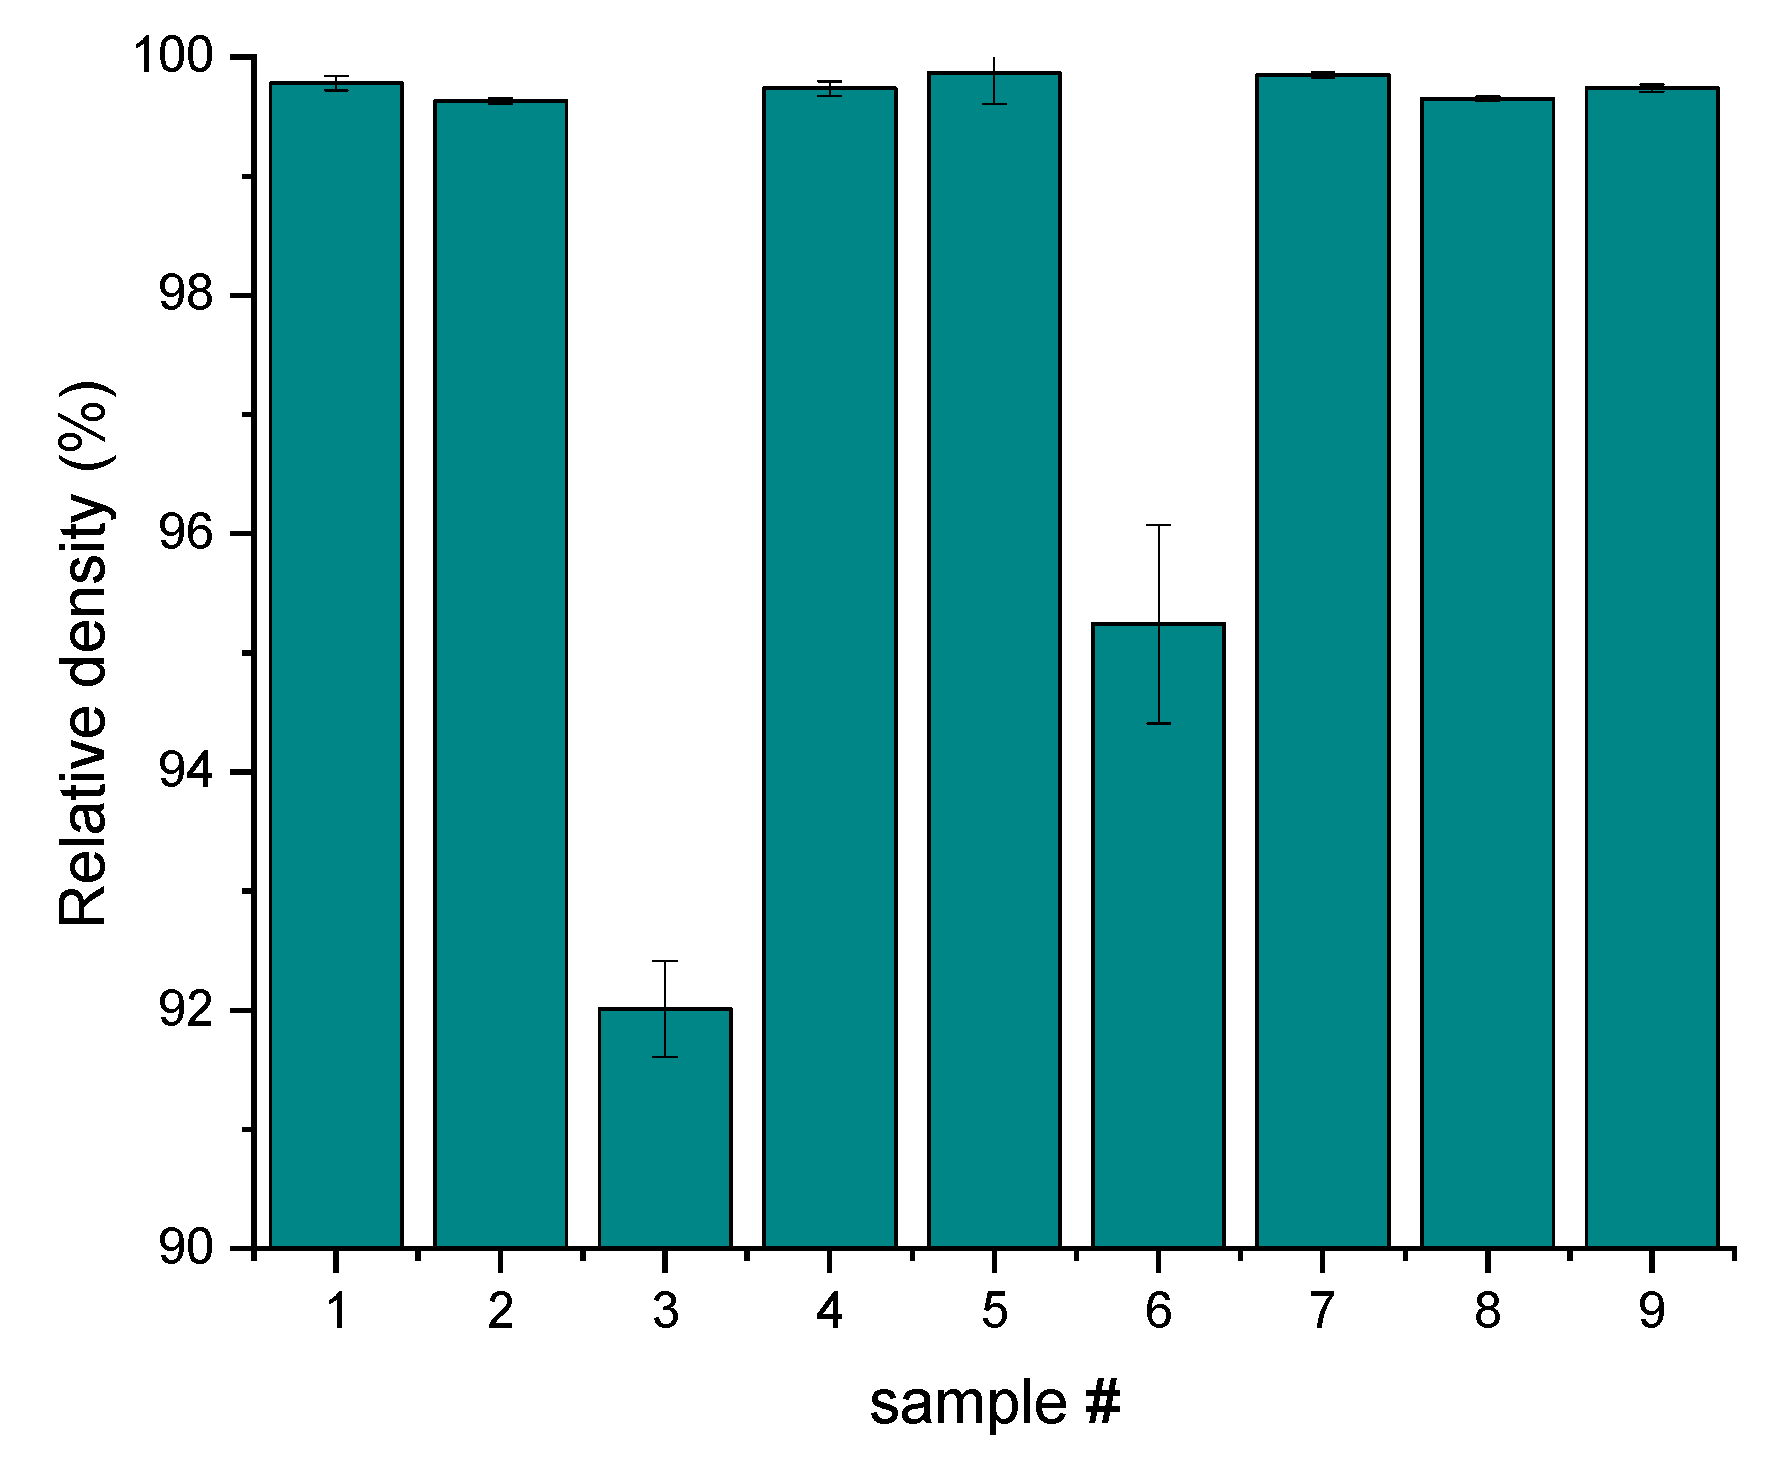
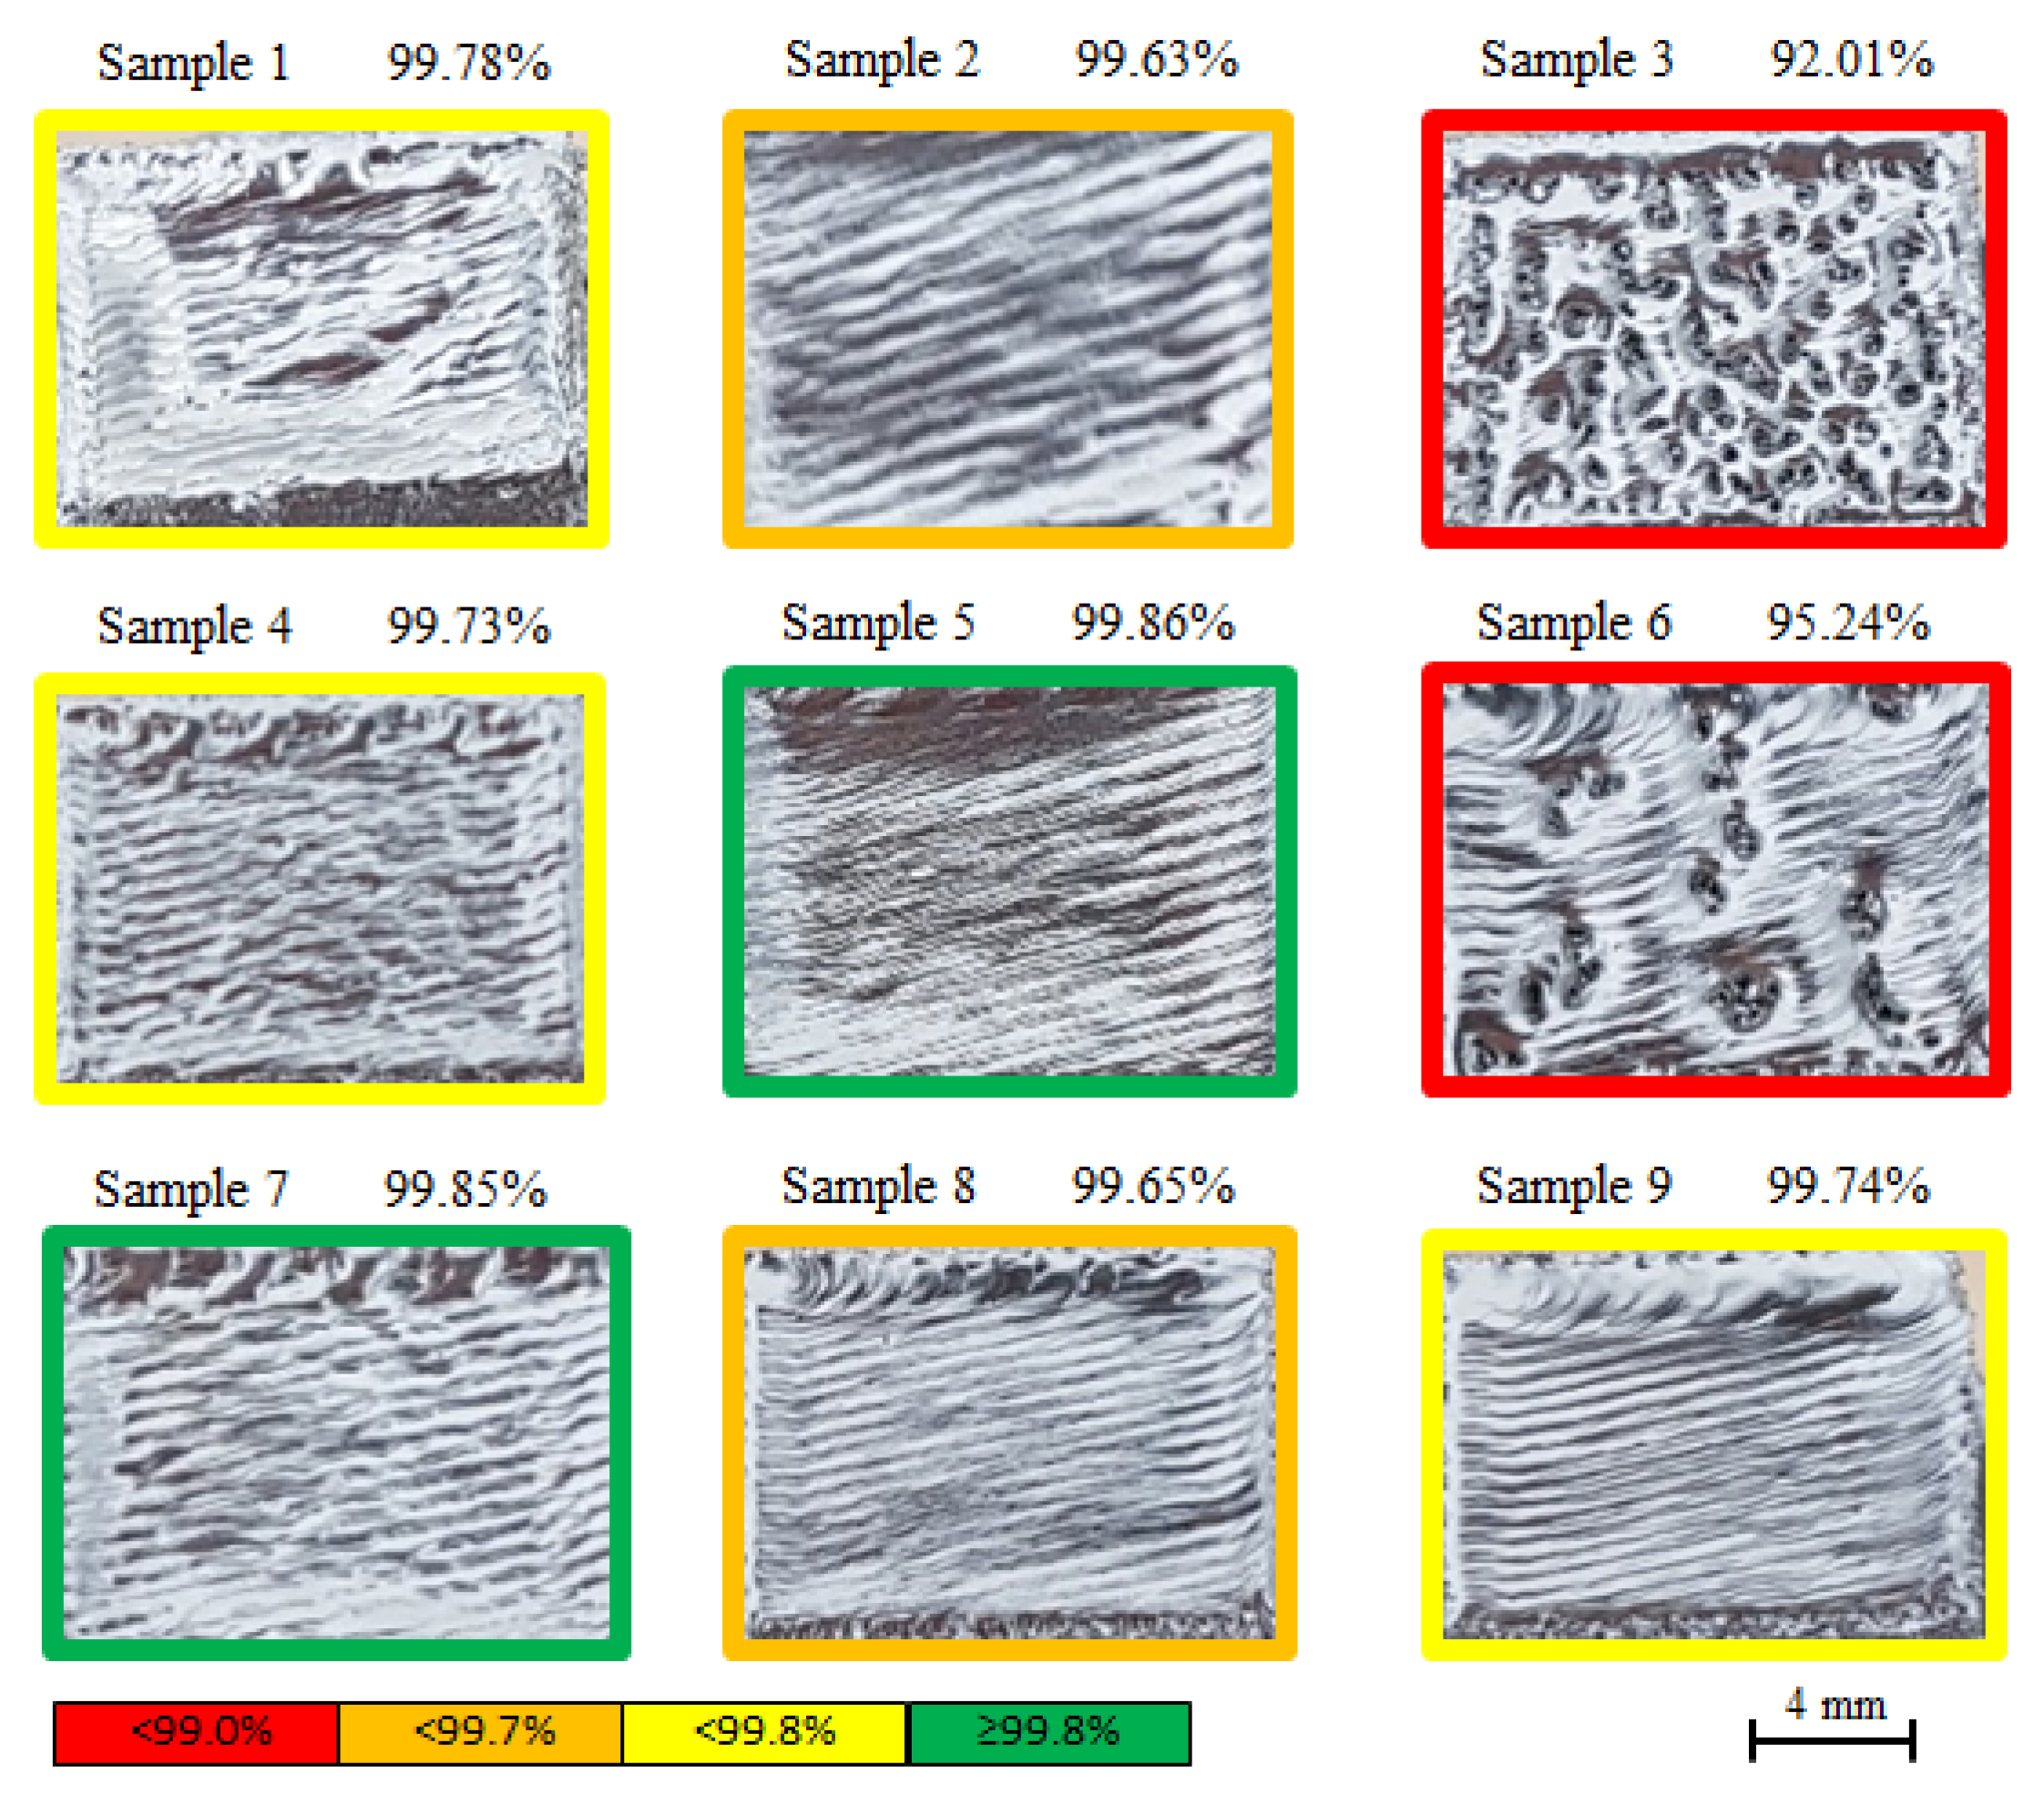
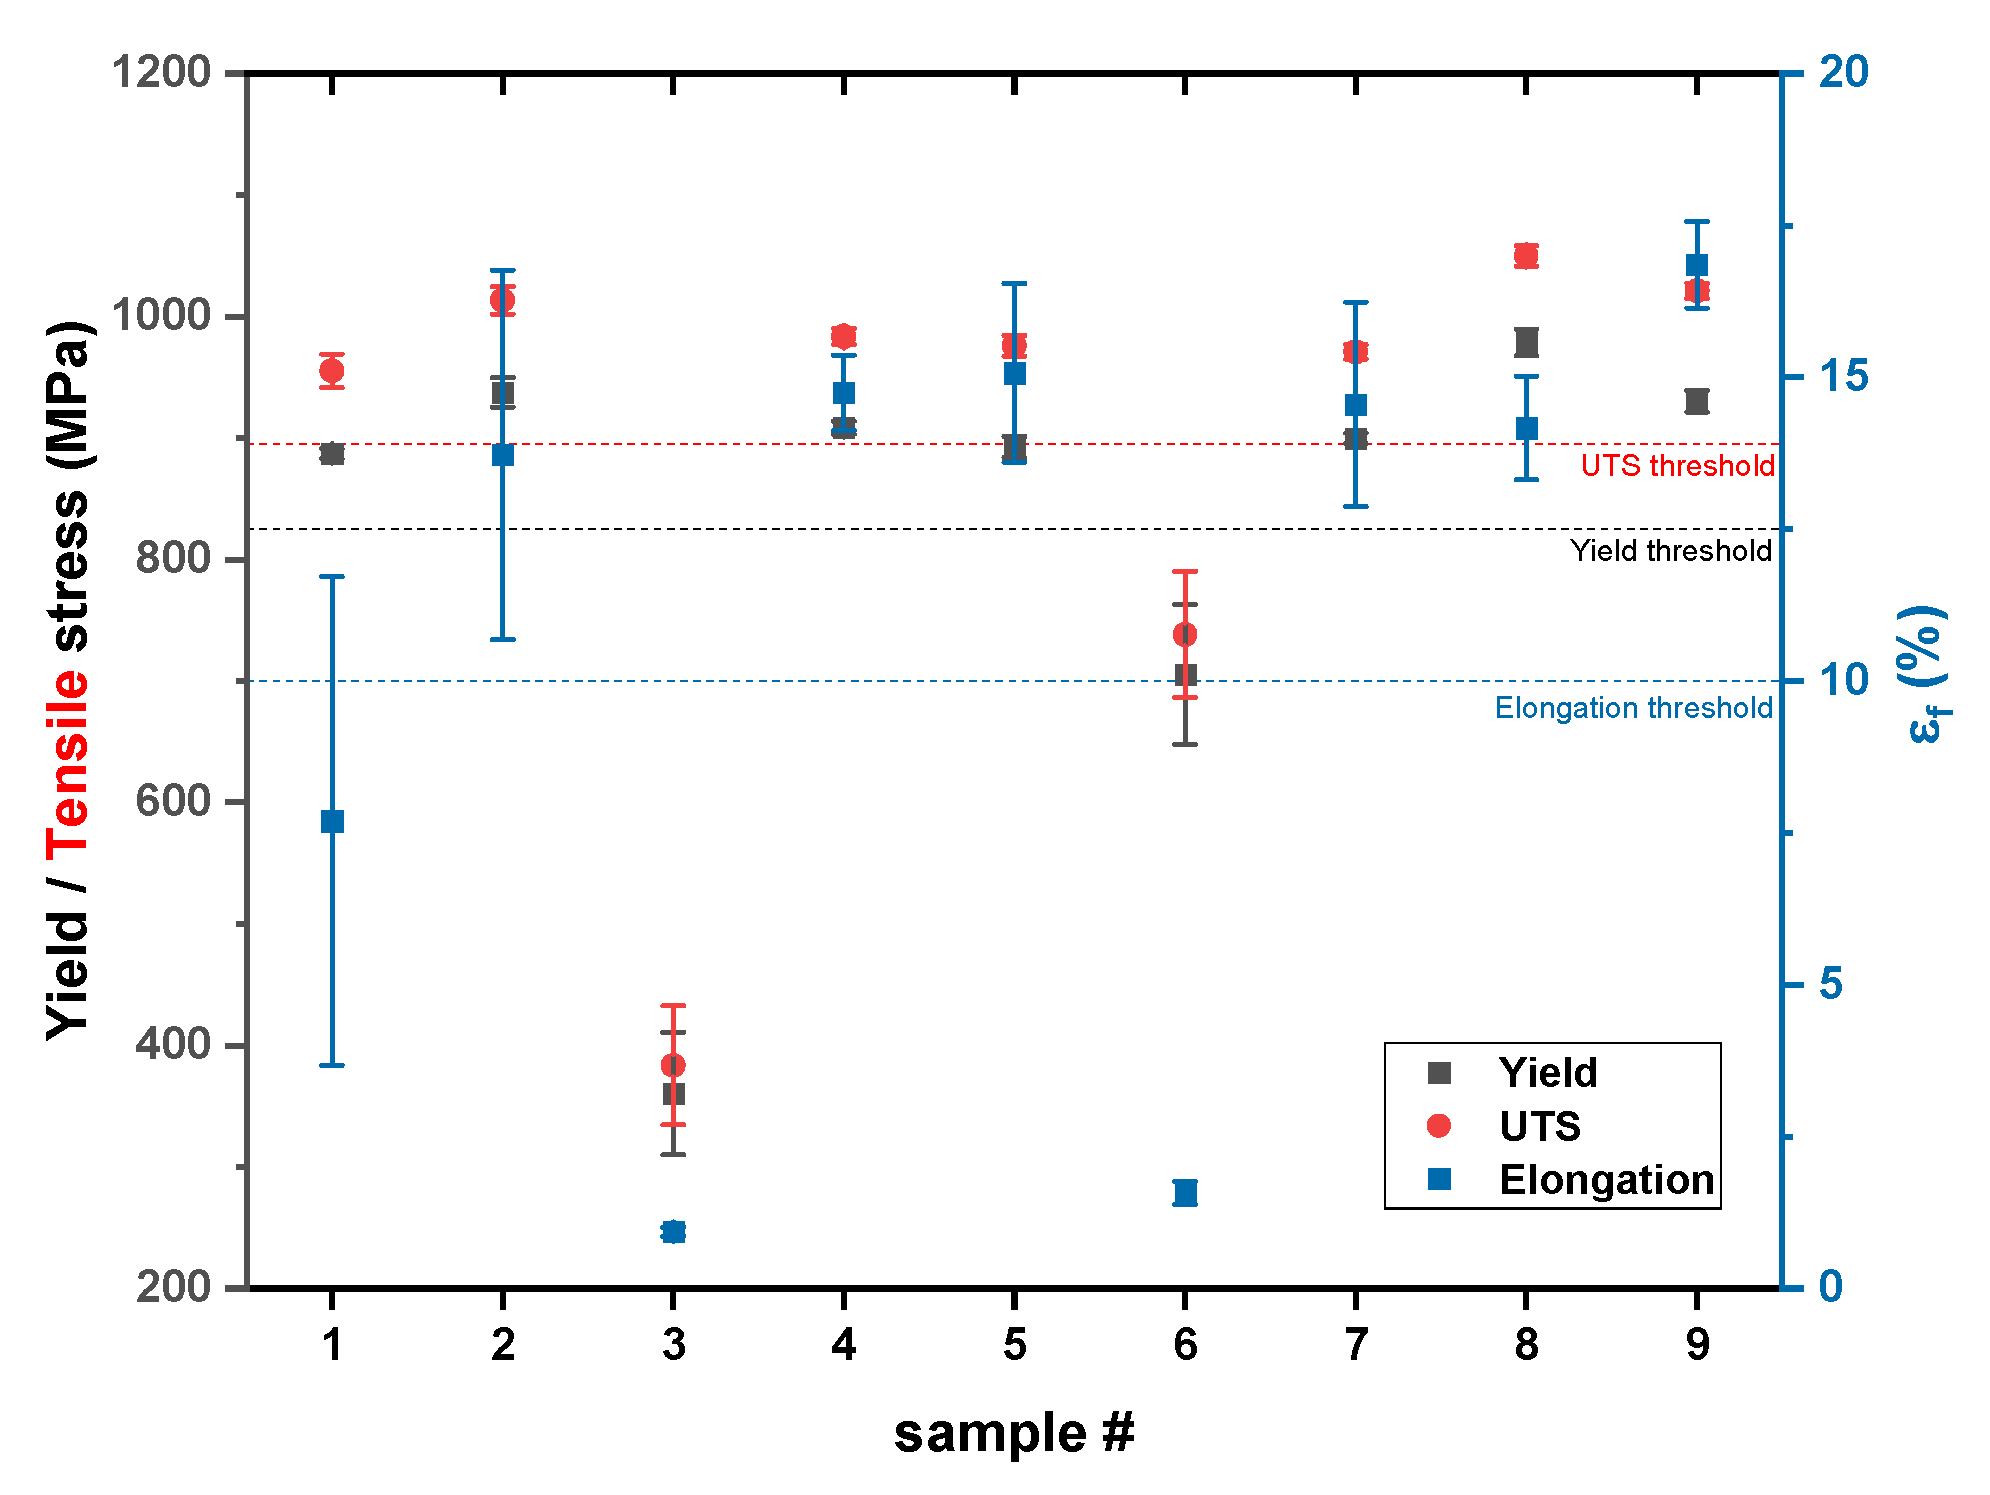
| Sample Set # | Density (g/cm3) | Relative Density (%) | σy (MPa) | σmax (MPa) | ef (%) | Hardness (HV0.5) |
|---|---|---|---|---|---|---|
| 1 | 4.4202 ± 0.0026 | 99.78 ± 0.06 | 887.3 ± 4.1 | 955.3 ± 13.7 | 7.7 ± 4.0 | 385.1 ± 14.9 |
| 2 | 4.4136 ± 0.0011 | 99.63 ± 0.02 | 937.7 ± 12.2 | 1013.3 ± 11.5 | 13.7 ± 3.0 | 383.9 ± 17.5 |
| 3 | 4.0761 ± 0.0179 | 92.01 ± 0.40 | 360.4 ± 50.4 | 383.6 ± 49.1 | 0.9 ± 0.1 | 381.7 ± 18.8 |
| 4 | 4.4182 ± 0.0027 | 99.73 ± 0.06 | 908.7 ± 5.5 | 983.4 ± 6.6 | 14.7 ± 0.6 | 380.7 ± 14.1 |
| 5 | 4.4240 ± 0.0115 | 99.86 ± 0.26 | 892.7 ± 8.7 | 976.0 ± 8.5 | 15.1 ± 1.5 | 371.67 ± 13.2 |
| 6 | 4.2192 ± 0.0368 | 95.24 ± 0.83 | 705.5 ± 57.5 | 738.4 ± 51.9 | 1.6 ± 0.2 | 394.6 ± 15.9 |
| 7 | 4.4234 ± 0.0011 | 99.85 ± 0.02 | 899.6 ± 4.5 | 970.9 ± 5.7 | 14.6 ± 1.7 | 383.9 ± 14.0 |
| 8 | 4.4144 ± 0.0009 | 99.65 ± 0.02 | 978.6 ± 11.1 | 1050.1 ± 8.4 | 14.2 ± 0.9 | 379.1 ± 10.9 |
| 9 | 4.4184 ± 0.0014 | 99.74 ± 0.03 | 930.4 ± 9.0 | 1021.3 ± 6.4 | 16.9 ± 0.7 | 371.5 ± 10.6 |
| Sample Set | 2 | 4 | 5 | 7 | 8 | 9 |
|---|---|---|---|---|---|---|
| Ra (µm) | 2.14 ± 1.04 | 3.49 ± 0.80 | 2.09 ± 0.52 | 3.31 ± 1.04 | 2.02 ± 0.61 | 1.62 ± 0.26 |
| Rz (µm) | 12.78 ± 4.83 | 19.65 ± 3.10 | 13.50 ± 4.55 | 22.39 ± 6.00 | 14.03 ± 4.68 | 11.13 ± 1.38 |
| Criteria | Characteristic | Units | Rel. Weighting | Normalization Value | Quality Characteristic |
|---|---|---|---|---|---|
| Relative density | % | 20% | 1 | Higher-the-better | |
| Young modulus | GPa | 15% | 125 | Higher-the-better | |
| YS | σy | MPa | 20% | 1330 | Higher-the-better |
| UTS | σmax | MPa | 45% | 1450 | Higher-the-better |
| Sample Set # | A (%) | B (%) | C (%) | D (%) | E (%) | S/N (dB) |
|---|---|---|---|---|---|---|
| 1 | 77.0 | 76.8 | 77.4 | 77.7 | 77.9 | 37.8 |
| 2 | 80.1 | 79.9 | 80.6 | 79.8 | 79.2 | 38.1 |
| 3 | 43.8 | 44.0 | 39.8 | 43.7 | 45.1 | 32.7 |
| 4 | 78.8 | 79.0 | 78.3 | 78.5 | 78.4 | 37.9 |
| 5 | 78.2 | 77.4 | 78.1 | 78.2 | 77.5 | 37.8 |
| 6 | 65.2 | 68.1 | 61.0 | 63.8 | 68.8 | 36.3 |
| 7 | 78.4 | 78.3 | 77.8 | 78.2 | 78.1 | 37.9 |
| 8 | 82.3 | 81.5 | 82.0 | 82.0 | 81.2 | 38.3 |
| 9 | 80.2 | 79.6 | 80.0 | 80.4 | 79.4 | 38.1 |
| Factor | Degrees of Freedom | Sum of Squares | p-Value | Contribution (%) |
|---|---|---|---|---|
| Current | 2 | 1289.38 | <0.001 | 21.04 |
| Focus offset | 2 | 2618.17 | <0.001 | 42.73 |
| Line offset | 2 | 1311.02 | <0.001 | 21.40 |
| Speed function index | 2 | 846.48 | <0.001 | 13.82 |
| Error | 36 | 62.15 | 1.01 | |
| Total | 44 | 6127.20 | 100 |
| E (GPa) | σy (MPa) | σmax (MPa) | Density (g/cm3) | OEC Grade (%) |
|---|---|---|---|---|
| 119.2 | 923.7 | 998.2 | 4.41 | 79.1 |
Publisher’s Note: MDPI stays neutral with regard to jurisdictional claims in published maps and institutional affiliations. |
© 2022 by the authors. Licensee MDPI, Basel, Switzerland. This article is an open access article distributed under the terms and conditions of the Creative Commons Attribution (CC BY) license (https://creativecommons.org/licenses/by/4.0/).
Share and Cite
Braun, D.; Ganor, Y.I.; Samuha, S.; Guttmann, G.M.; Chonin, M.; Frage, N.; Hayun, S.; Tiferet, E. A Design of Experiment Approach for Development of Electron Beam Powder Bed Fusion Process Parameters and Improvement of Ti-6Al-4V As-Built Properties. J. Manuf. Mater. Process. 2022, 6, 90. https://doi.org/10.3390/jmmp6040090
Braun D, Ganor YI, Samuha S, Guttmann GM, Chonin M, Frage N, Hayun S, Tiferet E. A Design of Experiment Approach for Development of Electron Beam Powder Bed Fusion Process Parameters and Improvement of Ti-6Al-4V As-Built Properties. Journal of Manufacturing and Materials Processing. 2022; 6(4):90. https://doi.org/10.3390/jmmp6040090
Chicago/Turabian StyleBraun, Dor, Yaron Itay Ganor, Shmuel Samuha, Gilad Mordechai Guttmann, Michael Chonin, Nachum Frage, Shmuel Hayun, and Eitan Tiferet. 2022. "A Design of Experiment Approach for Development of Electron Beam Powder Bed Fusion Process Parameters and Improvement of Ti-6Al-4V As-Built Properties" Journal of Manufacturing and Materials Processing 6, no. 4: 90. https://doi.org/10.3390/jmmp6040090
APA StyleBraun, D., Ganor, Y. I., Samuha, S., Guttmann, G. M., Chonin, M., Frage, N., Hayun, S., & Tiferet, E. (2022). A Design of Experiment Approach for Development of Electron Beam Powder Bed Fusion Process Parameters and Improvement of Ti-6Al-4V As-Built Properties. Journal of Manufacturing and Materials Processing, 6(4), 90. https://doi.org/10.3390/jmmp6040090