
Development and Mechano-Chemical Characterization of Polymer Composite Sheets Filled with Silica Microparticles with Potential in Printing Industry


Abstract
:
1. Introduction
2. Materials and Methods
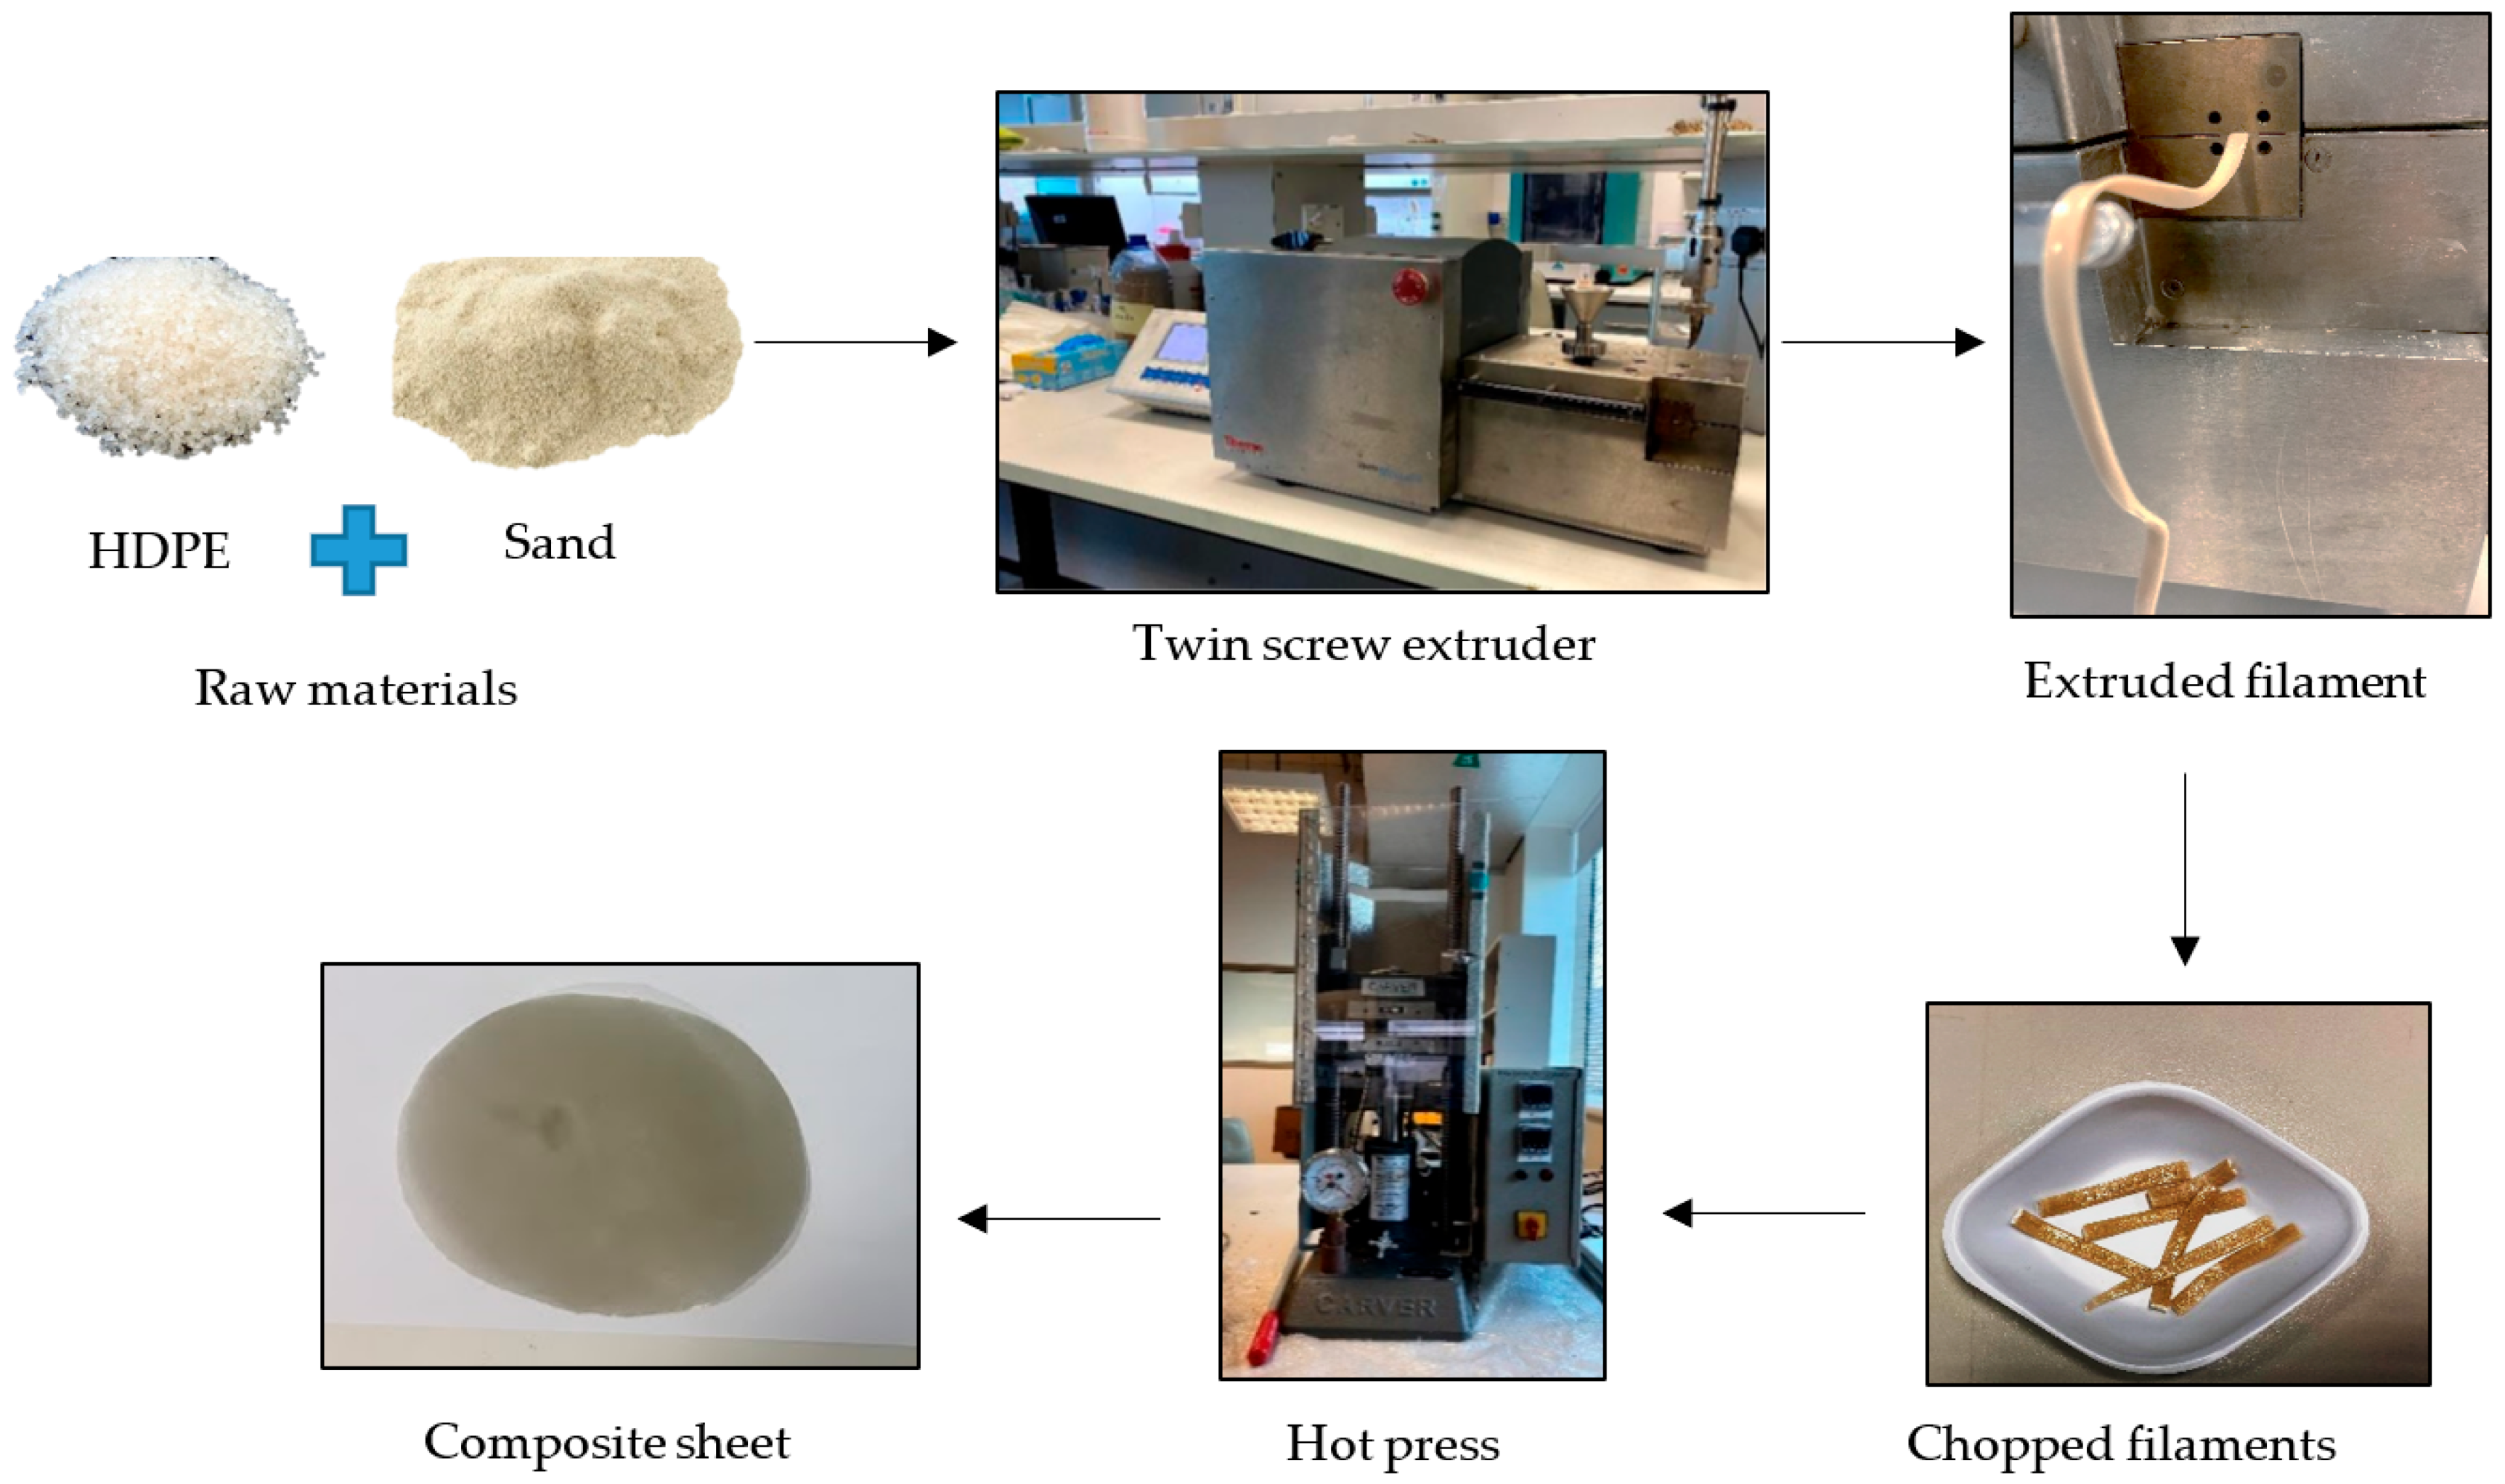
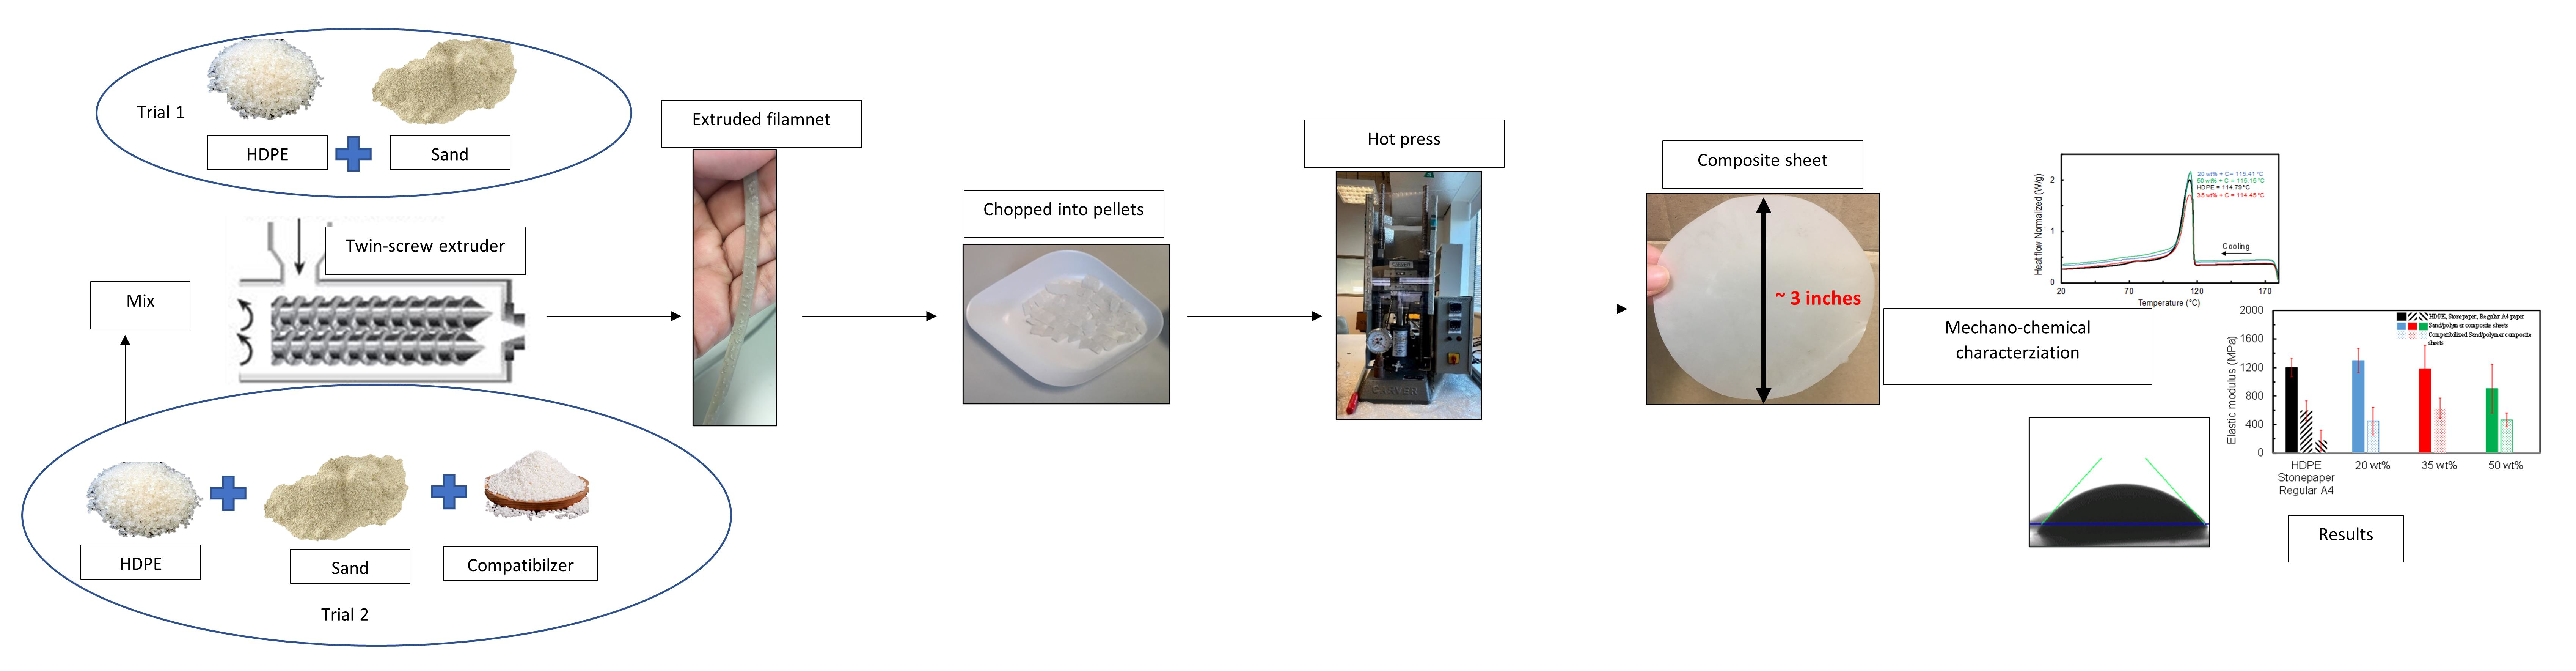
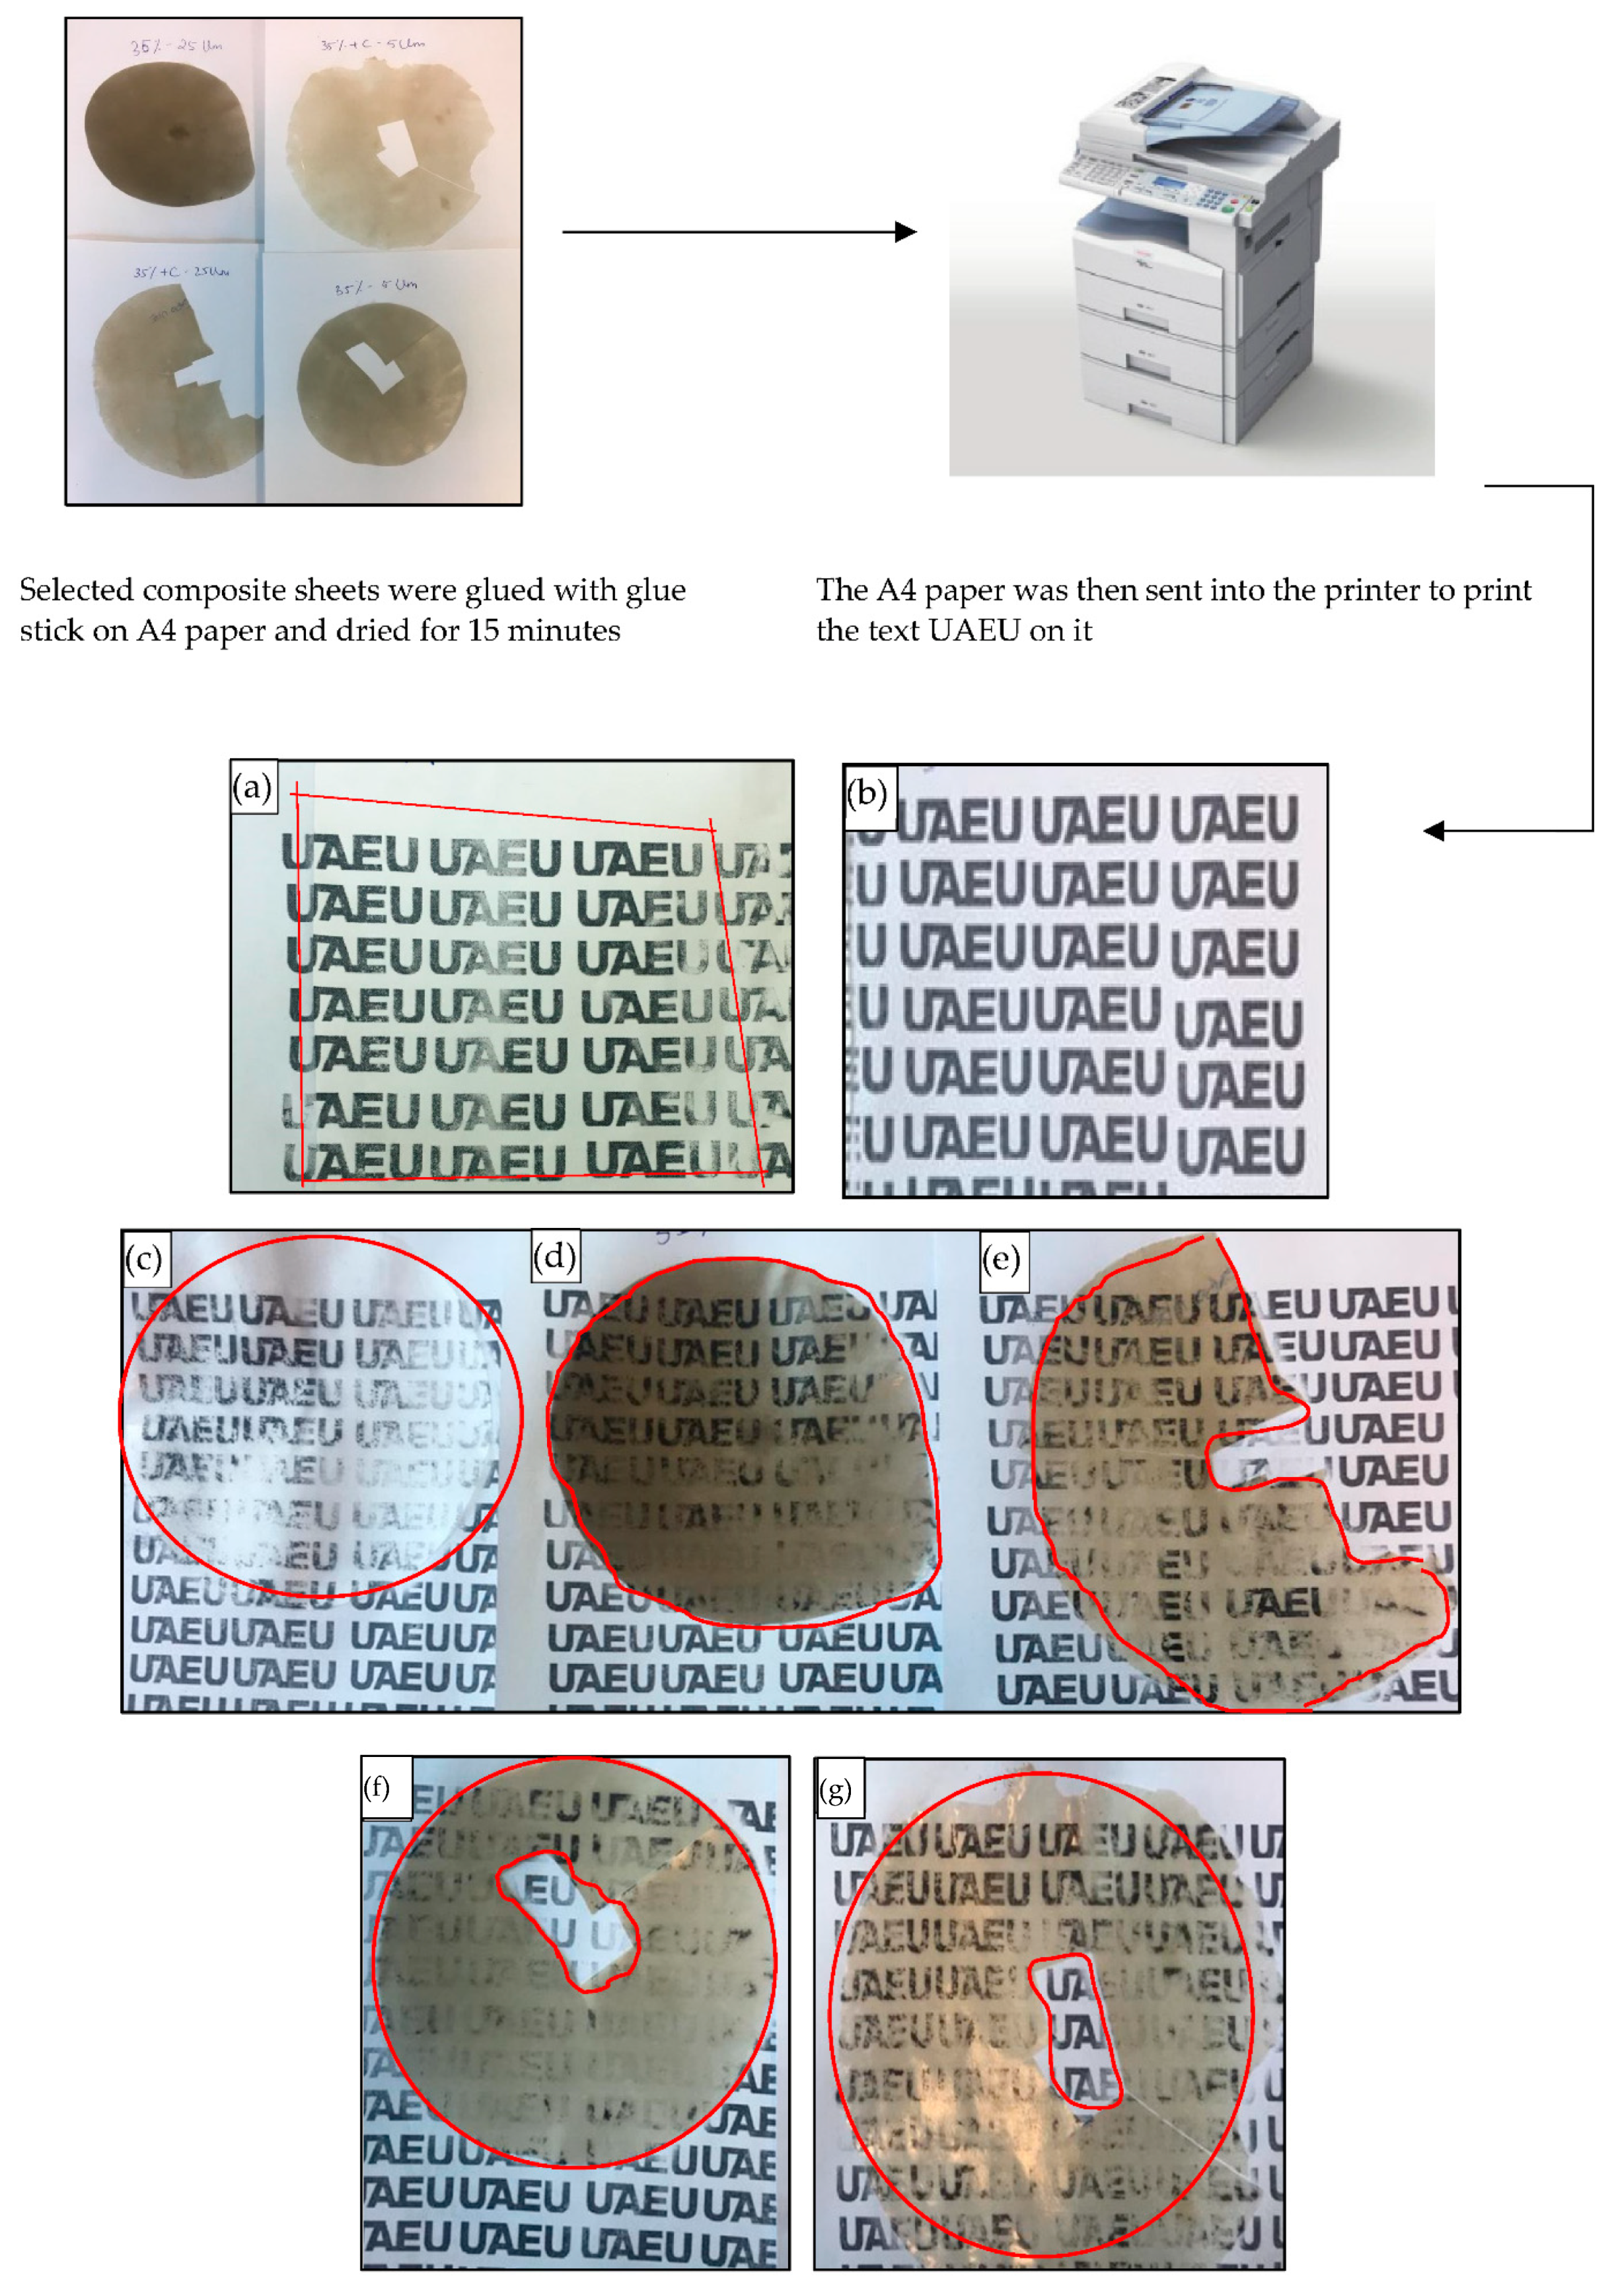
2.1. Experimental Procedure
2.2. Synthesis of Sand/Polymer Composite Material via Melt-Blending
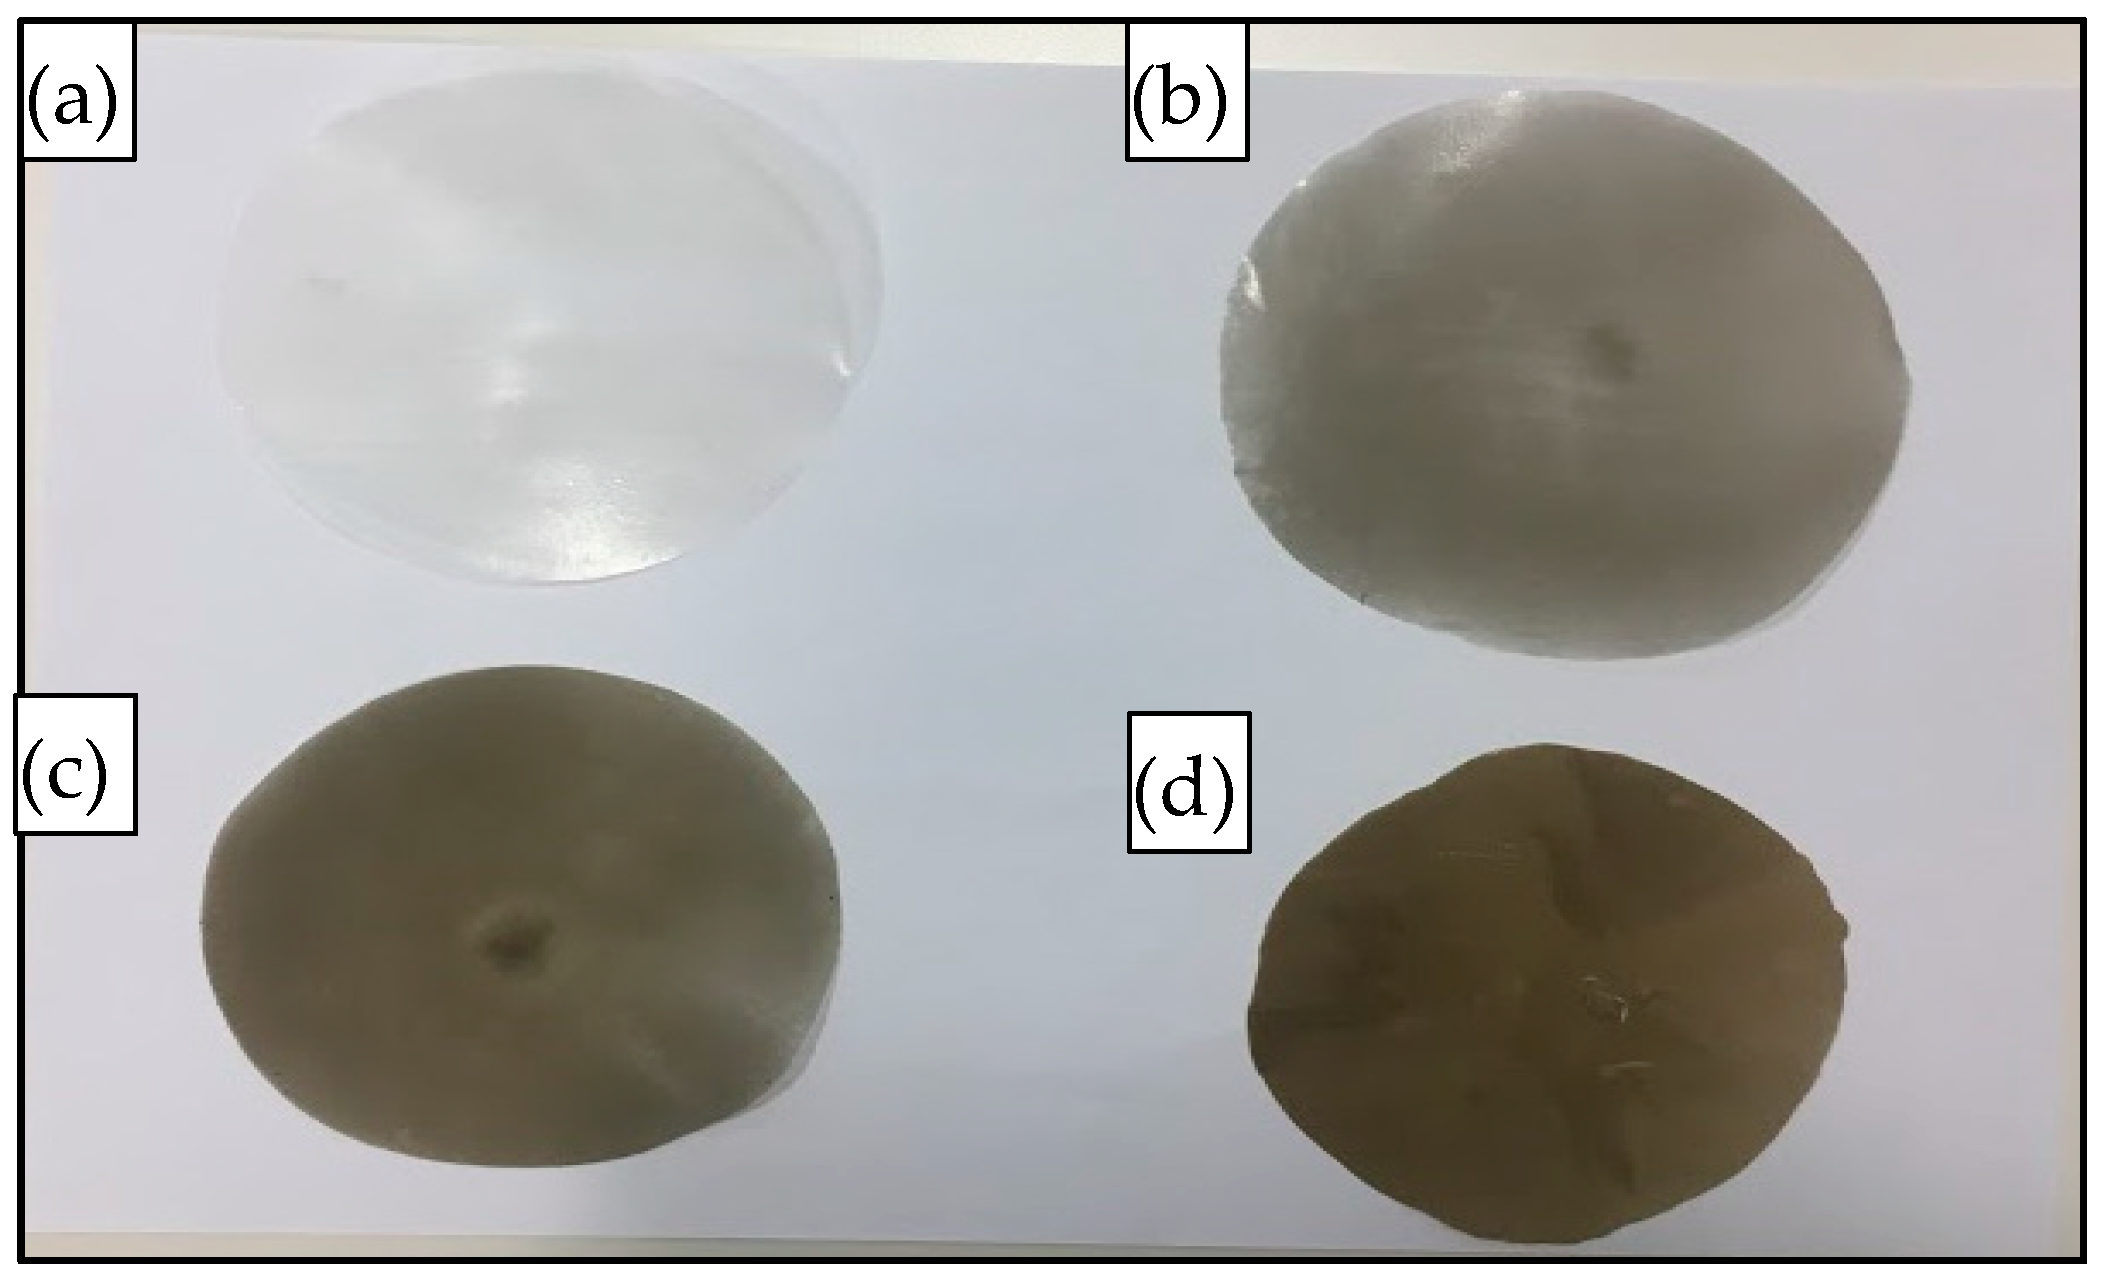
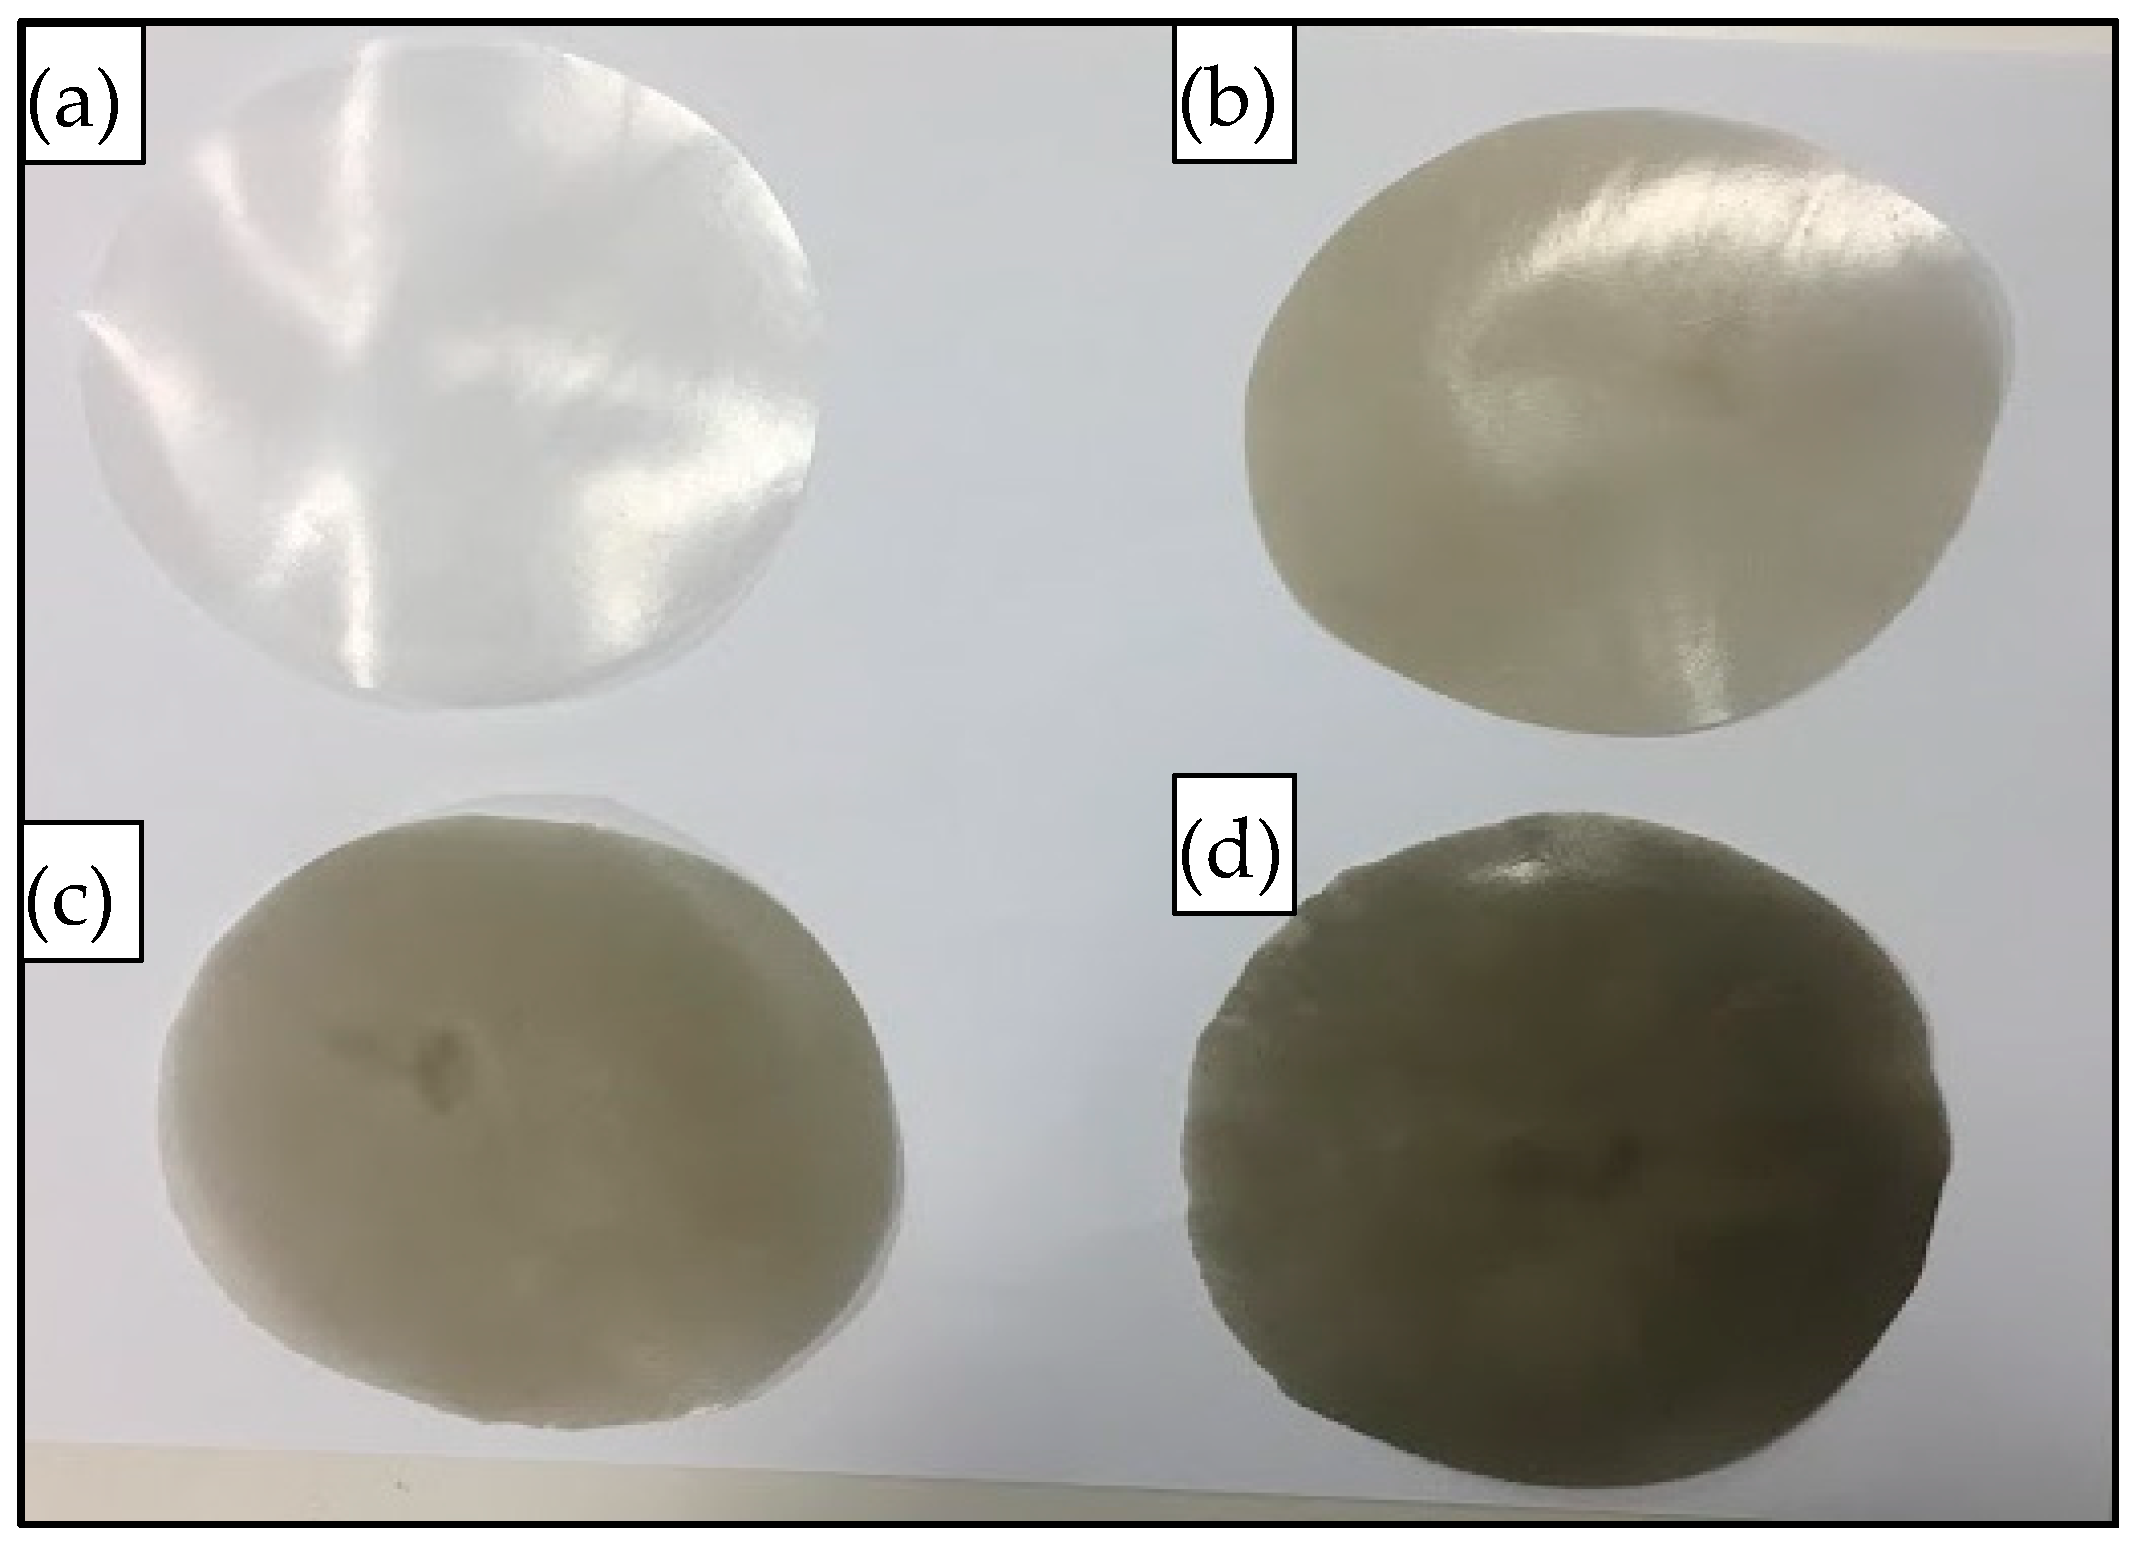
Synthesis of Sand/Polymer Composite Sheets via Compression Molding
2.3. Characterization
2.3.1. Scanning Electron Microscope (SEM)
2.3.2. X-ray Diffraction (XRD)
2.3.3. Differential Calorimetry Analysis (DSC)
2.3.4. Thermogravimetric Analysis (TGA)
2.3.5. Tensile Test
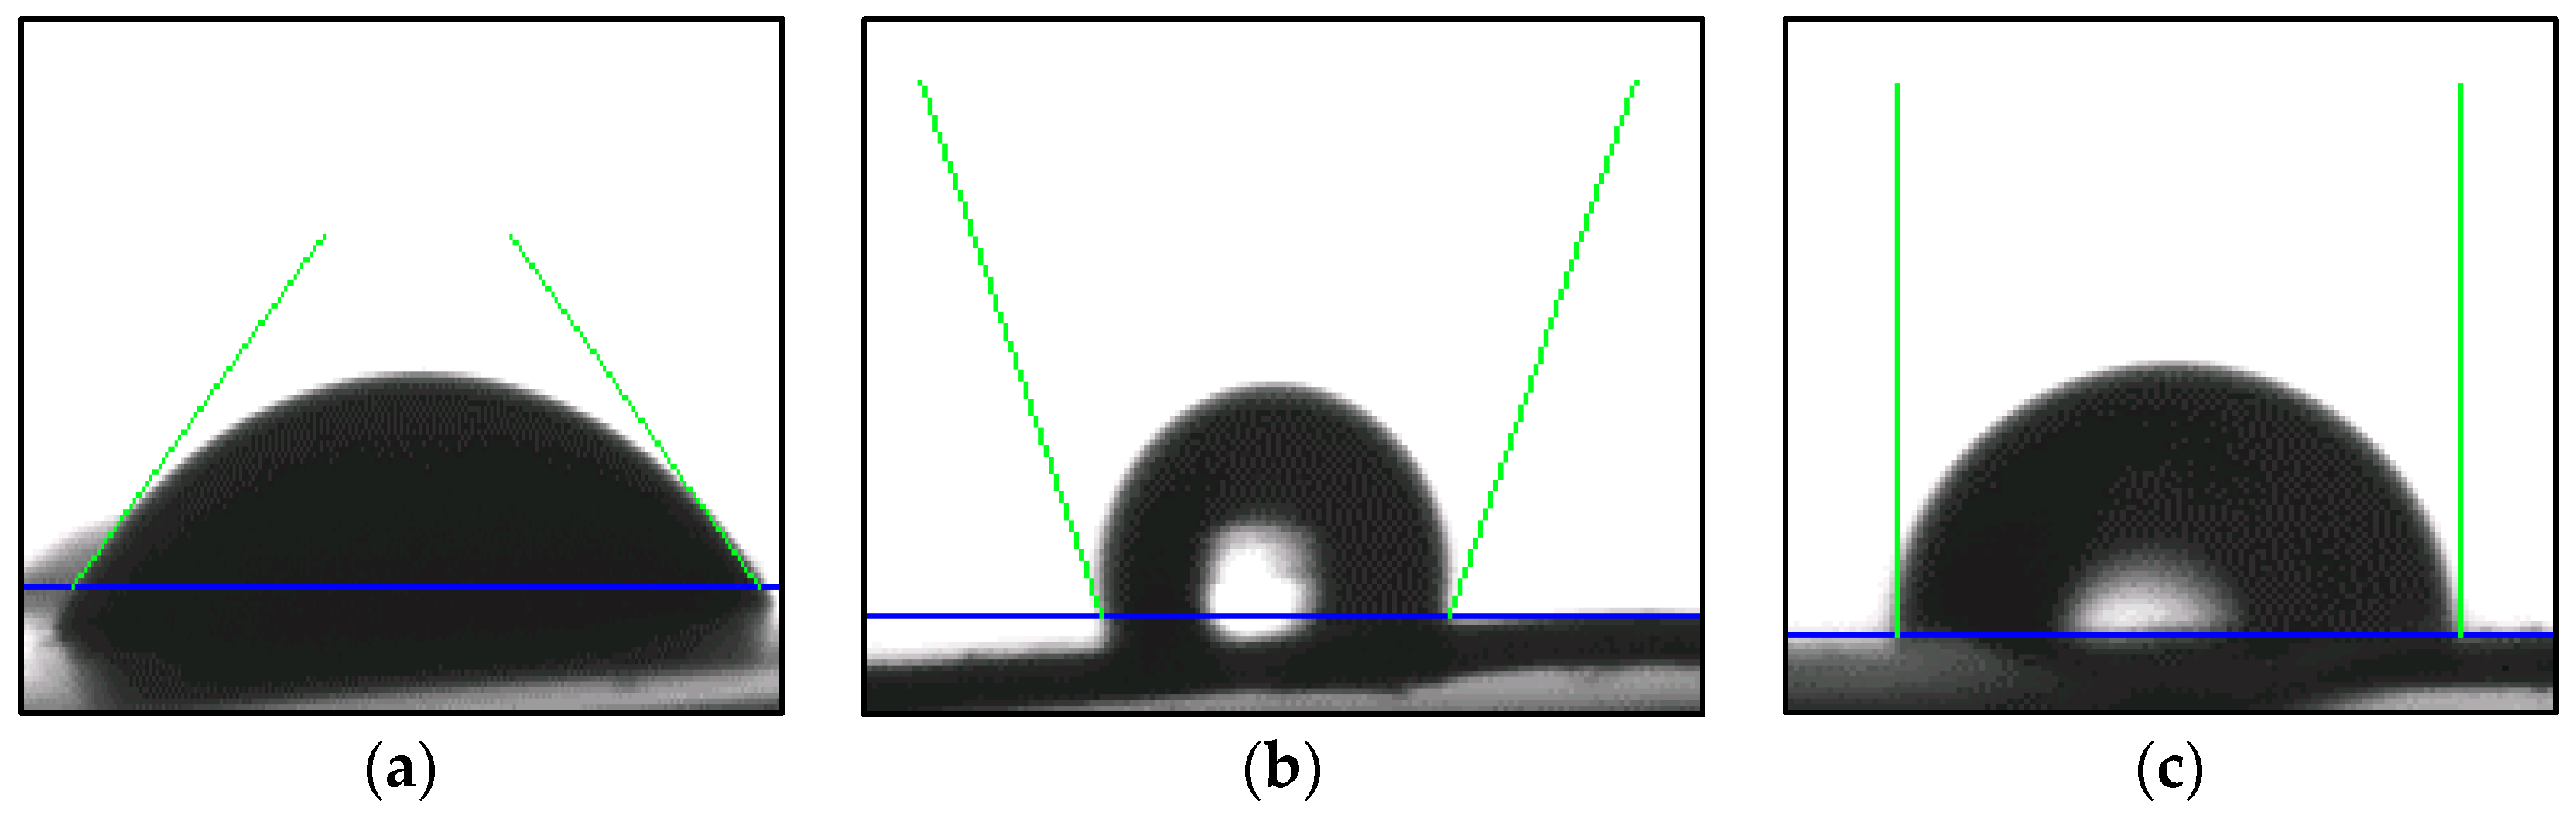
2.3.6. Wettability
2.3.7. Printing Test
2.3.8. Adherence Test
3. Results and Discussion
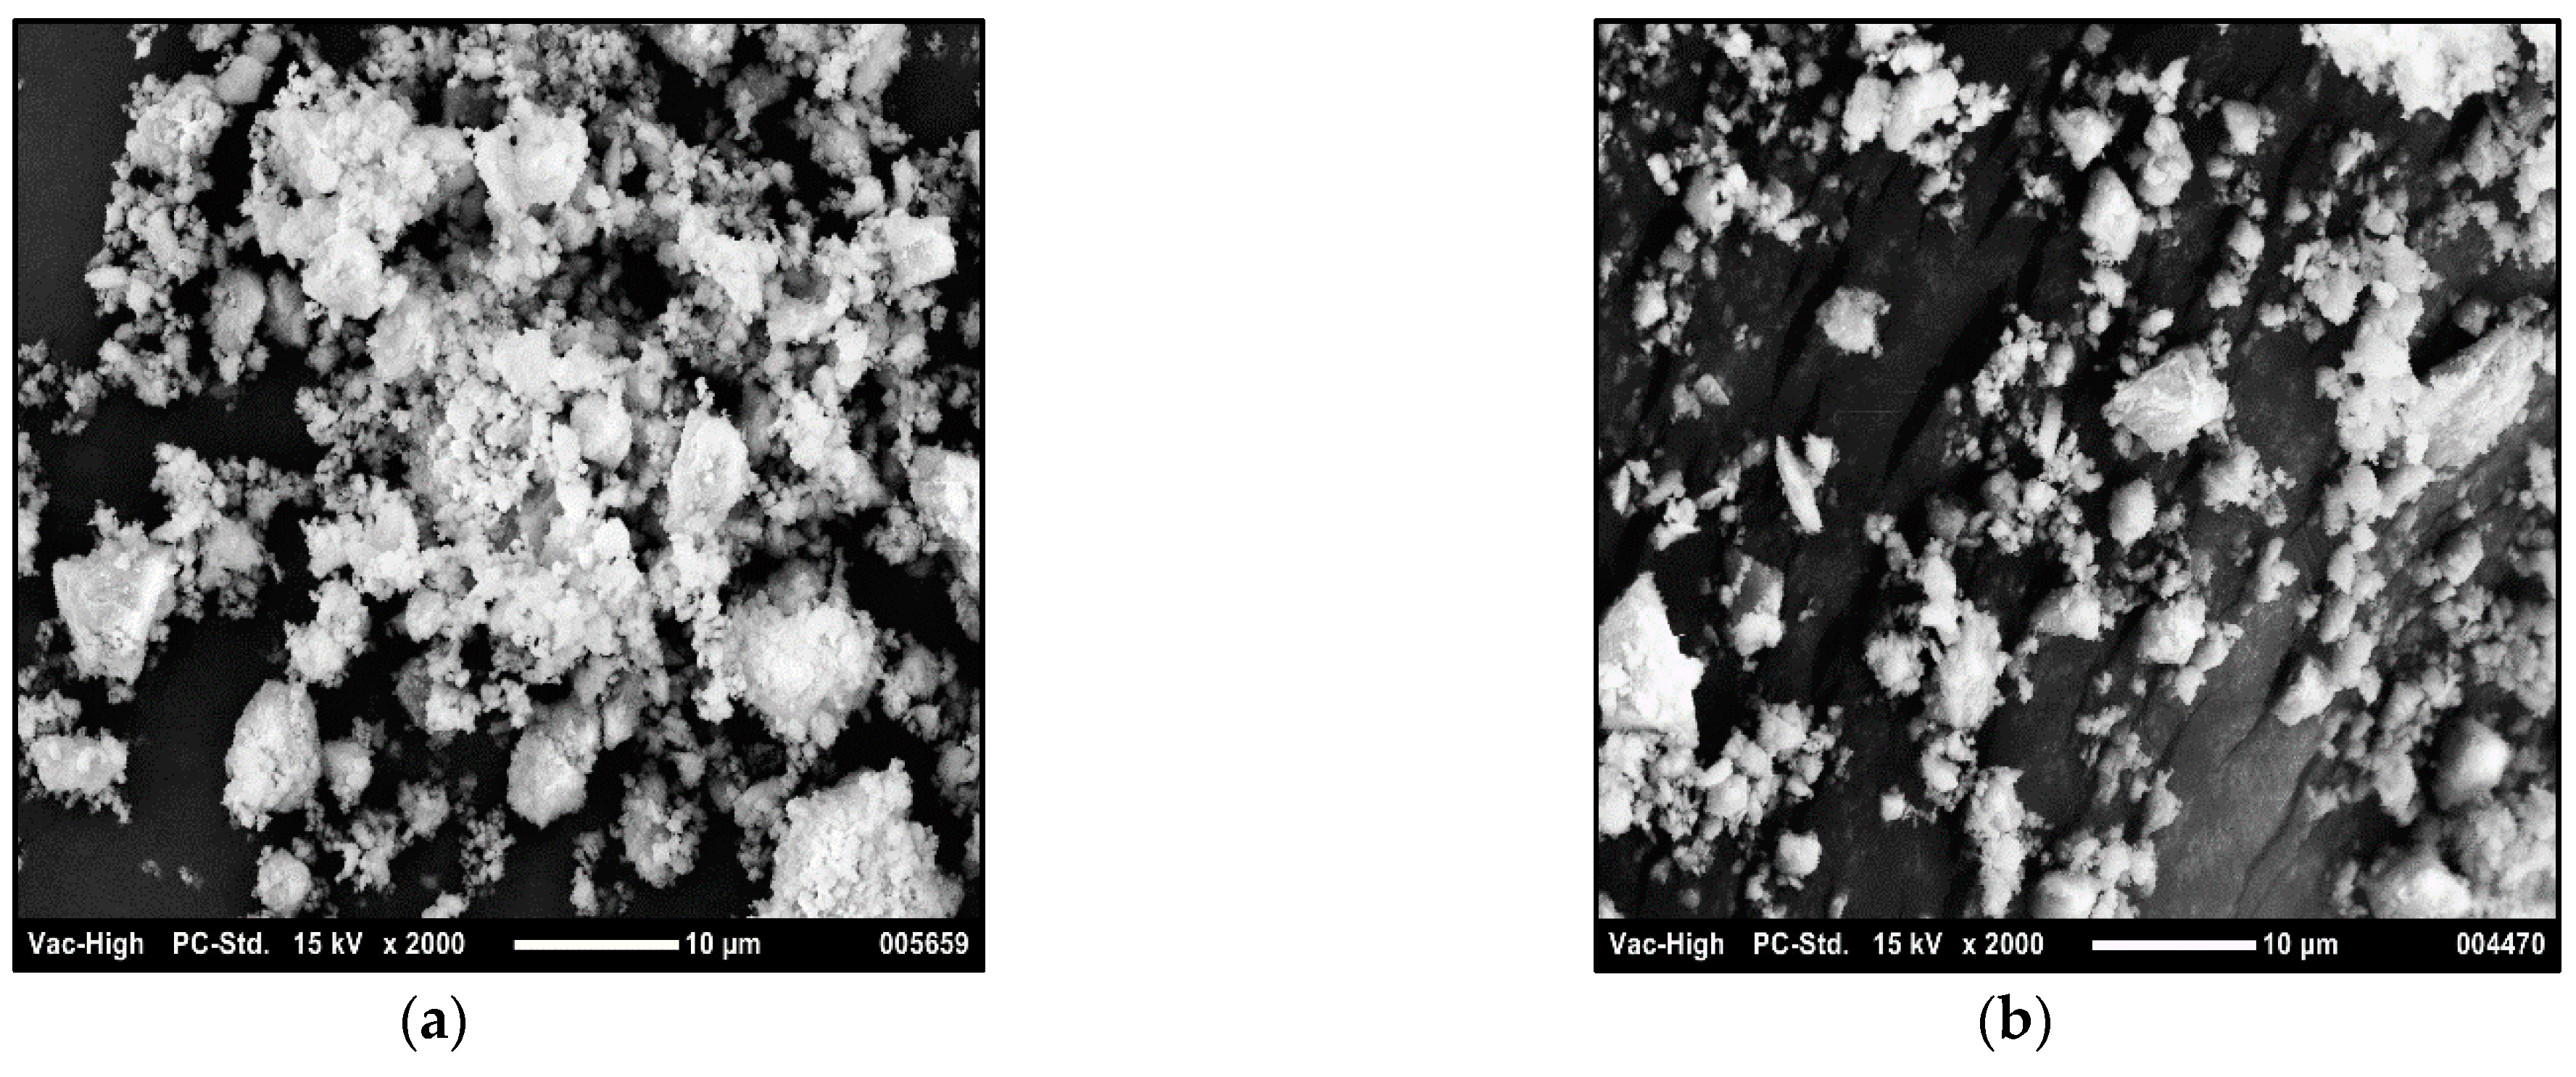
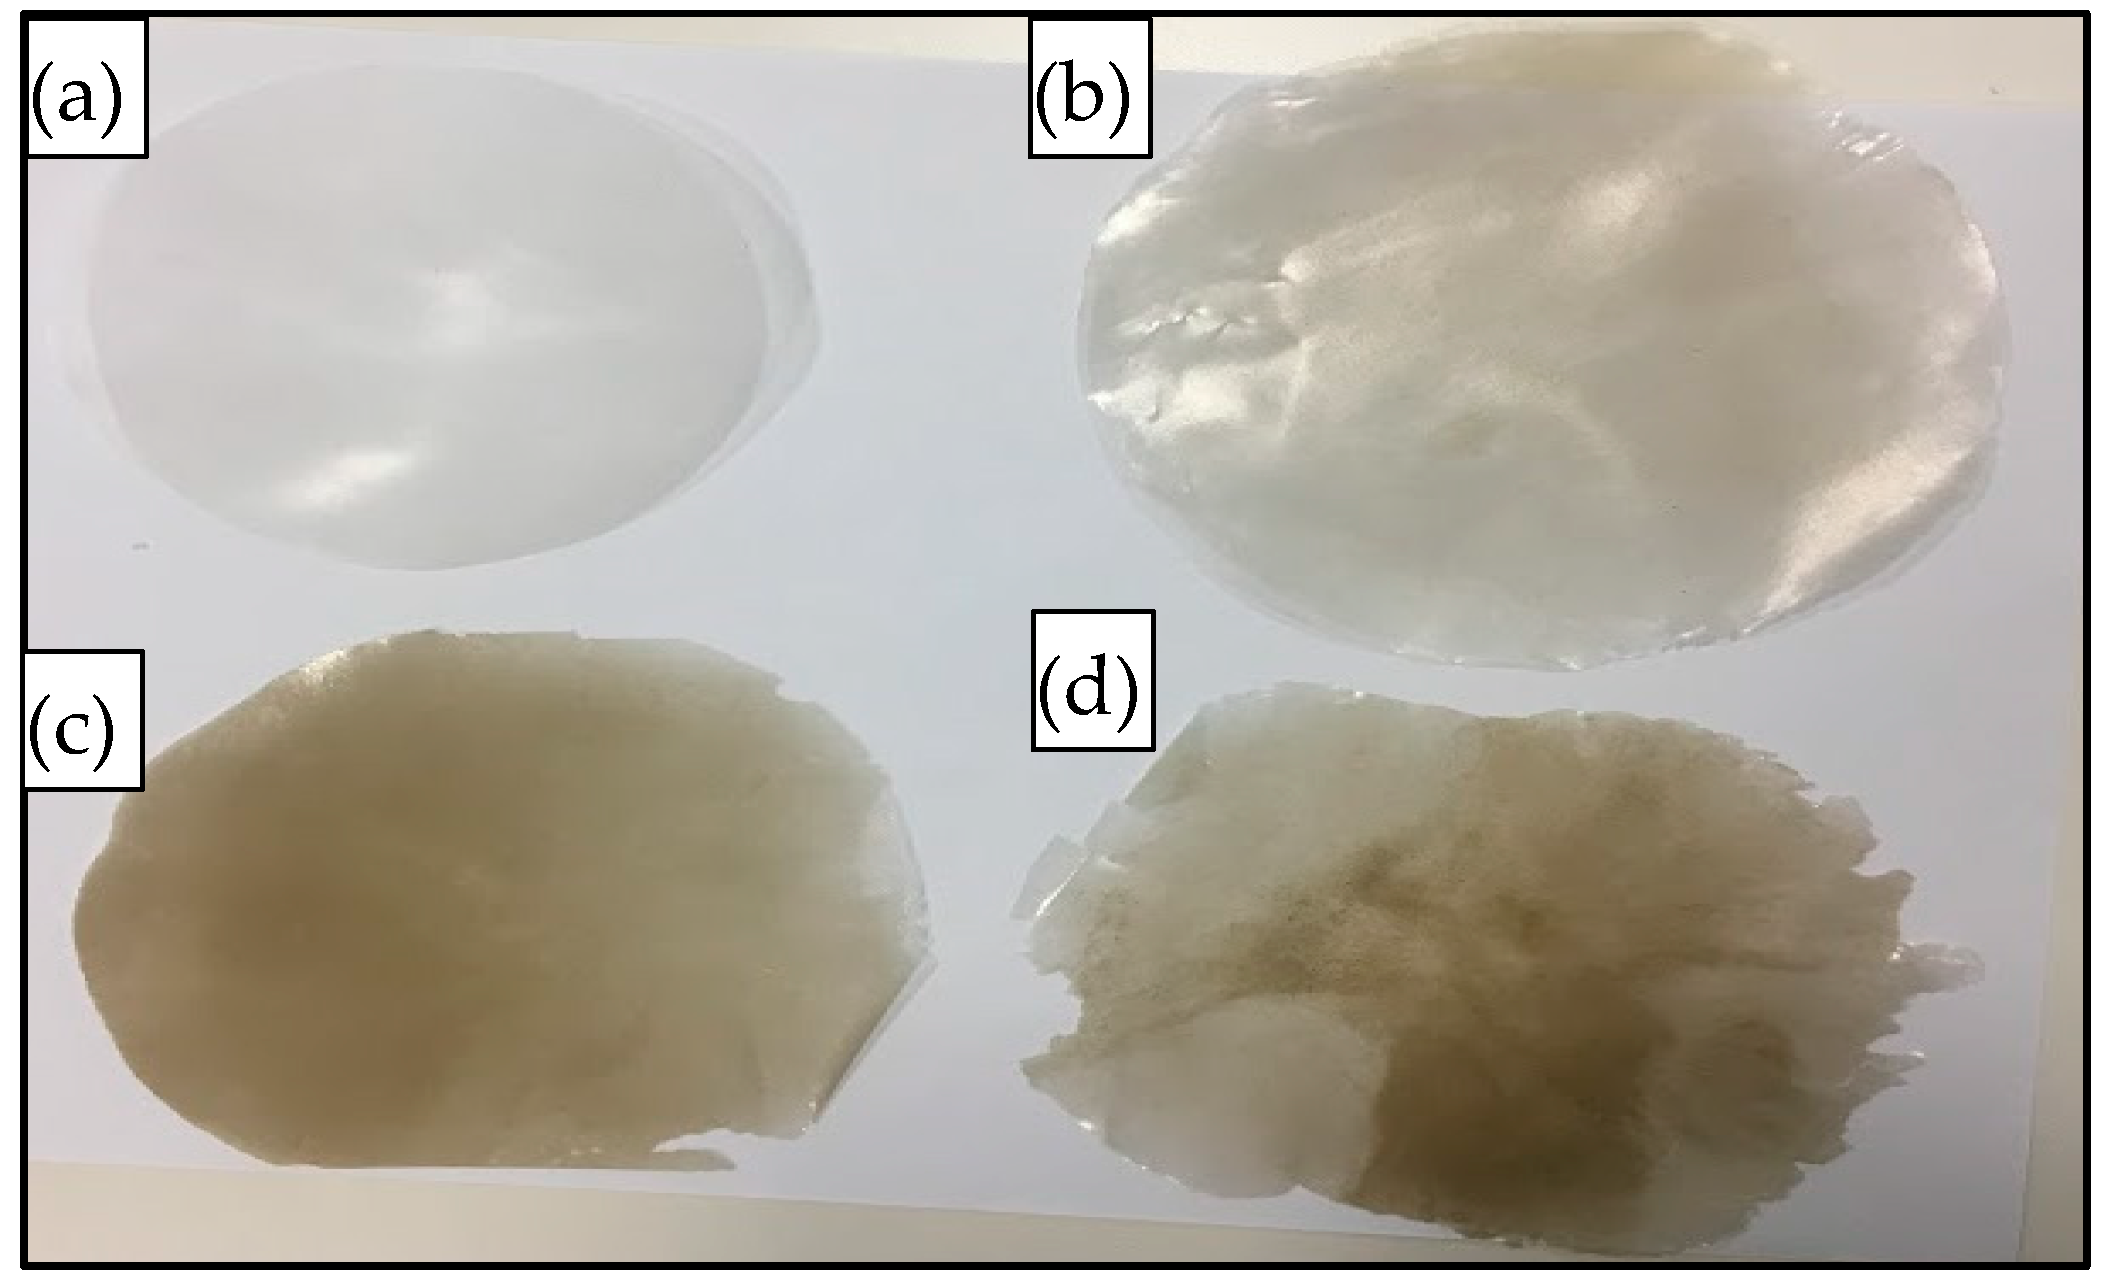
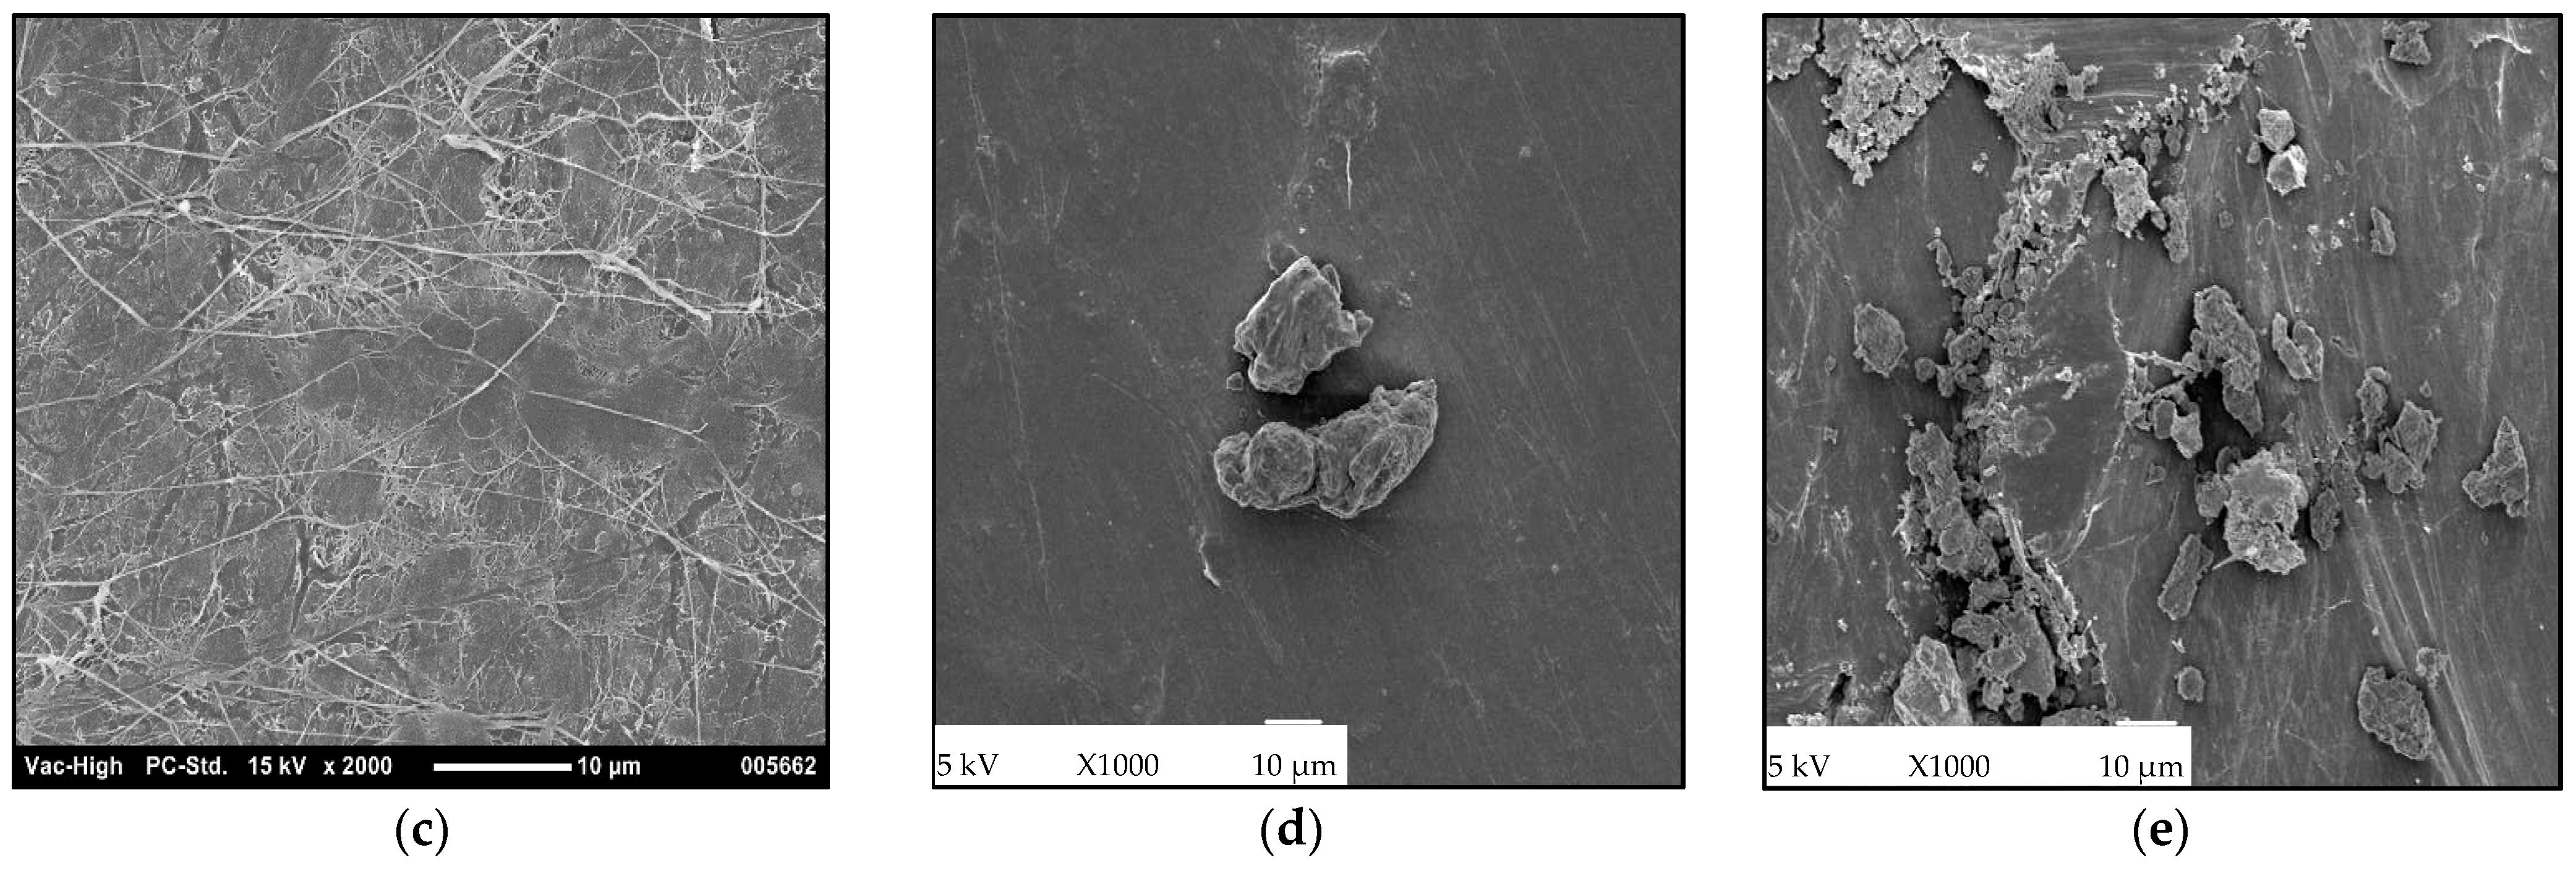
3.1. Morphology
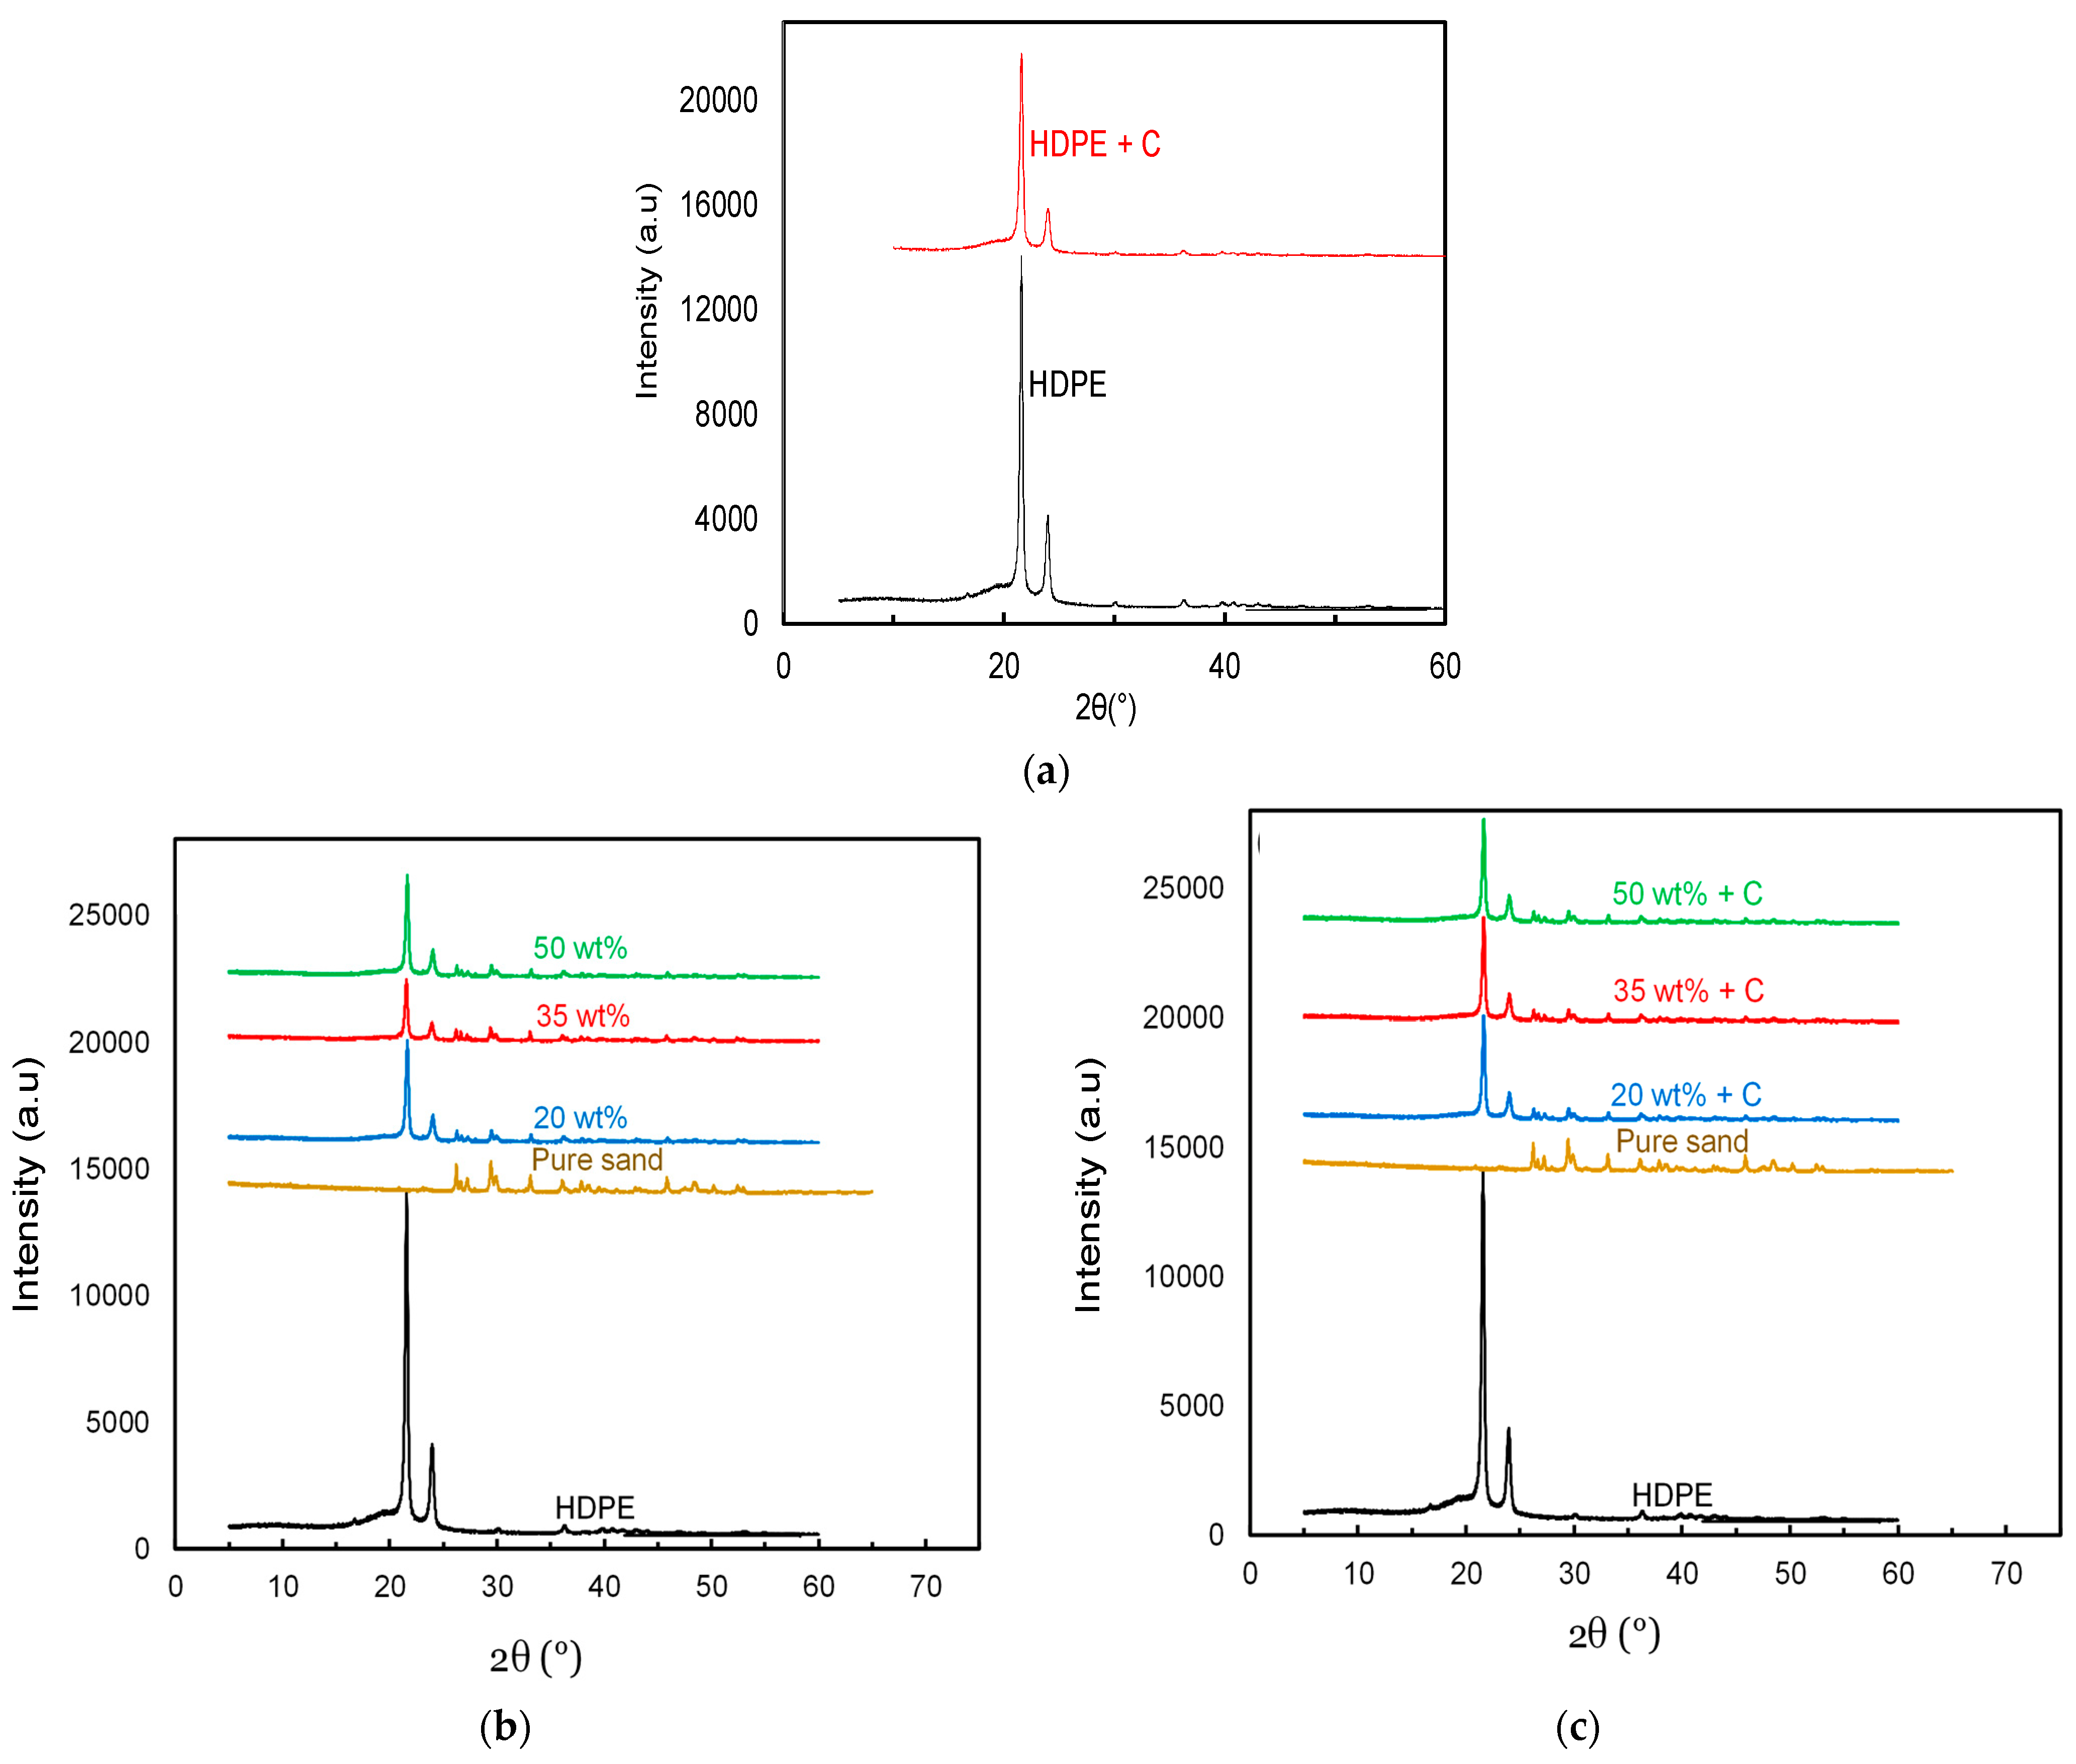
3.2. XRD Analysis
3.3. Thermal Analysis
3.3.1. Melting and Crystallization Behavior
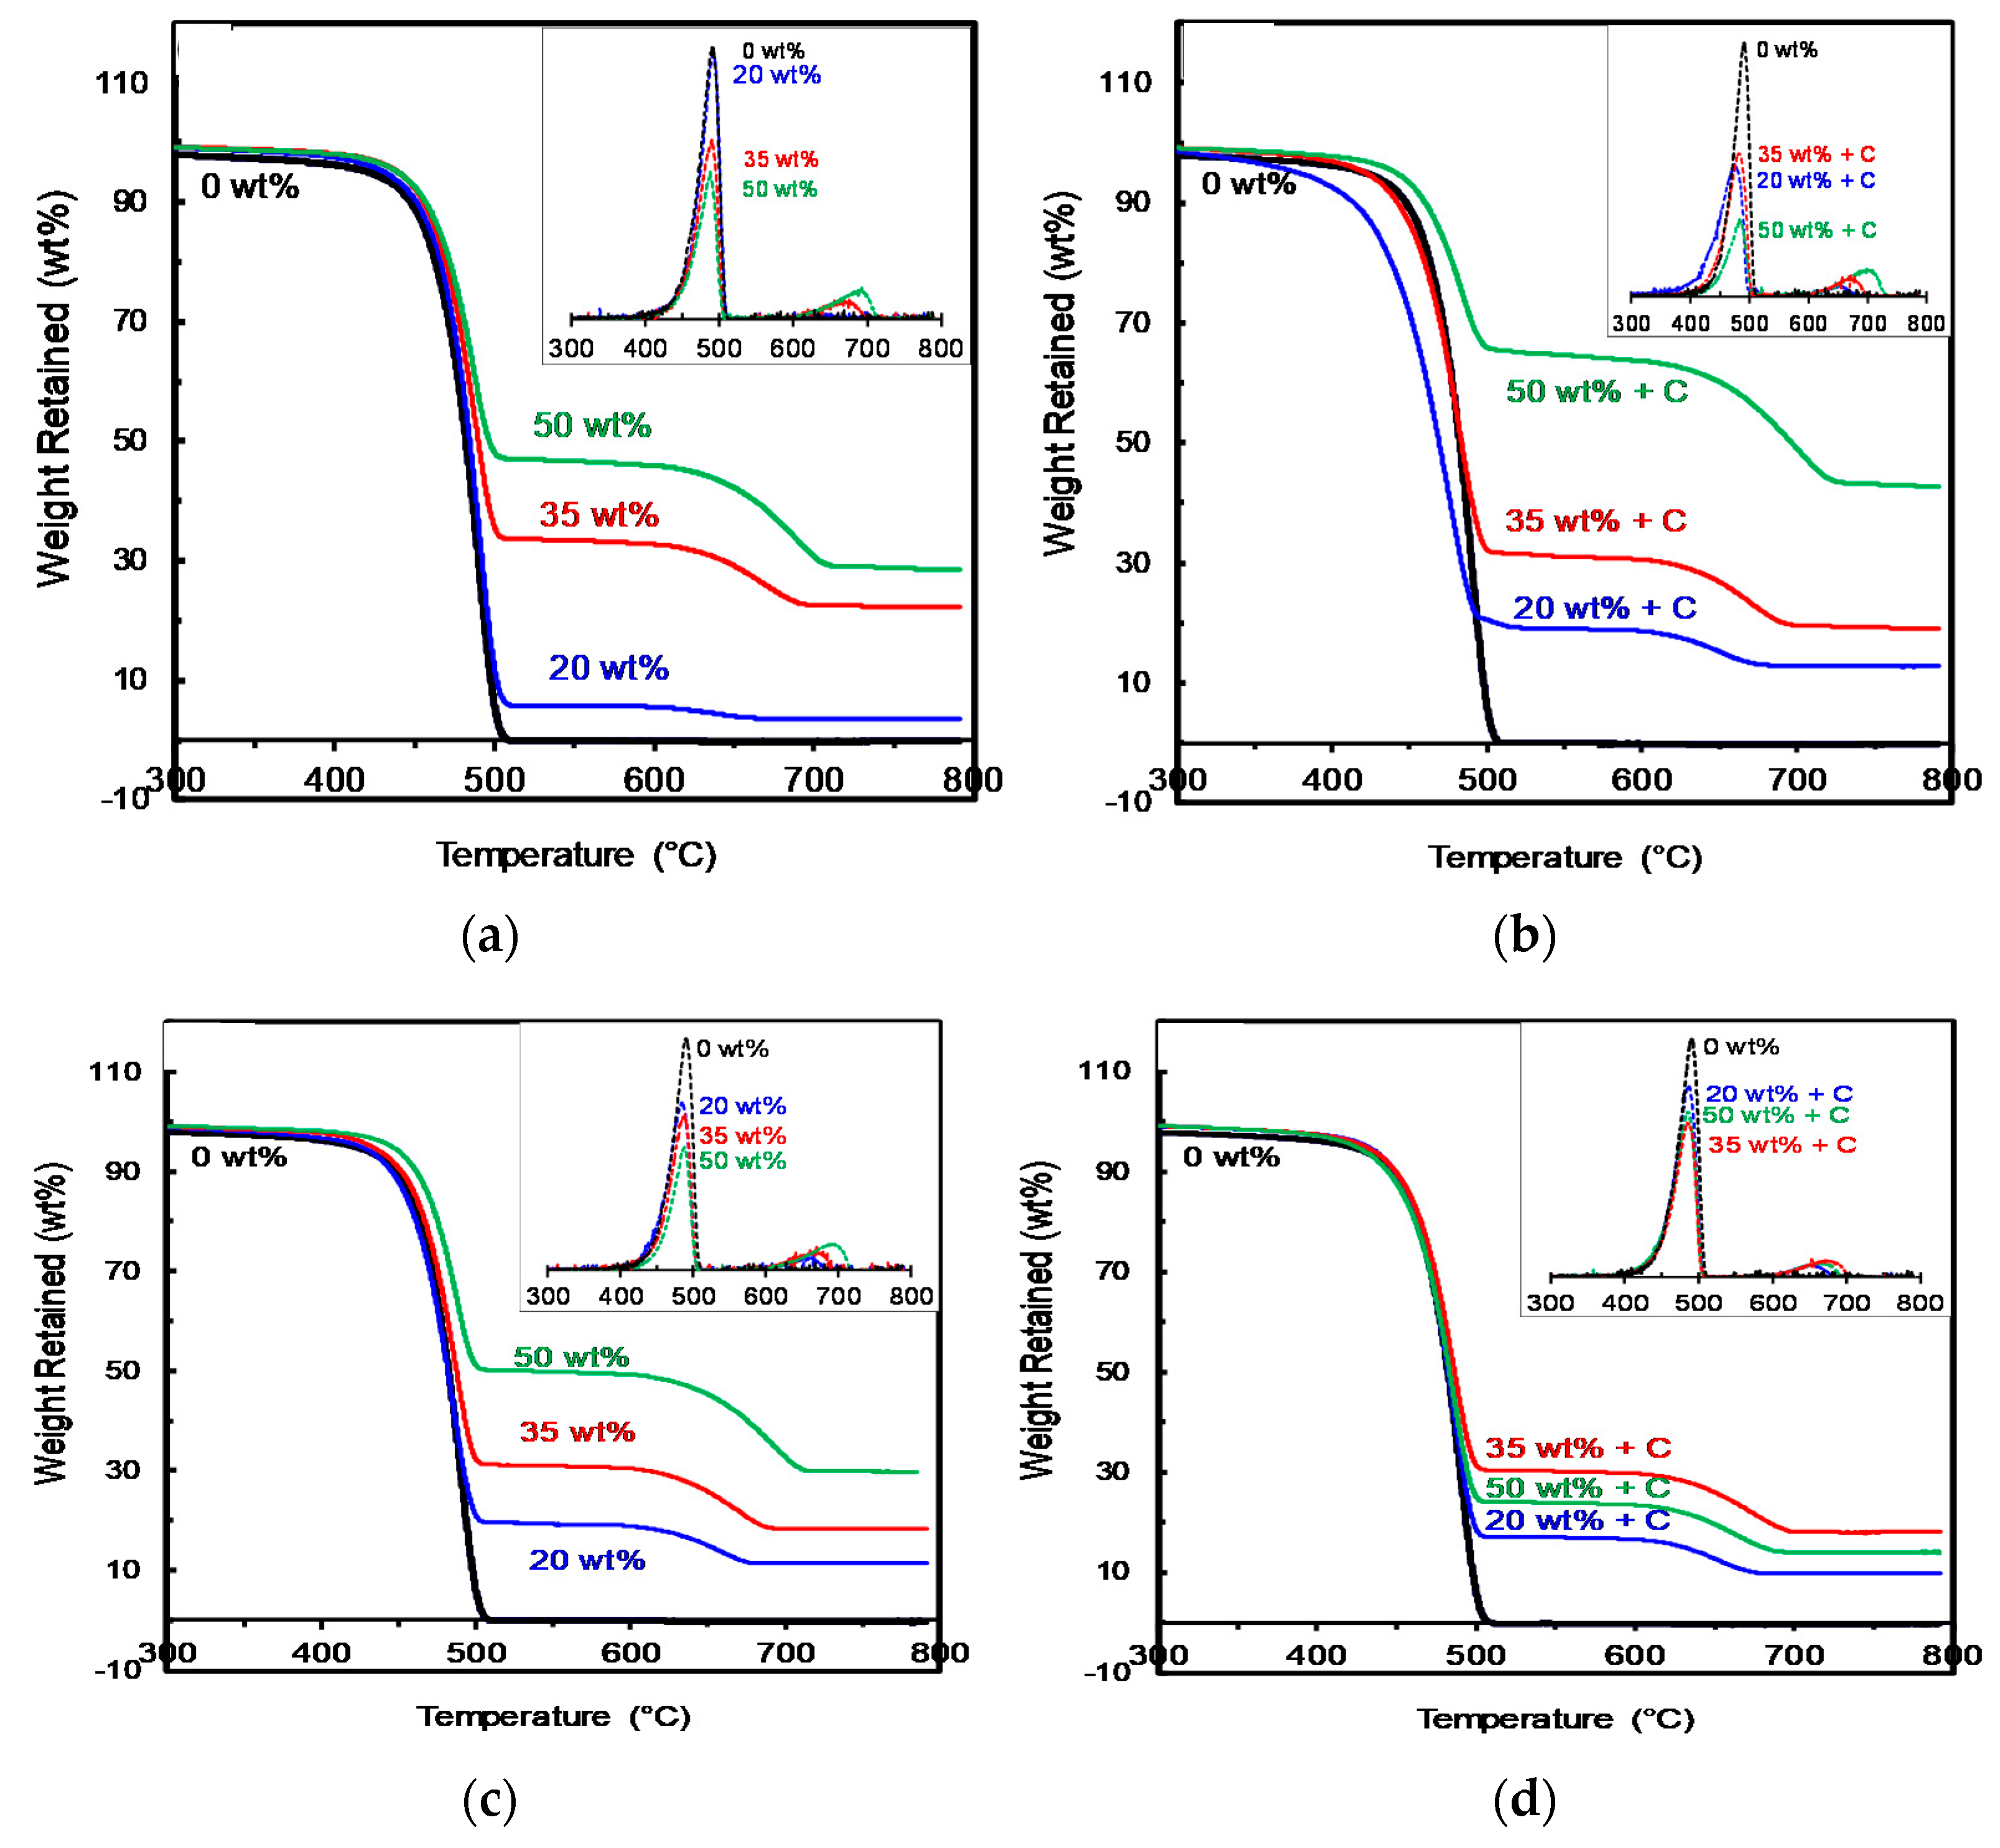
3.3.2. Thermal Stability of Composite Sheets
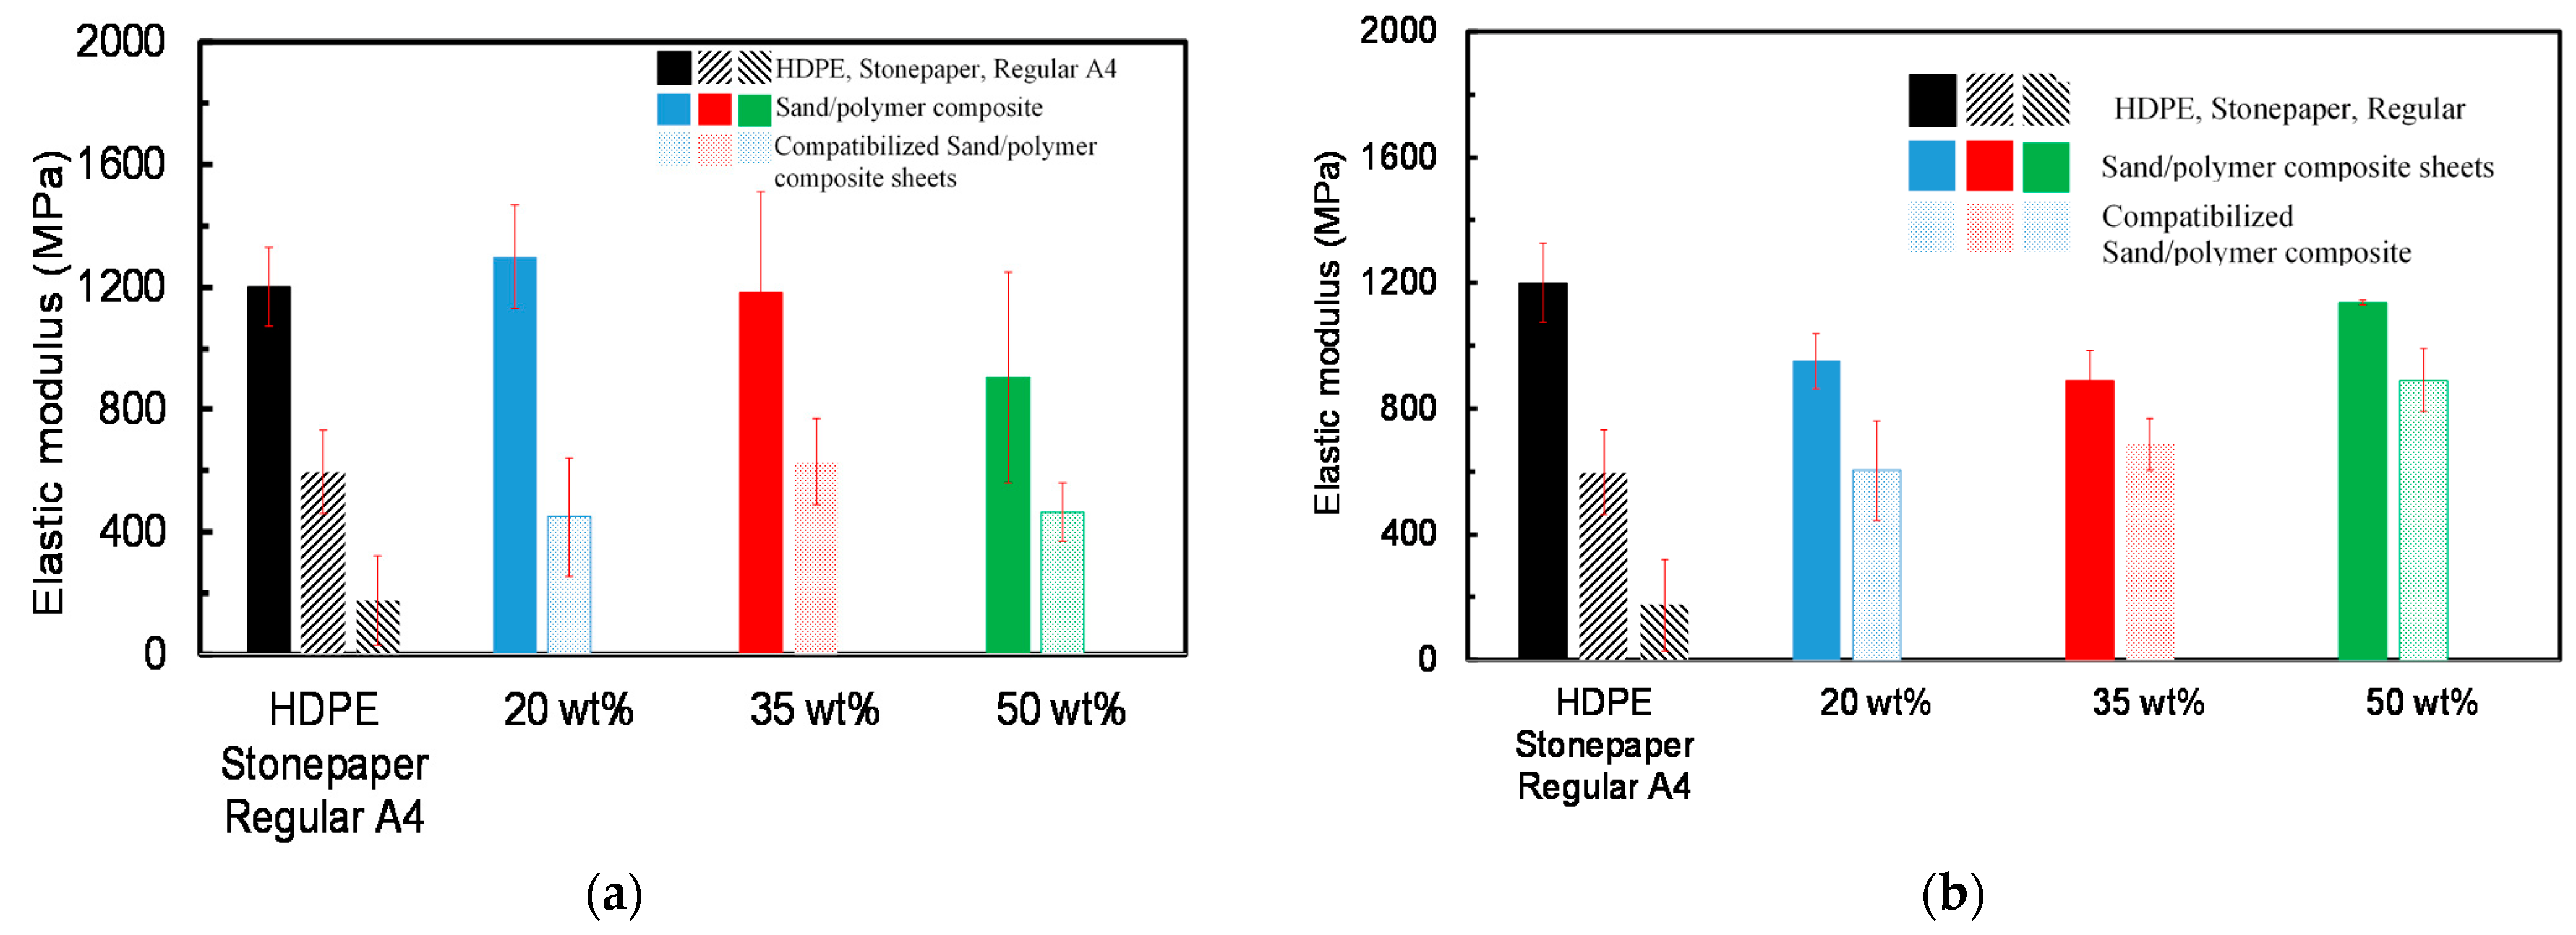
3.4. Mechanical Properties
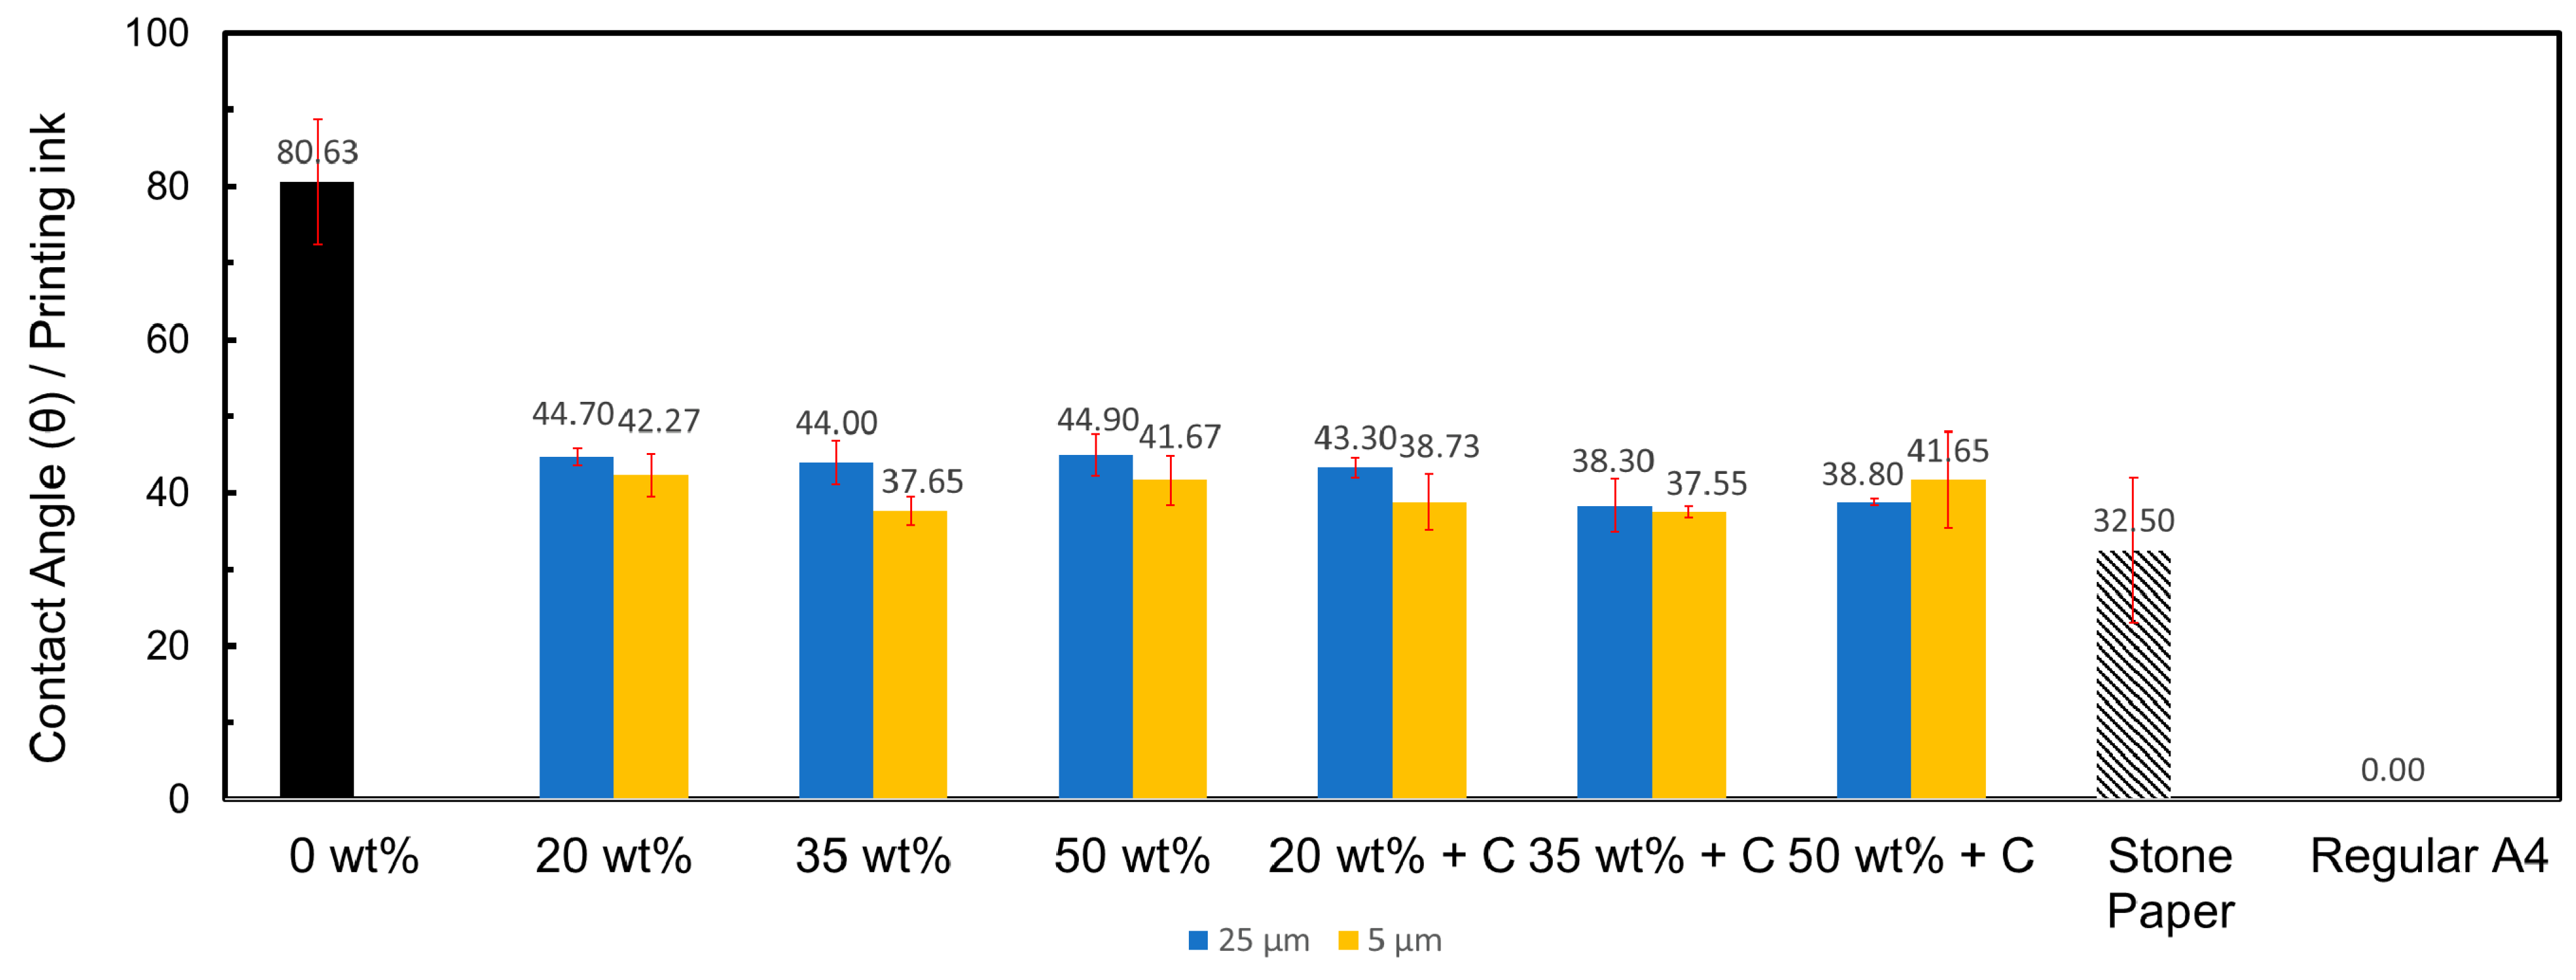
3.5. Wettability Performance
3.6. Printing Test
3.7. Adhesion Test
3.8. Comparative Analysis of Prepared Sand/Polymer Composite Sheets to Stone Paper
4. Conclusions
- Local sand was used as a filler to develop composite sheets, which were investigated.
- Addition of a compatibilizer to the composite sheets was also investigated.
- Melt extrusion and compressing molding techniques were used.
- A set of two particle sizes of silica were used for this study.
- Data were compared to regular A4 paper, and stone paper was also analyzed.
Author Contributions
Funding
Institutional Review Board Statement
Informed Consent Statement
Data Availability Statement
Acknowledgments
Conflicts of Interest
References
- Julkapli, N.M.; Bagheri, S. Developments in nano-additives for paper industry. J. Wood Sci. 2016, 62, 117–130. [Google Scholar] [CrossRef]
- De Santi, C.R.; Correa, A.C.; Manrich, S. Films of post-consumer polypropylene composites for the support layer in synthetic paper. Polímeros 2006, 16, 123–128. [Google Scholar] [CrossRef]
- Geyer, R.; Jambeck, J.R.; Law, K.L. Production, use, and fate of all plastics ever made. Sci. Adv. 2017, 3, e1700782. [Google Scholar] [CrossRef] [PubMed]
- Rochman, C.M.; Browne, M.A.; Halpern, B.S.; Hentschel, B.T.; Hoh, E.; Karapanagioti, H.K.; Rios-Mendoza, L.M.; Takada, H.; Teh, S.; Thompson, R. Classify plastic waste as hazardous. Nature 2013, 494, 169–171. [Google Scholar] [CrossRef]
- Ahmed, W.; Khenata, R.; Siraj, S.; Al-Douri, Y. Ionic Liquid Potential to Recycle Polymeric Waste: An Experimental Investigation. Mater. Res. 2020, 23. [Google Scholar] [CrossRef]
- Lung, M. Stonepaper, Taiwan Lung Meng Technology Co., Ltd. Available online: http://www.taiwanlm.com/ (accessed on 17 February 2020).
- Rockstock. “Photo-Degradable Paper Made from Stone”. Available online: https://www.stonepaper.co.nz/ (accessed on 17 February 2020).
- Ahmed, W.; Alnajjar, F.; Zaneldin, E.; Al-Marzouqi, A.H.; Gochoo, M.; Khalid, S. Implementing FDM 3D Printing Strategies Using Natural Fibers to Produce Biomass Composite. Materials 2020, 13, 4065. [Google Scholar] [CrossRef]
- Menendez, H.; White, J.L. A Wide-angle X-ray diffraction method of determining chopped fiber orientation in composites with application to extrusion through dies. Polym. Eng. Sci. 1984, 24, 1051–1055. [Google Scholar] [CrossRef]
- Nguyen, H.X.; Ishida, H. Poly(aryl-ether-ether-ketone) and its advanced composites: A review. Polym. Compos. 1987, 8, 57–73. [Google Scholar] [CrossRef]
- Bhattachrya, S.; Gupta, R.; Kamal, M.R. Polymeric Nanocomposite: Theory and Practice; Hanser: Munich, Germany, 2007. [Google Scholar]
- Jesionowski, T.; Bula, K.; Janiszewski, J.; Jurga, J. The influence of filler modification on its aggregation and dispersion behaviour in silica/PBT composite. Compos. Interfaces 2003, 10, 225–242. [Google Scholar] [CrossRef]
- Corrêa, A.C.; de Santi, C.R.; Manrich, S. Synthetic Paper from Plastic Waste: The Effect of CaCO3 on Physical, Surface Properties and Printability. In Macromolecular Symposia; Wiley Online Library: Hoboken, NJ, USA, 2006; pp. 611–620. [Google Scholar]
- Borges, J.R.V.; Santos, A.S.F.E.; Manrich, S. The Influence of Organoclay on Polypropylene Composite Films for Synthetic Paper. Polym. Technol. Eng. 2011, 50, 1443–1451. [Google Scholar] [CrossRef]
- Buddi, T.; Rao, B.N.; Singh, S.K.; Purohit, R.; Rana, R.S. Development and Analysis of High Density Poly Ethylene (HDPE) Nano SiO2 and Wood Powder Reinforced Polymer Matrix Hybrid Nano Composites. J. Exp. Nanosci. 2018, 13, S24–S30. [Google Scholar] [CrossRef]
- Ahmed, W.; Siraj, S.; Alnajjar, F.; Al Marzouqi, A.H. 3D Printed Implants for Joint Replacement. In Applications of 3D Printing in Biomedical Engineering; Sharma, N.R., Subburaj, K., Sandhu, K., Sharma, V., Eds.; Springer: Singapore, 2021; pp. 97–119. [Google Scholar]
- Ahmed, W.; Ahmed, S.; Alnajjar, F.; Zaneldin, E. Mechanical Performance of Three-Dimensional Printed Sandwich Composite with a High-Flexible Core. Proc. Inst. Mech. Eng. Part L J. Mater. Des. Appl. 2021, 235, 1382–1400. [Google Scholar] [CrossRef]
- Almazrouei, N.; Siraj, S.; Al-Marzouqi, A.H.; Ahmed, W. Producing Particulate Composite Using 3D Printing Plastics Waste. In Proceedings of the 2022 Advances in Science and Engineering Technology International Conferences (ASET), Dubai, United Arab Emirates, 21–24 February 2022; pp. 1–6. [Google Scholar]
- Wang, X.; Wu, L.; Yu, H.; Xiao, T.; Li, H.; Yang, J. Modified Silica-Based Isoprene Rubber Composite by a Multi-Functional Silane: Preparation and Its Mechanical and Dynamic Mechanical Properties. Polym. Test. 2020, 91, 106840. [Google Scholar] [CrossRef]
- Ahmed, W.; Siraj, S.; Al-Marzouqi, A.H. Embracing Additive Manufacturing Technology through Fused Filament Fabrication for Antimicrobial with Enhanced Formulated Materials. Polymers 2021, 13, 1523. [Google Scholar] [CrossRef] [PubMed]
- Siraj, S.; Al Marzouqi, A.; Lqbal, M. Mechanical and Wettability Performance of Sand/HDPE Composite Sheets. Mater. Sci. Forum 2020, 1015, 9–14. [Google Scholar] [CrossRef]
- Siraj, S.; Al-Marzouqi, A.; Ahmed, W. Processing Biodegradable Fused Filament Fabrication Waste with Micro-Silica Particles. Key Eng. Mater. 2022, 907, 156–162. [Google Scholar] [CrossRef]
- Ahmed, W.; Siraj, S.; Al-Marzouqi, A.H. 3D Printing PLA Waste to Produce Ceramic Based Particulate Rein-forced Composite Using Abundant Silica-Sand: Mechanical Properties Characterization. Polymers 2020, 12, 2579. [Google Scholar] [CrossRef]
- Kumar, P.; Das, V.; Gupta, A.; Ameta, N.K. Stabilization of Dune Sand Mixed with Plastic (LDPE) Waste Strips for Design of Flexible Pavement in Construction of Roads. Am. J. Eng. Res. AJER 2016, 5, 315–320. [Google Scholar]
- Bamigboye, G.O.; Ngene, B.U.; Ademola, D.; Jolayemi, J.K. Experimental Study on the Use of Waste Polyethylene Terephthalate (PET) and River Sand in Roof Tile Production. J. Phys. Conf. Ser. 2019, 1378, 042105. [Google Scholar] [CrossRef]
- Ding, T.; Xiao, J.; Zou, S.; Yu, J. Flexural properties of 3D printed fibre-reinforced concrete with recycled sand. Constr. Build. Mater. 2021, 288, 123077. [Google Scholar] [CrossRef]
- Dang, X.; Gao, Y.; Yu, Y.; Li, Q.; Wang, S.; Wu, H.; Wang, H.; Zhao, P. Windproof Efficiency with New Biodegradable PLA Sand Barrier and Traditional Straw Sand Barrier. J. Beijing For. Univ. 2015, 37, 118–125. [Google Scholar]
- Kumi-Larbi, A.; Yunana, D.; Kamsouloum, P.; Webster, M.; Wilson, D.C.; Cheeseman, C. Recycling waste plastics in developing countries: Use of low-density polyethylene water sachets to form plastic bonded sand blocks. Waste Manag. 2018, 80, 112–118. [Google Scholar] [CrossRef] [PubMed]
- Marzouqi, A.H.A.; Ahmed, S.S.; Rabbani, S.F.; Mesmari, H.J.A.Z.A.; Ketbi, S.H.R.A.; Rahman, N.S.H.A. Method for Obtaining Paper from Sand and Products Obtained Therefrom. U.S. Patent No. 10,611,893, 24 October 2019. [Google Scholar]
- Alsheriani, T.A.K. Composition and Environmental Assessment of Soils from United Arab Emirates. Master’s Thesis, United Arab Emirates University, Abu Dhabi, UAE, 1998. [Google Scholar]
- Mittal, V.; Chaudhry, A.U. Effect of Amphiphilic Compatibilizers on the Filler Dispersion and Properties of Polyethylene—Thermally Reduced Graphene Nanocomposites. J. Appl. Polym. Sci. 2015, 132, 42484–42494. [Google Scholar] [CrossRef]
- Soliman, F. Silica-filled,high molecular weight polyolefin. U.S. Patent No. 3,788,923, 29 January 1974. [Google Scholar]
- de Carvalho, M.S.; Azevedo, J.B.; Barbosa, J.D.V. Effect of the melt flow index of an HDPE matrix on the properties of composites with wood particles. Polym. Test. 2020, 90, 106678. [Google Scholar] [CrossRef]
- Ahmed, W.; Siraj, S.; Al-Marzouqi, A. Comprehensive Characterization of Polymeric Composites Reinforced with Silica Microparticles Using Leftover Materials of Fused Filament Fabrication 3D Printing. Polymers 2021, 13, 2423. [Google Scholar] [CrossRef] [PubMed]
- Bansal, N.P.; Choi, S.R. Properties of CMAS glass from desert sand. Ceram. Int. 2015, 41, 3901–3909. [Google Scholar] [CrossRef]
- Peşman, E.; Tufan, M. The Effects of CaCO3 Coated Wood Free Paper Usage as Filler on Water Absorption, Me-chanical and Thermal Properties of Cellulose-High Density Polyethylene Composites. Mater. Sci. 2016, 22, 530–535. [Google Scholar]
- Tang, W.; Santare, M.H.; Advani, S.G. Melt Processing and Mechanical Property Characterization of Multi-Walled Carbon Nanotube/High Density Polyethylene (MWNT/HDPE) Composite Films. Carbon 2003, 41, 2779–2785. [Google Scholar] [CrossRef]
- Aggarwal, S.; Sajwan, M.; Singh, R.B. Crystallinity of Hdpe Pipes by Dsc, Xrd and Ftir Spectroscopy-a Forensic Comparison. Indian J. Criminol. Crim. 2008, 2, 141–148. [Google Scholar]
- Lei, Y.; Wu, Q.; Clemons, C.M.; Yao, F.; Xu, Y. Influence of Nanoclay on Properties of HDPE/Wood Composites. J. Appl. Polym. Sci. 2007, 106, 3958–3966. [Google Scholar] [CrossRef]
- Musić, S.; Filipović-Vinceković, N.; Sekovanić, L. Precipitation of Amorphous SiO2 Particles and Their Properties. Braz. J. Chem. Eng. 2011, 28, 89–94. [Google Scholar] [CrossRef]
- Martínez, J.; Palomares-Sánchez, S.; Ortega-Zarzosa, G.; Ruiz, F.; Chumakov, Y. Rietveld refinement of amorphous SiO2 prepared via sol–gel method. Mater. Lett. 2006, 60, 3526–3529. [Google Scholar] [CrossRef]
- Jeevananda, T.; Kim, N.H.; Lee, J.H.; Basavarajaiah, S.; Urs, M.D.; Ranganathaiah, C. Investigation of Multi-Walled Carbon Nanotube-Reinforced High-Density Polyethylene/Carbon Black Nanocomposites Using Electrical, DSC and Positron Lifetime Spectroscopy Techniques. Polym. Int. 2009, 58, 775–780. [Google Scholar] [CrossRef]
- Netzch, P. Polymer Manufacturing. Determination of the Degree of Crystallinity If Polymers (PE and PP). Available online: https://www.netzsch.com/en/ (accessed on 26 November 2019).
- Hitachi High-Tech Science Corporation, 1986, Application Brief-DSC Measurement of Polyethylene: Correlation of Polyethn. Available online: www.hitachihigh-tec-science.com (accessed on 23 February 2020).
- Brostow, W.; Datashvili, T.; Jiang, P.; Miller, H. Recycled HDPE reinforced with sol–gel silica modified wood sawdust. Eur. Polym. J. 2016, 76, 28–39. [Google Scholar] [CrossRef]
- Liu, Y.-L.; Wei, W.-L.; Hsu, K.-Y.; Ho, W.-H. Thermal Stability of Epoxy-Silica Hybrid Materials by Thermo-gravimetric Analysis. Thermochim. Acta 2004, 412, 139–147. [Google Scholar] [CrossRef]
- Dorigato, A.; D’Amato, M.; Pegoretti, A. Thermo-mechanical properties of high density polyethylene—Fumed silica nanocomposites: Effect of filler surface area and treatment. J. Polym. Res. 2012, 19, 9889. [Google Scholar] [CrossRef]
- Zheng, K.; Yao, X.; Tian, X.; Chen, L.; He, H.; Li, Y. Synthesis and Thermal Behavior of Silica-Graft-Polypropylene Nanocomposites Studied by Step-Scan DSC and TGA. J. Macromol. Sci. Part B 2006, 45, 493–505. [Google Scholar] [CrossRef]
- Elleithy, R.H.; Ali, I.; Ali, M.A.; Al-Zahrani, S.M. High Density Polyethylene/Micro Calcium Carbonate Com-posites: A Study of the Morphological, Thermal, and Viscoelastic Properties. J. Appl. Polym. Sci. 2010, 117, 2413–2421. [Google Scholar] [CrossRef]
- Araujo, J.; Waldman, W.; De Paoli, M.-A. Thermal properties of high density polyethylene composites with natural fibres: Coupling agent effect. Polym. Degrad. Stab. 2008, 93, 1770–1775. [Google Scholar] [CrossRef]
- Cheng, D.; Zan, Y.; Du, J.; Luo, Y. Recycling of Ultrahigh Molecular Weight Polyethylene Waste Used for Pre-paring High Performance Synthetic Paper. J. Appl. Polym. Sci. 2016, 133, 44159–44165. [Google Scholar] [CrossRef]
- Albano, C.; Cataño, L.; Figuera, L.; Perera, R.; Karam, A.; González, G.; Noris, K. Evaluation of a composite based on high-density polyethylene filled with surface-treated hydroxyapatite. Polym. Bull. 2009, 62, 45–55. [Google Scholar] [CrossRef]
- Tasdemir, M.; Ersoy, S. The Mechanical and Morphological Properties of HDPE Composites Filled with SiO2, ZnO, Mg(OH)2 and CaCO3 Nano Powder. Rom. J. Mat. RRM 2013, 43, 417–424. [Google Scholar]
- Bulatović, V.O.; Mihaljević, A.; Bajsić, E.G. Mechanical and Interfacial Properties of Compatibilized Polyurethane Blends. Polym. Eng. Sci. 2018, 58, 1911–1922. [Google Scholar] [CrossRef]
- Abuoudah, C.K.; Greish, Y.E.; Abu-Jdayil, B.; El-said, E.M.; Iqbal, M.Z. Graphene/Polypropylene Nanocomposites with Improved Thermal and Mechanical Properties. J. Appl. Polym. Sci. 2021, 138, 50024. [Google Scholar] [CrossRef]
- Bula, K.; Jesionowski, T. Effect of Polyethylene Functionalization on Mechanical Properties and Morphology of PE/SiO2 Composites. Compos. Interfaces 2010, 17, 603–614. [Google Scholar] [CrossRef]
- Rodrigue, D.; Kavianiboroujeni, A.; Cloutier, A. Determination of the optimum coupling agent content for composites based on hemp and high density polyethylene. AIP Conf. Proc. 2017, 1914, 030003. [Google Scholar] [CrossRef]
- Tanpichai, S.; Witayakran, S.; Srimarut, Y.; Woraprayote, W.; Malila, Y. Porosity, Density and Mechanical Properties of the Paper of Steam Exploded Bamboo Microfibers Controlled by Nanofibrillated Cellulose. J. Mater. Res. Technol. 2019, 8, 3612–3622. [Google Scholar] [CrossRef]
- Mendes, L.C.; Cestari, S.P. Printability of HDPE/Natural Fiber Composites with High Content of Cellulosic Industrial Waste. Mater. Sci. Appl. 2011, 2, 1331. [Google Scholar] [CrossRef]
- Testing Machines, Inc. A Practical Means to Measure Surface Treatment Levels of PE Film Using PGX+, a New Portable Contact Angle Instrument. Available online: www.testingmachines.com (accessed on 21 February 2020).


| Sample | HDPE (wt%) | Sand (wt%) | Compatibilizer (wt%) | |
|---|---|---|---|---|
| Sand/polymer composite sheets prepared from 25 µm and 5 µm sand particles | 0 wt% | 100 | 0 | 0 |
| 20 wt% | 80 | 20 | 0 | |
| 35 wt% | 65 | 35 | 0 | |
| 50 wt% | 50 | 50 | 0 | |
| 20 wt% + C | 70 | 20 | 10 | |
| 35 wt% + C | 47.5 | 35 | 17.5 | |
| 50 wt% + C | 25 | 50 | 25 |
| Sample | 1st Cooling Scan | 2nd Heating Scan | |||||
|---|---|---|---|---|---|---|---|
| Tc,onset (°C) | Tc,peak (°C) | ∆Hc (J/g) | Tm,peak (°C) | ∆Hm (J/g) | %Xc | ||
| 0 wt% | 117.54 ± 0.01 | 114.79 ± 0.61 | 120.62 ± 21 | 133.86 ± 0.55 | 148.77 ± 13.9 | 48.57 ± 8.5 | |
| Sand/polymer composite sheets prepared from 25 µm sand particles | 20 wt% | 117.46 ± 0.11 | 113.91 ± 0.83 | 121.51 ± 15 | 135.60 ± 3.5 | 131.27 ± 9.0 | 56.00 ± 3.8 |
| 35 wt% | 117.82 ± 0.06 | 114.61 ± 0.88 | 94.79 ± 14 | 135.423 ± 3.4 | 99.791 ± 9.0 | 52.40 ± 4.7 | |
| 50 wt% | 118.71 ± 0.09 | 115.04 ± 0.33 | 74.38 ± 14 | 132.11 ± 0.07 | 86.034 ± 7.5 | 58.73 ± 5.2 | |
| 20 wt% + C | 117.50 ± 0.07 | 115.40 ± 0.39 | 85.06 ± 9.1 | 133.58 ± 0.3 | 110.35 ± 2.5 | 47.08 ± 1.1 | |
| 35 wt% + C | 117.82 ± 0.06 | 115.80 ± 0.40 | 87.03 ± 1.4 | 132.31 ± 1.9 | 96.60 ± 8.2 | 50.71 ± 4.3 | |
| 50 wt% + C | 117.68 ± 0.49 | 114.95 ± 0.13 | 51.87 ± 16 | 134.01 ± 1.6 | 60.11 ± 5.4 | 41.0 ± 3.7 | |
| Sand/polymer composite sheets prepared from 5 µm sand particles | 20 wt% | 117.59 ± 0.08 | 115.04 ± 0.58 | 105.58 ± 10 | 133.35 ± 3.6 | 122.877 ± 11 | 52.42 ± 5.0 |
| 35 wt% | 118.23 ± 0.35 | 114.12 ± 1.32 | 98.32 ± 5 | 136.31 ± 4.2 | 109.07 ± 7.5 | 57.27 ± 3.4 | |
| 50 wt% | 118.24 ± 0.05 | 116.21 ± 0.48 | 64.30 ± 6.2 | 133.72 ± 1.5 | 77.91 ± 5.7 | 53.18 ± 3.9 | |
| 20 wt% + C | 117.66 ± 0.15 | 115.41 ± 0.64 | 112.23 ± 3.5 | 134.21 ± 5.1 | 118.77 ± 14 | 50.67 ± 6.3 | |
| 35 wt% + C | 117.95 ± 0.21 | 115.48 ± 0.91 | 85.35 ± 3 | 134.56 ± 2.7 | 91.32 ± 2.5 | 47.95 ± 1.3 | |
| 50 wt% + C | 117.78 ± 50 | 115.15 ± 0.16 | 42.49 ± 1.8 | 132.17 ± 2.7 | 54.51 ± 3.6 | 37.42 ± 3.4 | |
| Stone Paper | 117.72 ± 0.12 | 114.62 ± 0.1 | 27.08 ± 2.3 | 134.52 ± 0.8 | 33.26 ± 1.9 | 41.03 ± 3.7 | |
| Regular A4 | - | - | - | - | - | - | |
| Sample | Td,onset (°C) | Td,peak (°C) | Tonset, @ 10% weight loss (°C) | |
|---|---|---|---|---|
| 0 wt% | 466.69 | 489.0 | 444.86 | |
| Sand/polymer composite sheets prepared from 25 µm sand particles | 20 wt% | 458.03 | 491.0 | 448.85 |
| 35 wt% | 461.74 | 492.01 | 453.43 | |
| 50 wt% | 464.6 | 490.0 | 454.66 | |
| 20 wt% + C | 461.42 | 479.0 | 409.42 | |
| 35 wt% + C | 460.11 | 481.3 | 439.66 | |
| 50 wt% + C | 458.69 | 488.0 | 457.61 | |
| Sand/polymer composite sheets prepared from 5 µm sand particles | 20 wt% | 467.78 | 486.21 | 443.14 |
| 35 wt% | 464.31 | 490.53 | 449.48 | |
| 50 wt% | 462.39 | 490.10 | 459.56 | |
| 20 wt% + C | 437.68 | 499.01 | 446.97 | |
| 35 wt% + C | 454.08 | 488.41 | 447.20 | |
| 50 wt% + C | 456.76 | 488.06 | 442.17 | |
| Stone Paper | 457.05 | 489.50 | 469.72 | |
| Regular A4 | 347.74 | 381.60 | 324.63 |
| Sample | Elastic Modulus (MPa) | Yield Stress (MPa) | Yield Strain (MPa) | Tensile Strength (MPa) | Tensile Strain (MPa) | |
|---|---|---|---|---|---|---|
| 0 wt% | 1200.77 ± 127.3 | 35.15 ± 2.7 | 2.1 ± 3.5 | 33.76 ± 6.2 | 2.26 ± 0.42 | |
| Sand/polymer composite sheets prepared from 25 µm sand particles | 20 wt% | 1298.33 ± 169.8 | 27.84 ± 4.3 | 0.0424 ± 0.008 | 20.23 ± 3.5 | 0.17 ± 0.15 |
| 35 wt% | 1182.33 ± 328.4 | 23.11 ± 4.8 | 0.028 ± 0.009 | 18.96 ± 6.7 | 0.035 ± 0.01 | |
| 50 wt% | 905.72 ± 343.1 | 12.74 ± 5.4 | 0.022 ± 0.009 | 9.93 ± 4.7 | 0.030 ± 0.02 | |
| 20 wt% + C | 448.78 ± 194.1 | 11.98 ± 2.4 | 0.04 ± 0.01 | 8.01 ± 2.7 | 0.05 ± 0.01 | |
| 35 wt% + C | 629.95 ± 138.9 | 9.56 ± 43.5 | 0.02 ± 0.004 | 8.68 ± 3.5 | 0.02 ± 0.005 | |
| 50 wt% + C | 465.11 ± 94.9 | 6.71 ± 1.8 | 0.02 ± 0.01 | 4.36 ± 1.9 | 0.03 ± 0.01 | |
| Sand/polymer composite sheets prepared from 5 µm sand particles | 20 wt% | 950.59 ± 86.6 | 24.89 ± 1.9 | 0.04 ± 0.002 | 21.56 ± 0.6 | 0.06 ± 0.01 |
| 35 wt% | 887.47 ± 96.2 | 19.11 ± 0.9 | 0.03 ± 0.002 | 17.17 ± 2.8 | 0.05 ± 0.003 | |
| 50 wt% | 1137.05 ± 8.2 | 18.64 ± 3.37 | 0.02 ± 0.002 | 17.22 ± 1.48 | 0.02 ± 0.001 | |
| 20 wt% + C | 603.54 ± 157.9 | 17.64 ± 2.53 | 0.05 ± 0.02 | 15.94 ± 2.76 | 0.05 ± 0.02 | |
| 35 wt% + C | 687 ± 80.87 | 212.48 ± 0.38 | 0.02 ± 0.00 | 10.98 ± 1.04 | 0.03 ± 0.01 | |
| 50 wt% + C | 890.87 ± 101.6 | 16.78 ± 3.12 | 0.03 ± 0.005 | 15.09 ± 2.18 | 0.03 ± 0.02 | |
| Stone Paper | 596.32 ± 135.14 | 6.07 ± 0.53 | 0.11 ± 0.04 | 6.17 ± 0.73 | 0.54 ± 0.19 | |
| Regular A4 | 175.18 ± 146.36 | 16.17 ± 5.08 | 0.06 ± 0.03 | 15.66 ± 5.14 | 0.06 ± 0.03 | |
| Sample | Water | Benzene | Water-Benzene Mixture | Printing Ink | |
|---|---|---|---|---|---|
| 0 wt% | 97.96 ± 9.2 | 22.05 ± 1.8 | 100.93 ± 9.5 | 80.63 ± 8.2 | |
| Sand/polymer composite sheets prepared from 25 µm sand particles | 20 wt% | 86.62 ± 6.3 | 31.80 ± 2.6 | 90 ± 0 | 44.70 ± 1.1 |
| 35 wt% | 89.6 ± 0.9 | 22.83 ± 4.1 | 90 ± 0 | 44.0 ± 2.9 | |
| 50 wt% | 94.72 ± 3.0 | 37.95 ± 6.9 | 90 ± 0 | 44.9 ± 2.8 | |
| 20 wt% + C | 99.62 ± 6.2 | 26.03 ± 7.0 | 90 ± 0 | 43.40 ± 1.3 | |
| 35 wt% + C | 92 ± 5.7 | 21.70 ± 6.9 | 90 ± 0 | 38.30 ± 3.4 | |
| 50 wt% + C | 98.74 ± 8.3 | 20.17 ± 2.2 | 91.77 ± 3.1 | 38.80 ± 0.5 | |
| Sand/polymer composite sheets prepared from 5 µm sand particles | 20 wt% | 86.88 ± 5.5 | 30.95 ± 6.2 | 90 ± 0 | 42.27 ± 2.8 |
| 35 wt% | 92.08 ± 4.7 | 20.37 ± 2.1 | 90 ± 0 | 37.65 ± 1.9 | |
| 50 wt% | 94.6 ± 8.6 | 27.03 ± 6.7 | 90 ± 0 | 41.67 ± 3.2 | |
| 20 wt% + C | 105.6 ± 9.1 | 24.23 ± 0.8 | 90 ± 0 | 38.73 ± 3.7 | |
| 35 wt% + C | 99.4 ± 3.9 | 21.13 ± 2.2 | 94.83 ± 8.3 | 37.55 ± 0.78 | |
| 50 wt% + C | 99.12 ± 3.7 | 21.87 ± 1.6 | 102.33 ± 11.4 | 41.65 ± 6.3 | |
| Stone Paper | 105.62 ± 2.1 | 26.50 ± 4.4 | 113.30 ± 7.2 | 32.50 ± 9.5 | |
| Regular A4 | 83.34 ± 7.8 | 0 ± 0 | 83.27 ± 21.8 | 0 ± 0 | |
| Stone Paper | Regular A4 Paper | 0 wt% | 35 wt%, 25 µm | 35 wt% + C, 25 µm | 35 wt%, 5 µm | 35 wt% + C, 5 µm | |
|---|---|---|---|---|---|---|---|
| Before adherence test with permanent marker pen (sheet surface) |  |  |  |  |  |  |  |
| After adherence test with permanent marker pen (sheet surface) |  |  |  |  |  |  |  |
| After adherence test with permanent marker pen (removed adhesive tape) |  |  |  |  |  |  |  |
| Stone Paper | Regular A4 Paper | 0 wt% | 35 wt%, 25 µm | 35 wt% + C, 25 µm | 35 wt%, 5 µm | 35 wt% + C, 5 µm | |
|---|---|---|---|---|---|---|---|
| Before adherence test with removable marker pen (sheet surface) |  |  |  |  |  |  |  |
| After adherence test with removable marker pen (sheet surface) |  |  |  |  |  |  |  |
| After adherence test with removable marker pen (removed adhesive tape) |  |  |  |  |  |  |  |
| Stone Paper | %Xc | Td | E | TS | θ/Water | θ/Printing Ink | Printing Test | Adhesion Using Permanent Marker | |
|---|---|---|---|---|---|---|---|---|---|
| Sheets | |||||||||
| Sand/polymer composite sheets prepared from 25 µm sand particles | 20 wt% | ||||||||
| 35 wt% |  | ||||||||
| 50 wt% | | ||||||||
| 20 wt% + C | |||||||||
| 35 wt% + C | |||||||||
| 50 wt% + C | | | |||||||
| Sand/polymer composite sheets prepared from 5 µm sand particles | 20 wt% | | |||||||
| 35 wt% | | ||||||||
| 50 wt% | |||||||||
| 20 wt% + C | | ||||||||
| 35 wt% + C | | ||||||||
| 50 wt% + C |
Publisher’s Note: MDPI stays neutral with regard to jurisdictional claims in published maps and institutional affiliations. |
© 2022 by the authors. Licensee MDPI, Basel, Switzerland. This article is an open access article distributed under the terms and conditions of the Creative Commons Attribution (CC BY) license (https://creativecommons.org/licenses/by/4.0/).
Share and Cite
Siraj, S.; Al-Marzouqi, A.H.; Iqbal, M.Z. Development and Mechano-Chemical Characterization of Polymer Composite Sheets Filled with Silica Microparticles with Potential in Printing Industry. Polymers 2022, 14, 3351. https://doi.org/10.3390/polym14163351
Siraj S, Al-Marzouqi AH, Iqbal MZ. Development and Mechano-Chemical Characterization of Polymer Composite Sheets Filled with Silica Microparticles with Potential in Printing Industry. Polymers. 2022; 14(16):3351. https://doi.org/10.3390/polym14163351
Chicago/Turabian StyleSiraj, Sidra, Ali H. Al-Marzouqi, and Muhammad Z. Iqbal. 2022. "Development and Mechano-Chemical Characterization of Polymer Composite Sheets Filled with Silica Microparticles with Potential in Printing Industry" Polymers 14, no. 16: 3351. https://doi.org/10.3390/polym14163351